Target Corporation Financial Valuation
21
TARGET Financial Valuation
-
Upload
luis-gaitan -
Category
Economy & Finance
-
view
427 -
download
0
Transcript of Target Corporation Financial Valuation
/Users/dianacolgrove/Desktop/50.png
TARGET
Financial Valuation
Overview
Background
Comparables
Pro Formas
Sensitivity Analysis
Conclusion & Recommendation

Background
Started as Dayton Dry Goods: 1902First Target store 1962“Tar-Zhay”Target.direct366,000 Worldwide Team Members
Massive Data Breach

CEO Tenure
(Source: Wall Street Journal)
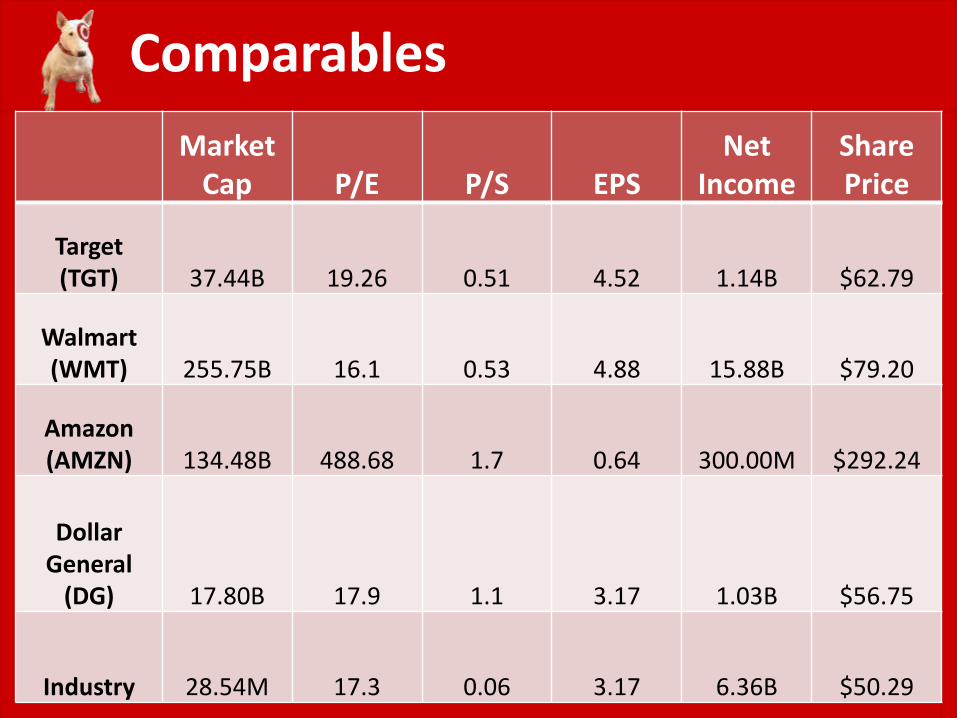
Comparables
Market Cap P/E P/S EPS
Net Income
Share Price
Target (TGT) 37.44B 19.26 0.51 4.52 1.14B $62.79
Walmart (WMT) 255.75B 16.1 0.53 4.88 15.88B $79.20
Amazon (AMZN) 134.48B 488.68 1.7 0.64 300.00M $292.24
Dollar General
(DG) 17.80B 17.9 1.1 3.17 1.03B $56.75
Industry 28.54M 17.3 0.06 3.17 6.36B $50.29
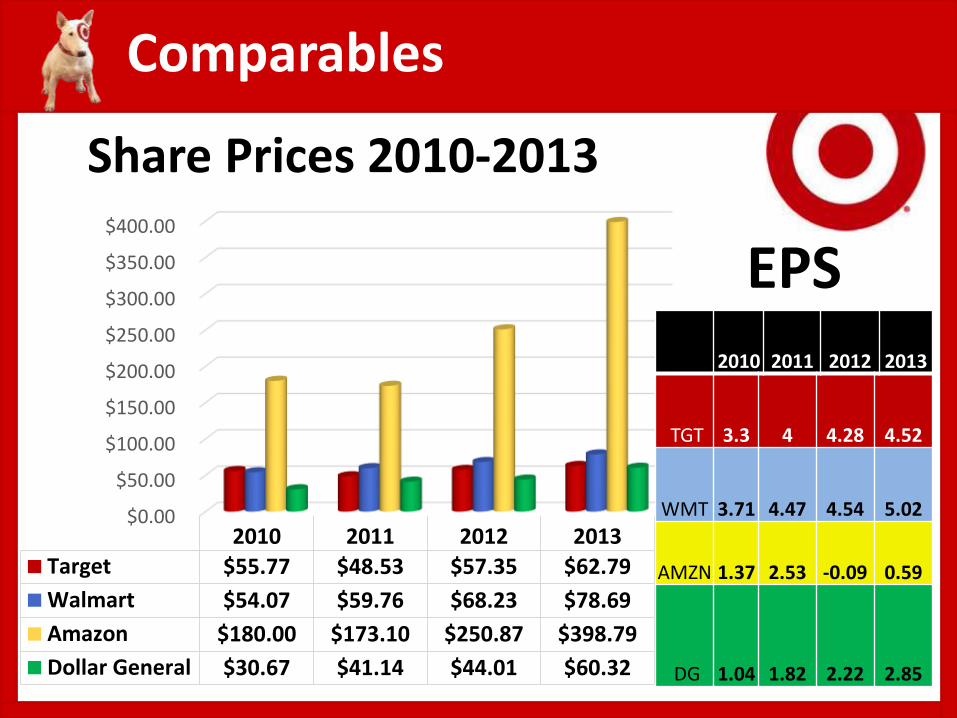
Comparables
$0.00
$50.00
$100.00
$150.00
$200.00
$250.00
$300.00
$350.00
$400.00
2010 2011 2012 2013Target $55.77 $48.53 $57.35 $62.79
Walmart $54.07 $59.76 $68.23 $78.69
Amazon $180.00 $173.10 $250.87 $398.79
Dollar General $30.67 $41.14 $44.01 $60.32
Share Prices 2010-2013
2010 2011 2012 2013
TGT 3.3 4 4.28 4.52
WMT 3.71 4.47 4.54 5.02
AMZN 1.37 2.53 -0.09 0.59
DG 1.04 1.82 2.22 2.85
EPS

Comparables
AMZN
DG
TGT
(Source: EDGAR Online)
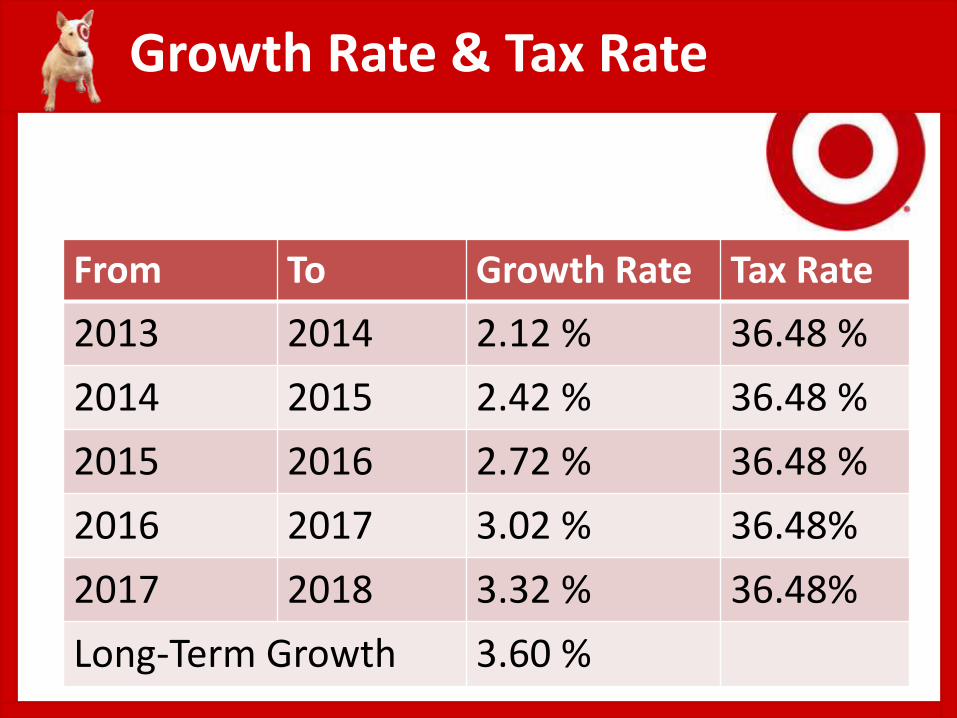
Growth Rate & Tax Rate
From To Growth Rate Tax Rate
2013 2014 2.12 % 36.48 %
2014 2015 2.42 % 36.48 %
2015 2016 2.72 % 36.48 %
2016 2017 3.02 % 36.48%
2017 2018 3.32 % 36.48%
Long-Term Growth 3.60 %

WACC
Risk-free Interest Rate 3.54 %
Market Return 10.00 %
Market Risk Premium 6.46 %
Beta 0.9
Cost of Equity 9.35 %
Equity 38.83B
Debt 13.78B
Cost of Debt 4.69 %
Tax Rate 36.48 %
WACC 7.68 %
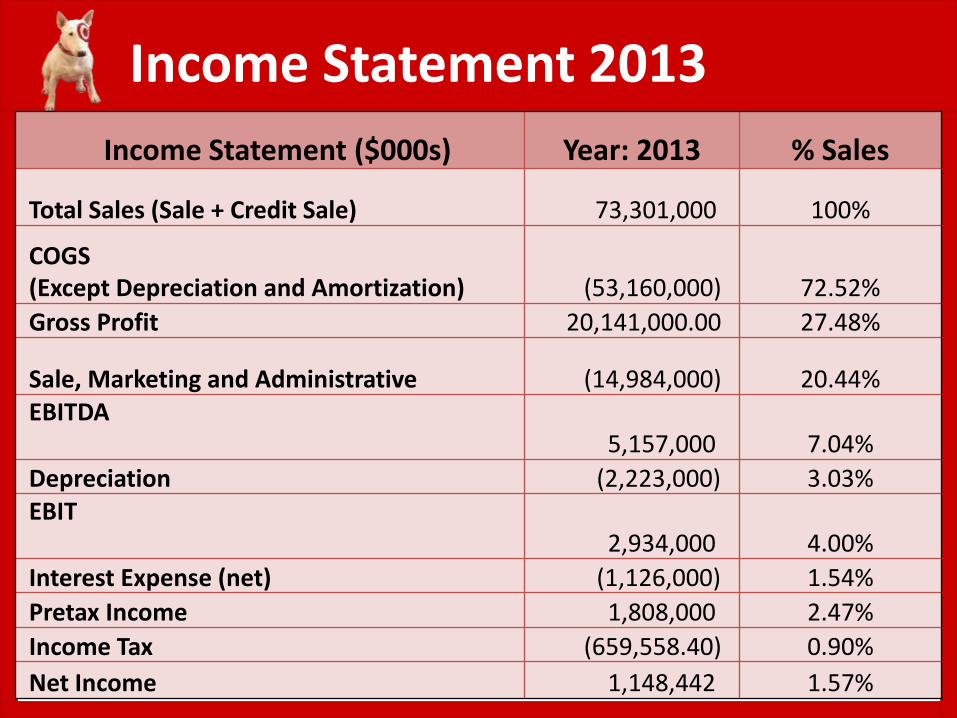
Income Statement 2013
Income Statement ($000s) Year: 2013 % Sales
Total Sales (Sale + Credit Sale) 73,301,000 100%
COGS (Except Depreciation and Amortization) (53,160,000) 72.52%
Gross Profit 20,141,000.00 27.48%
Sale, Marketing and Administrative (14,984,000) 20.44%EBITDA
5,157,000 7.04%
Depreciation (2,223,000) 3.03%EBIT
2,934,000 4.00%
Interest Expense (net) (1,126,000) 1.54%
Pretax Income 1,808,000 2.47%
Income Tax (659,558.40) 0.90%
Net Income 1,148,442 1.57%
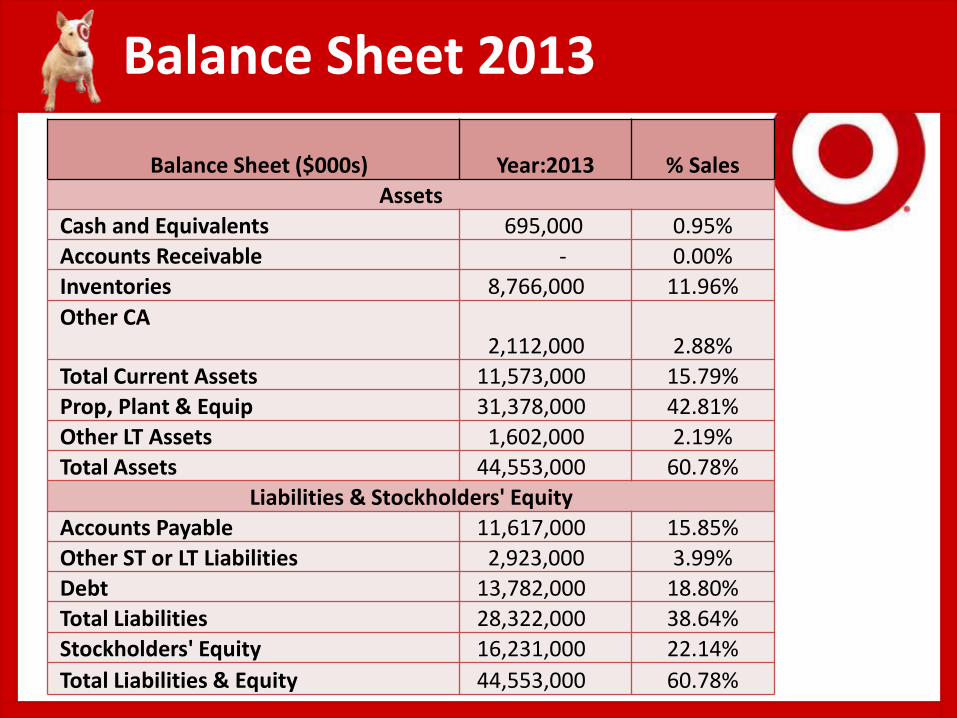
Balance Sheet 2013
Balance Sheet ($000s) Year:2013 % Sales
Assets
Cash and Equivalents 695,000 0.95%
Accounts Receivable - 0.00%
Inventories 8,766,000 11.96%
Other CA2,112,000 2.88%
Total Current Assets 11,573,000 15.79%
Prop, Plant & Equip 31,378,000 42.81%
Other LT Assets 1,602,000 2.19%
Total Assets 44,553,000 60.78%
Liabilities & Stockholders' Equity
Accounts Payable 11,617,000 15.85%
Other ST or LT Liabilities 2,923,000 3.99%
Debt 13,782,000 18.80%
Total Liabilities 28,322,000 38.64%
Stockholders' Equity 16,231,000 22.14%
Total Liabilities & Equity 44,553,000 60.78%

Plug
Year 2013 2014 2015 2016 2017 2018
Total Assets 44,553,000 45,497,524 46,598,564 47,866,045 49,311,599 50,948,744
Total Liab. & Shares before Plug 45,592,670 46,610,798 47,792,136 49,147,361 50,688,998
Plug (95,103) (12,234) 73,909 164,238 259,746
After 45,497,567 46,598,564 47,866,045 49,311,599 50,948,744
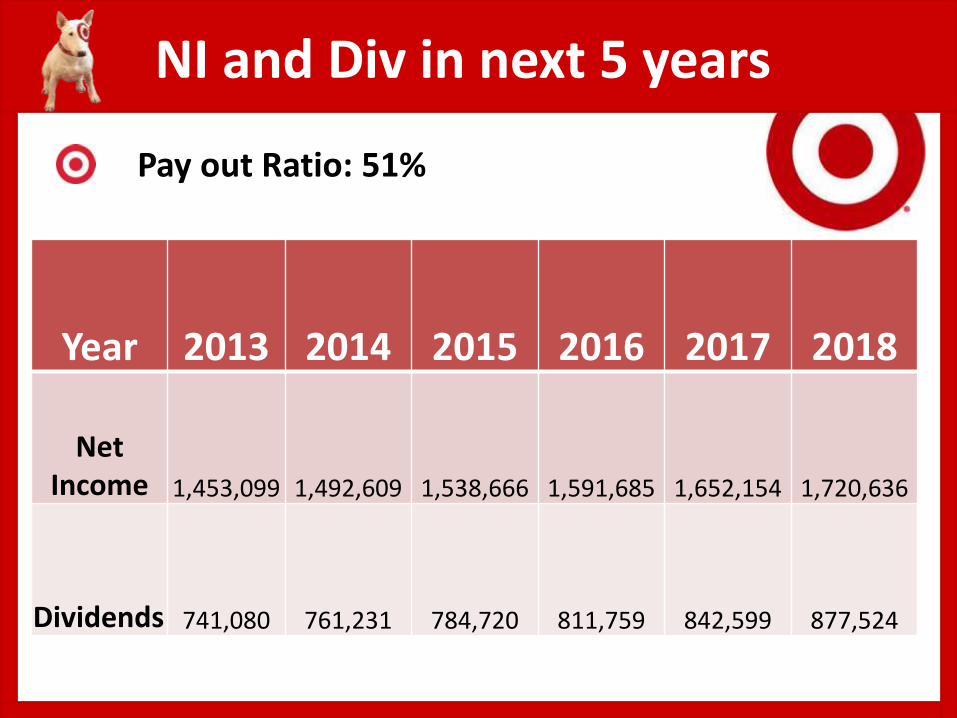
NI and Div in next 5 years
Year 2013 2014 2015 2016 2017 2018
Net Income 1,453,099 1,492,609 1,538,666 1,591,685 1,652,154 1,720,636
Dividends 741,080 761,231 784,720 811,759 842,599 877,524
Pay out Ratio: 51%

FCF & Intrinsic ValueTimeline 0 1 2 3 4 5 6
Year 2013 2014 2015 2016 2017 2018 2019
FCFs 4,901,428 5,123,078 5,367,645 5,637,514 5,935,376 6,149,049
PV of all FCFs $ 125,536,743 Time 0 Cash $ 695,000Time 0 Debt $ 13,782,000Intrinsic Market Cap $ 112,449,743 BilShares Outstanding $ 633,170 Mil Intrinsic Price/Share $ 177.60
Stock Price $ 59.13
% Higher 200%

Sensitivity Analysis
273.62
177.59
88.3
54.32
0
50
100
150
200
250
300
0% 5% 10% 15% 20% 25%
Intrinsic price/Share
Rm WACC Intrinsic Price/Share8% 4.72% 273.62
10% 7.36% 177.59
15% 10.46% 88.3
20% 14.33% 54.32
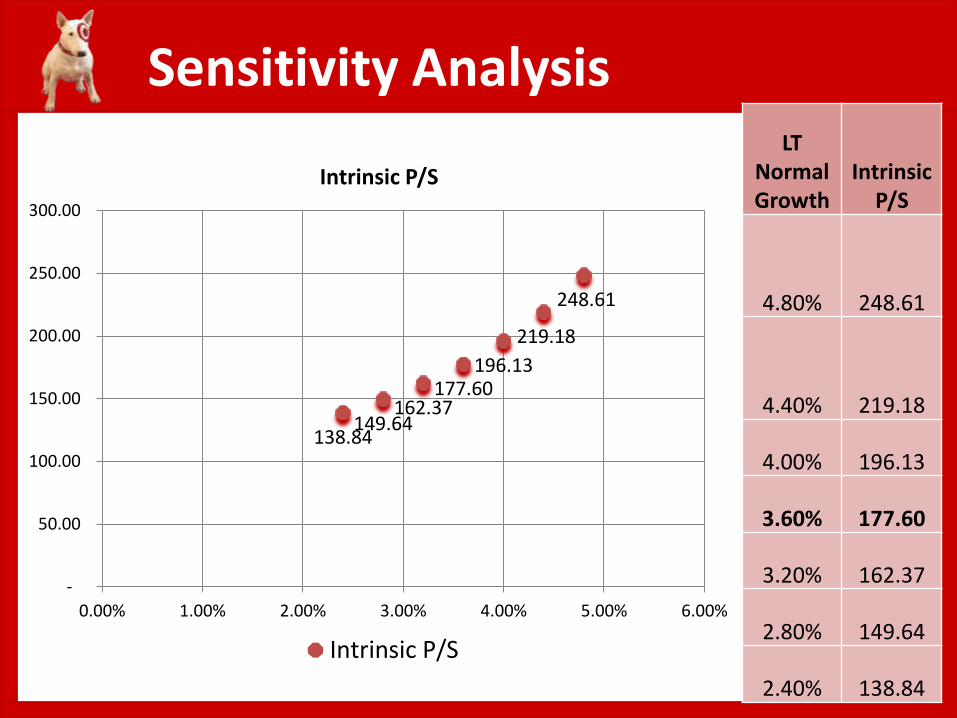
Sensitivity AnalysisLT
Normal Growth
Intrinsic P/S
4.80% 248.61
4.40% 219.18
4.00% 196.13
3.60% 177.60
3.20% 162.37
2.80% 149.64
2.40% 138.84
248.61
219.18
196.13177.60
162.37149.64
138.84
-
50.00
100.00
150.00
200.00
250.00
300.00
0.00% 1.00% 2.00% 3.00% 4.00% 5.00% 6.00%
Intrinsic P/S
Intrinsic P/S

Sensitivity Analysis
Beta WACCIntrinsic
Price/Share1.1 8.64% 139.901.0 8.16% 156.780.9 7.68% 177.600.8 7.21% 203.920.7 8.06% 238.27
273.62
177.59
88.3054.32
0.00
50.00
100.00
150.00
200.00
250.00
300.00
0% 5% 10% 15% 20% 25%
Intrinsic Price/Share
Intrinsic price/Share

Sensitivity Analysis
Years30-year Treasury
yield WACCIntrinsic
Price/Share2000 6.23% 7.88% 168.372010 4.69% 7.77% 173.542014 3.54% 7.68% 177.6
Undervalued
Focus on Online Market
Expand Global Business
Conclusion & Recommendations

Questions?