AUGA GROUP, AB Konstitucijos av. 21C, Quadrum North, LT ...
28
Transcript of AUGA GROUP, AB Konstitucijos av. 21C, Quadrum North, LT ...


AUGA GROUP, AB Konstitucijos av. 21C, Quadrum North, LT-08130, Vilnius, Lithuania CONSOLIDATED INTERIM FINANCIAL STATEMENTS FOR 3 MONTHS PERIOD ENDING 31 MARCH 2021 (All amounts are in EUR thousand, unless stated otherwise)
Consolidated interim financial statements for 3 months period ending 31 March 2021 (unaudited)
1
TABLE OF CONTENTS
I. GENERAL INFORMATION ......................................................................................................................................................... 2 II. MANAGEMENT REPORT ........................................................................................................................................................... 4 III. FINANCIAL STATEMENTS ...................................................................................................................................................... 10
Consolidated balance sheet ....................................................................................................................................................................... 10 Consolidated income statement ................................................................................................................................................................ 11 Consolidated statement of changes in equity ............................................................................................................................................ 12 Consolidated statement of cash flows ....................................................................................................................................................... 13
IV. EXPLANATORY NOTES ........................................................................................................................................................... 14 1. Basis of the preparation ......................................................................................................................................................................... 14 2. Share capital and reserves ..................................................................................................................................................................... 15 3. The structure of the Group .................................................................................................................................................................... 16 4. Property, plant and equipment ............................................................................................................................................................. 20 5. Biological assets ..................................................................................................................................................................................... 21 6. Inventory ................................................................................................................................................................................................ 21 7. Receivables and advance payments ...................................................................................................................................................... 22 8. Financial liabilities .................................................................................................................................................................................. 23 9. Leases .................................................................................................................................................................................................... 24 10. Results of business segments .............................................................................................................................................................. 24 11. Operating expenses ............................................................................................................................................................................. 26 12. Other income ....................................................................................................................................................................................... 26 13. Financial expenses ............................................................................................................................................................................... 26 14. Subsequent events January – May 2021 .............................................................................................................................................. 27
V. CONFIRMATION OF RESPONSIBLE PERSONS ......................................................................................................................... 27

AUGA GROUP, AB Konstitucijos av. 21C, Quadrum North, LT-08130, Vilnius, Lithuania CONSOLIDATED INTERIM FINANCIAL STATEMENTS FOR 3 MONTHS PERIOD ENDING 31 MARCH 2021 (All amounts are in EUR thousand, unless stated otherwise)
Consolidated interim financial statements for 3 months period ending 31 March 2021 (unaudited)
2
I. GENERAL INFORMATION
1.1. Accounting period covered by the report
Consolidated interim report was prepared for the 3 months period ended 31 March 2021.
1.2. Key data on the issuer
Name of the company: AUGA group, AB (hereinafter – AUGA group, AB or the Company)
Share capital: EUR 65,950,713.08
Address of head office: Konstitucijos av. 21C, Quadrum North, LT-08130, Vilnius, Lithuania
Telephone: +370 5 233 53 40
Fax: +370 5 233 53 45
E-mail address: [email protected]
Website: www.auga.lt
Legal entity form: Joint stock company
Place and date of registration: 25 June 2003, Vilnius
Register code: 126264360
Registrant of the Register of Legal entities: VĮ Registrų centras
1.3. Main lines of business of the Group
Operations area: Organic agriculture Main operating segments: Grain growing and sale, milk production and sale, mushroom growing and sale, fast moving
consumer goods production and sale.
1.4. The structure of the Group
As of 31 March 2021, the consolidated Group (hereinafter the Group) consists of the Company and 137 subsidiaries (31 December 2020: 137 subsidiaries). Please refer to the financial statements note 3 for a detailed list of the Group companies.
1.5. Agreements with the mediators of securities public circulation
The Company and FMĮ Orion Securities UAB (A. Tumėno st. 4, B building, LT-01109 Vilnius) signed an agreement regarding handling of Shareholders accounts.
1.6. Data about securities traded on regulated markets
The securities of the Company are included in Main List of NASDAQ Vilnius stock exchange (symbol: AUG1L).
Type of shares Number of shares Share nominal value (in EUR) Total share capital (in EUR) Issue Code ISIN
Ordinary registered shares 227,416,252 0.29 65,950,713.08 LT0000127466
The securities of the Company are also traded in Warsaw stock exchange. Information about the Company’s shares trading on the NASDAQ Vilnius:
Reporting period Price, EUR Total turnover
Average Open High Low Last Units EUR, million
2021 I quarter 0.441 0.444 0.452 0.426 0.440 1,674,332 0.738

AUGA GROUP, AB Konstitucijos av. 21C, Quadrum North, LT-08130, Vilnius, Lithuania CONSOLIDATED INTERIM FINANCIAL STATEMENTS FOR 3 MONTHS PERIOD ENDING 31 MARCH 2021 (All amounts are in EUR thousand, unless stated otherwise)
Consolidated interim financial statements for 3 months period ending 31 March 2021 (unaudited)
3
AUGA group, AB shares volume, share price and OMX Baltic Benchmark index variance for the period of 1 January 2019 to 31 March 2021.
Source: NASDAQ Vilnius stock exchange
1.7. Information on non-financial reporting
The Company does not prepare interim non-financial reporting information. Annual Sustainability report of the Company for the year 2020 is provided in the Group’s consolidated annual report for the year ending 31 December 2020.
1.8. Significant post balance sheet events
Post balance sheet events are disclosed in the consolidated financial statements of the Group for the 3 months period ending 31 March 2021. See financial statements’ note 14 for more details.
0
0,1
0,2
0,3
0,4
0,5
0,6
2 1630132713271026132711261024 7 21 4 18 2 163013271130152912261125 8 241126 9 23 8 22 5 19 2 163014281125 9 231226 9 23 9 23
Jan Feb Mar Apr May Jun Jul Aug Sep Oct Nov Dec Jan Feb Mar Apr May Jun Jul Aug Sep Oct Nov Dec Jan Feb Mar
2019 2020 2021
0
100 000
200 000
300 000
400 000
500 000
600 000
700 000
800 000
VOLUME (UNITS)PRICE (EUR)
Shares volume Share price OMX Baltic Benchmark GI

AUGA GROUP, AB Konstitucijos av. 21C, Quadrum North, LT-08130, Vilnius, Lithuania CONSOLIDATED INTERIM FINANCIAL STATEMENTS FOR 3 MONTHS PERIOD ENDING 31 MARCH 2021 (All amounts are in EUR thousand, unless stated otherwise)
Consolidated interim financial statements for 3 months period ending 31 March 2021 (unaudited)
4
II. MANAGEMENT REPORT
2.1. Overall results
AUGA group, AB and its subsidiaries demonstrated strong financial results, improving both revenue and profitability. The aggregate sales of AUGA group AB amounted to EUR 19.48 million in the first quarter of 2021, representing a 14% increase on the same period last year, when aggregate sales were EUR 17.04 million. During the first 3 months of 2021, the gross profit of the Group amounted to EUR 4.51 million. This marks a 21% rise on the year's equivalent period before when aggregate gross profit was EUR 3.74 million. In 2021, the Group earned a EUR 0.67 million net profit, compared to EUR 0.18 million a year earlier. In 2021, the Group's EBITDA amounted to EUR 5.74 million, representing a 16% uplift compared to the previous year, when EBITDA was EUR 4.95 million.
Main financial results, EUR million 3 months of 2021 3 months of 2020 3 months of 2019 Variance
2021/2020, % Variance
2020/2019, %
Revenues 19.48 17.04 14.89 +14% +14%
Gross profit (loss) 4.51 3.74 2.95 +21% +27%
Gross profit margin 23% 22% 20% +6% +11%
Net profit (loss) 0.67 0.18 0.17 +280% +6%
Net profit margin 3% 1% 1% +232% -10%
EBITDA 5.74 4.95 4.58 +16% +8%
EBITDA margin 29% 29% 31% +1% -6%
2.2. Crop growing segment overview
Results of crop growing segment consist of crop harvest fair value, sales of the previous and current year harvest and agricultural subsidies. Harvest in the season of 2020/2021 The total cultivated land area by the Group amounts to 39.2 thousand hectares (ha) in the 2020/2021 season and is slightly less than the cultivated area in the 2019/2020 season. In the 2020/2021 season, 31.7 thousand ha is seeded with cash crops (30.6 thousand in the 2019/2020 season) out of which 10.0 thousand ha is dedicated to wheat, 7.9 thousand ha to legumes and 13.8 thousand ha to other cash crops. The majority – 9.6 thousand ha out of total 10.0 thousand ha – of wheat was winter wheat, which is a similar proportion to the season of 2019/2020 as winter crops usually have higher yield potential compared to summer alternatives. Forage crops comprises 6.7 thousand ha in the 2020/2021 season compared to 8.2 thousand ha in the 2019/2020 season.
At the end of each quarter the Group evaluates the fair value of crops which have not yet been harvested. The Group estimated the total fair value of crops as of 31 March 2021 using following formula and assumptions: Fair value of the crop = Costs incurred + (Cultivated area in ha * forecasted average yield as tonnes per ha * forecasted grain price per tonne – cultivated area in ha * forecasted total cost per ha) * T * (1 - x), where:
• Cost incurred is cost actually incurred for particular crop during the season of 2020/2021.
• Cultivated area in ha is the area of particular crop seeded and expected to be harvested.
• Forecasted average yield in tonnes per ha is the expected yield for a particular crop based on the previous season’s results.
• Forecasted grain price per tonne – average sales prices in contracts for the 2020/2021 season harvest. If no contracts are signed, the price for the 2019/2020 season harvest is used in the estimation adjusted according to the developments in the market.
• Forecasted total cost per ha. The current level of accumulated costs adjusted by average historical cost levels of 2019 - 2020 were used for fair value estimation. It is expected that costs will remain at a similar level as that recorded in the previous periods.
11,5
8,09,1 8,9
11,9
9,0 9,7 8,2
10,0
7,9
13,8
6,7
0
5
10
15
Wheat Legumes Other cash crops Forage Crops
HA
'00
0
Cultivated land area, thousand ha
2018/2019 2019/2020 2020/2021

AUGA GROUP, AB Konstitucijos av. 21C, Quadrum North, LT-08130, Vilnius, Lithuania CONSOLIDATED INTERIM FINANCIAL STATEMENTS FOR 3 MONTHS PERIOD ENDING 31 MARCH 2021 (All amounts are in EUR thousand, unless stated otherwise)
Consolidated interim financial statements for 3 months period ending 31 March 2021 (unaudited)
5
• T is the portion of time that has already passed from sowing date until the forecasted harvest date expressed as a percentage. As of 31 March 2021, the average completion percentage estimated was around 66% depending on the crop.
• X is an adjustment parameter for possible unexpected negative effects to the harvest. 20% was used in fair value estimations as of 31 March 2021.
The formula discussed above will be used to estimate fair value of cash crops (winter and summer crops) for coming quarters as well until the actual harvest will be completed. In each quarterly estimation forecasted parameters will be adjusted if needed or actual data if already available will be used. It should be noted that the fair value of forage crop even at its point of harvest is measured at production cost incurred on forage crop. In other words, forage crop production cost is used as a measure of the fair value of that forage crop since there is no active market for forage crops and there is no reliable data to calculate market price of the forage crops. Due to this the net result on revaluation of forage crops is equal to zero. Weather conditions in the fall of 2020 were good for sowing and other preparatory land works for the season of 2020/2021. As a result, seeding and land preparation works for winter cash crops to be harvested in the season of 2020/2021 were completed on time. In 2020, the Group sowed around 15.99 thousand ha of cash crops – winter wheat, winter rye, winter rapeseed and seed clover - which will be harvested in 2021. For comparison, in the 2019/2020 season around 14.5 thousand ha of winter cash crops were sown in the autumn of 2019. As of 31 March 2021 summer cash crops’ seeding was still in process and no significant biological transformation was present as of 31 March 2021. Therefore, the production costs of these crops were used as a fair value indicator. Due to the increased area of winter crops and rising market prices, fair value of crops has increased compared to 2020. As of 31 March 2021, the Group recognized a EUR 3.61 million gain on the initial recognition of biological assets at fair value for winter crops and seed clover. It should be noted that as of 31 December 2020 Group recognised gain of EUR 2.02 million on the initial recognition of biological assets at fair value for the 2020/2021 season’s crops. Thus, gain on the initial recognition of biological assets at fair value accounted for in the first quarter of 2021 amounts to EUR 1.59 million.
Crops value, EUR million 3 months of 2021 3 months of 2020 3 months of 2019 Variance
2021/2020, % Variance
2020/2019, %
Gain (loss) on revaluation of biological assets at fair value recognised in previous period
2.02 1.45 -
+39% n/a
Gain (loss) on revaluation of biological assets at fair value recognised in current period
1.59 1.27 1.34
+25% -5%
Total gain (loss) on revaluation of biological assets at fair value
3.61 2.72 1.34
+33% +103%
Crop growing segment sales results Total revenue generated from sales in the crop growing segment amounted to EUR 7.53 million in 2021. This is a 41% rise in revenue compared to 2020, when sales revenue was EUR 5.36 million. As of 31 March 2021, around 99% of 2019/2020 season harvest was contracted out of which 93% were sold and delivered to the clients. Group’s sales during the 3 months of 2021 increased due to larger quantities sold as the harvest quantities are increasing year-on-year.
Crop growing segment results, EUR million 3 months of 2021 3 months of 2020 3 months of 2019 Variance
2021/2020, % Variance
2020/2019, %
Sales revenue 7.53 5.36 5.01 +41% +7%
Cost of sales 8.00 5.32 5.01 +50% +6%
Inventory write-offs 0.08 0.24 0.25 -68% -2%
Result of sales of agricultural produce (0.54) (0.20) (0.25) -172% +20%
The crop growing segment’s sales cost for the 3 months of 2021 amounted to EUR 8.00 million versus EUR 5.32 million in 2020. The increase in cost of sales in the first 3 months of 2021 were impacted by one-off event – additional drying and cleaning cost of clover seeds (EUR 0.42 million). If respective one-off costs were eliminated, sales revenue increased in the same pace as sales cost. Total agricultural produce inventory write-offs and impairment during the 3 months of 2021 amounted to EUR 0.08 million compared to EUR 0.24 million during the 3 months of 2020. Additional cost incurred for seeds production contributed to the increased loss of the agricultural produce sales which amounted to EUR 0.54 million for the first 3 months of 2021. If one-off cost related with seeds production was eliminated, the result of agricultural produce sales improved by EUR 0.07 million compared to previous period.

AUGA GROUP, AB Konstitucijos av. 21C, Quadrum North, LT-08130, Vilnius, Lithuania CONSOLIDATED INTERIM FINANCIAL STATEMENTS FOR 3 MONTHS PERIOD ENDING 31 MARCH 2021 (All amounts are in EUR thousand, unless stated otherwise)
Consolidated interim financial statements for 3 months period ending 31 March 2021 (unaudited)
6
Agricultural subsidies and gross profit of the crop growing segment The total amount of agricultural subsidies accrued for 3 months of 2021 was EUR 2.38 million compared to EUR 1.89 million during the same period in 2020. Accrued subsidies amount is based on preliminary calculations according to available subsidising programmes regulations for 2021. Increase in subsidies amount in 2021 is mainly related with increased amount of organic subsidies. Due to changes in subsidizing programme the Group will be entitled to receive organic subsidies for all organic crops declared while in previous year the Group received organic subsidies only for part of its crops.
In 2021, gross profit from the crop growing segment, encompassing the results of agricultural produce sales, gain (loss) on changes in fair value of biological assets and agricultural subsidies amounted to EUR 3.43 million. This demonstrated a 16% uplift compared to a gross profit of EUR 2.96 million in 2020. The gain on the initial recognition of biological assets at fair value recognized in 2021 increased by 25% comparing to previous period.
Gross profit of crop growing segment, EUR million 3 months of 2021
3 months of 2020
3 months of 2019
Variance
2021/2020, % Variance
2020/2019, %
Gain (loss) on revaluation of biological assets at fair value recognised in reporting period
1.59 1.27 1.34 +25% -5%
Result of sales of agricultural produce (0.54) (0.20) (0.25) -172% +20%
Subsidies 2.38 1.89 1.76 +26% +8%
Gross profit 3.43 2.96 2.85 +16% +4%
2.3. Dairy segment overview
Milk segment results were lower than expected as the desired impact of changes in feeds structure was not achieved in the first quarter of 2021. However, the Group will continue to pursue its planned agenda to increase efficiency and achieve better results in this segment. As planned, the Group is increasing the number of cows it has and plans to reach 3.6 thousand in 2021.
Total sales revenue of the dairy segment amounted to EUR 3.28 million in 2021. This compares to total sales of EUR 3.49 million in 2020 and represents a 6% decrease. The decreased volume of milk sold, is a result of decreased milk yields per cow. The total quantity of milk sold decreased by 5% - from 6.55 thousand tonnes (or 21.77 kg per cow per day) in the 3 months of 2020 to 6.19 thousand tonnes (or 21.39 kg per cow per day) in the 3 months of 2021.
The Group’s organic milk price remained similar to previous year and in the 3 months of 2021 was EUR 407 per tonne. In the 3 months of 2021 the average price of milk sold was around EUR 406 per tonne or 2.2% higher comparing to the same period last year when it was EUR 397 per tonne. Average milk price increased due to the larger share of organic milk sold. The share of milk sold at organic production prices reached 98% in the 3 months of 2021 compared to 86% during the same period in 2020. As can be seen from the graph below, the share of milk sold at organic prices has been steadily growing from the beginning of 2019 and there have been no significant fluctuations in the share of organic milk sold.
The dairy segment’s cost of sales amounted to EUR 3.26 million during the 3 months of 2021 compared to EUR 3.19 million during the same period last year (2% increase). The cost of milk increased due to changes in feeds structure. During the 3 months of 2021, a loss of EUR 0.55 million was incurred on the revaluation of biological assets (animal herd). In comparison, a EUR 0.70 million loss was incurred during the same period a year earlier. The Group is seeking to increase milk yields per cow, which would result in increased production quantities and reduced costs. In order to achieve higher milk yields and the quality of cow herd in general, aged and not productive cows are substituted with younger heifers. Write-offs of aged cows increased loss from revaluation of biological assets. The substitution began in 2020 and will continue throughout 2021. Despite the reduced milk output due to lower milk yields and increase in milk production cost, gross result of the dairy segment improved compared to the previous year. Lower biological assets revaluation cost and increased amount of organic subsidies for all declared land plot improved dairy segment results. In the 3-month period of 2021, gross profit for the dairy segment amounted to EUR 0.21 million, compared to a EUR 0.09 million gross profit in 2020.
0%
20%
40%
60%
80%
100%
Jan Feb Mar Apr May Jun Jul Aug Sep Oct Nov Dec Jan Feb Mar Apr May Jun Jul Aug Sep Oct Nov Dec Jan Feb Mar
2019 2020 2021
Share of organic milk sold, %

AUGA GROUP, AB Konstitucijos av. 21C, Quadrum North, LT-08130, Vilnius, Lithuania CONSOLIDATED INTERIM FINANCIAL STATEMENTS FOR 3 MONTHS PERIOD ENDING 31 MARCH 2021 (All amounts are in EUR thousand, unless stated otherwise)
Consolidated interim financial statements for 3 months period ending 31 March 2021 (unaudited)
7
3 months of 2021
3 months of 2020
3 months of 2019
Variance
2021/2020, % Variance
2020/2019, %
Total quantity of products sold, t 6,565 6,963 6,413 -5% +5%
Milk, t 6,189 6,549 6,219 -5% +5%
Dairy commodities, t 190 233 29 -19% +698%
Cattle, t 186 181 194 +3% -7%
Revenue, EUR million 3.28 3.49 2.74 -6% +28%
Milk, EUR million 2.51 2.60 2.41 -3% +8%
Dairy commodities, EUR million 0.58 0.72 0.12 -19% +484%
Cattle, EUR million 0.19 0.18 0.21 +9% -14%
Cost of sales, EUR million 3.26 3.19 2.76 +2% +16%
Milk, EUR million 2.51 2.31 2.44 +8% -5%
Dairy commodities, EUR million 0.56 0.70 0.12 -21% +499%
Cattle, EUR million 0.19 0.18 0.21 +9% -14%
Revaluation of biological assets, EUR million (0.55) (0.70) (0.76) +22% +8%
Subsidies, EUR million 0.73 0.50 0.56 +48% -11%
Gross profit, EUR million 0.21 0.09 (0.23) 126% n/a
2.4. Mushroom segment overview
The global pandemic had a tangible impact on mushroom segment. Although results in the first quarter of 2021 were lower than in equivalent period in 2020, the management evaluates the results positively as this segment remains affected by the COVID-19 pandemic at the beginning of 2021, while this impact did not yet exist in the first quarter of 2020. In addition, a greater focus on higher value-added products has led to improved profitability compared to recent quarters of 2020. Overall, the sales in the mushroom growing segment remained similar to the previous year and amounted to EUR 7.26 million during the 3 months of 2021. In the equivalent period in 2020, sales in this segment were EUR 7.28 million. The revenue from mushroom sales grew by EUR 0.42 million while revenue from mushroom seedbed sales decreased by EUR 0.44 million.
During the 3 months of 2021, the share of organic mushrooms decreased and amounted to 6.3% of total mushrooms volume sold, while in previous year share of organic mushrooms was 7.9%.
In the 3 months of 2021, average non-organic and organic mushrooms sales price increased by around 10% compared to the same period in 2020. The average price of 1 tonne of mushrooms sold was 2,246 EUR/tonne in the 3 months of 2021 (2,043 EUR/tonne in the 3 months of 2020). The average mushroom price increased due to larger sales of packaged mushrooms. The sales of seedbed in 2021 have decreased by 78% compared to the previous year. This reduction was due to the closed sales channel to Russia due to the COVID-19 pandemic.
The total cost of sales of the mushroom growing segment amounted to EUR 6.76 million in the 3 months of 2021 and was EUR 0.10 million higher compared to the same period in 2020 when it was EUR 6.66 million. The average cost of 1 tonne of mushrooms sold increased from 1,876 EUR/tonne to 2,103 EUR/tonne. Cost of mushrooms mainly increased due to higher sales of packaged mushrooms.
According to the Group's data, the gross profit of the segment for the 3-month period of 2021 amounted to EUR 0.50 million, demonstrating a 20% fall on the same period last year, when the gross profit of the segment was EUR 0.62 million. The decrease in gross profit is mainly related to market volatility and increased costs in the current environment caused by the global pandemic. In addition, it should be noted that first quarter of 2020 results were significantly better than in other quarters of 2020 as global pandemic started in March of 2020.
AUGA GROUP, AB Konstitucijos av. 21C, Quadrum North, LT-08130, Vilnius, Lithuania CONSOLIDATED INTERIM FINANCIAL STATEMENTS FOR 3 MONTHS PERIOD ENDING 31 MARCH 2021 (All amounts are in EUR thousand, unless stated otherwise)
Consolidated interim financial statements for 3 months period ending 31 March 2021 (unaudited)
8
3 months of
2021 3 months of
2020 3 months of
2019 Variance
2021/2020, % Variance
2020/2019, %
Sold mushrooms, t 3,177 3,288 2,877 -3% +14%
Average price (Eur/t) 2,246 2,043 2,075 +10% -2%
Total revenue, EUR million 7.26 7.28 6.64 0% +10%
Mushroom sales revenue, EUR million 7.14 6.72 5.97 +6% +13%
Compost sales revenue, EUR million 0.12 0.56 0.67 -78% -15%
Cost of sale, EUR million 6.76 6.66 6.35 +2% +5%
Cost of mushrooms sold, EUR million 6.68 6.17 5.72 +8% +8%
Cost of compost sold, EUR million 0.08 0.49 0.63 -83% -22%
Gross profit, EUR million 0.50 0.62 0.29 -20% +118%
2.5. Fast moving consumer goods (FMCG) segment
The segment is strategically important to the Group and it continues to demonstrate significant growth. Total sales in the segment amounted to EUR 1.42 million in the first quarter of 2021. In the equivalent period last year, sales in the FMCG segment were EUR 0.91 million. Cost of sales were EUR 1.04 million for the 3 months of 2021 compared to EUR 0.85 million for the same period in 2020. Increasing business volumes have a positive impact on profitability. During the first 3 months of 2021, the FMCG segment’s gross profit jumped to EUR 0.38 million. During the same period in 2020, gross profit amounted to EUR 0.06 million.
FMCG segment results, EUR million 3 months of
2021 3 months of
2020 3 months of
2019
Variance 2021/2020, %
Variance 2020/2019, %
Sales revenue 1.42 0.91 0.51 +56% +79%
Cost of goods sold 1.04 0.85 0.47 +23% +82%
Gross profit 0.38 0.06 0.04 +545% +36%
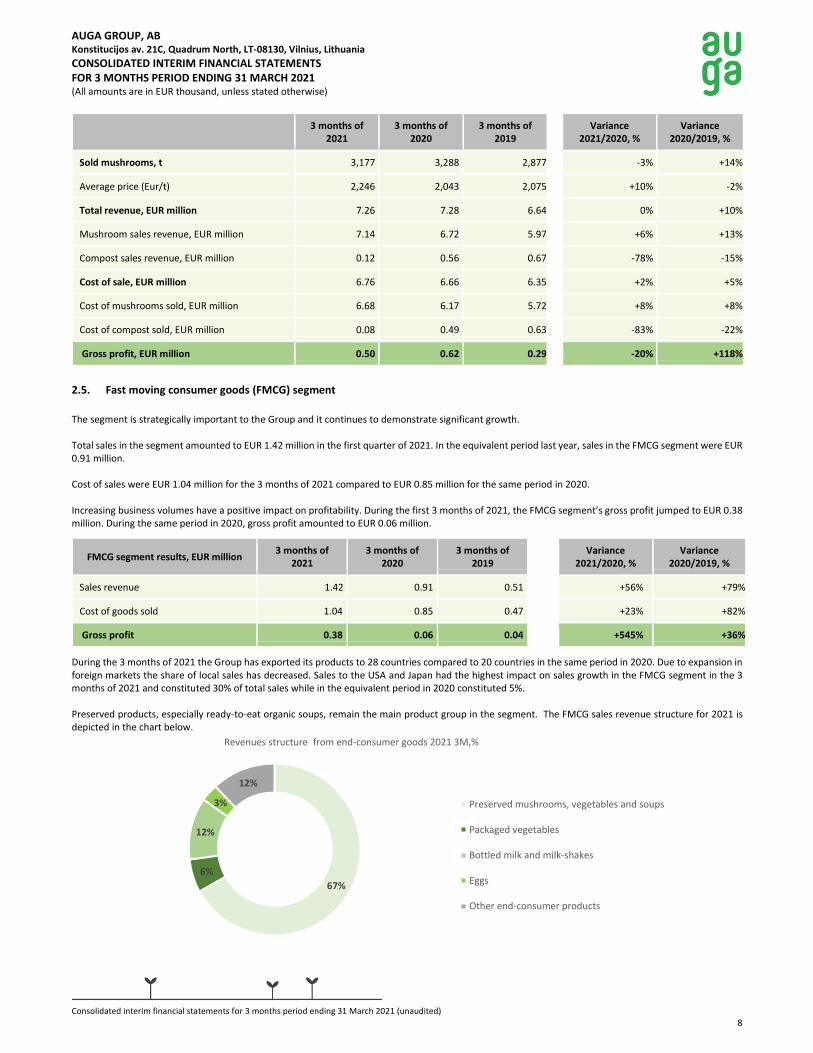
During the 3 months of 2021 the Group has exported its products to 28 countries compared to 20 countries in the same period in 2020. Due to expansion in foreign markets the share of local sales has decreased. Sales to the USA and Japan had the highest impact on sales growth in the FMCG segment in the 3 months of 2021 and constituted 30% of total sales while in the equivalent period in 2020 constituted 5%. Preserved products, especially ready-to-eat organic soups, remain the main product group in the segment. The FMCG sales revenue structure for 2021 is depicted in the chart below.
67%
6%
12%
3%
12%
Revenues structure from end-consumer goods 2021 3M,%
Preserved mushrooms, vegetables and soups
Packaged vegetables
Bottled milk and milk-shakes
Eggs
Other end-consumer products

AUGA GROUP, AB Konstitucijos av. 21C, Quadrum North, LT-08130, Vilnius, Lithuania CONSOLIDATED INTERIM FINANCIAL STATEMENTS FOR 3 MONTHS PERIOD ENDING 31 MARCH 2021 (All amounts are in EUR thousand, unless stated otherwise)
Consolidated interim financial statements for 3 months period ending 31 March 2021 (unaudited)
9
2.6. Operating expenses
The Group's operating expenses during 2021 amounted to EUR 2.53 million compared to EUR 2.25 million in the same period last year. The increase is mostly related to the increased salaries, office administration and selling expenses. Additionally, operating expenses of Grybai LT, KB is represented in 2021, but not included in the comparative period as the respective entity was included in the consolidated financial statements as of 1 June 2020.
2.7. COVID-19 pandemic effect
In light of the COVID-19 pandemic’s effects on the business environment, measures have been taken to address the most significant coronavirus-related risks throughout the Group’s key business units, namely crop growing, dairy production, mushroom growing and fast-moving consumer goods (FMCG). Additional measures have been taken to ensure the safety of the Group’s employees and the continuation of its daily activities. With additional measures applied, all Group companies are operating at the required capacities. At the market level, agricultural production companies stood out as some of the least affected by the crisis, given the nature of their produce and increased demand from households. However, prolonged restrictions eventually impact all businesses and especially mushroom segment was somewhat affected by pandemic caused changes in the market. Crop growing The Company’s management did not see any significant changes in the crop market. If the pandemic continues and the Group would face a labour shortage due to high numbers of infected or quarantined persons this risk may be mitigated via temporary employment, as was successfully done in 2020. Dairy Milk production has been running at regular capacity and there were no problems with product demand. The management is not seeing at present nor does it forecast a decrease of demand in this segment. However, the risk of labour shortage remains, if the numbers of infected or quarantined persons were to rise dramatically. If this scenario occurs, the Group is ready to mitigate this risk with temporary employment, as was done in 2020. Mushroom growing The biggest threat in the mushroom growing segment is related to production, given the labour intensity of the production operations. Therefore, the Company has implemented various measures to ensure the safety of employees and to minimize contact among them. The Group could face a shortage of labour if the number of infected or quarantined persons were to increase dramatically. Labour shortages are successfully compensated with temporary employment from the outside and secondment from other companies of the Group. In 2021, several business areas of the segment remain negatively affected by the pandemic due to instability in the market:
• sales to wholesalers working with HoReCa decreased,
• sales of mushroom seedbeds to Russia decreased,
• market volatility increased which made it challenging to sell mushrooms at the best fresh mushroom price.
The Group is looking for new export markets for sales diversification and implements efficiency initiatives to reduce costs. FMCG The growing demand for long shelf-life packaged products (dairy products, soups, etc.) was observed across all markets. In terms of the associated risks in this segment, these are mainly related to possible interruptions in the supply chain of raw materials that the Group cannot produce in-house.

AUGA GROUP, AB Konstitucijos av. 21C, Quadrum North, LT-08130, Vilnius, Lithuania CONSOLIDATED INTERIM FINANCIAL STATEMENTS FOR 3 MONTHS PERIOD ENDING 31 MARCH 2021 (All amounts are in EUR thousand, unless stated otherwise)
Consolidated interim financial statements for 3 months period ending 31 March 2021 (unaudited)
10
III. FINANCIAL STATEMENTS
Consolidated balance sheet
ASSETS Notes 31 March 2021
unaudited 31 December 2020
audited
Non-current assets Property, plant and equipment 4 97,426 97,009 Right-of-use assets 4 34,022 35,543 Intangible assets 3,473 3,477 Long term receivables at amortized cost 7 446 446 Investments accounted for using equity method 57 57 Financial assets at fair value through profit or loss - - Deferred tax asset 1,359 1,359 Biological assets 5 10,092 9,699
Total non-current assets 146,875 147,590
Current assets Biological assets 5 23,321 17,052 Inventory 6 23,404 30,435 Trade receivables advance payments and other receivables 7 19,903 16,084 Cash and cash equivalents 2,582 2,541
Total current assets 69,210 66,112
TOTAL ASSETS 216,085 213,702
EQUITY AND LIABILITIES
Capital and reserves
Share capital 2 65,951 65,951 Share premium 6,707 6,707 Revaluation reserve 9,213 9,213 Legal reserve 1,834 1,834 Reserve to provide shares for employees 2,509 2,509 Retained earnings / (accumulated deficit) 7,014 6,237
Equity attributable to equity holders of the parent 93,228 92,450 Non-controlling interest 355 366
Total equity 93,583 92,816
Non-current liabilities
Borrowings 8 46,475 40,494 Obligations under lease 9 33,880 33,682 Deferred grant income 3,347 3,248 Deferred tax liability 1,483 1,483
Total non-current liabilities 85,185 78,907
Current liabilities
Current portion of non-current borrowings 8 2,662 3,409 Current portion of non-current obligations under lease 9 5,891 7,556 Current borrowings 8 6,850 9,400 Trade payables 16,322 16,335 Other payables and current liabilities 5,593 5,279
Total current liabilities 37,317 41,979 Total liabilities 122,502 120,886
TOTAL EQUITY AND LIABILITIES 216,085 213,702
AUGA GROUP, AB Konstitucijos av. 21C, Quadrum North, LT-08130, Vilnius, Lithuania CONSOLIDATED INTERIM FINANCIAL STATEMENTS FOR 3 MONTHS PERIOD ENDING 31 MARCH 2021 (All amounts are in EUR thousand, unless stated otherwise)
Consolidated interim financial statements for 3 months period ending 31 March 2021 (unaudited)
11
Consolidated income statement
3 months period ending 31 March
Notes 2021 unaudited
2020 unaudited
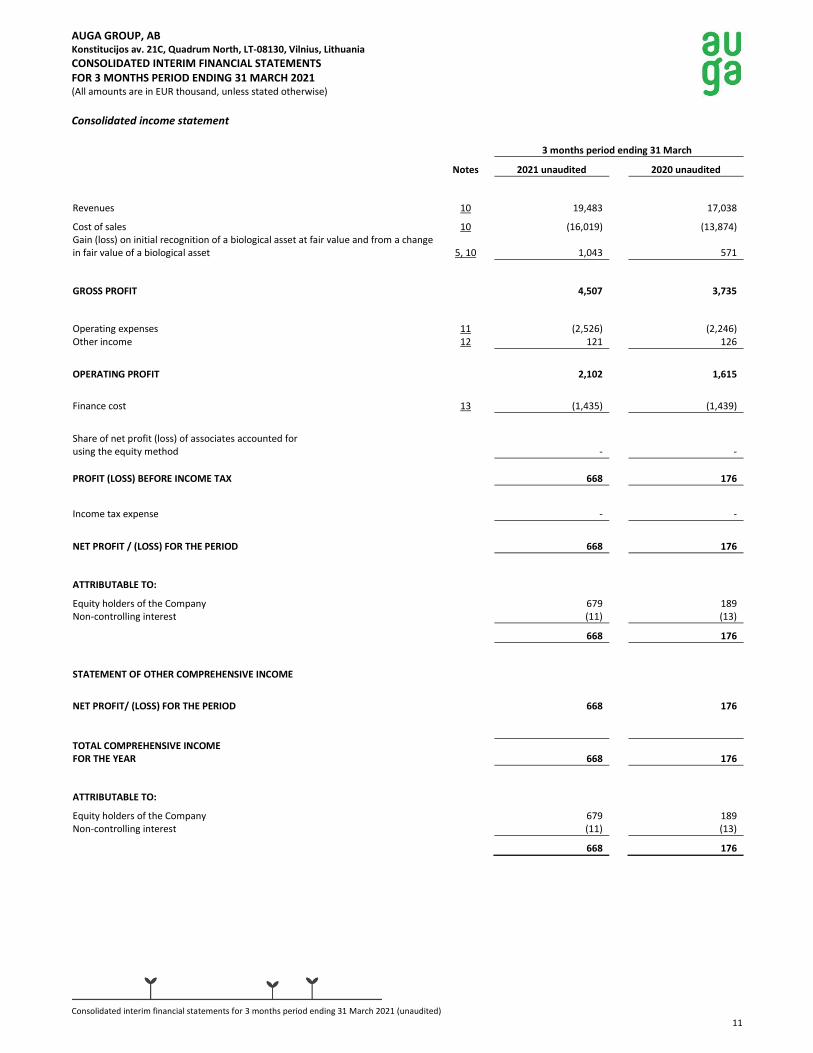
Revenues 10 19,483 17,038
Cost of sales 10 (16,019) (13,874) Gain (loss) on initial recognition of a biological asset at fair value and from a change in fair value of a biological asset 5, 10 1,043 571
GROSS PROFIT 4,507 3,735
Operating expenses 11 (2,526) (2,246) Other income 12 121 126
OPERATING PROFIT 2,102 1,615
Finance cost 13 (1,435) (1,439)
Share of net profit (loss) of associates accounted for using the equity method - -
PROFIT (LOSS) BEFORE INCOME TAX
668 176
Income tax expense - -
NET PROFIT / (LOSS) FOR THE PERIOD 668 176
ATTRIBUTABLE TO:
Equity holders of the Company 679 189 Non-controlling interest (11) (13)
668 176
STATEMENT OF OTHER COMPREHENSIVE INCOME
NET PROFIT/ (LOSS) FOR THE PERIOD 668 176
TOTAL COMPREHENSIVE INCOME FOR THE YEAR 668 176
ATTRIBUTABLE TO:
Equity holders of the Company 679 189 Non-controlling interest (11) (13)
668 176

AUGA GROUP, AB Konstitucijos av. 21C, Quadrum North, LT-08130, Vilnius, Lithuania CONSOLIDATED INTERIM FINANCIAL STATEMENTS FOR 3 MONTHS PERIOD ENDING 31 MARCH 2021 (All amounts are in EUR thousand, unless stated otherwise)
Consolidated interim financial statements for 3 months period ending 31 March 2021 (unaudited)
12
Consolidated statement of changes in equity
Share capital
Revaluation reserve
Currency exchange
differences
Legal reserve
Retained earnings
Equity attributable to the shareholders of
the company
Non-controlling
interest Total
Share premium
Reserve to provide
shares for employees
Balance as of 31 December 2019 (audited) 65,951 6,707 8,488 - 1,624 1,834 5,102 89,706 369 90,075
Comprehensive income
Net profit (loss) for the period - - - - - - 1,772 1,772 20 1,792
Share based payment expenses - - - - - - 247 247 - 247
Other comprehensive income
Revaluation of land, net of tax - - 725 - - - - 725 - 725
Total comprehensive income - - 725 - - - 2,019 2,744 20 2,764
Transactions with shareholders
Transfer to legal reserve - - - - - - - - - - Transfer to reserve to provide shares
for employees - - - - 885 - (885) - - - Dividends granted by subsidiaries to
the non-controlling interest - - - - - - - - (23) (23)
Total transactions with shareholders - - - - 885 - (885) - (23) (23)
Balance as of 31 December 2020 (audited) 65,951 6,707 9,213 - 2,509 1,834 6,237 92,450 366 92,816
Comprehensive income
Net profit (loss) for the period - - - - 679 679 (11) 668
Share based payment expenses - - - - 98 98 - 98
Other comprehensive income - - - -
Revaluation of land (net of tax) - - - -
Total comprehensive income - - - - - - 777 777 (11) 766
Transactions with shareholders
Transfer to legal reserve - - - - - - - - - - Transfer to reserve to provide shares
for employees - - - - - - - - - - Dividends granted by subsidiaries to
the non-controlling interest - - - - - - - - - -
Total transactions with shareholders - - - - - - - - - -
Balance as of 31 March 2021 (unaudited) 65,951 6,707 9,213 - 2,509 1,834 7,014 93,228 355 93,583

AUGA GROUP, AB Konstitucijos av. 21C, Quadrum North, LT-08130, Vilnius, Lithuania CONSOLIDATED INTERIM FINANCIAL STATEMENTS FOR 3 MONTHS PERIOD ENDING 31 MARCH 2021 (All amounts are in EUR thousand, unless stated otherwise)
Consolidated interim financial statements for 3 months period ending 31 March 2021 (unaudited)
13
Consolidated statement of cash flows
3 months period ending 31 March
Notes 2021 unaudited 2020 unaudited
Cash flows from /(to) operating activities
Net profit (loss) before income tax and non-controlling interest 668 176
Adjustments for non-cash expenses (income) items and other adjustments
Depreciation expenses (PP&E) 4 1,820 1,829
Depreciation expenses (ROU* assets) 4 1,522 1,444 Amortization expenses 3 4 Expenses of share-based payments 11 98 62 Write offs and impairment of PPE - - (Gain) loss on sales of non-current assets (12) (12) (Gain) loss on sale of subsidiaries - - Loss allowance for receivables - - Write-offs of inventory 5,6 303 223 Net finance cost 13 901 790 Net finance cost (IFRS 16) 13 528 564 Loss (gain) on changes in fair value of biological assets 5 (1,043) (571) Grants related to assets, recognized as income (96) (132)
Changes in working capital (Increase) decrease in biological assets (6,544) (6,530) (Increase) decrease in trade receivables and prepayments (3,833) (4,346) (Increase) decrease in inventory 6,728 4,354 (Decrease) increase in trade and other payables (771) 392
Cash flows from operating activities 272 (1,754) Interest paid, netto (527) (416)
Net cash flows from /(to) operating activities (255) (2,170)
Cash flows from /(to) investing activities
Purchase of property, plant and equipment 4 (1,674) (953) Purchase of investments - - Proceeds from sales of investment property, PPE 34 12 Proceeds from sales of investments - - Grants related to assets 195 - Other loans repaid - - Other loans granted 15 -
Net cash flows from/(to) investing activities (1,430) (941)
Cash flows from /(to) financing activities
Bonds - - Repayment of bank borrowings (3,460) (920) Proceeds from borrowings 6,087 4,600 Proceeds (repayments) of other borrowings - (2,814) Finance lease payments (901) (587)
Net cash flows from/(to) financing activities 1,726 279
Net (decrease) / increase in cash and cash equivalents 42 (2,381)
Cash and cash equivalents at the beginning of the period 2,541 3,732
Cash and cash equivalents at the end of the period 2,582 899
ROU assets – Right-of-use assets

AUGA GROUP, AB Konstitucijos av. 21C, Quadrum North, LT-08130, Vilnius, Lithuania CONSOLIDATED INTERIM FINANCIAL STATEMENTS FOR 3 MONTHS PERIOD ENDING 31 MARCH 2021 (All amounts are in EUR thousand, unless stated otherwise)
Consolidated interim financial statements for 3 months period ending 31 March 2021 (unaudited)
14
IV. EXPLANATORY NOTES
1. Basis of the preparation
The accompanying interim financial information for the 3-month period ending 31 March 2021, has been prepared in accordance with IAS 34, ‘Interim financial reporting’. The accounting policies applied are consistent with those of the annual financial statements for the year ending 31 December 2020, as described in those annual financial statements. This financial information should be read in conjunction with the interim financial information for 3-month period ended 31 March 2020 and annual financial statements for the year ending 31 December 2020 which have been prepared in accordance with IFRS as adopted by the EU. The presentation currency is euro (EUR). The financial statements are presented in thousands of euro, unless indicated otherwise. Financial statements for the 3-month period ending 31 March 2021 and 3-month period ending 31 March 2020 are not audited. Financial statements for the year ending 31 December 2020 are audited by the external auditor UAB PriceWaterhouseCoopers. Critical accounting estimates and assumptions The preparation of financial information in conformity with IAS 34 requires the use of certain critical accounting estimates. It also requires management to exercise its judgement in the process of applying the Group’s accounting policies. The areas involving a higher degree of judgement or complexity, or areas where assumptions and estimates are significant to the consolidated financial information, are disclosed below. Critical accounting estimates and assumptions remain the same as disclosed in the audited annual financial statements for period ending 31 December 2020.
IFRS 16, Leases
Based on IFRS 16, the Group recognised lease liabilities in relation to leases which had previously been classified as ‘operating leases’ under the principles of IAS 17 Leases. These liabilities were measured at the present value of the remaining lease payments, discounted using the lessee’s incremental borrowing rate as of 1 January 2019. The weighted average lessee’s incremental borrowing rate applied to the lease liabilities as of 31 December 2020 was 6%. The incremental borrowing remained unchanged in 2021. In applying IFRS 16, the Group has used the following practical expedients permitted by the standard:
• the use of a single discount rate to a portfolio of leases with reasonably similar characteristics; • reliance on previous assessments on whether leases are onerous; • the accounting for operating leases with a remaining lease term of less than 12 months as short-term leases (which were recognized as expense
on a straight-line basis); • the exclusion of initial direct costs for the measurement of the right-of-use asset at the date of initial application; • the use of hindsight in determining the lease term where the contract contains options to extend or terminate the lease.
Revaluation of biological assets (crops)
The Group estimates the total fair value of crops using following formula and assumptions: Fair value of the crop = Costs incurred + (Cultivated area in ha * forecasted average yield as tonnes per ha * forecasted grain price per tonne – cultivated area in ha * forecasted total cost per ha) * T * (1 - x), where:
• Cost incurred is cost actually incurred for particular crop during the season till the reporting date. • Cultivated area in ha is an area of particular crop seeded and expected to be harvested. • Forecasted average yield tonnes per ha. • Forecasted grain price per tonne. contracted average sales prices are used for fair value estimation. • Forecasted total cost per ha. Average historical cost levels are used for fair value estimation. • T is a time portion, spanning from the sowing date to the forecasted harvest date. • X is an adjustment parameter for possible unexpected negative effects to the harvest.
Revaluation of biological assets (livestock)
Due to the specifics of the agricultural market, fair value of milking cows cannot be determined by using comparable market prices method, as such biological assets in areas where the Group operates are not traded on active markets which could enable the use of market value. The Group values cows using the discounted cash flow method. The model uses projected revenues from milk sales over the remaining useful life of each animal using a forecasted milk price. Milk price forecast is the average milk price assumption of the following 3 years was. Current cow herd has an estimated working life of 1 to 3 years. At the end of the working period the cow is estimated to be sold for meat. The forecasted revenues are reduced with costs directly related to herd growing (feeds, medicines, employee salaries and other). The free cash-flow is discounted with post tax WACC. For valuation of other livestock the Group calculates the fair value by taking the average price of meat per kilo. For young bulls and heifers, the value of livestock is determined by using the market values of meat (different for different groups of animals) and multiplying the price of 1 kg by the total weight of specific group of animals.

AUGA GROUP, AB Konstitucijos av. 21C, Quadrum North, LT-08130, Vilnius, Lithuania CONSOLIDATED INTERIM FINANCIAL STATEMENTS FOR 3 MONTHS PERIOD ENDING 31 MARCH 2021 (All amounts are in EUR thousand, unless stated otherwise)
Consolidated interim financial statements for 3 months period ending 31 March 2021 (unaudited)
15
Share-based payments
Total cumulative expenses of share-based payments are calculated based on the formula described below. The expenses are accrued in the profit (loss) statement and equity based on the days lapsed since the grant date till the reporting date. Each year the entity will revise the expense to reflect the best available estimate of the number of equity instruments expected to vest. The total expenses of share-based payments are calculated based on the formula:
Share price @ grant date x Granted shares x (1-annual staff turnover)^(vesting period) Where: The share price of options is based on the closing price at grant date at which the company’s shares are traded on the Nasdaq Stock Exchange. The grant date of the Option is set to be the date of the share-based payment agreement between the Company and the receiver as all the terms and conditions are set in this agreement and there are no other arrangements which would need to be confirmed at a later date. Granted shares – shares to be granted to employee based on the Option agreement. Staff turnover – chance that the option will be exercised is adjusted by the forecasted staff turnover percent during the vesting period. The ratio is calculated based on historical staff turnover data of 2 years. The historical staff turnover data includes turnover only of the positions which are set to receive the share-based payments. The turnover of other positions are excluded from the ratio. There are option agreements which are signed with a special condition – that the receivers do not need to fulfill the service condition, but they will still need to wait 3 years vesting period before being able to exercise the option. Due to this staff turnover adjustment is excluded in the calculation of the expenses of these options as it does not affect their chances to receive the option.
2. Share capital and reserves
Share capital and premium of the Company The share capital of AUGA group AB as of 31 March 2021 was EUR 65,951 thousand (as of 31 December 2020: EUR 65,951 thousand). The share capital is divided into 227,416,252 ordinary shares (2020: 227,416,252 ordinary shares). Each issued share has a EUR 0.29 nominal value and fully paid. Each share had usual material and intangible rights as per Law on Companies of the Republic of Lithuania and the Company’s statutes. Share premium at the end of 31 March 2021 amounted to EUR 6,707 thousand (31 December 2020: EUR 6,707 thousand). Shareholders Total number of shareholders on 31 March 2021 was 1,922 and on 31 December 2020 it was 1,866. The shareholders owning more than 5% of shares in the Company are the following:
31 March 2021 31 December 2020
Entity / person Number of
shares % owned
Number of shares
% owned
Baltic Champs Group UAB (identification code: 145798333; address: Poviliškiai v., Šiauliai region mun., Lithuania)
125,167,939 55.04 125,167,939 55.04
European Bank for Reconstruction and Development (identification code: EBRDGB2LXXXX; address: One Exchange Square, London EC2A 2JN, UK)
19,810,636 8.71 19,810,636 8.71
ME Investicija UAB (identification code: 302489393; address: Račių st. 1, Vilnius, Lithuania) 19,082,801 8.39 19,082,801 8.39
Žilvinas Marcinkevičius 15,919,138 7.00 15,919,138 7.00
Other shareholders 47,435,738 20.86 47,435,738 20.86
Total 227,416,252 100.00 227,416,252 100.00
No shareholder has special voting rights.
Information on the shares of the Company held by the members of the Board and the top executives as of 31 March 2021:
Name, Surname Position Owned shares in the Company, units Owned shares in the Company, %
Kęstutis Juščius* CEO 1,392 0.0006%
Tomas Krakauskas** Member of the Board 119,000 0.052%
Mindaugas Ambrasas CFO 6,881 0.003%
* Kęstutis Juščius, CEO, is the ultimate owner of Baltic Champs Group UAB, controlling 55.04% of the Company’s shares. ** Tomas Krakauskas is an employee of UAB ME Investicijos, which holds 8.39% of the Company’s shares.

AUGA GROUP, AB Konstitucijos av. 21C, Quadrum North, LT-08130, Vilnius, Lithuania CONSOLIDATED INTERIM FINANCIAL STATEMENTS FOR 3 MONTHS PERIOD ENDING 31 MARCH 2021 (All amounts are in EUR thousand, unless stated otherwise)
Consolidated interim financial statements for 3 months period ending 31 March 2021 (unaudited)
16
Reserves of the Company A legal reserve is a compulsory reserve under Lithuanian legislation. Annual transfer of at least 5% of net profit, calculated in accordance with Lithuanian regulatory legislation on accounting, is compulsory until the reserve including share premium reaches 10% of the share capital. The legal reserve can be used to cover the accumulated losses. The legal reserve of the Company equalled to EUR 1,834 thousand as of 31 March 2021 (EUR 1,834 thousand as of 31 December 2020). Revaluation reserve comprises revaluation of land portfolio owned by the Group. Land portfolio valuation is performed by independent valuator. The valuation for reporting period was performed in 2020. Revaluation reserve as of 31 March 2021 amounted to EUR 9,213 thousand (EUR 9,213 thousand as of 31 December 2020). In 2018 the Company formed a reserve to grant shares for employees. Transfers to this reserve is performed annually when the board approves issue of additional shares options. Reserve to grant shares for employees as of 31 March 2021 amounted to EUR 2,509 thousand (EUR 2,509 thousand as of 31 December 2020). Employee Option Plan was approved by shareholders at the annual general shareholders’ meeting on 30 April, 2019. The service condition for the Option receiver is to complete a 3-year term of service to the Group. After the condition is met employee is eligible to exercise the option.
Reserve to grant shares for employees Number of shares, units Value, EUR
Total reserve as of 31 December 2019 5,600,000 1,624
Shares allocated to employees based on option agreements 4,765,690 1,382 Unallocated shares 3,886,034 1,127
Total reserve as of 31 December 2020 8,651,724 2,509
Shares allocated to employees based on option agreements 4,765,690 1,382 Unallocated shares 3,886,034 1,127
Total reserve as of 31 March 2021 8,651,724 2,509
3. The structure of the Group
As of 31 March 2021, the Group consisted of the Company and 137 subsidiaries (31 December 2020: 137). Detailed list of all subsidiaries in 2021 and 2020 is provided below.
No. Name of subsidiary Legal form
Legal entity code
Registered office Profile Group ownership interest, %
31/03/21 31/12/20
1. Baltic Champs UAB *4 302942064 Šiaulių region, Poviliškių v., 15 **A 100,00% 100,00%
2. AVG Investment UAB *4 300087691 Vilniaus mun., Vilnius, Konstitucijos av. 21C
**G 100,00% 100,00%
3. AWG Investment 1 UAB *4 301745765 Vilniaus mun., Vilnius, Konstitucijos av. 21C
**G 100,00% 100,00%
4. AWG Investment 2 UAB *4 301807590 Vilniaus mun., Vilnius, Konstitucijos av. 21C
**G 100,00% 100,00%
5. Agross UAB *4 301807601 Vilniaus mun., Vilnius, Konstitucijos av. 21C
**H 100,00% 100,00%
6. Grain Lt UAB *4 302489354 Vilniaus mun., Vilnius, Konstitucijos av. 21C
**H 100,00% 97,41%
7. AgroGis UAB *4 302583978 Vilniaus mun., Vilnius, Konstitucijos av. 21C
**D 95,00% 95,00%
8. Agro Management Team UAB *4 302599498 Jonavos region, Bukonių v., Lankesos st. 2 **E 100,00% 100,00%
9. Agrotechnikos centras UAB *4 302589187 Jonavos region, Bukonių v., Lankesos st. 2 **F 100,00% 100,00%
10. AUGA trade UAB *4 302753875 Jonavos region, Bukonių v., Lankesos st. 2 **H 100,00% 100,00%
11. Agricultural entity Žemės fondas *1 300558595 Vilniaus mun., Vilnius, Konstitucijos av. 21C
**E 100,00% 100,00%
12. Žemės vystymo fondas 6 UAB *4 300589719 Vilniaus mun., Vilnius, Smolensko st. 10 **E 100,00% 100,00%
13. Žemės vystymo fondas 9 UAB *4 300547638 Jonavos region, Bukonių v., Lankesos st. 2 **E 100,00% 100,00%
14. Žemės vystymo fondas 10 UAB *4 301522723 Jonavos region, Bukonių v., Lankesos st. 2 **E 100,00% 100,00%
15. Žemės vystymo fondas 20 UAB *4 300887726 Jonavos region, Bukonių v., Lankesos st. 2 **B 100,00% 100,00%
16. AUGA Grūduva UAB *4 174401546 Šakių region, Gotlybiškių v., **A 98,97% 98,97%
17. Agricultural entity AUGA Spindulys *1 171330414 Radviliškio region, Vaitiekūnų v., Spindulio st. 13
**A 99,99% 99,99%
18. Agricultural entity AUGA Smilgiai *1 168548972 Panevėžio region, Smilgių mstl. Panevėžio st. 23-1
**A 100,00% 100,00%
19. Agricultural entity AUGA Skėmiai *1 171306071 Radviliškio region, Skėmių v., Kėdainių st. 36
**A 99,97% 99,97%
20. Agricultural entity AUGA Nausodė *1 154179675 Anykščių region, Kirmėlių v., **A 99,93% 99,93%

AUGA GROUP, AB Konstitucijos av. 21C, Quadrum North, LT-08130, Vilnius, Lithuania CONSOLIDATED INTERIM FINANCIAL STATEMENTS FOR 3 MONTHS PERIOD ENDING 31 MARCH 2021 (All amounts are in EUR thousand, unless stated otherwise)
Consolidated interim financial statements for 3 months period ending 31 March 2021 (unaudited)
17
No. Name of subsidiary Legal form
Legal entity code
Registered office Profile Group ownership interest, %
31/03/21 31/12/20 21. Agricultural entity AUGA Dumšiškės *1 172276179 Raseinių region, Paraseinio v., **A 99,88% 99,88%
22. Agricultural entity AUGA Žadžiūnai *1 175706853 Šiaulių region, Žadžiūnų v., Gudelių st. 30-2
**A 99,81% 99,81%
23. Agricultural entity AUGA Mantviliškis *1 161274230 Kėdainių region, Mantviliškio v., **A 99,94% 99,94%
24. Agricultural entity AUGA Alanta *1 167527719 Molėtų region, Kazlų v., Skiemonių st. 2A **A 99,99% 99,99%
25. Agricultural entity AUGA Eimučiai *1 175705032 Šiaulių region, Žadžiūnų v., Gudelių st. 30-2
**A 99,24% 99,24%
26. Agricultural entity AUGA Vėriškės *1 171305165 Radviliškio region, Vėriškių v., **A 99,93% 99,93%
27. Agricultural entity AUGA Želsvelė *1 165666499 Marijampolės mun., Želsvos v., **A 99,86% 99,86%
28. Agricultural entity AUGA Lankesa *1 156913032 Jonavos region, Bukonių v., **A 96,91% 96,91%
29. Agricultural entity AUGA Kairėnai *1 171327432 Radviliškio region, Kairėnų v., **A 98,47% 98,47%
30. Agricultural entity AUGA Jurbarkai *1 158174818 Jurbarko region, Klišių v., Vytauto Didžiojo st. 99
**A 98,46% 98,46%
31. Agricultural entity AUGA Gustoniai *1 168565021 Panevėžio region, Gustonių v., M. Kriaučiūno st. 15
**A 100,00% 100,00%
32. Cooperative entity Siesarčio ūkis *3 302501098 Šakių region, Gotlybiškių v., Mokyklos st. 18
**A 99,44% 99,44%
33. Cooperative entity Kašėta *3 302501251 Jonavos region, Bukonių v., Lankesos st. 2 **A 99,44% 99,44%
34. Agricultural entity Gustonys *1 302520102 Panevėžio region, Gustonių v., M. Kriaučiūno st. 15
**E 100,00% 100,00%
35. Agricultural entity Skėmių pienininkystės centras
*1 302737554 Radviliškio region, Skėmių v., Alyvų st. 1 **A 48,67% 48,67%
36. Cooperative entity Agrobokštai *3 302485217 Vilniaus mun., Vilnius, Konstitucijos av. 21C
**A 97,94% 97,94%
37. Cooperative entity Dotnuvėlės valdos *3 302618614 Šiaulių region, Žadžiūnų v., Gudelių st. 30-2
**A 99,22% 99,22%
38. Cooperative entity Nevėžio lankos *3 302618596 Kėdainių region, Mantviliškio v., Liepos 6-osios st. 60
**A 96,51% 96,51%
39. Cooperative entity Radviliškio kraštas *3 302618742 Radviliškio region, Skėmių v., Kėdainių st. 13
**A 98,67% 98,67%
40. Cooperative entity Šventosios pievos *3 302618201 Raseinių region, Kalnujų mstl. Žieveliškės st. 1
**A 96,36% 96,36%
41. Cooperative entity Kairių ūkis *3 302615194 Panevėžio region, Gustonių v., M. Kriaučiūno st. 15
**A 98,68% 98,68%
42. Cooperative entity Šiaurinė valda *3 302615187 Šiaulių region, Poviliškių v., 15 **A 96,15% 96,15%
43. Cooperative entity Šušvės žemė *3 302618767 Kelmės region, Pašiaušės v., Vilties st. 2 **A 98,43% 98,43%
44. Cooperative entity Žalmargėlis *3 303145954 Vilniaus mun., Vilnius, Smolensko st. 10-100
**A 98,32% 98,32%
45. Cooperative entity Juodmargėlis *3 303159014 Raseinių region, Kalnujų mstl. Žieveliškės st. 1
**A 99,35% 99,35%
46. Cooperative entity Agromilk *3 302332698 Raseinių region, Kalnujų mstl. Žieveliškės st. 1
**A 96,28% 96,28%
47. Cooperative entity Purpurėja *3 302542337 Širvintų region, Širvintų v., Zosinos st. 7 **A 99,53% 99,53%
48. Bukonių ekologinis ūkis UAB *4 302846621 Vilniaus mun., Vilnius, Konstitucijos av. 21C
**A 100,00% 100,00%
49. Agrosaulė 8 UAB *4 302846105 Vilniaus mun., Vilnius, Smolensko st. 10-100
**G 100,00% 100,00%
50. Biržai distr., Rinkuškiai reclamation infrastructure users association
*2 302465556 Biržų region, Biržai, Vytauto st. 38 **A 48,67% 48,67%
51. Pasvalys distr., Pušalotas reclamation infrastructure users association
*2 302465563 Pasvalio region, Diliauskų v., Diliauskų st. 23
**A 48,67% 48,67%
52. Skėmiai reclamation infrastructure users association
*2 303170256 Šiaulių region, Žadžiūnų v., Gudelių st. 30-2
**A 48,67% 48,67%
53. Vaitiekūnai reclamation infrastructure users association
*2 303170306 Šiaulių region, Žadžiūnų v., Gudelių st. 30-2
**A 48,67% 48,67%
54. Association Grūduvos melioracija *2 302567116 Šakių region, Gotlybiškių v., Mokyklos st. 2 **A 65,81% 65,81%
55. Pauliai reclamation infrastructure users association
*2 303169909 Raseinių region, Gėluvos v., Dvaro st. 30 **A 100,00% 100,00%
56. Nausode reclamation infrastructure users association
*2 304219592 Vilniaus mun., Vilnius, Konstitucijos av. 21C
**A 70,74% 70,74%
57. Traktorių nuomos centras UAB *4 302820808 Jonavos region, Bukonių v., Lankesos st. 2 **A 100,00% 100,00%
58. Traktorių nuomos paslaugos UAB *4 302820797 Jonavos region, Bukonių v., Lankesos st. 2 **A 100,00% 100,00%
59. Arnega UAB *4 302661957 Jonavos region, Bukonių v., Lankesos st. 2 **A 100,00% 100,00%
60. AgroSchool OU *6 12491954 Harju maakond, Tallinn, Kesklinna linnaosa, Lai tn 32-8, 10133
**G 100,00% 100,00%
61. Public institution AgroSchool *5 303104797 Vilniaus mun., Vilnius, Smolensko st. 10-100
**C 50,00% 50,00%
62. AUGA Ramučiai UAB *4 302854479 Akmenės region, Ramučių v., Klevų st. 11 **A 100,00% 100,00%

AUGA GROUP, AB Konstitucijos av. 21C, Quadrum North, LT-08130, Vilnius, Lithuania CONSOLIDATED INTERIM FINANCIAL STATEMENTS FOR 3 MONTHS PERIOD ENDING 31 MARCH 2021 (All amounts are in EUR thousand, unless stated otherwise)
Consolidated interim financial statements for 3 months period ending 31 March 2021 (unaudited)
18
No. Name of subsidiary Legal form
Legal entity code
Registered office Profile Group ownership interest, %
31/03/21 31/12/20 63. AUGA Luganta UAB *4 300045023 Kelmės region, Pašiaušės v., **A 100,00% 100,00%
64. eTime invest UAB *4 300578676 Vilniaus mun., Vilnius, Saltoniškių st. 29 **G 100,00% 100,00%
65. ŽVF Projektai UAB *4 300137062 Jonavos region, Bukonių v., Lankesos st. 2 **E 52,62% 52,62%
66. Agricultural entity Alantos ekologinis ūkis *1 303324747 Molėtų region, Kazlų v., Skiemonių st. 2A **A 100,00% 100,00%
67. Agricultural entity Dumšiškių ekologinis ūkis
*1 303324722 Raseinių region, Paraseinio v., Paraseinio st. 2
**A 100,00% 100,00%
68. Agricultural entity Eimučių ekologinis ūkis *1 303324715 Šiaulių region, Žadžiūnų v., Gudelių st. 30-2
**A 100,00% 100,00%
69. Agricultural entity Grūduvos ekologinis ūkis
*1 303324804 Šakių region, Gotlybiškių v., Mokyklos st. 2 **A 100,00% 100,00%
70. Agricultural entity Jurbarkų ekologinis ūkis *1 303325361 Jurbarko region, Klišių v., Vytauto Didžiojo st. 99
**A 100,00% 100,00%
71. Agricultural entity Kairėnų ekologinis ūkis *1 303325774 Radviliškio region, Vaitiekūnų v., Spindulio st. 13-2
**A 100,00% 100,00%
72. Agricultural entity Lankesos ekologinis ūkis
*1 303325710 Jonavos region, Bukonių v., Lankesos st. 2 **A 100,00% 100,00%
73. Agricultural entity Mantviliškio ekologinis ūkis
*1 303325703 Kėdainių region, Mantviliškio v., Liepos 6-osios st. 60
**A 100,00% 100,00%
74. Agricultural entity Nausodės ekologinis ūkis
*1 303325781 Anykščių region, Nausodės v., Nausodės st. 55
**A 100,00% 100,00%
75. Agricultural entity Skėmių ekologinis ūkis *1 303325692 Radviliškio region, Skėmių v., Kėdainių st. 13
**A 100,00% 100,00%
76. Agricultural entity Smilgių ekologinis ūkis *1 303325824 Panevėžio region, Smilgiai, Panevėžio st. 23-1
**A 100,00% 100,00%
77. Agricultural entity Spindulio ekologinis ūkis
*1 303325817 Radviliškio region, Vaitiekūnų v., Spindulio st. 13-2
**A 100,00% 100,00%
78. Agricultural entity Vėriškių ekologinis ūkis *1 303325849 Radviliškio region, Skėmių v., Kėdainių st. 13
**A 100,00% 100,00%
79. Agricultural entity Žadžiūnų ekologinis ūkis
*1 303325870 Šiaulių region, Žadžiūnų v., Gudelių st. 30-2
**A 100,00% 100,00%
80. Agricultural entity Želsvelės ekologinis ūkis
*1 303325856 Marijampolės mun., Želsvos v., Želsvelės st. 1
**A 100,00% 100,00%
81. Prestviigi OU *6 12654600 Harju maakond, Tallinn, Kesklinna linnaosa, Lai tn 32-8, 10133
**G 100,00% 100,00%
82. Turvaste partners OU *6 12655410 Harju maakond, Tallinn, Kesklinna linnaosa, Lai tn 32-8, 10133
**G 100,00% 100,00%
83. Nakamaa Agro OU *6 12655522 Harju maakond, Tallinn, Kesklinna linnaosa, Lai tn 32-8, 10113
**G 100,00% 100,00%
84. Hindaste Invest OU *6 12655384 Harju maakond, Tallinn, Kesklinna linnaosa, Lai tn 32-8, 10133
**G 100,00% 100,00%
85. Tuudi River OU *6 12655640 Harju maakond, Tallinn, Kesklinna linnaosa, Lai tn 32-8, 10133
**G 100,00% 100,00%
86. Palderma Partners OU *6 12654959 Harju maakond, Tallinn, Kesklinna linnaosa, Lai tn 32-8, 10133
**G 100,00% 100,00%
87. Ave-Martna Capital OU *6 12655155 Harju maakond, Tallinn, Kesklinna linnaosa, Lai tn 32-8, 10133
**G 100,00% 100,00%
88. Hobring Invest OU *6 12655427 Harju maakond, Tallinn, Kesklinna linnaosa, Lai tn 32-8, 10133
**G 100,00% 100,00%
89. Rukkirahhu Capital OU *6 12655232 Harju maakond, Tallinn, Kesklinna linnaosa, Lai tn 32-8, 10133
**G 100,00% 100,00%
90. Pahasoo OU *6 12655367 Harju maakond, Tallinn, Kesklinna linnaosa, Lai tn 32-8, 10133
**G 100,00% 100,00%
91. Cooperative entity Ganiklis *3 303429417 Radviliškio region, Skėmių v., Alyvų st. 1-3 **A 98,09% 98,09%
92. Cooperative entity Ganiavos gėrybės *3 303429431 Radviliškio region, Skėmių v., Alyvų st. 1-3 **A 98,09% 98,09%
93. Cooperative entity Žemėpačio pieno ūkis *3 303432388 Raseinių region, Ariogalos sen. Gėluvos v., Dvaro st. 30
**A 98,09% 98,09%
94. Cooperative entity Žemynos pienelis *3 303427989 Raseinių region, Ariogalos sen. Gėluvos v., Dvaro st. 30
**A 98,09% 98,09%
95. Cooperative entity Lygiadienio ūkis *3 303428087 Radviliškio region, Skėmių v., Alyvų st. 1-3 **A 98,09% 98,09%
96. Cooperative entity Laumės pieno ūkis *3 303427996 Raseinių region, Ariogalos sen. Gėluvos v., Dvaro st. 30
**A 98,09% 98,09%
97. Cooperative entity Medeinos pienas *3 303428112 Raseinių region, Ariogalos sen. Gėluvos v., Dvaro st. 30
**A 98,09% 98,09%
98. Cooperative entity Gardaitis *3 303429381 Radviliškio region, Skėmių v., Alyvų st. 1-3 **A 98,09% 98,09%
99. Cooperative entity Dimstipatis *3 303429424 Mažeikių aplinkl. 9, Naikių v., Mažeikių apylinkės sen., Mažeikių region,
**A 98,09% 98,09%
100. Cooperative entity Aušlavis *3 303429456 Radviliškio region, Skėmių v., Alyvų st. 1-3 **A 98,09% 98,09%
101. Cooperative entity Austėjos pieno ūkis *3 303428094 Mažeikių aplinkl. 9, Naikių v., Mažeikių apylinkės sen., Mažeikių region,
**A 98,09% 98,09%
102. Cooperative entity Aitvaro ūkis *3 303429374 Radviliškio region, Skėmių v., Alyvų st. 1-3 **A 98,09% 98,09%

AUGA GROUP, AB Konstitucijos av. 21C, Quadrum North, LT-08130, Vilnius, Lithuania CONSOLIDATED INTERIM FINANCIAL STATEMENTS FOR 3 MONTHS PERIOD ENDING 31 MARCH 2021 (All amounts are in EUR thousand, unless stated otherwise)
Consolidated interim financial statements for 3 months period ending 31 March 2021 (unaudited)
19
No. Name of subsidiary Legal form
Legal entity code
Registered office Profile Group ownership interest, %
31/03/21 31/12/20 103. Cooperative entity Giraičio pieno ūkis *3 303429399 Mažeikių aplinkl. 9, Naikių v., Mažeikių
apylinkės sen., Mažeikių region, **A 98,09% 98,09%
104. Fentus 10 GmbH *6 HRB106477 StraBe des 17 Juni 10b 10623 Berlin, Germany
**G 100,00% 100,00%
105. Norus 26 AG *6 HRB109356B StraBe des 17 Juni 10b 10623 Berlin, Germany
**G 100,00% 100,00%
106. LT Holding AG *6 HRB109265B StraBe des 17 Juni 10b 10623 Berlin, Germany
**G 100,00% 100,00%
107. KTG Agrar UAB *4 300127919 Vilniaus mun., Vilnius, Konstitucijos av. 21C
**A 100,00% 100,00%
108. Agrar Raseiniai UAB *4 300610316 Raseinių region, Ariogalos sen. Gėluvos v., Dvaro st. 30
**A 100,00% 100,00%
109. AUGA Mažeikiai UAB *4 300610348 Mažeikių av. 9, Naikių v., Mažeikių region, **A 100,00% 100,00%
110. PAE Agrar UAB *4 300867691 Raseinių region, Gėluvos v., Dvaro st. 30 **A 100,00% 100,00%
111. Delta Agrar UAB *4 300868875 Raseinių region, Gėluvos v., Dvaro st. 30 **A 100,00% 100,00%
112. KTG Grūdai UAB *4 302637486 Raseinių region, Gėluvos v., Dvaro st. 30 **A 100,00% 100,00%
113. KTG Eko Agrar UAB *4 300510650 Raseinių region, Gėluvos v., Dvaro st. 30 **A 100,00% 100,00%
114. Agronita UAB *4 300132574 Raseinių region, Gėluvos v., Dvaro st. 30 **A 100,00% 100,00%
115. Agronuoma UAB *4 303204954 Raseinių region, Gėluvos v., Dvaro st. 30 **A 100,00% 100,00%
116. VL Investment Vilnius 12 UAB *4 303205611 Raseinių region, Gėluvos v., Dvaro st. 30 **A 100,00% 100,00%
117. Agrar Ašva UAB *4 301608542 Raseinių region, Gėluvos v., Dvaro st. 30 **A 100,00% 100,00%
118. Agrar Varduva UAB *4 301608791 Raseinių region, Gėluvos v., Dvaro st. 30 **A 100,00% 100,00%
119. Agrar Seda UAB *4 301608777 Raseinių region, Gėluvos v., Dvaro st. 30 **A 100,00% 100,00%
120. Agrar Kvistė UAB *4 302308067 Raseinių region, Gėluvos v., Dvaro st. 30 **A 100,00% 100,00%
121. Agrar Luoba UAB *4 302308035 Raseinių region, Gėluvos v., Dvaro st. 30 **A 100,00% 100,00%
122. Agrar Gaja UAB *4 302594412 Raseinių region, Gėluvos v., Dvaro st. 30 **A 100,00% 100,00%
123. Agrar Ariogala UAB *4 301626540 Raseinių region, Gėluvos v., Dvaro st. 30 **A 100,00% 100,00%
124. Agrar Girdžiai UAB *4 301621568 Raseinių region, Gėluvos v., Dvaro st. 30 **A 100,00% 100,00%
125. Agrar Vidauja UAB *4 301622531 Raseinių region, Gėluvos v., Dvaro st. 30 **A 100,00% 100,00%
126. Agrar Raudonė UAB *4 302309532 Raseinių region, Gėluvos v., Dvaro st. 30 **A 100,00% 100,00%
127. Agrar Venta UAB *4 302307855 Raseinių region, Gėluvos v., Dvaro st. 30 **A 100,00% 100,00%
128. Agrar Nerys UAB *4 302594063 Raseinių region, Gėluvos v., Dvaro st. 30 **A 100,00% 100,00%
129. Agrar Gėluva UAB *4 302312133 Raseinių region, Gėluvos v., Dvaro st. 30 **A 100,00% 100,00%
130. Agrar Betygala UAB *4 302312222 Raseinių region, Gėluvos v., Dvaro st. 30 **A 100,00% 100,00%
131. Agrar Dubysa UAB *4 302312215 Raseinių region, Gėluvos v., Dvaro st. 30 **A 100,00% 100,00%
132. Agrar Pauliai UAB *4 302312165 Raseinių region, Gėluvos v., Dvaro st. 30 **A 100,00% 100,00%
133. Agrar Mituva UAB *4 302312172 Raseinių region, Gėluvos v., Dvaro st. 30 **A 100,00% 100,00%
134. AUGA Raseiniai UAB *4 304704364 Raseinių region, Kalnujai, Žieveliškės st. 1 **A 100,00% 100,00%
135. Tėvynės žemelė UAB *4 303301428 Antano Tumėno st. 4, Vilniaus mun., Vilnius
**G 100,00% 100,00%
136. Tėviškės žemelė UAB *4 303207199 Antano Tumėno st. 4, Vilniaus mun., Vilnius
**E 100,00% 100,00%
137. Cooperative entity Grybai LT *3 302765404 Žibalų st. 37, Širvintos
**I
100,00% 100,00%
COMMENTS: * ** *1 Agricultural entity **A Agricultural operations **G Management of subsidiaries *2 Association **B Cash pool of the group **H Trade and logistics *3 Cooperative entity **C Human resource management **I Food processing *4 Private limited Company **D IT system development *5 Public institution **E Land management *6 Foreign legal entity **F Lease of machinery

AUGA GROUP, AB Konstitucijos av. 21C, Quadrum North, LT-08130, Vilnius, Lithuania CONSOLIDATED INTERIM FINANCIAL STATEMENTS FOR 3 MONTHS PERIOD ENDING 31 MARCH 2021 (All amounts are in EUR thousand, unless stated otherwise)
Consolidated interim financial statements for 3 months period ending 31 March 2021 (unaudited)
20
4. Property, plant and equipment
GROUP
Land Buildings Constructions and
machinery
Vehicles, equipment and other property, plant and
equipment
Construction in progress
Total
Carrying amount
As of 31 December 2019 60,622 40,978 22,602 2,198 1,707 128,108
- purchase of subsidiaries - 2,262 2,223 132 - 4,617
- additions 6,667 454 2,289 781 2,273 12,465
- disposals and write-offs (6) (17) (147) (46) - (216)
- revaluation 851 - - - - 851
- depreciation (including ROU assets) (5,855) (2,499) (4,196) (722) - (13,273)
- reclassifications - 271 718 2 (990) -
As of 31 December 2020 62,279 41,448 23,489 2,345 2,991 132,552
- additions 433 26 927 877 45 2,308
- disposals and write-offs - (5) (45) (19) - (69)
- revaluation - - - - - -
- depreciation (including ROU assets) (1,487) (630) (1,026) (196) - (3,342)
- reclassifications - - - 1,067 (1,067) -
As of 31 March 2021 61,225 40,839 23,342 4,074 1,968 131,448
Acquisition cost or revaluated amount as of
31 December 2019 65,981 54,560 40,730 5,308 1,707 168,286
31 December 2020 73,494 57,529 45,813 6,177 2,991 186,004
31 March 2021 73,927 57,550 46,695 8,102 1,969 188,242
Accumulated depreciation and impairment losses as of
31 December 2019 (5,359) (13,582) (18,128) (3,110) - (40,179)
31 December 2020 (11,214) (16,081) (22,324) (3,832) - (53,452)
31 March 2021 (12,701) (16,711) (23,353) (4,028) - (56,760)
Carrying amount as of
31 December 2019 60,622 40,978 22,602 2,198 1,707 128,108
31 December 2020 62,279 41,448 23,489 2,345 2,991 132,552
31 March 2021 61,225 40,839 23,342 4,074 1,968 131,448
Right-of-use assets (ROU assets) recognized by the Group included the following type of assets:
Land
Right of use assets 31 March 2021 31 December 2020
Acquisition cost 46,020 40,728
Additions - 5,292
Less: accumulated depreciation (12,700) (11,214)
Carrying amount 33,320 34,806
Buildings
Right of use assets 31 March 2021 31 December 2020
Acquisition cost 1,008 975
Additions - 33
Less: accumulated depreciation (306) (271)
Carrying amount 702 737

AUGA GROUP, AB Konstitucijos av. 21C, Quadrum North, LT-08130, Vilnius, Lithuania CONSOLIDATED INTERIM FINANCIAL STATEMENTS FOR 3 MONTHS PERIOD ENDING 31 MARCH 2021 (All amounts are in EUR thousand, unless stated otherwise)
Consolidated interim financial statements for 3 months period ending 31 March 2021 (unaudited)
21
5. Biological assets
The movement of Group’s biological assets (in EUR thousand) consisted of the following:
Non – current assets Current assets
Dairy cows Other livestock Mushroom seedbed Crops Total
Balance as of 31 December 2019 5,744 3,654 2,226 13,809 25,433
Direct purchases - 123 - - 123
Accumulated expenses - 3,821 28,171 34,912 66,904
Transfer between groups 2,707 (2,707) - - -
Direct sales (523) (224) - - (747)
Harvest - - (28,248) (41,510) (69,758)
Revaluation (1,371) (1,146) - 7,692 5,175
Write-offs (247) (131) - - (378)
Balance as of 31 December 2020 6,310 3,389 2,149 14,903 26,751
Direct purchases - 74 - - 74
Accumulated expenses - 1,179 6,763 24,743 32,685
Transfer between groups 951 (951) - - -
Direct sales (128) (63) - - (191)
Harvest - - (6,763) (20,068) (26,831)
Revaluation (392) (158) - 1,594 1,043
Write-offs (86) (33) - - (119)
Balance as of 31 March 2021 6,655 3,437 2,149 21,172 33,413
6. Inventory
The movement of Group’s inventory quantities (in tonnes) consisted of the following:
Wheat Legumes Mushrooms Milk
End-consumer
goods Other Forage
Raw mate-rials* Total
Balance as of 31 December 2019 25,988 7,512 1 18 - - 59,340 - 92,859
Purchases 1,773 4,915 - - - - - - 6,798
Sales (54,732) (17,269) (12,906) (25,338) - - (836) - (111,191)
Production 51,461 31,115 12,911 26,890 - - 79,840 - 202,217 Consumed in preparation of
biological assets (livestock) (1,432) (2,425) - (1,104) - - (59,315) - (64,276) Consumed in preparation of
biological assets (crops and mycelium seedbeds) (5,692) (9,752) - - - - - - (15,444)
Inventory write-offs (327) (66) - (450) - - (5,970) - (6,813)
Balance as of 31 December 2020 17,039 14,030 6 16 - - 73,059 - 104,150
Purchases 44 1,504 - - - - - - 1,548
Sales (12,258) (5,905) (3,177) (6,384) - - (741) - (28,464)
Production - - 3,186 6,790 - - - - 9,976 Consumed in preparation of
biological assets (livestock) (32) (51) - (286) - - (13,144) - (13,513) Consumed in preparation of
biological assets (crops and mycelium seedbeds) (122) (177) - - - - - - (299)
Inventory write-offs (157) (85) - (106) - - (318) - (666)
Balance as of 31 March 2021 4,514 9,317 15 30 - - 58,857 - 72,732 *Raw materials consist of various units of measure, thus it cannot be disclosed in this table.
AUGA GROUP, AB Konstitucijos av. 21C, Quadrum North, LT-08130, Vilnius, Lithuania CONSOLIDATED INTERIM FINANCIAL STATEMENTS FOR 3 MONTHS PERIOD ENDING 31 MARCH 2021 (All amounts are in EUR thousand, unless stated otherwise)
Consolidated interim financial statements for 3 months period ending 31 March 2021 (unaudited)
22
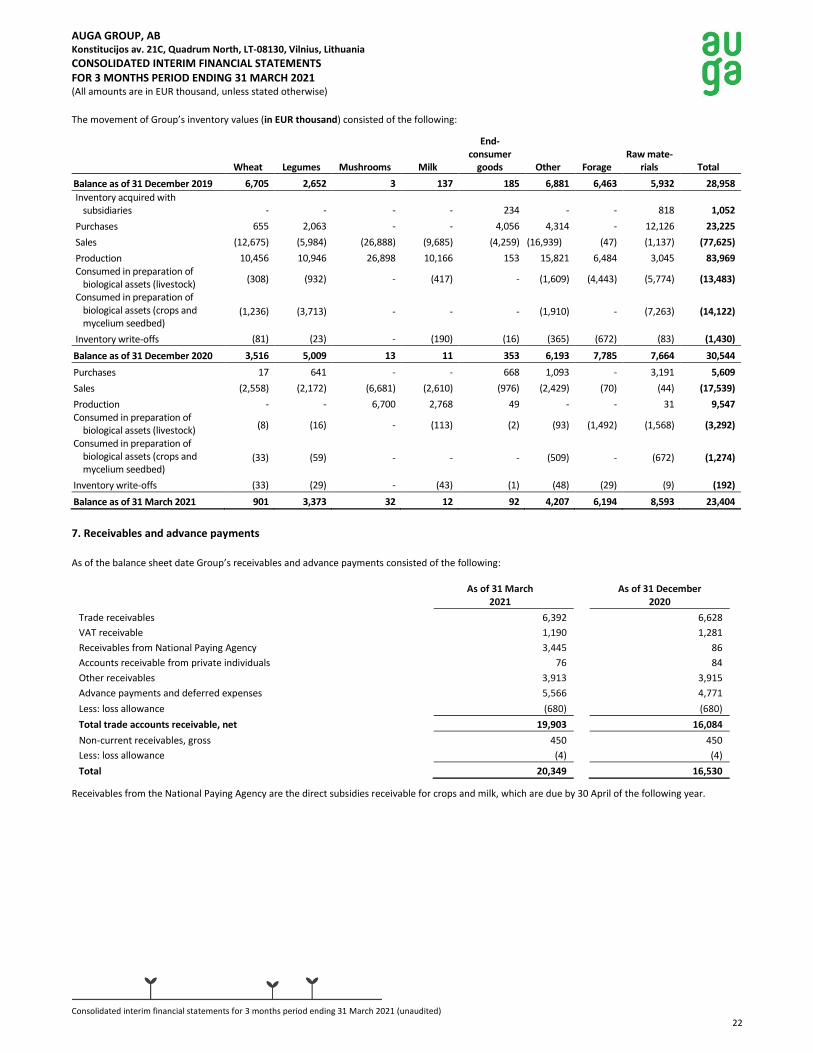
The movement of Group’s inventory values (in EUR thousand) consisted of the following:
Wheat Legumes Mushrooms Milk
End-consumer
goods Other Forage Raw mate-
rials Total
Balance as of 31 December 2019 6,705 2,652 3 137 185 6,881 6,463 5,932 28,958
Inventory acquired with subsidiaries - - - - 234 - - 818 1,052
Purchases 655 2,063 - - 4,056 4,314 - 12,126 23,225
Sales (12,675) (5,984) (26,888) (9,685) (4,259) (16,939) (47) (1,137) (77,625)
Production 10,456 10,946 26,898 10,166 153 15,821 6,484 3,045 83,969 Consumed in preparation of
biological assets (livestock) (308) (932) - (417) - (1,609) (4,443) (5,774) (13,483)
Consumed in preparation of biological assets (crops and mycelium seedbed)
(1,236) (3,713) - - - (1,910) - (7,263) (14,122)
Inventory write-offs (81) (23) - (190) (16) (365) (672) (83) (1,430)
Balance as of 31 December 2020 3,516 5,009 13 11 353 6,193 7,785 7,664 30,544
Purchases 17 641 - - 668 1,093 - 3,191 5,609
Sales (2,558) (2,172) (6,681) (2,610) (976) (2,429) (70) (44) (17,539)
Production - - 6,700 2,768 49 - - 31 9,547 Consumed in preparation of
biological assets (livestock) (8) (16) - (113) (2) (93) (1,492) (1,568) (3,292)
Consumed in preparation of biological assets (crops and mycelium seedbed)
(33) (59) - - - (509) - (672) (1,274)
Inventory write-offs (33) (29) - (43) (1) (48) (29) (9) (192)
Balance as of 31 March 2021 901 3,373 32 12 92 4,207 6,194 8,593 23,404
7. Receivables and advance payments
As of the balance sheet date Group’s receivables and advance payments consisted of the following:
As of 31 March 2021
As of 31 December 2020
Trade receivables 6,392 6,628
VAT receivable 1,190 1,281
Receivables from National Paying Agency 3,445 86
Accounts receivable from private individuals 76 84
Other receivables 3,913 3,915
Advance payments and deferred expenses 5,566 4,771
Less: loss allowance (680) (680)
Total trade accounts receivable, net 19,903 16,084
Non-current receivables, gross 450 450
Less: loss allowance (4) (4)
Total 20,349 16,530
Receivables from the National Paying Agency are the direct subsidies receivable for crops and milk, which are due by 30 April of the following year.

AUGA GROUP, AB Konstitucijos av. 21C, Quadrum North, LT-08130, Vilnius, Lithuania CONSOLIDATED INTERIM FINANCIAL STATEMENTS FOR 3 MONTHS PERIOD ENDING 31 MARCH 2021 (All amounts are in EUR thousand, unless stated otherwise)
Consolidated interim financial statements for 3 months period ending 31 March 2021 (unaudited)
23
8. Financial liabilities
The Group’s long-term borrowings consisted of the following:
As of 31 March 2021 As of 31 December 2020
Borrowings from banks
Mushroom growing companies 8,566 8,892
FMCG companies 1,140 1,184
Agricultural entities 16,533 11,003
Parent company 3,000 3,000
Other borrowings
Creditors 753 753
Investment fund for purchased land 253 253
Green Bonds 18,892 18,818
Total 49,137 43,903
Less: amounts, payable within one year (according to agreements) (2,662) (3,409)
Total long-term borrowings 46,475 40,494
On 13 December 2019 the Group issued 20,000 units of Green Bonds (hereinafter – Bonds) with a nominal value of EUR 1,000. Balance sheet value of the bonds represent the value of the bonds after discounts and other related expenses. These expenses and discounts are accounted as interest expenses and capitalized to the value of the bonds over the 5-year period. The long-term borrowings and payables are repayable as follows:
As of 31 March 2021 As of 31 December 2020
Financial liabilities to banks and bondholders
Within second year 5,332 5,186
Within third and fourth year 31,189 25,843
After fifth year and later 9,954 9,465
Total 46,475 40,494
The Group’s short-term borrowings were the following:
As of 31 March 2021 As of 31 December 2020
Borrowings from banks
Mushroom growing companies 2,400 2,400
FMCG companies - -
Parent company - -
Grain selling entity 4,450 7,000
Total short-term borrowings 6,850 9,400
Short-term loans from banks as of 31 March 2021 include EUR 6,850 thousand credit-line facilities (2020: EUR 9,400 thousand).

AUGA GROUP, AB Konstitucijos av. 21C, Quadrum North, LT-08130, Vilnius, Lithuania CONSOLIDATED INTERIM FINANCIAL STATEMENTS FOR 3 MONTHS PERIOD ENDING 31 MARCH 2021 (All amounts are in EUR thousand, unless stated otherwise)
Consolidated interim financial statements for 3 months period ending 31 March 2021 (unaudited)
24
9. Leases The Group’s leases consisted of the following:
As of 31 March 2021 As of 31 December 2020
Lease liabilities
Lease liabilities related to right-of-use assets* 33,383 34,626
Lease liabilities related to other assets** 6,388 6,613
Total 39,771 41,239
Less: amounts payable within one year
Lease liabilities related to right-of-use assets* 3,730 4,607
Lease liabilities related to other assets** 2,161 2,950
Total 5,891 7,557
Total long-term leases 33,880 33,682
* Lease liabilities accounted as operational lease before adoption of IFRS 16. ** Lease liabilities accounted as financial lease before adoption of IFRS 16.
10. Results of business segments
CROP GROWING SEGMENT
a) Harvest of agricultural produce 3-month period ending 31
March 2021
3-month period ending 31 March 2020
Total cultivated land, ha 39,223 39,637
Wheat 10,000 11,896
Legumes 7,937 9,035
Other cash crops 13,818 9,664
Forage Crops 6,731 8,168
Fallow 738 875
Average harvest yield, t/ha
Wheat - -
Legumes - -
Other cash crops - - Forage Crops - -
Total fair value of harvest, EUR'000 20,068 18,758
Wheat 6,975 8,853
Legumes 3,627 1,913
Other cash crops 7,240 4,495 Forage Crops 2,226 3,497
Total production cost of harvest, EUR'000 16,456 16,034
Wheat 5,836 7,071
Legumes 3,627 1,913
Other cash crops 4,767 3,552
Forage Crops 2,226 3,497
Total gain (loss) on revaluation of biological assets at fair value, EUR’000* 3,612 2,724
Gain (loss) on revaluation of biological assets at fair value recognized in previous periods, EUR'000* 2,018 1,450
Gain (loss) on revaluation of biological assets recognized in reporting period, EUR'000* 1,594 1,274
*Estimated gain (loss) on recognition of winter crops at fair value as of 31 March 2021. For more information please see management report’s section 2.2.
b) Sales of agricultural produce 3-month period ending 31 March 2021
3-month period ending 31 March 2020
Total revenue of sold agricultural produce, EUR'000 7,531 5,358
Total cost of sold agricultural produce*, EUR'000 7,998 5,317
Total inventory write-offs, EUR'000 78 241
Result of sales of agricultural produce, EUR'000 (545) (200)
* The cost of sold agricultural produce represents the value of crops evaluated at fair values at point of harvest and related sales costs.

AUGA GROUP, AB Konstitucijos av. 21C, Quadrum North, LT-08130, Vilnius, Lithuania CONSOLIDATED INTERIM FINANCIAL STATEMENTS FOR 3 MONTHS PERIOD ENDING 31 MARCH 2021 (All amounts are in EUR thousand, unless stated otherwise)
Consolidated interim financial statements for 3 months period ending 31 March 2021 (unaudited)
25
c) Agricultural subsidies 3-month period ending 31
March 2021 3-month period ending 31
March 2020
Direct subsidies, EUR'000 1,289 1,139
Organic farming subsidies, EUR'000 1,090 751
Total subsidies, EUR'000 2,379 1,889
Gross profit of crop growing segment per period, EUR'000 (a+b+c) 3,428 2,963
Depreciation included in the harvest of agricultural produce, EUR’000 878 983
DAIRY SEGMENT
3-month period ending 31 March 2021
3-month period ending 31 March 2020
Total quantity sold, tonnes 6,565 6,963
Non-organic milk, tonnes 130 896
Organic milk, tonnes 6,060 5,653
Dairy commodities, tonnes 190 233
Cattle, tonnes 186 181
Total revenues of dairy segment, EUR'000 3,282 3,490
Non-organic milk, EUR'000 44 297
Organic milk, EUR'000 2,466 2,302
Dairy commodities, EUR'000 580 716
Cattle, EUR'000 191 176
Total cost of dairy segment, EUR'000 3,257 3,193
Milk, EUR'000 2,509 2,313
Dairy commodities, EUR'000 557 704
Cattle, EUR'000 191 176
Revaluation of biological assets, EUR’000 (550) (702)
Total subsidies, EUR’000 732 496
Gross profit of dairy segment, EUR'000 207 92
Depreciation included in cost of dairy segment sales, EUR’000 139 127
END-CONSUMER PACKAGED GOODS
3-month period ending 31 March 2021
3-month period ending 31 March 2020
Total revenue from end-consumer packaged goods sales, EUR'000 1,419 908
Total cost of sales of end-consumer packaged goods, EUR'000 1,042 849
Gross profit of sales of end-consumer packaged goods, EUR'000 378 60
Depreciation included in cost of sales of end-consumer packaged goods, EUR’000 89 -
MUSHROOM SEGMENT 3-month period ending 31 March 2021
3-month period ending 31 March 2020
Total quantity sold, tonnes 3,177 3,288
Non-organic mushrooms, tonnes 2,976 3,029
Organic mushrooms, tonnes 200 259
Total revenues from mushroom sales, EUR'000 7,136 6,717
Non-organic mushrooms, EUR'000 6,433 5,917
Organic mushrooms, EUR'000 703 800
Total cost of mushrooms sold, EUR'000 6,681 6,169
Non-organic mushrooms, EUR'000 6,218 5,686
Organic mushrooms, EUR'000 463 483
Total revenues from sales of mushroom seedbed, EUR'000 124 564
Total cost from sales of mushroom seedbed, EUR'000 82 491
Gross profit of mushroom growing segment, EUR'000 497 621
Depreciation included in cost of mushroom sales, EUR’000 395 405
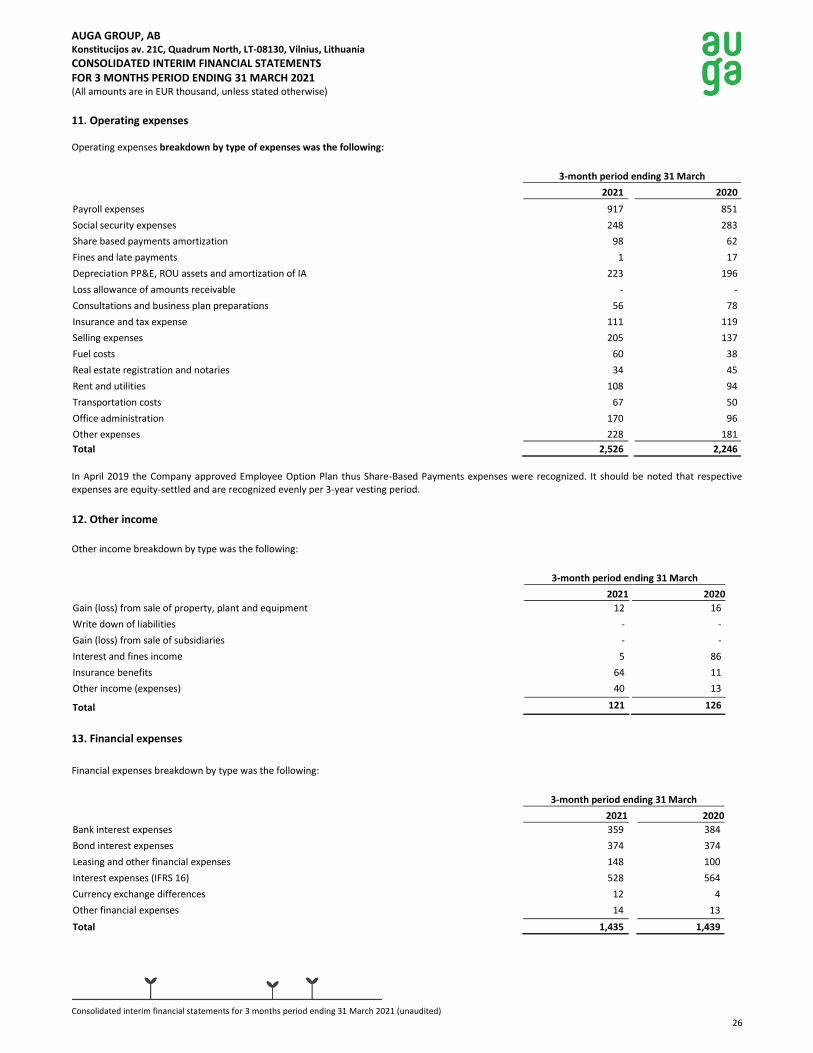
AUGA GROUP, AB Konstitucijos av. 21C, Quadrum North, LT-08130, Vilnius, Lithuania CONSOLIDATED INTERIM FINANCIAL STATEMENTS FOR 3 MONTHS PERIOD ENDING 31 MARCH 2021 (All amounts are in EUR thousand, unless stated otherwise)
Consolidated interim financial statements for 3 months period ending 31 March 2021 (unaudited)
26
11. Operating expenses Operating expenses breakdown by type of expenses was the following:
3-month period ending 31 March
2021 2020
Payroll expenses 917 851
Social security expenses 248 283
Share based payments amortization 98 62
Fines and late payments 1 17
Depreciation PP&E, ROU assets and amortization of IA 223 196
Loss allowance of amounts receivable - -
Consultations and business plan preparations 56 78
Insurance and tax expense 111 119
Selling expenses 205 137
Fuel costs 60 38
Real estate registration and notaries 34 45
Rent and utilities 108 94
Transportation costs 67 50
Office administration 170 96
Other expenses 228 181
Total 2,526 2,246
In April 2019 the Company approved Employee Option Plan thus Share-Based Payments expenses were recognized. It should be noted that respective expenses are equity-settled and are recognized evenly per 3-year vesting period.
12. Other income
Other income breakdown by type was the following:
3-month period ending 31 March
2021 2020
Gain (loss) from sale of property, plant and equipment 12 16
Write down of liabilities - -
Gain (loss) from sale of subsidiaries - -
Interest and fines income 5 86
Insurance benefits 64 11
Other income (expenses) 40 13
Total 121 126
13. Financial expenses
Financial expenses breakdown by type was the following:
3-month period ending 31 March
2021 2020
Bank interest expenses 359 384
Bond interest expenses 374 374
Leasing and other financial expenses 148 100
Interest expenses (IFRS 16) 528 564
Currency exchange differences 12 4
Other financial expenses 14 13
Total 1,435 1,439

AUGA GROUP, AB Konstitucijos av. 21C, Quadrum North, LT-08130, Vilnius, Lithuania CONSOLIDATED INTERIM FINANCIAL STATEMENTS FOR 3 MONTHS PERIOD ENDING 31 MARCH 2021 (All amounts are in EUR thousand, unless stated otherwise)
Consolidated interim financial statements for 3 months period ending 31 March 2021 (unaudited)
27
14. Subsequent events January – May 2021
The Company informs of all material events over the CNS (Company News System) of NASDAQ Vilnius and on the ESPI (Electronic Information Transfer System) which is operated by Polish FSA, as well as on Electronic Information Base which is operated by Warsaw Stock Exchange.
Announ-cement date Announcement header
24.05.2021 AUGA group, AB will organise an Investor Conference Webinar to introduce unaudited financial results for the 3 months of 2021
03.05.2021 Annual information for 2020
30.04.2021 Decisions of the Ordinary General Meeting of Shareholders of AUGA group, AB which Took Place on 30th April 2021
22.04.2021 AUGA group, AB Notification of transactions by persons discharging managerial responsibilities
22.04.2021 AUGA group, AB progresses with its employee motivation scheme through share options
19.04.2021 Notice on the update of questions of the agenda of the ordinary general meeting of shareholders of AUGA group, AB on 30 April 2021 by drafts of decisions and related information
12.04.2021 CORRECTION: AUGA group, AB will organise an Investor Conference Webinar dedicated to retail investors
12.04.2021 AUGA group, AB will organise an Investor Conference Webinar dedicated to retail investors
08.04.2021 Notice on Convocation of the ordinary General Meeting of Shareholders of AUGA group, AB on 30 April 2021
06.04.2021 AUGA group, AB (the Company) increased subsidiary UAB Grain LT (Grain LT) share capital by EUR 10 million by capitalized Grain LT's debt to the Company
01.03.2021 AUGA group, AB presentation of financial results for the 12 months of 2020
26.02.2021 Interim information on AUGA group, AB for the 12-month period ending 31 December 2020
24.02.2021 AUGA group, AB (the Company) acquired 100% UAB Grain LT (Grain LT) shares from another company of the group UAB AUGA Grūduva
23.02.2021 AUGA group, AB will organise an Investor Conference Webinar to introduce unaudited financial results for the 12 months of 2020
17.02.2021 AUGA group, AB Published Green Bond Report
03.02.2021 Dates of periodic information disclosure of AUGA group, AB for the year 2021 (investor calendar)
27.01.2021 Announcement on suspension of AUGA group, AB green bonds trading for one day due to NASDAQ technical change in trading system
V. CONFIRMATION OF RESPONSIBLE PERSONS
In accordance with the Law on Securities of the Republic of Lithuania and the Rules on the Information Disclosure approved by the Board of the Bank of Lithuania, we hereby confirm that, to the best of our knowledge, the consolidated interim financial statements of AUGA group, AB for the three months period ended 31 March 2021, have been prepared in accordance with the International Financial Reporting Standards, give a true and fair view of the assets, liabilities, financial position, profit or loss and cash flow of AUGA group, AB group.
Chief Executive Officer Kęstutis Juščius
Chief Financial Officer Mindaugas Ambrasas