Auditing of water use on construction sites - Phase I · Auditing of water use on construction...
117
Final Report Auditing of water use on construction sites - Phase I This report summarises the findings from an initial evaluation of water use on constructions sites. These findings include the results of a limited water audit programme which comprised a snapshot one day audit of nine construction sites in the United Kingdom. Project Code: WAS908-004 Research date: 16 February 2011 to 31 March 2011 ISBN: Date: July 2011
-
Upload
truongthuy -
Category
Documents
-
view
219 -
download
1
Transcript of Auditing of water use on construction sites - Phase I · Auditing of water use on construction...
Final Report
Auditing of water use on construction sites - Phase I
This report summarises the findings from an initial evaluation of water use on constructions sites. These findings include the results of alimited water audit programme which comprised a snapshot one day audit of nine construction sites in the United Kingdom.
Project Code: WAS908-004 Research date: 16 February 2011 to 31 March 2011
ISBN: Date: July 2011

WRAP’s vision is a world without waste, where resources are used sustainably. We work with businesses and individuals to help them reap the benefits of reducing waste, develop sustainable products and use resources in an efficient way. Find out more at www.wrap.org.uk Written by: Derek J. McNab, Michael Lynch and Paul Young of Mabbett & Associates Ltd Front cover photography: [Rain gun dust suppression operating from the back of a water bowser.] WRAP and Mabbett & Associates Ltd believe the content of this report to be correct as at the date of writing. However, factors such as prices, levels of recycled content and regulatory requirements are subject to change and users of the report should check with their suppliers to confirm the current situation. In addition, care should be taken in using any of the cost information provided as it is based upon numerous project-specific assumptions (such as scale, location, tender context, etc.). The report does not claim to be exhaustive, nor does it claim to cover all relevant products and specifications available on the market. While steps have been taken to ensure accuracy, WRAP cannot accept responsibility or be held liable to any person for any loss or damage arising out of or in connection with this information being inaccurate, incomplete or misleading. It is the responsibility of the potential user of a material or product to consult with the supplier or manufacturer and ascertain whether a particular product will satisfy their specific requirements. The listing or featuring of a particular product or company does not constitute an endorsement by WRAP and WRAP cannot guarantee the performance of individual products or materials. This material is copyrighted. It may be reproduced free of charge subject to the material being accurate and not used in a misleading context. The source of the material must be identified and the copyright status acknowledged. This material must not be used to endorse or used to suggest WRAP’s endorsement of a commercial product or service. For more detail, please refer to WRAP’s Terms & Conditions on its web site: www.wrap.org.uk
1
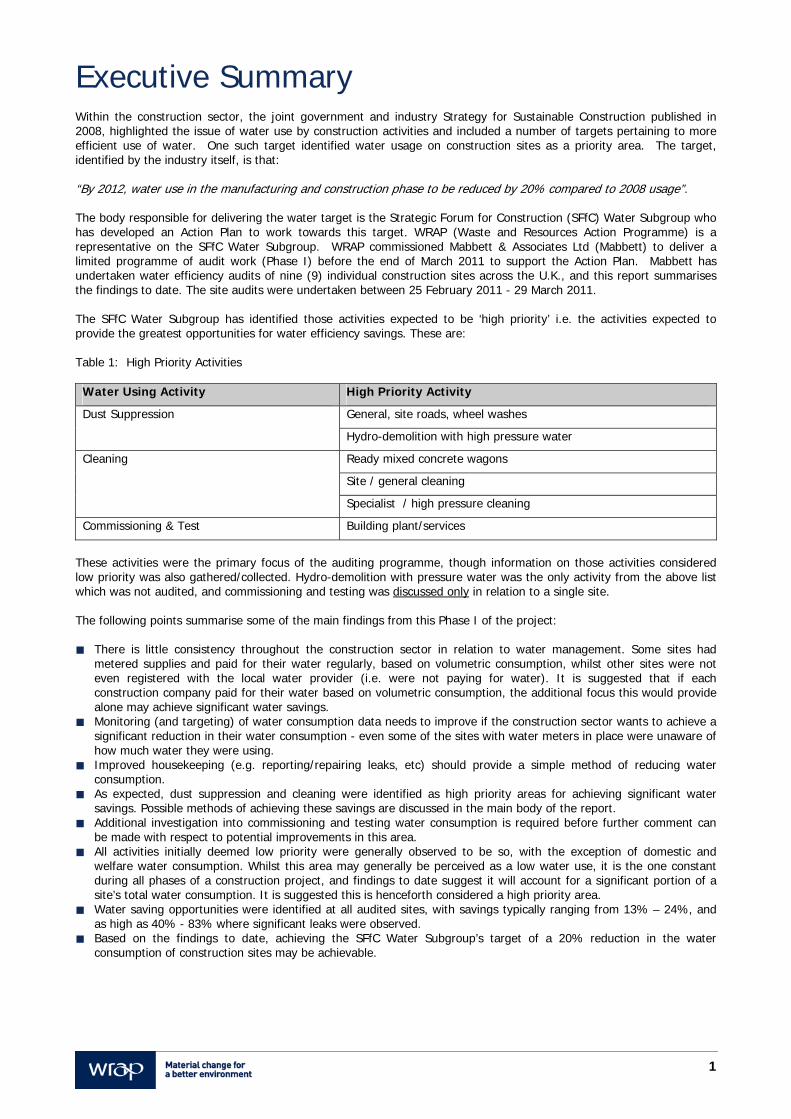
Executive Summary Within the construction sector, the joint government and industry Strategy for Sustainable Construction published in 2008, highlighted the issue of water use by construction activities and included a number of targets pertaining to more efficient use of water. One such target identified water usage on construction sites as a priority area. The target, identified by the industry itself, is that: “By 2012, water use in the manufacturing and construction phase to be reduced by 20% compared to 2008 usage”. The body responsible for delivering the water target is the Strategic Forum for Construction (SFfC) Water Subgroup who has developed an Action Plan to work towards this target. WRAP (Waste and Resources Action Programme) is a representative on the SFfC Water Subgroup. WRAP commissioned Mabbett & Associates Ltd (Mabbett) to deliver a limited programme of audit work (Phase I) before the end of March 2011 to support the Action Plan. Mabbett has undertaken water efficiency audits of nine (9) individual construction sites across the U.K., and this report summarises the findings to date. The site audits were undertaken between 25 February 2011 - 29 March 2011. The SFfC Water Subgroup has identified those activities expected to be ‘high priority’ i.e. the activities expected to provide the greatest opportunities for water efficiency savings. These are: Table 1: High Priority Activities
Water Using Activity High Priority Activity
Dust Suppression General, site roads, wheel washes
Hydro-demolition with high pressure water
Cleaning Ready mixed concrete wagons
Site / general cleaning
Specialist / high pressure cleaning
Commissioning & Test Building plant/services
These activities were the primary focus of the auditing programme, though information on those activities considered low priority was also gathered/collected. Hydro-demolition with pressure water was the only activity from the above list which was not audited, and commissioning and testing was discussed only in relation to a single site. The following points summarise some of the main findings from this Phase I of the project: There is little consistency throughout the construction sector in relation to water management. Some sites had
metered supplies and paid for their water regularly, based on volumetric consumption, whilst other sites were not even registered with the local water provider (i.e. were not paying for water). It is suggested that if each construction company paid for their water based on volumetric consumption, the additional focus this would provide alone may achieve significant water savings.
Monitoring (and targeting) of water consumption data needs to improve if the construction sector wants to achieve a significant reduction in their water consumption - even some of the sites with water meters in place were unaware of how much water they were using.
Improved housekeeping (e.g. reporting/repairing leaks, etc) should provide a simple method of reducing water consumption.
As expected, dust suppression and cleaning were identified as high priority areas for achieving significant water savings. Possible methods of achieving these savings are discussed in the main body of the report.
Additional investigation into commissioning and testing water consumption is required before further comment can be made with respect to potential improvements in this area.
All activities initially deemed low priority were generally observed to be so, with the exception of domestic and welfare water consumption. Whilst this area may generally be perceived as a low water use, it is the one constant during all phases of a construction project, and findings to date suggest it will account for a significant portion of a site’s total water consumption. It is suggested this is henceforth considered a high priority area.
Water saving opportunities were identified at all audited sites, with savings typically ranging from 13% – 24%, and as high as 40% - 83% where significant leaks were observed.
Based on the findings to date, achieving the SFfC Water Subgroup’s target of a 20% reduction in the water consumption of construction sites may be achievable.
2
Some of the main opportunities for improving water efficiency are discussed in greater detail below: Following the initial auditing programme, it became clear that the one area where all sites could make improvements to water efficiency was domestic and welfare water consumption. This water requirement is unique at construction sites, in that it is present at each site for (generally) the full project duration. As such, it seems to account for a significant portion of a site’s water consumption, and represents an excellent (and relatively simple) opportunity for improving water efficiency in the construction sector. Another area where the majority of sites could improve was monitoring and targeting of water consumption. Where a site is unaware of how much water they are consuming (this was particularly prevalent at sites which did not pay for their water consumption on a variable basis), they are less likely to make improvements in this area. As such, ensuring each site is aware of exactly how much they are using (at a minimum) is likely to help promote a more water efficiency culture. At a number of sites, hoses without trigger-operated spray gun control were in operation. Generally, this is considered poor practice, and can lead to instances where hoses are left operational whilst not in use. It should prove a relatively simple (and inexpensive) matter to retro-fit spray guns to these hoses to eliminate this risk. Leaks were observed (or suspected) at multiple sites, some of which accounted for a significant portion of a site’s water consumption. In addition, unrepaired leaks can act to detract from a water efficient culture, and may lead to additional water efficiencies elsewhere on site. As such, site management should ensure that a formal system is in place for checking/reporting/repairing leaks, on a regular basis. The dust suppression systems which were observed (or reported) were water inefficient in a number of instances, and significant improvements could be made in this area. When operational, these systems will generally account for a significant portion of a site’s water consumption, and as such water savings could be high. However, further work is required to more accurately quantify the mains water requirement associated with these activities. A programme of further work has been outlined to assist the SFfC Water Subgroup develop a more comprehensive understanding of construction site water consumption based on additional robust monitoring data.
3
Contents 1.0 Introduction 6 2.0 Sites 7 3.0 Audit Methodology 9
3.1 Introduction 9 3.2 Validity & Limitations of the Collected Data 9 3.3 Overview of Mabbett Applied Methodology 10
4.0 Water Saving Devices & Practices: General Activities 11
4.1 Water Supply 11 4.2 Housekeeping 11 4.3 Monitoring and Targeting 12
4.3.1 Water Quantification 12 4.3.2 Meter Readings 12 4.3.3 KPIs 13 4.3.4 Targeting 13
5.0 Water Saving Devices & Practices: High Priority Activities 14
5.1 Dust Suppression (General) 14 5.1.1 Rain Guns 15 5.1.2 Fan Misting Systems 15
5.2 Dust Suppression (Site Roads) 16 5.2.1 Dust Suppression Vehicles (Splash Plate Operation) 17 5.2.2 Dust Suppression Vehicles (Hydraulic Spinning System) 17 5.2.3 Road Sweepers 18 5.2.4 Hard-standing Ground 19
5.3 Dust Suppression (Wheel Wash) 19 5.3.1 High Pressure Washer (Wheel Wash) 19 5.3.2 Drive-on Wheel Wash 20
5.4 Dust Suppression (Hydro-demolition with high pressure water) 21 5.5 Chemical Additives 21 5.6 Control Systems 21 5.7 Cleaning (Ready Mixed Concrete Wagons) 22 5.8 Cleaning (Site/General Cleaning/Specialist/High Pressure) 25
5.8.1 Auto-isolation of Flow 25 5.8.2 High Pressure (Low Flow) Washers 26 5.8.3 Consult the Marketplace 27
5.9 Commissioning & Testing 27 6.0 Water Saving Devices & Practices: Low Priority Activities 28
6.1 Site Cabins/Temporary Accommodation 28 6.1.1 Wash Hand Basins 29 6.1.2 Sinks 30 6.1.3 Toilet Cisterns 30 6.1.4 Urinal Cisterns 30 6.1.5 Showers 31 6.1.6 Canteens 31
6.2 General Site Activities 31 6.2.1 Tool Washing 31 6.2.2 Rinsing 32
6.3 Wet Trades 32 6.3.1 Intermediate Vessels 32 6.3.2 Mortar 33
6.4 Groundworks 33 6.4.1 Grouting 33 6.4.2 Drilling/Piling 33
6.5 Cleaning 34 7.0 Further Work Required 35
7.1 High Priority Activity Auditing 35 7.2 Auditing Methodology 35 7.3 Matrix of Sites for Water Audits 35 7.4 BSRIA Guides Update 35
4
Contents Appendix 1: Site 1: Leisure (Sports Hall/Centre) Venue 36
Appendix 2: Site 2: Leisure (Theatre) Venue 42
Appendix 3: Site 3: Civil Engineering (Road) Site 49
Appendix 4: Site 4: Commercial Retail (Department Store) Site 60
Appendix 5: Site 5: Leisure (Sports Hall/Centre) Venue 66
Appendix 6: Site 6: Civil Engineering (Road) Site 76
Appendix 7: Site 7: Education (High School) Site 84
Appendix 8: Site 8: University (Laboratory) Building 92
Appendix 9: Site 9: Leisure (Theatre) Venue 99
Appendix 10: Water Audit Methodology 104
5
Acknowledgements The Waste and Resource Action Programme (WRAP) has commissioned Mabbett & Associates Ltd (Mabbett) to prepare this ‘auditing of water use on construction sites’ report. This report is subject to and issued in connection with the Mabbett Confidential Tender dated 24 January 2011 (Issue 00); Mabbett Confidential Tender Clarification Note dated 07 February 2011 (Issue 01); and WRAP Instruction Letter (Ref: FRA046-029v1-IL01v1) dated 14 February 2011. Mabbett would like to acknowledge and thank the following for their assistance and contribution during this programme of work: The Strategic Forum for Construction Water Subgroup; The construction companies who volunteered sites for audit; Ms Carmen Waylen (Senior Project Manager and Technical Consultant, Water Supply team) at WRc plc; Mr Jim Wiltshire (Programme Area Manager – Design for Resource Efficiency) at WRAP; Clugston Construction Ltd; Bovis Lend Lease Ltd; Sir Robert McAlpine Ltd; Balfour Beatty Civil Engineering Ltd; Clark Contracts Ltd; Simons Group Ltd; and Balfour Beatty Construction Ltd.
This report has been prepared by the following Mabbett personnel: ____________________________________ ____________________________________ Mr Michael Lynch, MEng, AMIChemE Mr Paul Young, MEng, AMIChemE Environmental Engineer Environmental Engineer Environmental Engineering Group Environmental Engineering Group This report has been reviewed and approved by: MABBETT & ASSOCIATES LTD BY: _____________________________________________ Mr Derek J. McNab, CEng, CSci, CEnv, FIChemE, MIEMA Senior Environmental Engineer & Scientist Environmental Engineering Group
6
1.0 Introduction The following introduction is provided to set the scene for the project. a. Within the construction sector the joint government and industry Strategy for Sustainable Construction, published
in 2008, highlighted the issue of water use by construction activities and included a number of targets pertaining to more efficient use of water. One such target identified water usage on construction sites as a priority area. The target, identified by the industry itself, is that:
“By 2012, water use in the manufacturing and construction phase to be reduced by 20% compared to 2008 usage”.
b. The body responsible for delivering the water target is the Strategic Forum for Construction (SFfC) and more
directly by SFfC’s Water Subgroup comprising representatives from industry including contractors, manufacturers, government departments and agencies. WRAP (Waste and Resources Action Programme) is a representative on the SFfC Water Subgroup.
c. The SFfC Water Subgroup developed an Action Plan to assist the construction industry in reducing the volume of
water used on construction sites. The Action Plan highlights two major themes. Firstly, the need to gather information on where water is used, and where water is wasted on construction sites, along with identification of suitable water conservation measures. Secondly, the Action Plan aims to improve site water use behaviour through embedding principles of water conservation throughout the construction process. A baseline figure of 140 m3 per £million contractors output at constant price in 2008 will be used to assess any improvement.
d. Mabbett & Associates Ltd (Mabbett) were commissioned by WRAP on behalf of the Subgroup to deliver a limited
programme of audit work before the end of March 2011 to support the Action Plan with the following objectives: To develop robust primary data quantifying where water is wasted and the associated water using processes
on construction sites through a series of site audits across a range of sites. To establish an evidence base of good practice for reduction of water use in the construction process.
e. WRAP proposed a series of audits be carried out using a predefined methodology (and further refined by Mabbett to take account of the project time limitations) in delivering the required project outputs between 15 February 2011 and 31 March 2011; a total of 6 weeks.
f. It was envisaged that at least six (6) sites would be audited before the end of March 2011 across the following
project types: civil engineering; commercial offices; commercial other; commercial retail; education; healthcare; industrial buildings; leisure; mixed use developments; public buildings; and residential. In total, nine (9) sites were audited in this initial phase of work.
g. This summary report has been prepared by Mabbett - Environmental, Health and Safety Consultants and Engineers. The findings, observations, and conclusions presented in this report, are limited by the scope of services outlined in the Mabbett Confidential Tender dated 24 January 2011 (Issue 00); Mabbett Confidential Tender Clarification Note dated 07 February 2011 (Issue 01); and WRAP Instruction Letter (Ref: FRA046-029v1-IL01v1) dated 14 February 2011. The professional opinions and findings presented in this report are based on facts and information conveyed to, or observed by Mabbett during completion of the project. Furthermore, assessment and field operations have been performed in accordance with generally accepted engineering practices. No other warranty, expressed or implied, is made.
7
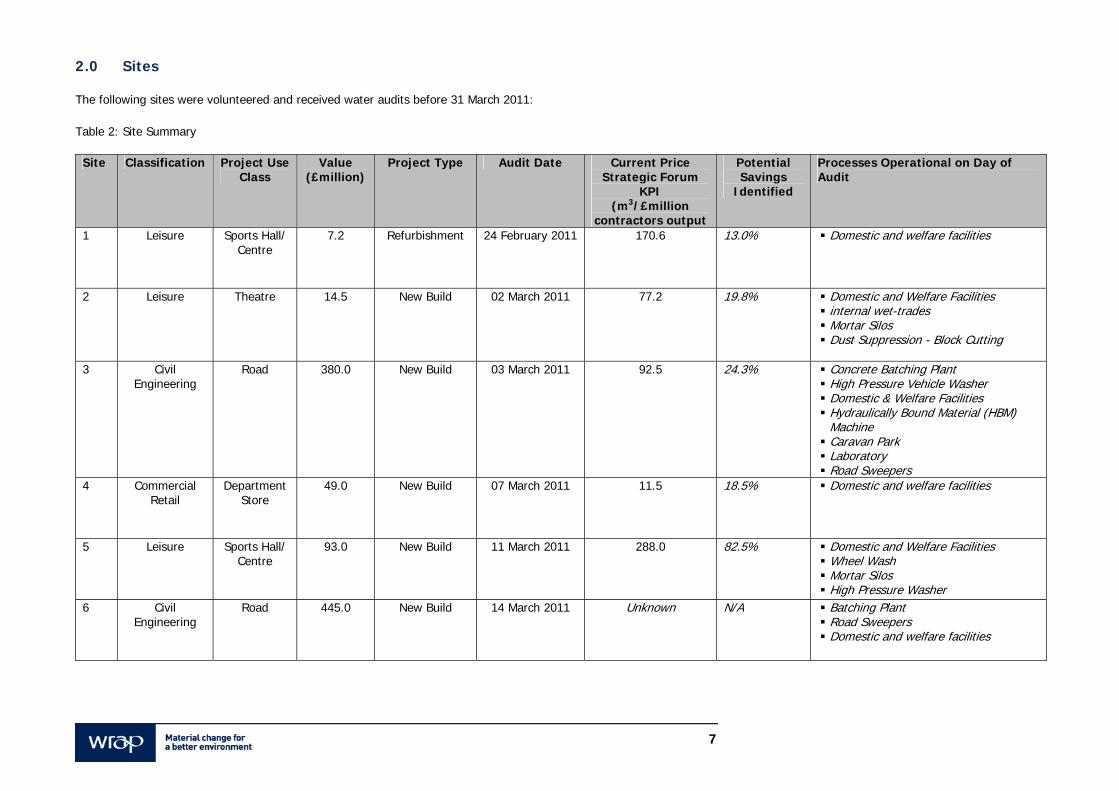
2.0 Sites The following sites were volunteered and received water audits before 31 March 2011: Table 2: Site Summary
Site Classification Project Use Class
Value (£million)
Project Type Audit Date Current Price Strategic Forum
KPI (m3/£million
contractors output
Potential Savings
Identified
Processes Operational on Day of Audit
1 Leisure Sports Hall/ Centre
7.2 Refurbishment 24 February 2011 170.6 13.0% Domestic and welfare facilities
2 Leisure Theatre 14.5 New Build 02 March 2011 77.2 19.8% Domestic and Welfare Facilities internal wet-trades Mortar Silos Dust Suppression - Block Cutting
3 Civil
Engineering Road 380.0 New Build 03 March 2011 92.5 24.3% Concrete Batching Plant
High Pressure Vehicle Washer Domestic & Welfare Facilities Hydraulically Bound Material (HBM)
Machine Caravan Park Laboratory Road Sweepers
4 Commercial Retail
Department Store
49.0 New Build 07 March 2011 11.5 18.5% Domestic and welfare facilities
5 Leisure Sports Hall/ Centre
93.0 New Build 11 March 2011 288.0 82.5% Domestic and Welfare Facilities Wheel Wash Mortar Silos High Pressure Washer
6 Civil Engineering
Road 445.0 New Build 14 March 2011 Unknown N/A Batching Plant Road Sweepers Domestic and welfare facilities
8
Site Classification Project Use Class
Value (£million)
Project Type Audit Date Current Price Strategic Forum
KPI (m3/£million
contractors output
Potential Savings
Identified
Processes Operational on Day of Audit
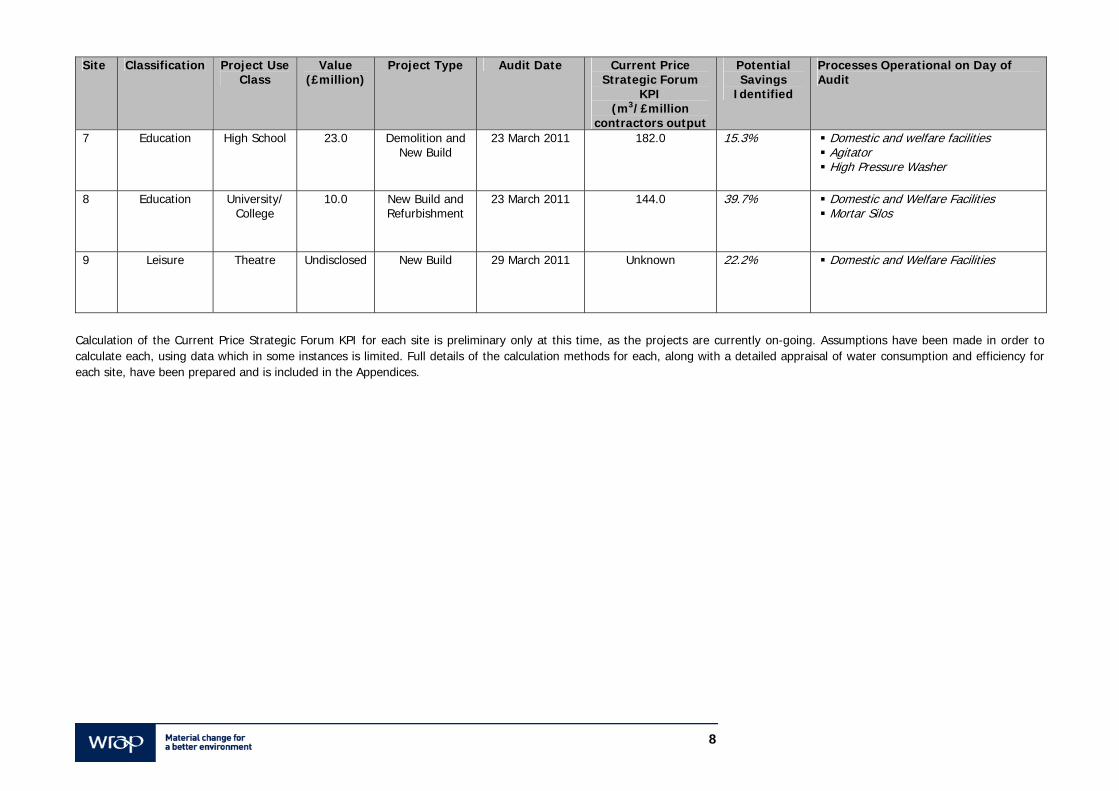
7 Education High School 23.0 Demolition and New Build
23 March 2011 182.0 15.3% Domestic and welfare facilities Agitator High Pressure Washer
8 Education University/ College
10.0 New Build and Refurbishment
23 March 2011 144.0 39.7% Domestic and Welfare Facilities Mortar Silos
9 Leisure Theatre Undisclosed New Build 29 March 2011 Unknown 22.2% Domestic and Welfare Facilities
Calculation of the Current Price Strategic Forum KPI for each site is preliminary only at this time, as the projects are currently on-going. Assumptions have been made in order to calculate each, using data which in some instances is limited. Full details of the calculation methods for each, along with a detailed appraisal of water consumption and efficiency for each site, have been prepared and is included in the Appendices.
9
3.0 Audit Methodology 3.1 Introduction The SFfC Water Subgroup has developed an Action Plan to assist the construction industry in reducing the volume of water used on construction sites. The collection of data on water using processes on sites and the identification of where water is wasted are the first steps of the Action Plan as there is currently very limited knowledge on this subject. A water audit methodology has been devised by the SFfC Water Subgroup as part of this Action Plan to assist the construction industry in reducing the volume of water used on construction sites. The priority for implementing water conservation measures on construction sites is on reducing water wastage with the following site processes identified by the SFfC Water Subgroup as likely to be the most water wasting activities: dust Suppression, to include general, site road and wheel washing; hydro-demolition with high pressure water; cleaning, to include ready mixed concrete wagons and other applications; and commissioning and testing of building plant/services. Accordingly, the water audits were initially targeted on collecting information on these activities where available. 3.2 Validity & Limitations of the Collected Data This report presents the findings from nine (9) one day water audits across a wide spectrum of construction project types providing a start to understanding where water is used and where wastage occurs. While this is a start, the construction sector has a long way to go to develop a full understanding of water use on construction sites. The limited ~6 week duration of this initial phase of the project identified barriers including: A lack of availability of suitable control sites, which reduces the options for estimating the savings associated with
particular water using processes or behaviours. Limited project duration which restricted the capture of the total volume of water used. As such, if the water
consumed on the day of the audit was dissimilar to the average figure, the estimated water consumption of the site will be inaccurate.
Limited audit duration which restricted the identification of the proportion of total site use against each water using activity - an increase project duration will allow this information to be estimated with a greater degree of accuracy.
Weather related impacts (e.g. dust suppression and wheel wash activities not operating on a wet day in March), meaning some high priority activities could not be fully assessed.
The scheduling of audits to fit with the contacts from each of the companies volunteering the sites. While the data collected is robust relative to the sites’ water consumptions on the day of the audit, the implementation of a long-term monitoring plan on a sample of control sites is needed to begin to identify the following: ‘total volume used’ To understand the total volume used per activity it will be necessary to follow the
water using activity during the course of the construction process from groundwork through to project handover on a selection of control sites.
‘proportion of total site use’ Similarly, this parameter will only be understood when all the water using activities can
be captured on a control site during the full construction process. While it is envisaged the SFfC-devised water audit methodology will work well on a long-term monitoring opportunity, its use is restrictive to a ~6 week programme. To obtain the best value from the project, Mabbett worked in general accordance with the water audit methodology with our initial focus on identifying and quantifying water wastage of the high priority activities noted above (specific site processes where possible); identifying and quantifying water wastage of other activities; and identification of suitable control sites for further work. To ascertain the savings associated with potential water saving devices and practices (conservation measures), Mabbett used a combination of: Actual monitored water use data gathered from the volunteered sites; and Pre-existing knowledge of the water saving devices and practices and the typical reduction achieved from their use. It is key to note that the volume of water saved through a particular conservation measure will depend on the existing water using activity practice which may well be highly variable, especially where behavioural influences are a factor.
10
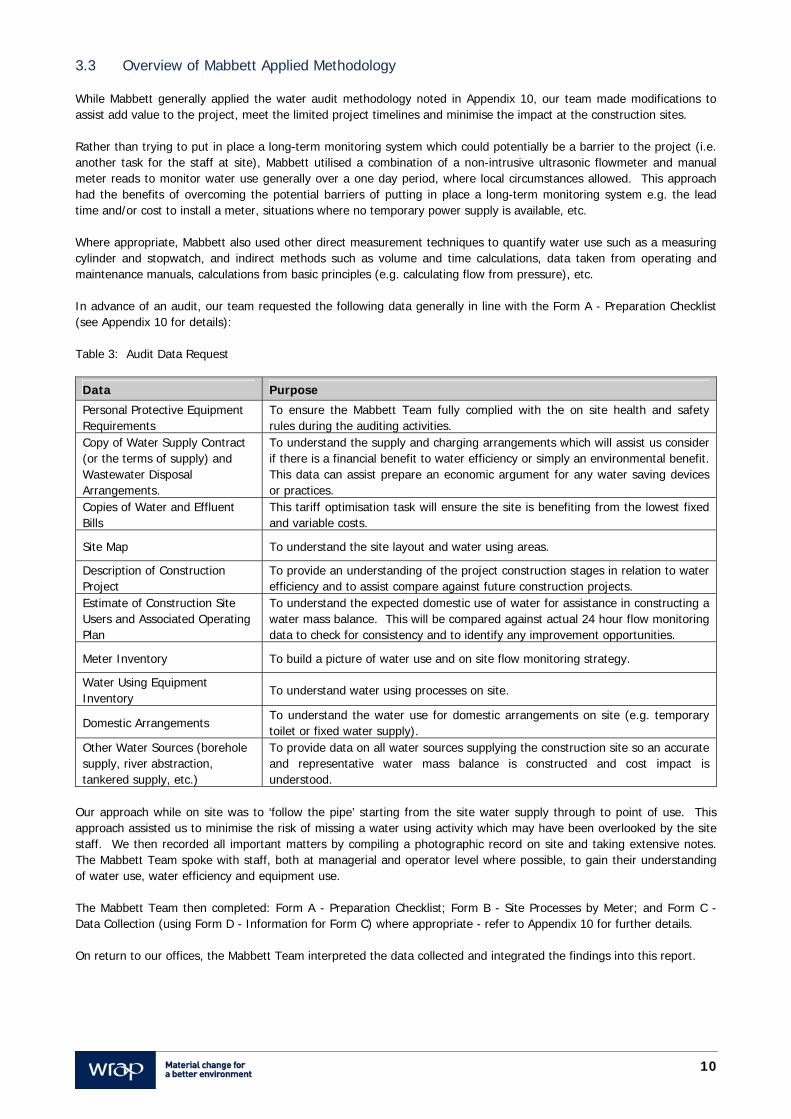
3.3 Overview of Mabbett Applied Methodology While Mabbett generally applied the water audit methodology noted in Appendix 10, our team made modifications to assist add value to the project, meet the limited project timelines and minimise the impact at the construction sites. Rather than trying to put in place a long-term monitoring system which could potentially be a barrier to the project (i.e. another task for the staff at site), Mabbett utilised a combination of a non-intrusive ultrasonic flowmeter and manual meter reads to monitor water use generally over a one day period, where local circumstances allowed. This approach had the benefits of overcoming the potential barriers of putting in place a long-term monitoring system e.g. the lead time and/or cost to install a meter, situations where no temporary power supply is available, etc. Where appropriate, Mabbett also used other direct measurement techniques to quantify water use such as a measuring cylinder and stopwatch, and indirect methods such as volume and time calculations, data taken from operating and maintenance manuals, calculations from basic principles (e.g. calculating flow from pressure), etc. In advance of an audit, our team requested the following data generally in line with the Form A - Preparation Checklist (see Appendix 10 for details): Table 3: Audit Data Request
Data Purpose
Personal Protective Equipment Requirements
To ensure the Mabbett Team fully complied with the on site health and safety rules during the auditing activities.
Copy of Water Supply Contract (or the terms of supply) and Wastewater Disposal Arrangements.
To understand the supply and charging arrangements which will assist us consider if there is a financial benefit to water efficiency or simply an environmental benefit. This data can assist prepare an economic argument for any water saving devices or practices.
Copies of Water and Effluent Bills
This tariff optimisation task will ensure the site is benefiting from the lowest fixed and variable costs.
Site Map To understand the site layout and water using areas.
Description of Construction Project
To provide an understanding of the project construction stages in relation to water efficiency and to assist compare against future construction projects.
Estimate of Construction Site Users and Associated Operating Plan
To understand the expected domestic use of water for assistance in constructing a water mass balance. This will be compared against actual 24 hour flow monitoring data to check for consistency and to identify any improvement opportunities.
Meter Inventory To build a picture of water use and on site flow monitoring strategy.
Water Using Equipment Inventory
To understand water using processes on site.
Domestic Arrangements To understand the water use for domestic arrangements on site (e.g. temporary toilet or fixed water supply).
Other Water Sources (borehole supply, river abstraction, tankered supply, etc.)
To provide data on all water sources supplying the construction site so an accurate and representative water mass balance is constructed and cost impact is understood.
Our approach while on site was to ‘follow the pipe’ starting from the site water supply through to point of use. This approach assisted us to minimise the risk of missing a water using activity which may have been overlooked by the site staff. We then recorded all important matters by compiling a photographic record on site and taking extensive notes. The Mabbett Team spoke with staff, both at managerial and operator level where possible, to gain their understanding of water use, water efficiency and equipment use. The Mabbett Team then completed: Form A - Preparation Checklist; Form B - Site Processes by Meter; and Form C - Data Collection (using Form D - Information for Form C) where appropriate - refer to Appendix 10 for further details. On return to our offices, the Mabbett Team interpreted the data collected and integrated the findings into this report.
11
4.0 Water Saving Devices & Practices: General Activities The following section is provided to set the scene for the water use on construction site generally. 4.1 Water Supply The type of water used on site and the type of wastewater generated by site operations/activities will determine how much a company pays for water supply and wastewater disposal. Generally the source of water for each of the sites is either mains water or water abstracted from surface water. There are a number of charging schemes for mains water and wastewater (sewerage, surface water and trade effluent charges) in the U.K. with the amount paid depending on: the service provider, volume used, rateable value, and the size of meter. Therefore, mains water is generally more expensive than direct abstraction. As a number of water using activities on construction sites do not have to be of a potable standard, it is suggested construction sites consider the use of Sustainable Urban Drainage Systems (SUDS) and/or settlement lagoons to collect surface water for at least part of a sites water requirement. As a result of the on site audit activities it is clear that that the type of water used plays a factor in water efficiency on site with those sites that are charged for mains water supply on a volumetric basis generally having a better water efficiency. 4.2 Housekeeping Creating a culture within the construction sector that changes staff’s attitude and behaviour to accept ownership of water efficiency is fundamental to improving the use of water in an efficient manner. Good housekeeping (e.g. reporting/repairing leaks, turning off taps which are not in use, and generally using water in an efficient manner) can assist a construction site reduce its overall water use. The range of attitudes identified across the sites that have been audited is vast, from those that believe water should be minimised (almost regardless of cost impact) to those that view water as a cheap commodity with a ‘don’t pay, don’t care’ attitude. None of the sites audited were able to provide evidence of providing their site staff with regular awareness training on water efficiency, and this is an area which could be improved. In this first instance, contractors should ensure that staff are aware of how much water is being consumed, as well as any water efficiency targets which may apply at the site. Following this, general housekeeping issues could be covered during a short workshop to help promote a water efficient culture over the duration of the project. Lastly, if there are any water using applications which are particularly significant (e.g. concrete batching plant), specific training could be provided to the relevant operators.
12
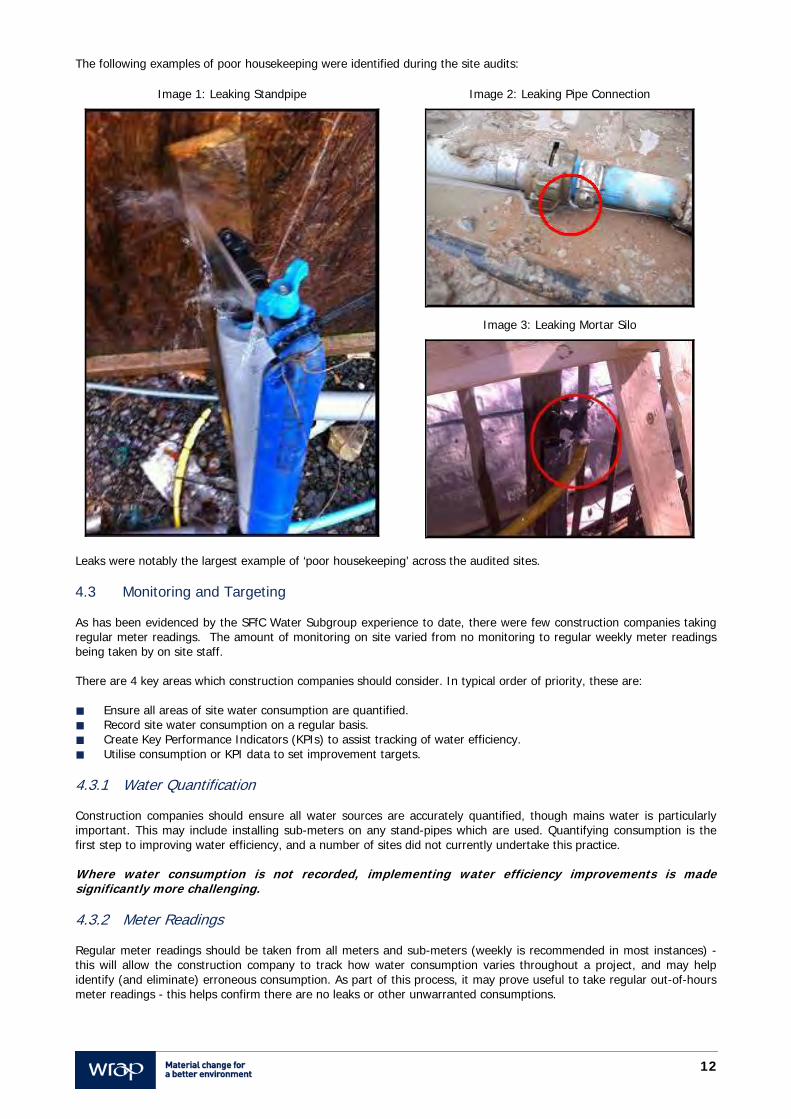
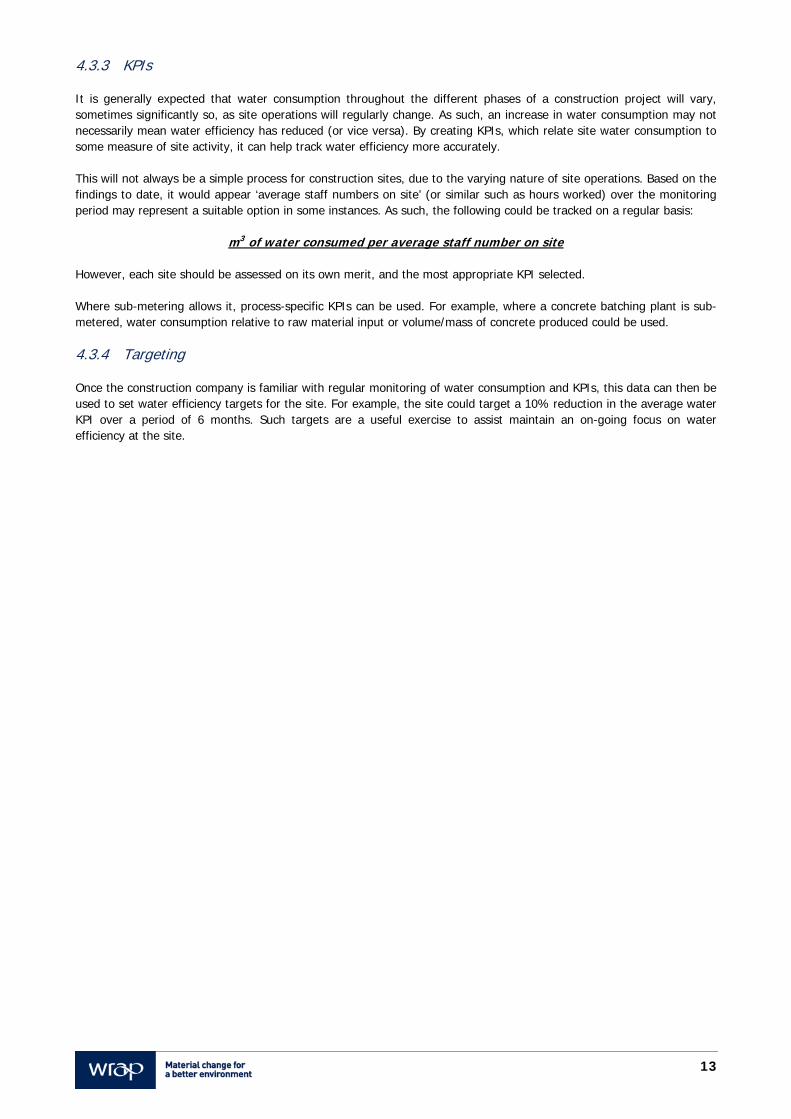
The following examples of poor housekeeping were identified during the site audits:
Image 1: Leaking Standpipe Image 2: Leaking Pipe Connection
Image 3: Leaking Mortar Silo
Leaks were notably the largest example of ‘poor housekeeping’ across the audited sites. 4.3 Monitoring and Targeting As has been evidenced by the SFfC Water Subgroup experience to date, there were few construction companies taking regular meter readings. The amount of monitoring on site varied from no monitoring to regular weekly meter readings being taken by on site staff. There are 4 key areas which construction companies should consider. In typical order of priority, these are: Ensure all areas of site water consumption are quantified. Record site water consumption on a regular basis. Create Key Performance Indicators (KPIs) to assist tracking of water efficiency. Utilise consumption or KPI data to set improvement targets.
4.3.1 Water Quantification Construction companies should ensure all water sources are accurately quantified, though mains water is particularly important. This may include installing sub-meters on any stand-pipes which are used. Quantifying consumption is the first step to improving water efficiency, and a number of sites did not currently undertake this practice. Where water consumption is not recorded, implementing water efficiency improvements is made significantly more challenging. 4.3.2 Meter Readings Regular meter readings should be taken from all meters and sub-meters (weekly is recommended in most instances) - this will allow the construction company to track how water consumption varies throughout a project, and may help identify (and eliminate) erroneous consumption. As part of this process, it may prove useful to take regular out-of-hours meter readings - this helps confirm there are no leaks or other unwarranted consumptions.
13
4.3.3 KPIs It is generally expected that water consumption throughout the different phases of a construction project will vary, sometimes significantly so, as site operations will regularly change. As such, an increase in water consumption may not necessarily mean water efficiency has reduced (or vice versa). By creating KPIs, which relate site water consumption to some measure of site activity, it can help track water efficiency more accurately. This will not always be a simple process for construction sites, due to the varying nature of site operations. Based on the findings to date, it would appear ‘average staff numbers on site’ (or similar such as hours worked) over the monitoring period may represent a suitable option in some instances. As such, the following could be tracked on a regular basis:
m3 of water consumed per average staff number on site However, each site should be assessed on its own merit, and the most appropriate KPI selected. Where sub-metering allows it, process-specific KPIs can be used. For example, where a concrete batching plant is sub-metered, water consumption relative to raw material input or volume/mass of concrete produced could be used. 4.3.4 Targeting Once the construction company is familiar with regular monitoring of water consumption and KPIs, this data can then be used to set water efficiency targets for the site. For example, the site could target a 10% reduction in the average water KPI over a period of 6 months. Such targets are a useful exercise to assist maintain an on-going focus on water efficiency at the site.
14
5.0 Water Saving Devices & Practices: High Priority Activities The following section has been prepared based on information gathered/collected during the 9 site audits which were undertaken, and summarises good practice recommendations for the activities which have been identified as high priority. Individual reports have been prepared for each site (see Appendices 1 - 9), and this section should be read in conjunction with these reports. The SFfC Water Subgroup has identified those activities expected to be ‘high priority’ i.e. the activities expected to provide the greater opportunities for water efficiency savings. These are: Table 4: High Priority Activities
Water Using Activity High Priority Activity
Dust Suppression General, site roads, wheel washes
Hydro-demolition with high pressure water
Cleaning Ready mixed concrete wagons
Site / general cleaning
Specialist / high pressure cleaning
Commissioning & Test Building plant/services
As a general comment, contractors should firstly ensure that non-mains water sources are fully utilised (where it is practical to do so) before considering how water efficiency on site can be improved. For example, abstracting water from rivers, Sustainable Urban Drainage Systems (SUDS) or settlement lagoons on or near the site may provide water of sufficient quantity/quality for a number of water-intensive actions, such as dust suppression or wheel washing. Where using water in such a fashion, care must be taken to ensure that any legal requirements are met in the first instance (e.g. suitable abstraction licence obtained from environmental regulator). 5.1 Dust Suppression (General) The following table summarises where dust suppression (general) activities were noted/reported during the site audits: Table 5: Dust Suppression (General) Summary
Site(s) Activity Comment 1 Manual spray units Small, manually operated spray units.
Area not deemed a high priority - current water consumption and potential for water savings deemed low. As such, this activity will not be discussed further here.
2 Block cutting Worker manually pours water from a bucket whilst block cutting is occurring. Area not deemed a high priority - current water consumption and potential for water savings deemed low. As such, this activity will not be discussed further here.
6, 7 Rain guns High capacity rain guns are generally used to suppress dust from stockpiles, building demolition, etc. Although this was not observed during any of the site audits, photograph evidence has been viewed for sites 6 and 7. This is a high priority area with potential for significant water savings, and is discussed further below.
15
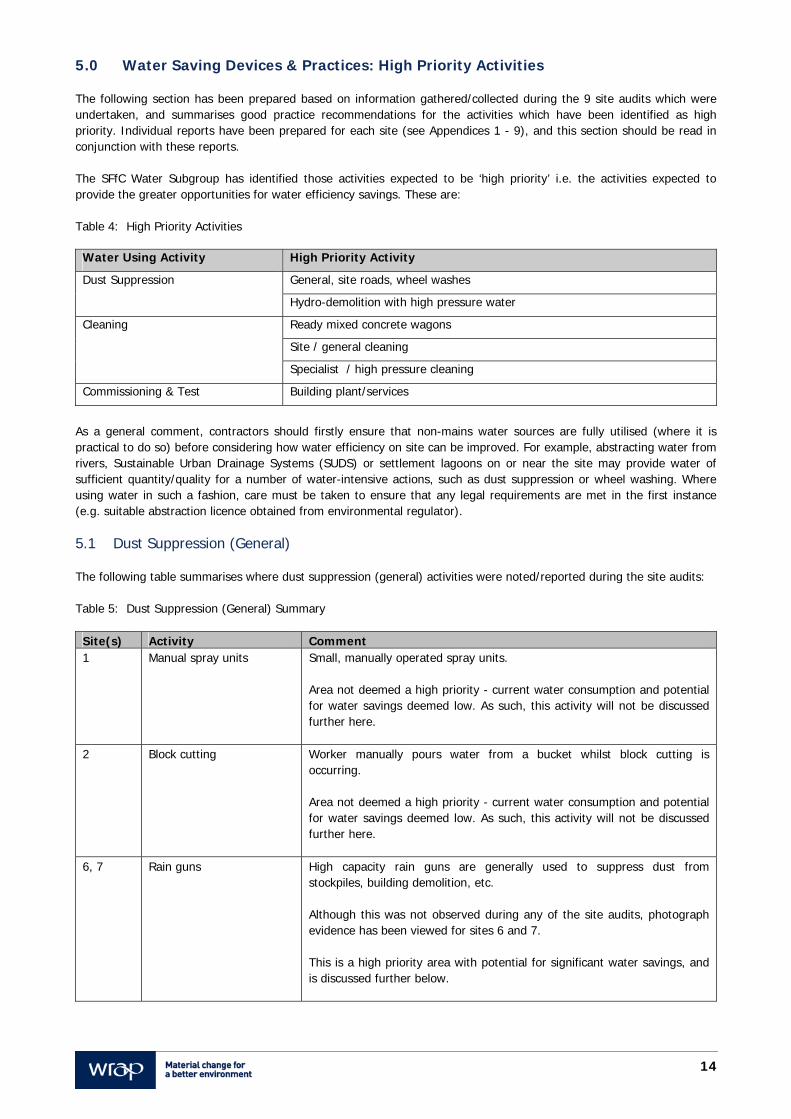
5.1.1 Rain Guns Rain guns are generally simple in operation - water is fired at a high velocity from the back of a water bowser over the targeted area in order to suppress dust. The following photograph relates to operation of a rain gun at site 6:
Image 4: Rain Gun Operation
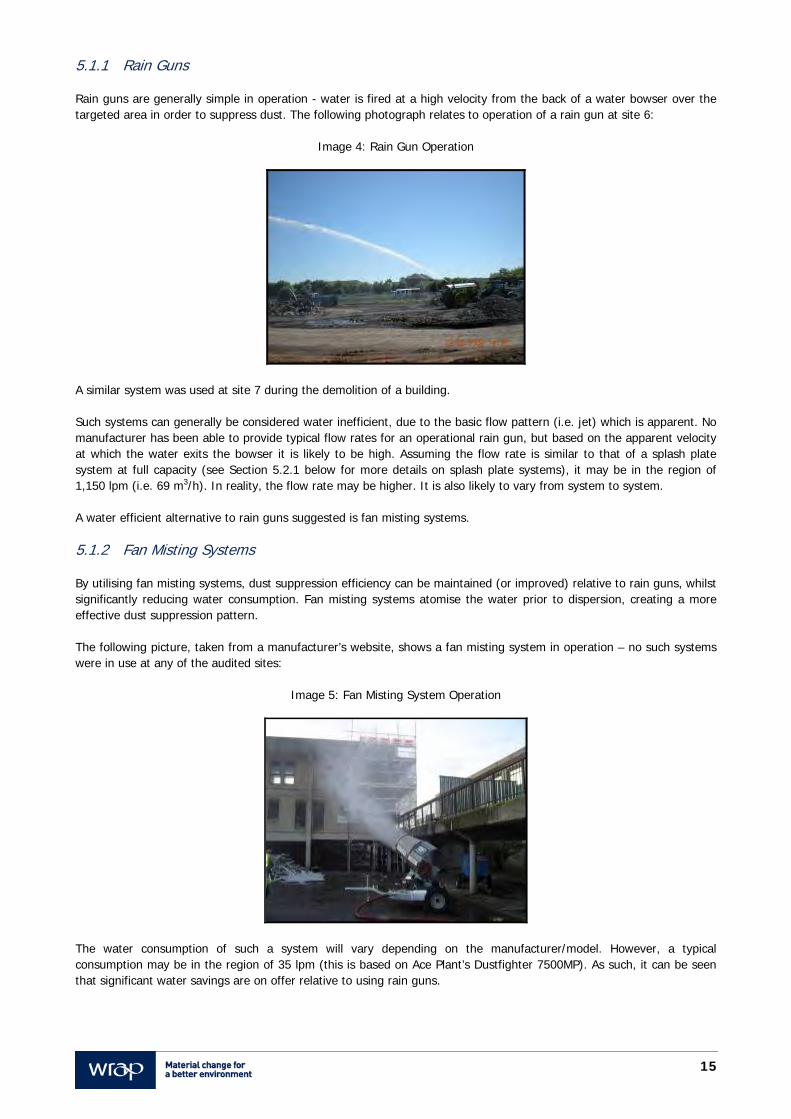
A similar system was used at site 7 during the demolition of a building. Such systems can generally be considered water inefficient, due to the basic flow pattern (i.e. jet) which is apparent. No manufacturer has been able to provide typical flow rates for an operational rain gun, but based on the apparent velocity at which the water exits the bowser it is likely to be high. Assuming the flow rate is similar to that of a splash plate system at full capacity (see Section 5.2.1 below for more details on splash plate systems), it may be in the region of 1,150 lpm (i.e. 69 m3/h). In reality, the flow rate may be higher. It is also likely to vary from system to system. A water efficient alternative to rain guns suggested is fan misting systems. 5.1.2 Fan Misting Systems By utilising fan misting systems, dust suppression efficiency can be maintained (or improved) relative to rain guns, whilst significantly reducing water consumption. Fan misting systems atomise the water prior to dispersion, creating a more effective dust suppression pattern. The following picture, taken from a manufacturer’s website, shows a fan misting system in operation – no such systems were in use at any of the audited sites:
Image 5: Fan Misting System Operation
The water consumption of such a system will vary depending on the manufacturer/model. However, a typical consumption may be in the region of 35 lpm (this is based on Ace Plant’s Dustfighter 7500MP). As such, it can be seen that significant water savings are on offer relative to using rain guns.
16
The disadvantages of fan misting systems, relative to rain guns, may include: More expensive to hire/purchase. Power connection required, and so they are less mobile. Mains quality water likely required (i.e. no river, SUDS or settlement lagoon water to be used). 5.2 Dust Suppression (Site Roads) The following table summarises where dust suppression (site roads) activities were noted/reported during the site audits: Table 6: Dust Suppression (Site Roads) Summary
Sites Activity Comment 3, 6 Dust Suppression Vehicles Dust suppression vehicles with splash plate operation were in use at sites
3 and 6 (though not on the day of the audit). Generally, splash plate systems are water inefficient, due to the rudimentary flow pattern of the water. An operator from site 3 advised that SUDS water is used for their dust suppression vehicles, and that they vary the water output from their vehicle based on road conditions at the time. As such, although water inefficient splash plate systems are in use, there is no opportunity for mains water savings in this instance. Site 6 either use river water or mains water for their dust suppression vehicles. No operator was available in order to discuss specific operating methodology. Where mains water is used, dust suppression vehicles with splash plate operation are a high priority area with potential for significant savings, and are discussed further below.
3, 4, 6 Road Sweepers Road sweepers were observed to be in use at sites 3 and 6, and were reported (but not observed) at site 4. The operator at site 3 reported that he only uses water for dust suppression when road conditions require it, and that he also can control the water output (high and low pressure settings available). The operator at site 6 reported that he also has high and low pressure settings, and will typically operate on the low pressure setting. There is the potential to significantly reduce the water consumption of road sweepers through improved technology. However, it is suggested that further investigation is required to ascertain the magnitude of road sweeper water consumption, to better understand whether it is a high priority area.
17
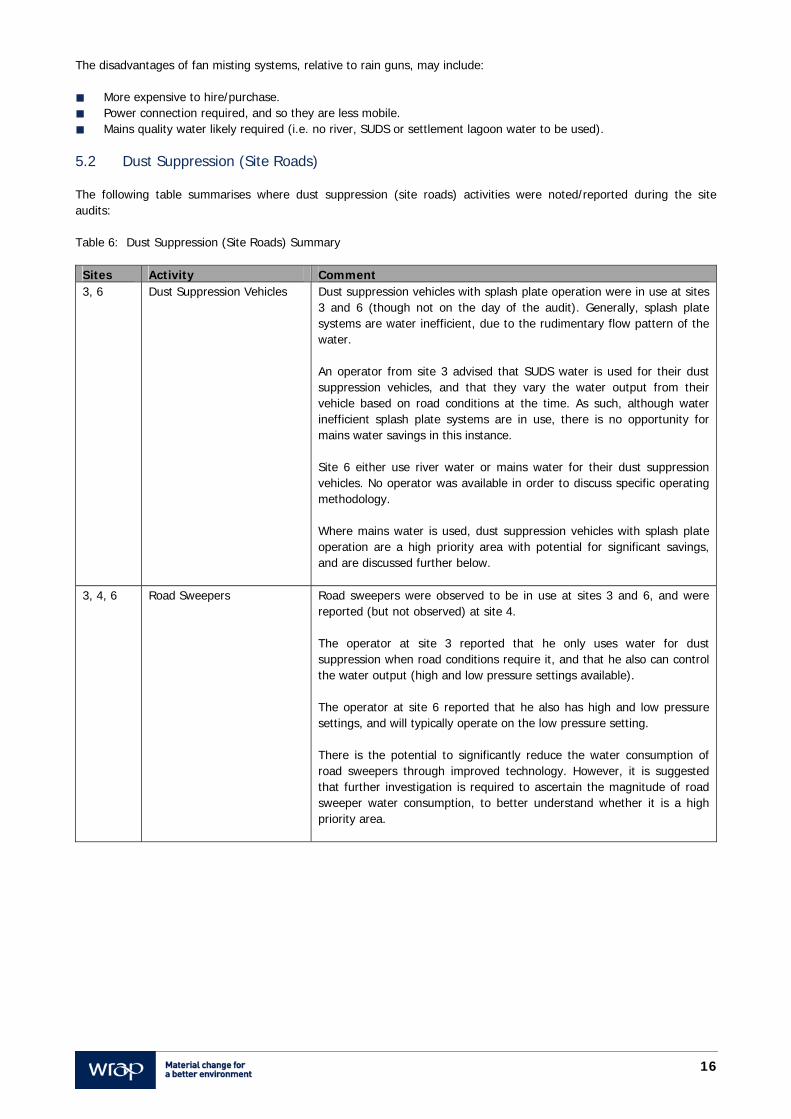
5.2.1 Dust Suppression Vehicles (Splash Plate Operation) Based on observations made during the site audits, as well as discussions with various contacts in the marketplace, splash plate operation appears to be the most popular system-type for vehicular dust suppression. These rudimentary systems will typically direct high pressure (i.e. pumped) water against a flat metal plate at the rear of the vehicle to create an outward spray pattern for dust suppression - see picture below:
Image 6: Splash Plate Operation
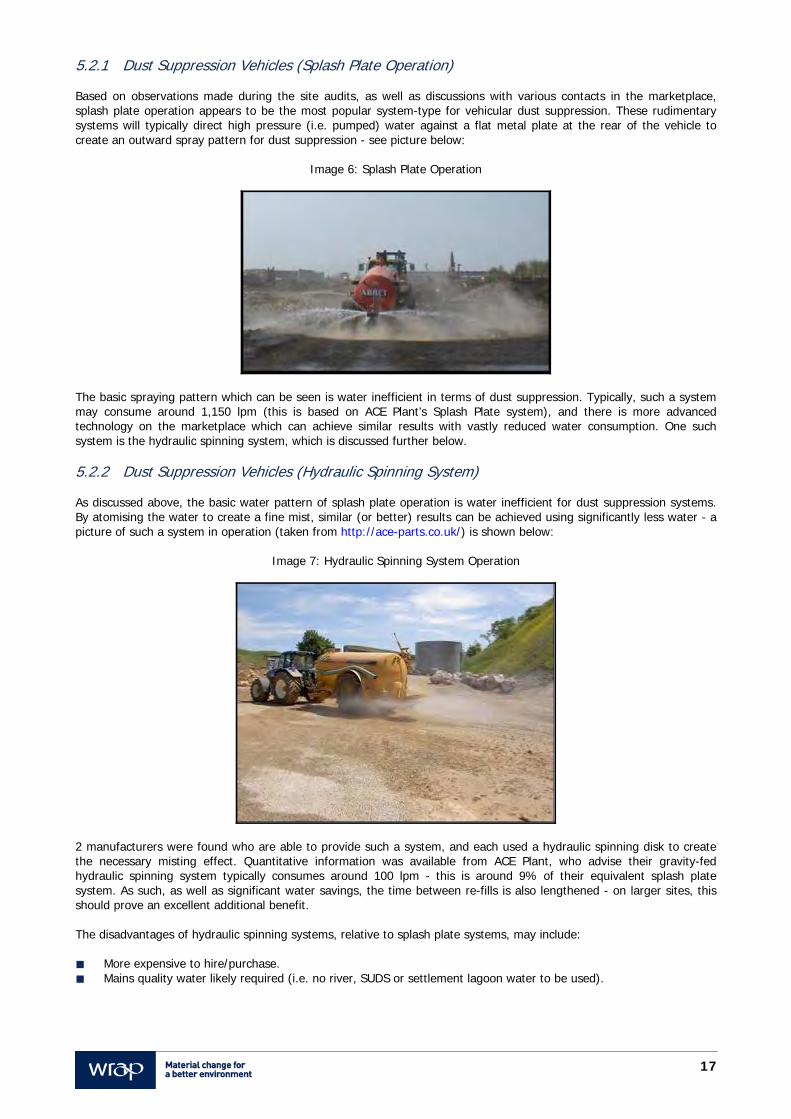
The basic spraying pattern which can be seen is water inefficient in terms of dust suppression. Typically, such a system may consume around 1,150 lpm (this is based on ACE Plant’s Splash Plate system), and there is more advanced technology on the marketplace which can achieve similar results with vastly reduced water consumption. One such system is the hydraulic spinning system, which is discussed further below. 5.2.2 Dust Suppression Vehicles (Hydraulic Spinning System) As discussed above, the basic water pattern of splash plate operation is water inefficient for dust suppression systems. By atomising the water to create a fine mist, similar (or better) results can be achieved using significantly less water - a picture of such a system in operation (taken from http://ace-parts.co.uk/) is shown below:
Image 7: Hydraulic Spinning System Operation
2 manufacturers were found who are able to provide such a system, and each used a hydraulic spinning disk to create the necessary misting effect. Quantitative information was available from ACE Plant, who advise their gravity-fed hydraulic spinning system typically consumes around 100 lpm - this is around 9% of their equivalent splash plate system. As such, as well as significant water savings, the time between re-fills is also lengthened - on larger sites, this should prove an excellent additional benefit. The disadvantages of hydraulic spinning systems, relative to splash plate systems, may include: More expensive to hire/purchase. Mains quality water likely required (i.e. no river, SUDS or settlement lagoon water to be used).
18
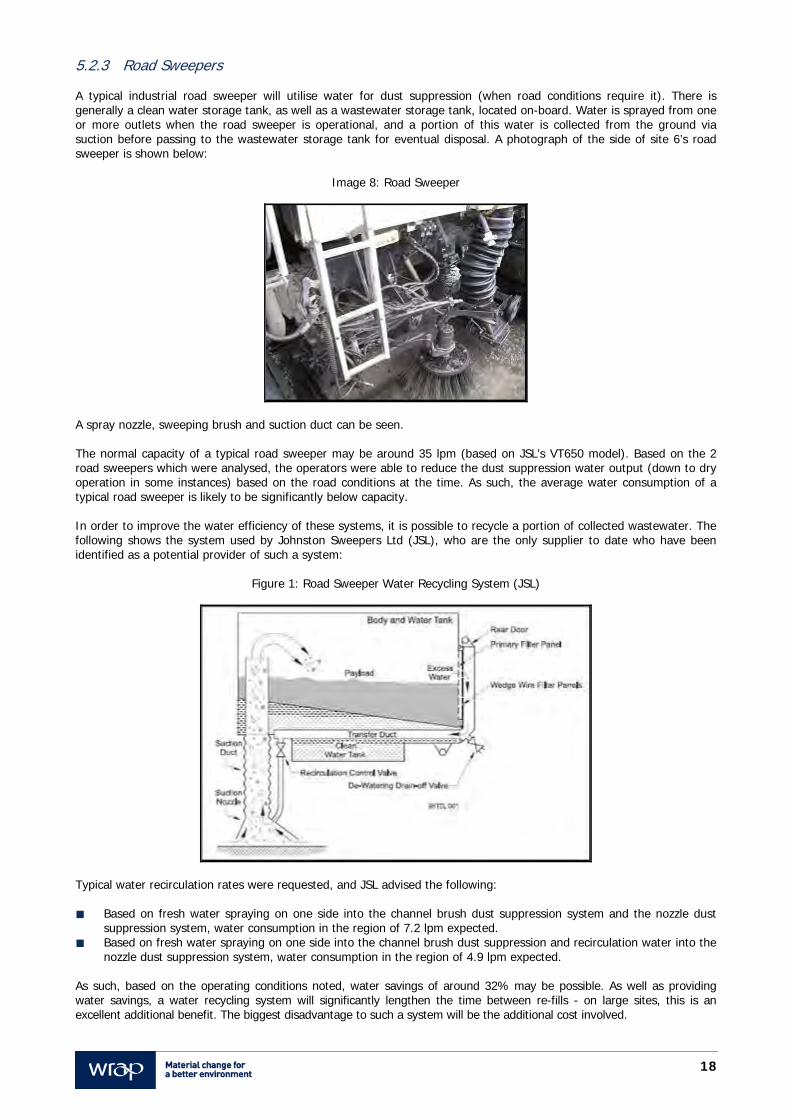
5.2.3 Road Sweepers A typical industrial road sweeper will utilise water for dust suppression (when road conditions require it). There is generally a clean water storage tank, as well as a wastewater storage tank, located on-board. Water is sprayed from one or more outlets when the road sweeper is operational, and a portion of this water is collected from the ground via suction before passing to the wastewater storage tank for eventual disposal. A photograph of the side of site 6’s road sweeper is shown below:
Image 8: Road Sweeper
A spray nozzle, sweeping brush and suction duct can be seen. The normal capacity of a typical road sweeper may be around 35 lpm (based on JSL’s VT650 model). Based on the 2 road sweepers which were analysed, the operators were able to reduce the dust suppression water output (down to dry operation in some instances) based on the road conditions at the time. As such, the average water consumption of a typical road sweeper is likely to be significantly below capacity. In order to improve the water efficiency of these systems, it is possible to recycle a portion of collected wastewater. The following shows the system used by Johnston Sweepers Ltd (JSL), who are the only supplier to date who have been identified as a potential provider of such a system:
Figure 1: Road Sweeper Water Recycling System (JSL)
Typical water recirculation rates were requested, and JSL advised the following: Based on fresh water spraying on one side into the channel brush dust suppression system and the nozzle dust
suppression system, water consumption in the region of 7.2 lpm expected. Based on fresh water spraying on one side into the channel brush dust suppression and recirculation water into the
nozzle dust suppression system, water consumption in the region of 4.9 lpm expected. As such, based on the operating conditions noted, water savings of around 32% may be possible. As well as providing water savings, a water recycling system will significantly lengthen the time between re-fills - on large sites, this is an excellent additional benefit. The biggest disadvantage to such a system will be the additional cost involved.
19
5.2.4 Hard-standing Ground Where feasible, the contractor should look to implement hard-standing roads, car parks, etc. across the site. In addition, this should be done as early in the project as is practical. This should assist in reducing dust suppression requirements (and thus water consumption) over the duration of the project. 5.3 Dust Suppression (Wheel Wash) Note - the primary use of water in the following wheel wash systems is not for dust suppression, but is included in the dust suppression section to remain consistent with WRAP’s previous publications. The following table summarises where dust suppression (wheel wash) activities were noted/reported: Table 7: Dust Suppression (Wheel Wash) Summary
Site Activity Comment 3 High Pressure Washer Site 3 was the only site where a manually operated wheel wash system was in
operation. A high pressure washer was used to clean wheels, and also the general exterior of the vehicle. All water was collected in a sump, before passing to drain - no recycling of water took place.
This is a high priority area with potential for significant water savings, and is discussed further below.
4, 5, 6 Drive-on Wheel Wash Drive-on wheel washing was observed in operation at site 5.
Although wheel washing systems were noted at sites 4 and 6, neither system was in use on the day of the audit.
The standard set-up of the drive-on wheel wash systems typically followed a standard format, which incorporated a settlement tank and a recycling system. However, both good practice (site 4) and poor practice (site 5) was noted.
This is a high priority area with potential for significant water savings, and is discussed further below.
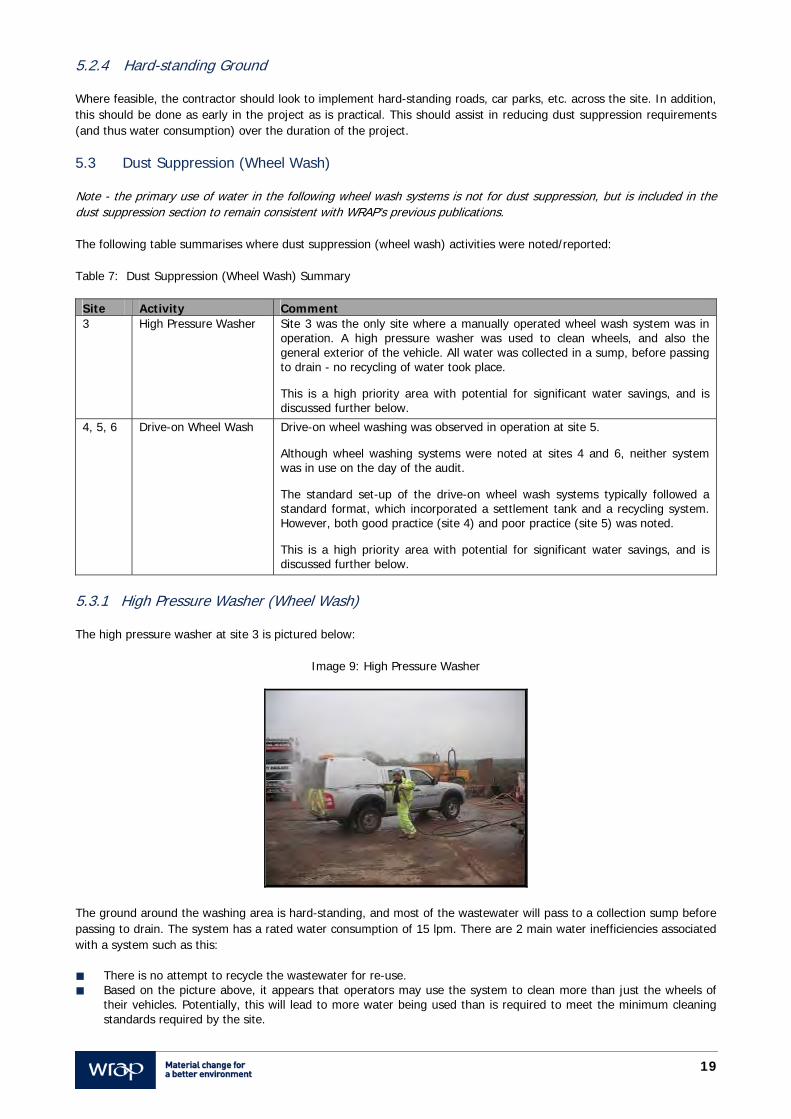
5.3.1 High Pressure Washer (Wheel Wash) The high pressure washer at site 3 is pictured below:
Image 9: High Pressure Washer
The ground around the washing area is hard-standing, and most of the wastewater will pass to a collection sump before passing to drain. The system has a rated water consumption of 15 lpm. There are 2 main water inefficiencies associated with a system such as this: There is no attempt to recycle the wastewater for re-use. Based on the picture above, it appears that operators may use the system to clean more than just the wheels of
their vehicles. Potentially, this will lead to more water being used than is required to meet the minimum cleaning standards required by the site.
20
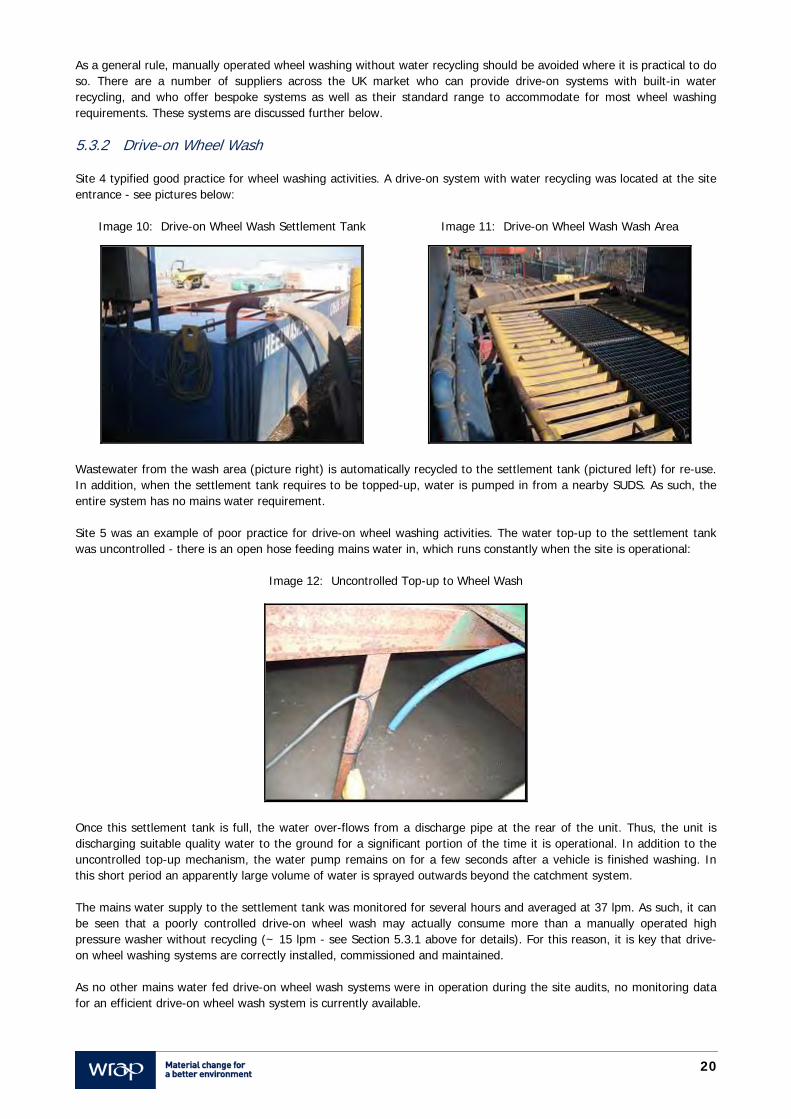
As a general rule, manually operated wheel washing without water recycling should be avoided where it is practical to do so. There are a number of suppliers across the UK market who can provide drive-on systems with built-in water recycling, and who offer bespoke systems as well as their standard range to accommodate for most wheel washing requirements. These systems are discussed further below. 5.3.2 Drive-on Wheel Wash Site 4 typified good practice for wheel washing activities. A drive-on system with water recycling was located at the site entrance - see pictures below:
Image 10: Drive-on Wheel Wash Settlement Tank Image 11: Drive-on Wheel Wash Wash Area
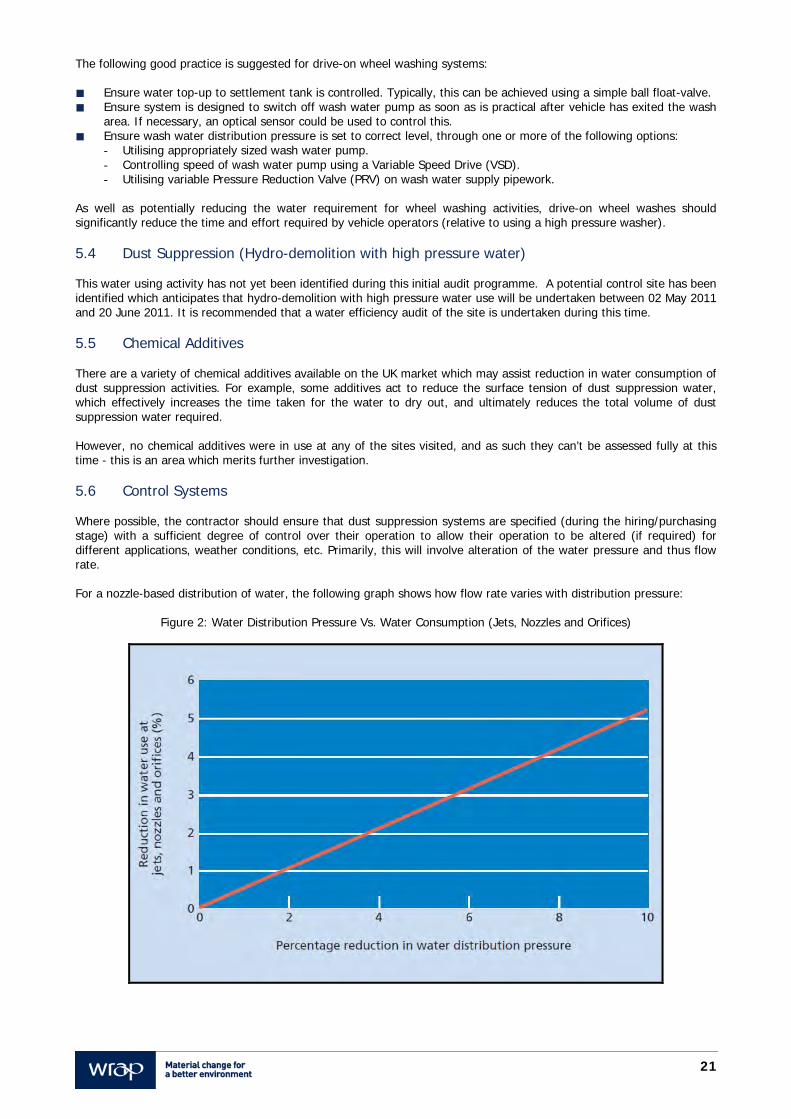
Wastewater from the wash area (picture right) is automatically recycled to the settlement tank (pictured left) for re-use. In addition, when the settlement tank requires to be topped-up, water is pumped in from a nearby SUDS. As such, the entire system has no mains water requirement. Site 5 was an example of poor practice for drive-on wheel washing activities. The water top-up to the settlement tank was uncontrolled - there is an open hose feeding mains water in, which runs constantly when the site is operational:
Image 12: Uncontrolled Top-up to Wheel Wash
Once this settlement tank is full, the water over-flows from a discharge pipe at the rear of the unit. Thus, the unit is discharging suitable quality water to the ground for a significant portion of the time it is operational. In addition to the uncontrolled top-up mechanism, the water pump remains on for a few seconds after a vehicle is finished washing. In this short period an apparently large volume of water is sprayed outwards beyond the catchment system. The mains water supply to the settlement tank was monitored for several hours and averaged at 37 lpm. As such, it can be seen that a poorly controlled drive-on wheel wash may actually consume more than a manually operated high pressure washer without recycling (~ 15 lpm - see Section 5.3.1 above for details). For this reason, it is key that drive-on wheel washing systems are correctly installed, commissioned and maintained. As no other mains water fed drive-on wheel wash systems were in operation during the site audits, no monitoring data for an efficient drive-on wheel wash system is currently available.
21
The following good practice is suggested for drive-on wheel washing systems: Ensure water top-up to settlement tank is controlled. Typically, this can be achieved using a simple ball float-valve. Ensure system is designed to switch off wash water pump as soon as is practical after vehicle has exited the wash
area. If necessary, an optical sensor could be used to control this. Ensure wash water distribution pressure is set to correct level, through one or more of the following options:
- Utilising appropriately sized wash water pump. - Controlling speed of wash water pump using a Variable Speed Drive (VSD). - Utilising variable Pressure Reduction Valve (PRV) on wash water supply pipework.
As well as potentially reducing the water requirement for wheel washing activities, drive-on wheel washes should significantly reduce the time and effort required by vehicle operators (relative to using a high pressure washer). 5.4 Dust Suppression (Hydro-demolition with high pressure water) This water using activity has not yet been identified during this initial audit programme. A potential control site has been identified which anticipates that hydro-demolition with high pressure water use will be undertaken between 02 May 2011 and 20 June 2011. It is recommended that a water efficiency audit of the site is undertaken during this time. 5.5 Chemical Additives There are a variety of chemical additives available on the UK market which may assist reduction in water consumption of dust suppression activities. For example, some additives act to reduce the surface tension of dust suppression water, which effectively increases the time taken for the water to dry out, and ultimately reduces the total volume of dust suppression water required. However, no chemical additives were in use at any of the sites visited, and as such they can’t be assessed fully at this time - this is an area which merits further investigation. 5.6 Control Systems Where possible, the contractor should ensure that dust suppression systems are specified (during the hiring/purchasing stage) with a sufficient degree of control over their operation to allow their operation to be altered (if required) for different applications, weather conditions, etc. Primarily, this will involve alteration of the water pressure and thus flow rate. For a nozzle-based distribution of water, the following graph shows how flow rate varies with distribution pressure:
Figure 2: Water Distribution Pressure Vs. Water Consumption (Jets, Nozzles and Orifices)
22
The following table provides some examples of situations where additional control of dust suppression systems may lead to water savings: Table 8: Dust Suppression System Additional Control Examples
System Comment Rain Guns Consider that a rain gun is used for dust suppression during building demolition. The next time
it is to be used, it is required to suppress dust from a stockpile, which may require a significantly different volume of dust suppression water.
If the pressure is variable, the rain gun will be suited to a greater number of applications, which should help minimise water waste.
Dust Suppression Vehicles (Splash Plate)
The flow rate of water required for dust suppression vehicles with splash plate operation will vary, depending on factors such as road width and weather. As such, if the water pressure can be varied, water wastage can be minimised.
Drive-on Wheel Wash
The level of wheel washing required is likely to vary depending on the weather and site conditions. A typical drive-on wheel wash systems may be designed on a ‘worst-case’ basis (i.e. it is capable of cleaning extremely dirty wheels). However, this level of cleaning may not be required in most instances. As such, by allowing variation in the wash water distribution pressure, water savings should be possible.
5.7 Cleaning (Ready Mixed Concrete Wagons) The following table summarises where cleaning of ready mixed concrete wagons was noted/reported: Table 9: Cleaning (Ready Mixed Concrete Wagons) Summary
Site Activity Comment 3 Cleaning concrete wagons Site 3 had a concrete batching plant on site. Concrete wagons were
washed internally at this area, prior to be being filled with concrete from the plant. Additionally, concrete wagons are washed externally after they have been filled. Wastewater is collected in a sump, and a portion of this wastewater is used as ingredient in the concrete batching process.
Cleaning of concrete wagons is a high priority area, and site 3 shows both good and poor practice in this respect - this is discussed further below.
7 Cleaning concrete wagons (externally only)
Site 7 has an on site agitator (i.e. stationary concrete wagon), which is regularly filled with concrete (via mobile concrete wagons) from a local concrete batching plant. Cleaning operations on site were limited to:
Third party mobile concrete wagons cleaning in and around their vehicle’s delivery chute, after delivering concrete into agitator. Each wagon had its own water tank and hose in order to undertake these cleaning operations.
Cleaning concrete waste from around agitator area, using a hose or pressure washer associated with the system.
Cleaning operations at site 7 could be improved, though they are relatively small scale - most of the cleaning water in this instance will be associated with the mobile concrete wagons, once they get back to the batching plant (i.e. when cleaning wagon internally). As such, site 7 will not be discussed further below.
The concrete batching plant at site 3 consumes around 91.6 m3/week of water (average figure based on available meter data), and this water is associated with the following applications: Ingredient water used in concrete batching process. Mains pressure hose for washing concrete wagons. High pressure washer for cleaning batching plant ‘rotating heads’. The current split of water consumption between each application is currently unknown.
23
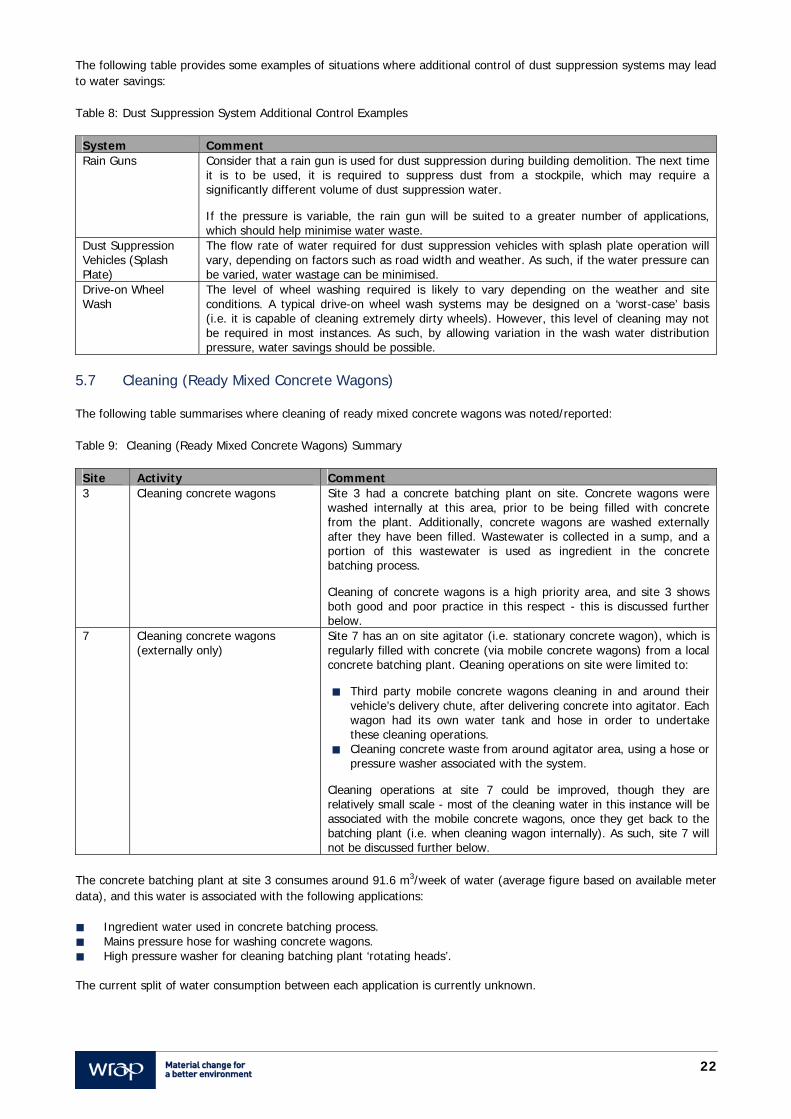
Filling of a concrete wagon is shown below:
Image 13: Concrete Wagon Filling
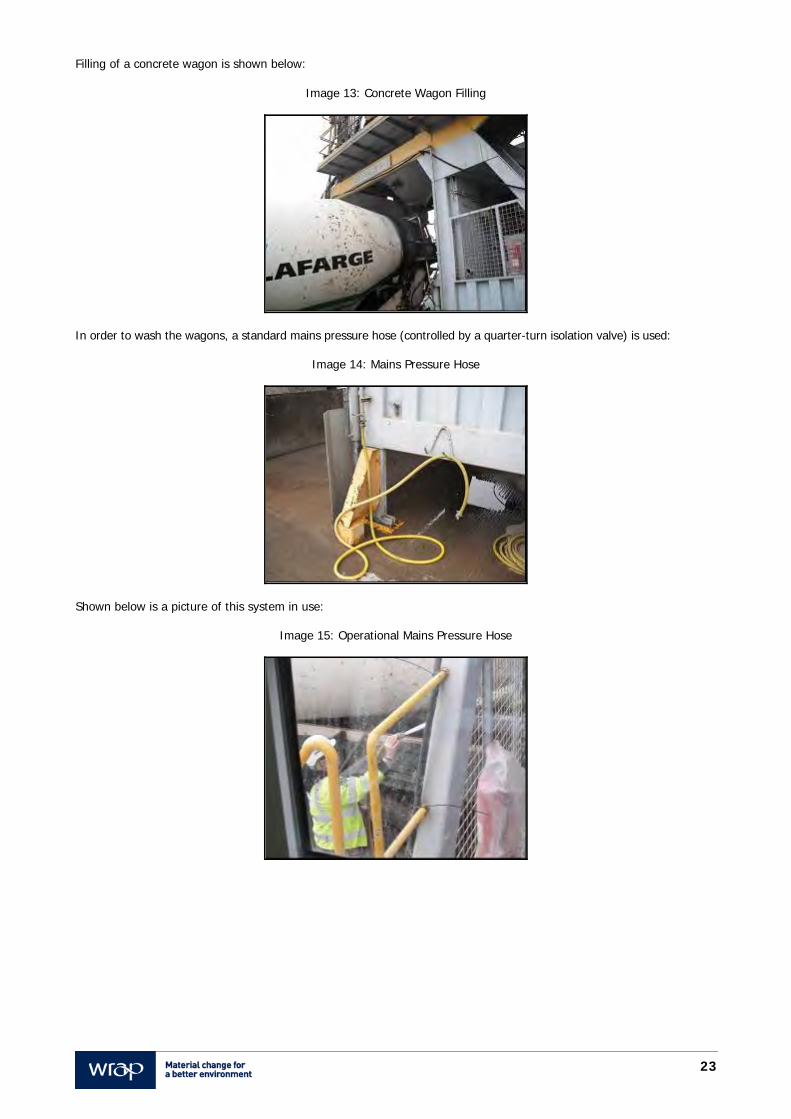
In order to wash the wagons, a standard mains pressure hose (controlled by a quarter-turn isolation valve) is used:
Image 14: Mains Pressure Hose
Shown below is a picture of this system in use:
Image 15: Operational Mains Pressure Hose
24
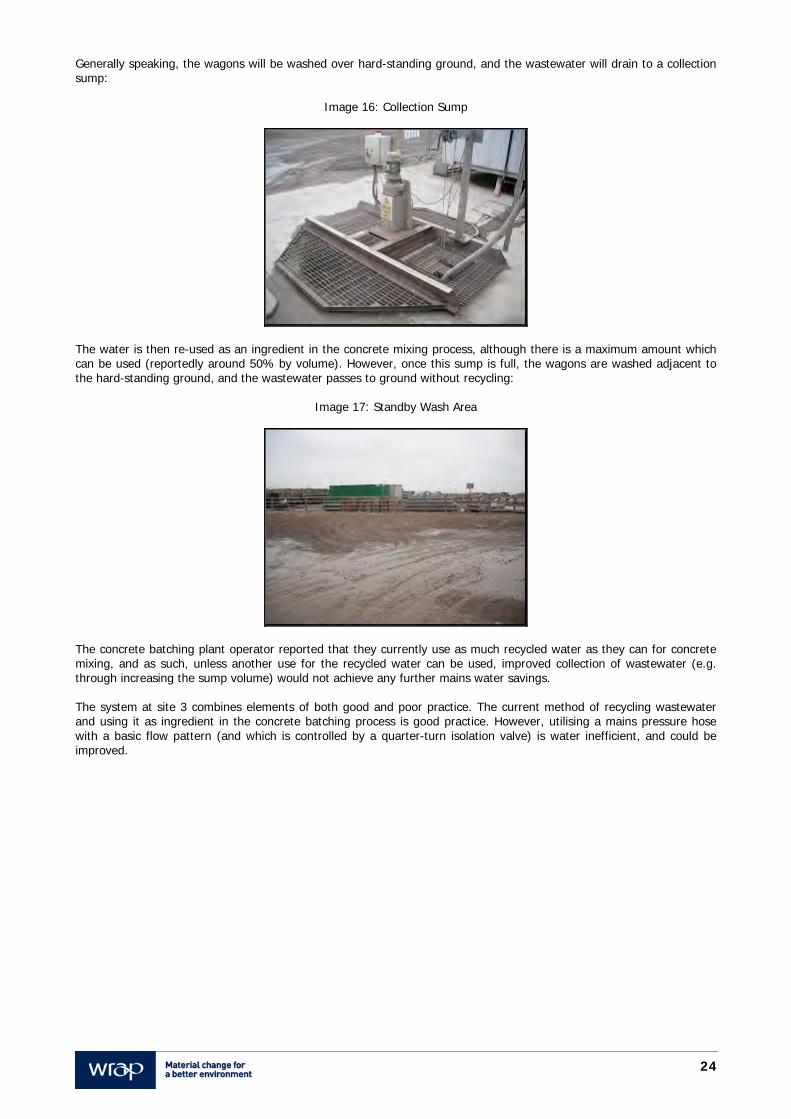
Generally speaking, the wagons will be washed over hard-standing ground, and the wastewater will drain to a collection sump:
Image 16: Collection Sump
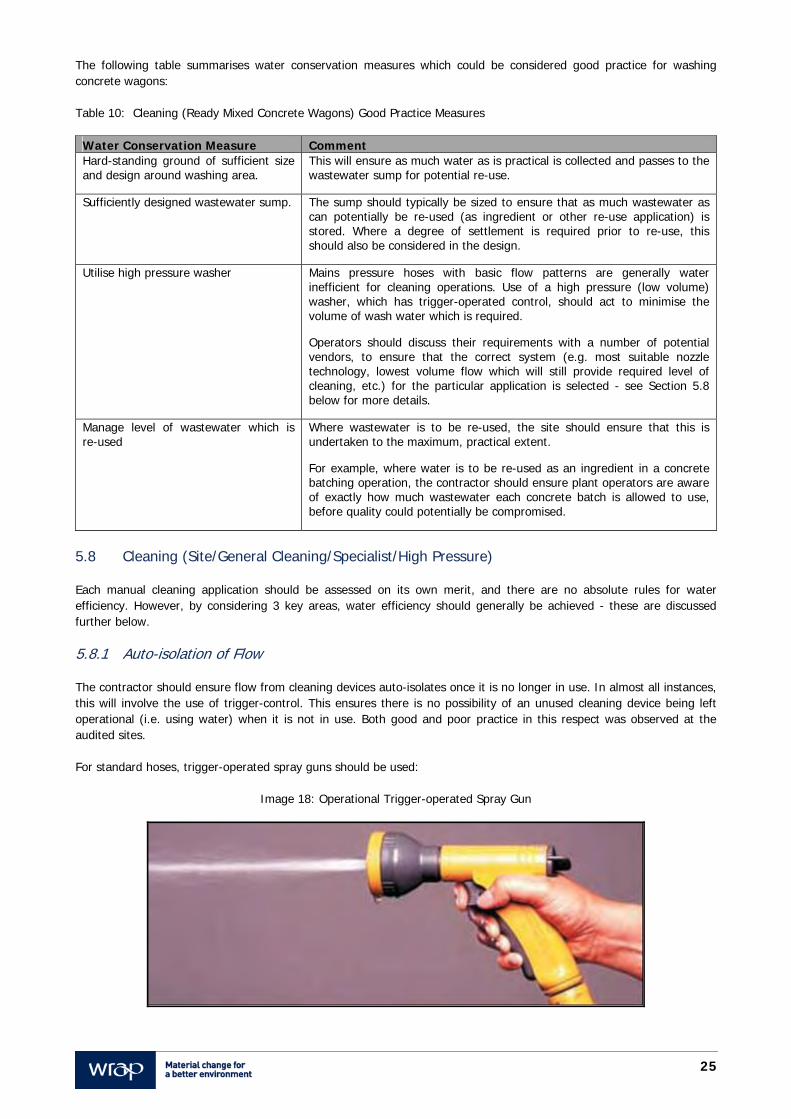
The water is then re-used as an ingredient in the concrete mixing process, although there is a maximum amount which can be used (reportedly around 50% by volume). However, once this sump is full, the wagons are washed adjacent to the hard-standing ground, and the wastewater passes to ground without recycling:
Image 17: Standby Wash Area
The concrete batching plant operator reported that they currently use as much recycled water as they can for concrete mixing, and as such, unless another use for the recycled water can be used, improved collection of wastewater (e.g. through increasing the sump volume) would not achieve any further mains water savings. The system at site 3 combines elements of both good and poor practice. The current method of recycling wastewater and using it as ingredient in the concrete batching process is good practice. However, utilising a mains pressure hose with a basic flow pattern (and which is controlled by a quarter-turn isolation valve) is water inefficient, and could be improved.
25
The following table summarises water conservation measures which could be considered good practice for washing concrete wagons: Table 10: Cleaning (Ready Mixed Concrete Wagons) Good Practice Measures
Water Conservation Measure Comment Hard-standing ground of sufficient size and design around washing area.
This will ensure as much water as is practical is collected and passes to the wastewater sump for potential re-use.
Sufficiently designed wastewater sump. The sump should typically be sized to ensure that as much wastewater as can potentially be re-used (as ingredient or other re-use application) is stored. Where a degree of settlement is required prior to re-use, this should also be considered in the design.
Utilise high pressure washer Mains pressure hoses with basic flow patterns are generally water inefficient for cleaning operations. Use of a high pressure (low volume) washer, which has trigger-operated control, should act to minimise the volume of wash water which is required.
Operators should discuss their requirements with a number of potential vendors, to ensure that the correct system (e.g. most suitable nozzle technology, lowest volume flow which will still provide required level of cleaning, etc.) for the particular application is selected - see Section 5.8 below for more details.
Manage level of wastewater which is re-used
Where wastewater is to be re-used, the site should ensure that this is undertaken to the maximum, practical extent.
For example, where water is to be re-used as an ingredient in a concrete batching operation, the contractor should ensure plant operators are aware of exactly how much wastewater each concrete batch is allowed to use, before quality could potentially be compromised.
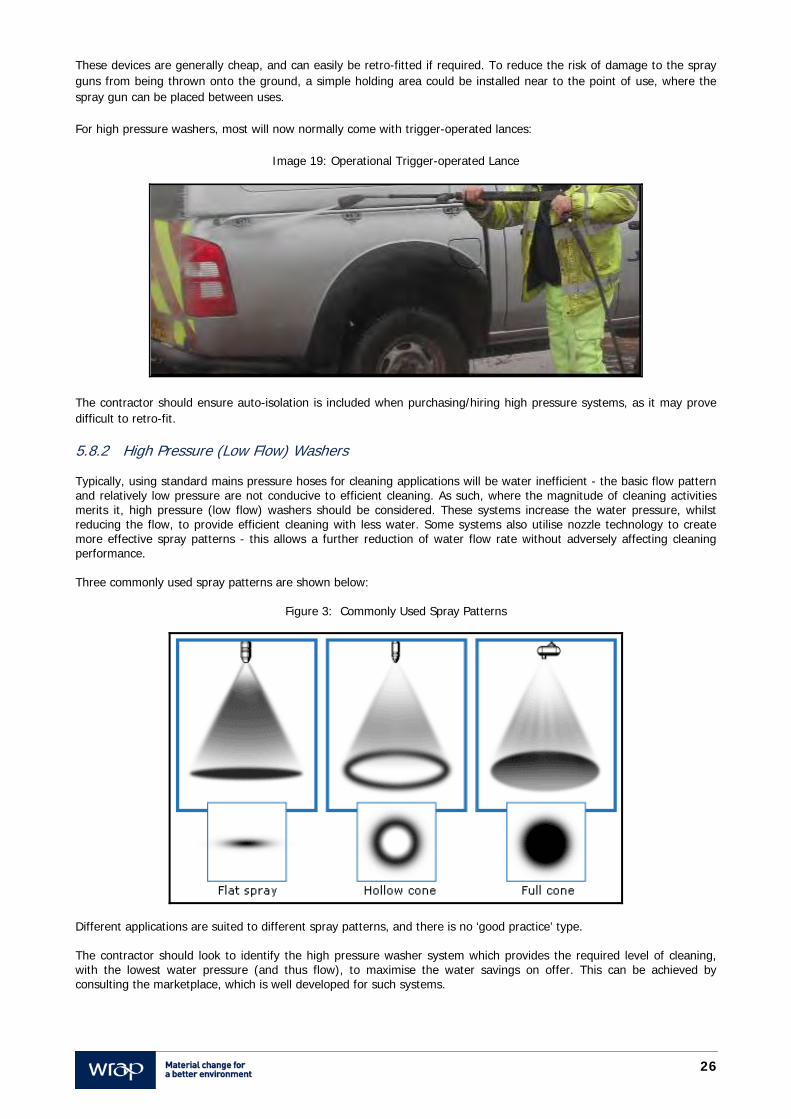
5.8 Cleaning (Site/General Cleaning/Specialist/High Pressure) Each manual cleaning application should be assessed on its own merit, and there are no absolute rules for water efficiency. However, by considering 3 key areas, water efficiency should generally be achieved - these are discussed further below. 5.8.1 Auto-isolation of Flow The contractor should ensure flow from cleaning devices auto-isolates once it is no longer in use. In almost all instances, this will involve the use of trigger-control. This ensures there is no possibility of an unused cleaning device being left operational (i.e. using water) when it is not in use. Both good and poor practice in this respect was observed at the audited sites. For standard hoses, trigger-operated spray guns should be used:
Image 18: Operational Trigger-operated Spray Gun
26
These devices are generally cheap, and can easily be retro-fitted if required. To reduce the risk of damage to the spray guns from being thrown onto the ground, a simple holding area could be installed near to the point of use, where the spray gun can be placed between uses. For high pressure washers, most will now normally come with trigger-operated lances:
Image 19: Operational Trigger-operated Lance
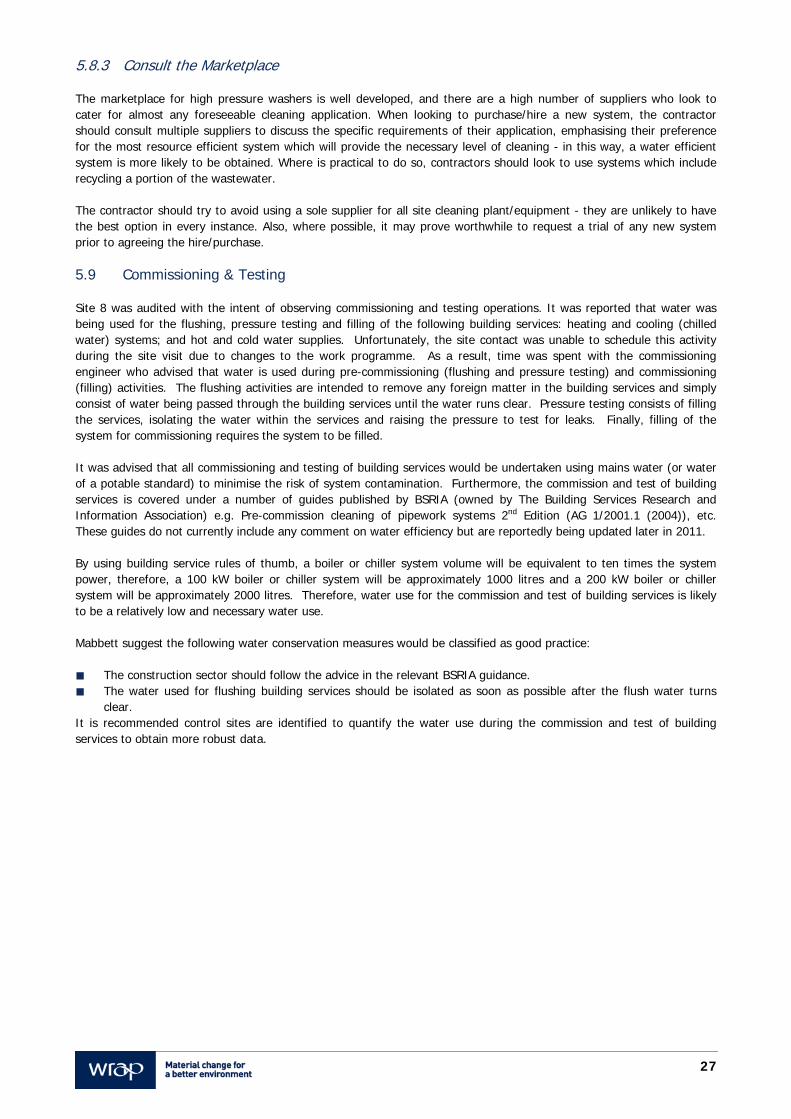
The contractor should ensure auto-isolation is included when purchasing/hiring high pressure systems, as it may prove difficult to retro-fit. 5.8.2 High Pressure (Low Flow) Washers Typically, using standard mains pressure hoses for cleaning applications will be water inefficient - the basic flow pattern and relatively low pressure are not conducive to efficient cleaning. As such, where the magnitude of cleaning activities merits it, high pressure (low flow) washers should be considered. These systems increase the water pressure, whilst reducing the flow, to provide efficient cleaning with less water. Some systems also utilise nozzle technology to create more effective spray patterns - this allows a further reduction of water flow rate without adversely affecting cleaning performance. Three commonly used spray patterns are shown below:
Figure 3: Commonly Used Spray Patterns
Different applications are suited to different spray patterns, and there is no ‘good practice’ type. The contractor should look to identify the high pressure washer system which provides the required level of cleaning, with the lowest water pressure (and thus flow), to maximise the water savings on offer. This can be achieved by consulting the marketplace, which is well developed for such systems.
27
5.8.3 Consult the Marketplace The marketplace for high pressure washers is well developed, and there are a high number of suppliers who look to cater for almost any foreseeable cleaning application. When looking to purchase/hire a new system, the contractor should consult multiple suppliers to discuss the specific requirements of their application, emphasising their preference for the most resource efficient system which will provide the necessary level of cleaning - in this way, a water efficient system is more likely to be obtained. Where is practical to do so, contractors should look to use systems which include recycling a portion of the wastewater. The contractor should try to avoid using a sole supplier for all site cleaning plant/equipment - they are unlikely to have the best option in every instance. Also, where possible, it may prove worthwhile to request a trial of any new system prior to agreeing the hire/purchase. 5.9 Commissioning & Testing Site 8 was audited with the intent of observing commissioning and testing operations. It was reported that water was being used for the flushing, pressure testing and filling of the following building services: heating and cooling (chilled water) systems; and hot and cold water supplies. Unfortunately, the site contact was unable to schedule this activity during the site visit due to changes to the work programme. As a result, time was spent with the commissioning engineer who advised that water is used during pre-commissioning (flushing and pressure testing) and commissioning (filling) activities. The flushing activities are intended to remove any foreign matter in the building services and simply consist of water being passed through the building services until the water runs clear. Pressure testing consists of filling the services, isolating the water within the services and raising the pressure to test for leaks. Finally, filling of the system for commissioning requires the system to be filled. It was advised that all commissioning and testing of building services would be undertaken using mains water (or water of a potable standard) to minimise the risk of system contamination. Furthermore, the commission and test of building services is covered under a number of guides published by BSRIA (owned by The Building Services Research and Information Association) e.g. Pre-commission cleaning of pipework systems 2nd Edition (AG 1/2001.1 (2004)), etc. These guides do not currently include any comment on water efficiency but are reportedly being updated later in 2011. By using building service rules of thumb, a boiler or chiller system volume will be equivalent to ten times the system power, therefore, a 100 kW boiler or chiller system will be approximately 1000 litres and a 200 kW boiler or chiller system will be approximately 2000 litres. Therefore, water use for the commission and test of building services is likely to be a relatively low and necessary water use. Mabbett suggest the following water conservation measures would be classified as good practice: The construction sector should follow the advice in the relevant BSRIA guidance. The water used for flushing building services should be isolated as soon as possible after the flush water turns
clear. It is recommended control sites are identified to quantify the water use during the commission and test of building services to obtain more robust data.
28
6.0 Water Saving Devices & Practices: Low Priority Activities As in Section 5 above, the following section has been prepared based on information gathered/collected during the 9 site audits which were undertaken. Individual reports have been prepared for each site (see Appendices 1 - 9), and this section should be read in conjunction with these reports. The SFfC Water Subgroup has identified those activities expected to be ‘lower priority’ i.e. the activities originally anticipated to provide less opportunity for water efficiency savings, than those high priority activities noted in Section 5. The activities considered of lower priority are: Table 11: Lower Priority Activities
Water Using Activity Lower Priority Activity Site Cabins/Temporary Accommodation Toilets, catering, washing (personnel)
General Site Activities Tool washing Rinsing
Wet Trades
Brick/blockwork Screening Concreting Plastering Core Boring Lightweight Roofing Ceramic Tile Bentonite Mixing Rendering
Groundworks Grouting Drilling/Piling
Cleaning Cleaning Tools and Small Equipment Plant and Equipment Paintbrush Washing
These activities are discussed further below. 6.1 Site Cabins/Temporary Accommodation This water using activity was identified during all of the site audits and comprises of various individual water using activities to include: toilets, wash hand basins, urinal flush, showers, catering and food preparation. It is important to note that Mabbett has identified that the water use associated with site cabins/temporary accommodation is likely to be a significant water using activity and should be considered by the SFfC Water Subgroup to be a high priority activity. While this area may generally be perceived as a low water use, it is the one constant during all phases of a construction project, and findings to date suggest it will account for a significant portion of a site’s total water consumption. Each water using application is discussed further below. When installing domestic/welfare water savings devices, contractors should refer to the Water Technology List (WTL) in the first instance - more information can be found at:
http://envirowise.wrap.org.uk/uk/Topics-and-Issues/Water/Key-Issues/Water-Technology-List.html The WTL not only ensures products are of a certain quality, but allows companies to reclaim 100% first year capital allowances through the Enhanced Capital Allowance (ECA) Scheme. Technologies currently on the WTL include: efficient showers; efficient taps; efficient toilets; flow controllers; leakage detection equipment; meters and monitoring equipment; rainwater harvesting equipment; vehicle wash water reclaim units; water efficient industrial cleaning equipment; and wastewater recovery and re-use systems.
29
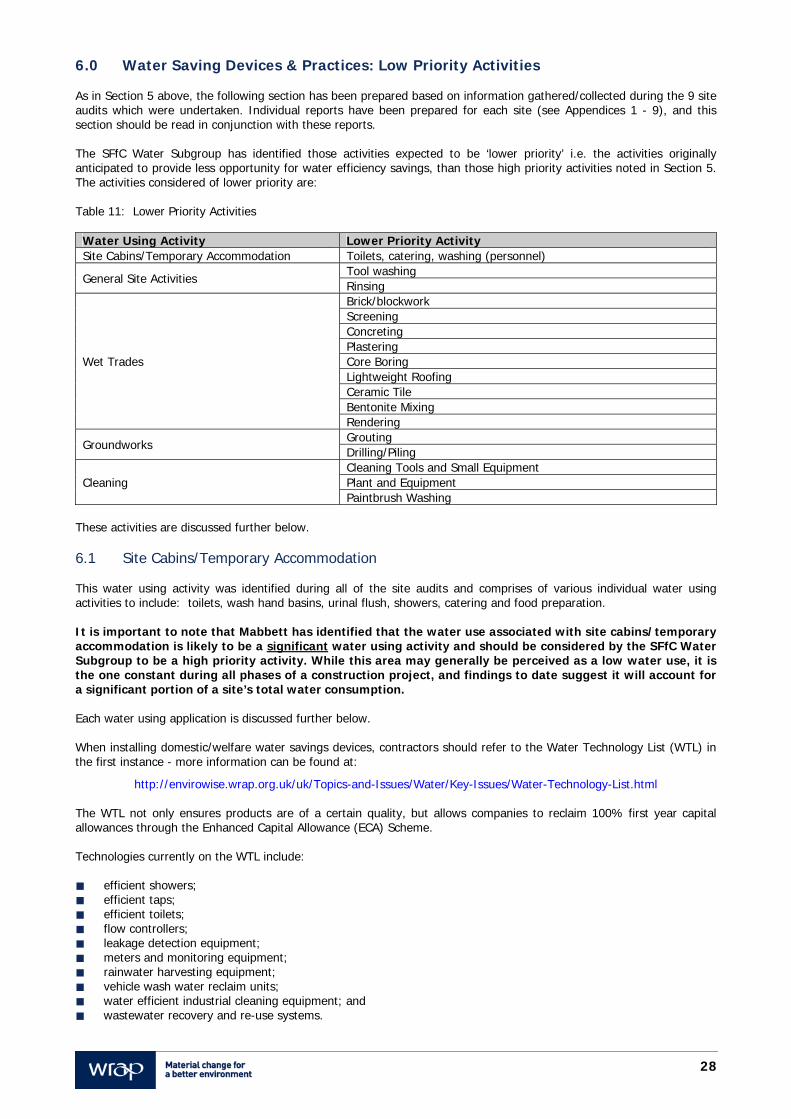
6.1.1 Wash Hand Basins Each Wash Hand Basin (WHBs) seen on site had a cold tap which was directly fed from mains water. Generally, the tap was controlled by a turn mechanism, though some percussion (i.e. push) systems were noted. Shown below is the most common WHB-type (i.e. multiple WHBs, with individual turn-operated cold taps, and a common instant hot water heater):
Image 20: Wash Hand Basins
The most common water efficiency problems with this sort of systems are: Flow from cold taps will vary directly with mains pressure, and will generally be too high (< 5 litres per minute is
good practice). Potential for taps to be left running for extended period (i.e. no auto-isolation of flow) for taps without percussion
mechanism. Due to basic flow pattern (i.e. no spraying) more water is required for effective cleaning. The following is recommended as good practice for WHBs: Table 12: WHBs Good Practice Measures
Recommendation Comment Pressure Reduction Valves (PRVs) Utilise variable Pressure Reduction Valves (PRVs) on feeds to WHB cold taps to set
a maximum pressure (and thus flow rate). Ideally, a small number of PRVs would serve multiple applications (e.g. a single PRV to limit the pressure to an entire toilet cabin). If installing PRVs on lines of the distribution network that feed systems with a minimum operating pressure (e.g. instant hot water heater), care should be taken that minimum pressure requirements are maintained.
The average flow from all the WHB (cold taps) which were monitored was around 10.6 lpm. Good practice is represented by <5 lpm, and as such significant savings (>50%) may be available from pressure (i.e. flow) reduction alone.
Auto-isolation device Install devices to auto-isolate flow from cold taps after a set time period (e.g. ≤5 seconds). There are a number of potential options to achieve this (e.g. motion sensors) but a simple percussion mechanism (with variable operating time) should suffice, as long as it is maintained in good working order.
A typical cold tap may be left operational for 10 - 15 seconds. As such, limiting this to 5 seconds could achieve significant water savings (>50%).
Spray taps The basic flow pattern from a standard tap is water-inefficient for hand cleaning purposes. Spray taps work by forcing water through small holes in the tap outlet, thus producing a mist or spray, which is a more effective hand cleaning pattern.
Spray taps can reduce water use by up to 60% - 70% relative to conventional taps.
Note - the spray head needs to be checked regularly for fouling from soap, grease and limescale. Also, these devices are not recommended for areas of low use because the spray head can provide favourable conditions for legionella under such conditions.
As instant hot water heaters do not generally provide mains-pressure hot water, they represent less of an opportunity for water savings.
30
6.1.2 Sinks Implementing water efficiency devices for sinks (which are typically located in canteen and office areas) is similar to that of WHBs, though the potential savings may be less. This is because activities which require a set volume of water (e.g. filling a kettle or a wash basin) will not benefit from their installation. Generally, percussion cold taps would still be recommended. PRVs would only be recommended where a significant amount of sink activity is related to actions which may potentially benefit from a reduced flow, such as: Hand washing. Dish/glass rinsing (not using a wash basin).
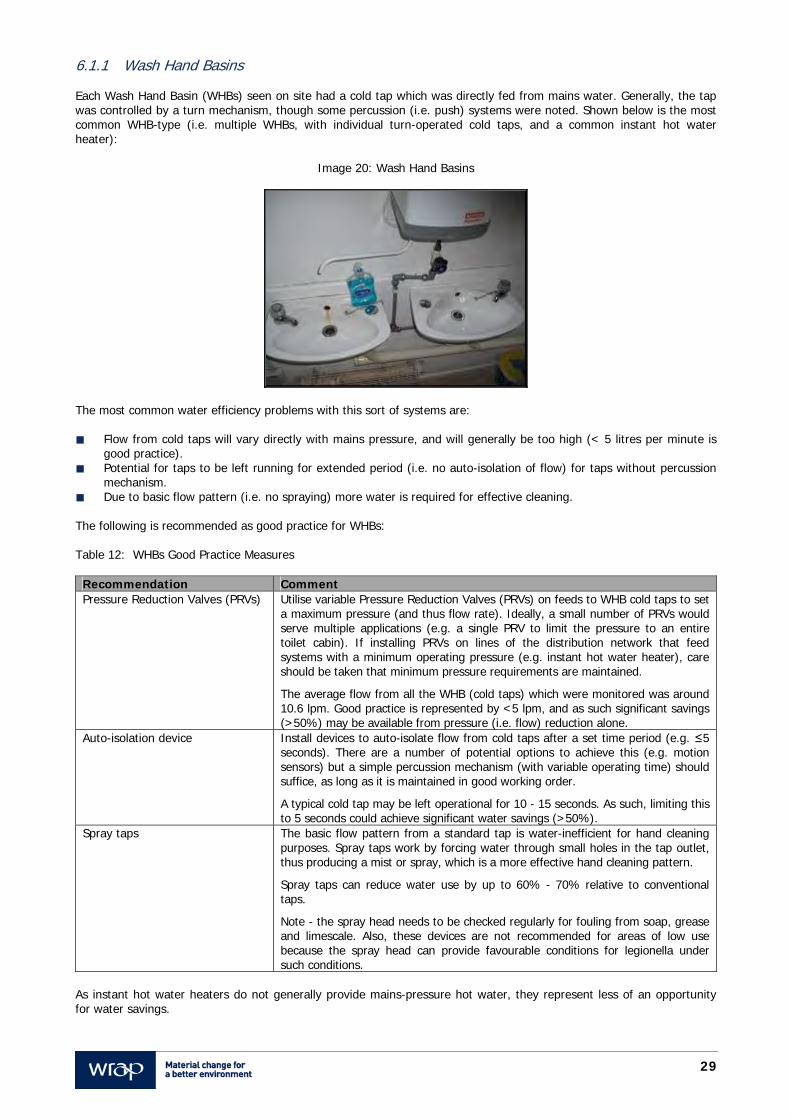
Where separate instant hot water heaters are available (which is normally the case), they can be used for the larger volume activities (e.g. filling a wash basin). Spray taps would not normally be recommended. 6.1.3 Toilet Cisterns Most toilet cisterns appeared standard size (i.e. ~ 6 – 8 litres), with a single lever flush mechanism, and did not appear to have any water efficiency devices incorporated. Where toilet cistern volumes of 7 litres or above are in use, the flush volume could be considered excessive and an opportunity for savings exists. Where looking to improve the water efficiency of toilet cisterns, the cistern volumes should be confirmed in the first instance. Where a cistern volume is 6 litres or less, retro-fitting of water efficiency devices is not recommended. However, where the cistern volume is 7 litres or more, consideration should be given to the installation of Cistern Volume Adjusters (CVAs). CVAs can sometimes be installed inside toilet cisterns to reduce effective flushing volumes (by displacing a portion of the water inside) without adversely affecting performance. Following discussions with the cistern manufacturer(s) to confirm suitability, CVAs should be installed in any cisterns with capacities equal to or above 7 litres. Although larger (i.e. ~3 litres) CVAs are available, 1 litre ‘Save-A-Flush’ systems are recommended in this instance. More information can be found at http://www.dry-planet.com/products.html. CVAs may lead to savings of around 15%. When purchasing new toilets, the contractor should look to ensure water efficiency has been incorporated from the design phase, as this will typically provide greater water savings (and reduce the risk of operational difficulties) than retro-fitting water saving devices. Although there are a number of options on today’s market, modern dual-flush systems (i.e. 4 and 6 litre flush options) may be the most suitable. These systems may lead to savings of around 25% – 30%. 6.1.4 Urinal Cisterns Flushing of urinal cisterns was generally controlled well across most sites, though instances of poor practice were also noted. Poor practice is represented by timed flushing of urinals, where the cistern constantly fills with water and flush frequency does not vary with occupancy. Good practice involves installing a device to control the flushing based on how often the toilet is used. There are a number of options to achieve this, but good practice for the construction sector would normally involve the use of low maintenance hydraulic valves:
Image 21: Urinal Cistern Hydraulic Valve
31
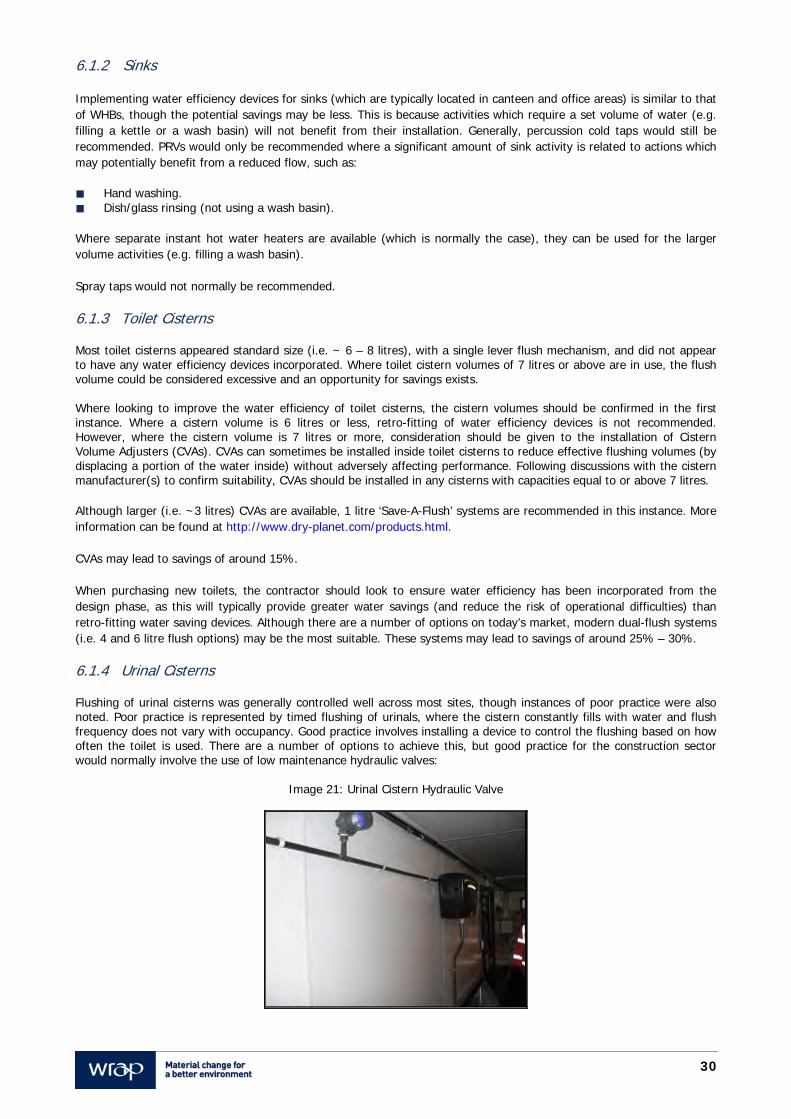
A hydraulic valve can be fitted to the inlet pipework of the urinal system, and does not require power to operate. When the inlet water pressure decreases temporarily through water being used elsewhere in the washroom (e.g. toilet flushing or hand washing), the diaphragm-operated valve opens and allows a pre-set volume of water to pass into the urinal cistern. When the cistern is full, the auto-siphon will discharge and flush the urinal. When the washroom is not being used, the pressure remains unchanged and the valve remains closed. Thus, the cistern should not use water out with working hours. It may also reduce water consumption throughout the day, depending on occupancy levels. Controlling urinal flushing based on occupancy could lead to savings of >65% relative to timed flushing. 6.1.5 Showers With the exception of site 3, showers (even when installed) did not appear to be used often. As such, this is unlikely to be an area where significant savings can be made. Most showers were standard electric showers, and retro-fitting some water saving devices (e.g. aerating shower-heads) is generally not recommended with such systems. As such, where a shower flow rate is in excess of the flow required to provide user satisfaction (typically 8 lpm - 10 lpm), simple flow regulation is recommended. Through installation of variable PRVs, the flow rate from the showers should be set the minimum required flow to achieve user satisfaction. Care should be taken to ensure any minimum operating pressures for electric showers are maintained. Where new showers are being purchased, more advanced water saving devices should be considered from the outset. 6.1.6 Canteens Self-catering canteens are the most common in the construction sector, and typically the only water efficiency concern in these areas is sinks (see Section 6.1.2 above). Only site 3 had a food-preparation canteen, and the only water efficiency concern outwith WHBs (see Section 6.1.1 above) and sinks was the washing area:
Image 22: Trigger-operated Washing Area
As can be seen, trigger-control to ensure auto-isolation of flow is fitted. Also, the sink is being filled with water (rather than constantly running water). These 2 actions represent good practice for such areas. 6.2 General Site Activities 6.2.1 Tool Washing No tool washing was observed during the site audits, and so there are no specific improvements actions suggested at this time. However, good practice for tool washing would generally involve filling a container and using it to wash multiple tools, rather than (for example) using on open hose.
32
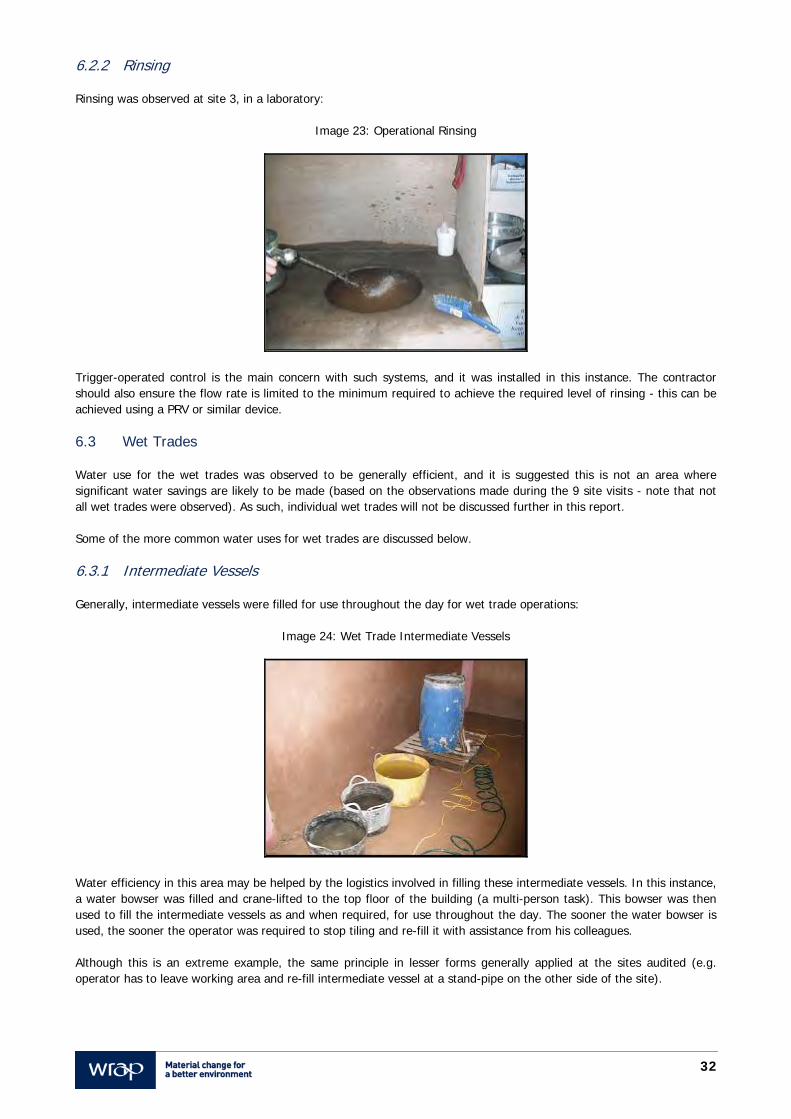
6.2.2 Rinsing Rinsing was observed at site 3, in a laboratory:
Image 23: Operational Rinsing
Trigger-operated control is the main concern with such systems, and it was installed in this instance. The contractor should also ensure the flow rate is limited to the minimum required to achieve the required level of rinsing - this can be achieved using a PRV or similar device. 6.3 Wet Trades Water use for the wet trades was observed to be generally efficient, and it is suggested this is not an area where significant water savings are likely to be made (based on the observations made during the 9 site visits - note that not all wet trades were observed). As such, individual wet trades will not be discussed further in this report. Some of the more common water uses for wet trades are discussed below. 6.3.1 Intermediate Vessels Generally, intermediate vessels were filled for use throughout the day for wet trade operations:
Image 24: Wet Trade Intermediate Vessels
Water efficiency in this area may be helped by the logistics involved in filling these intermediate vessels. In this instance, a water bowser was filled and crane-lifted to the top floor of the building (a multi-person task). This bowser was then used to fill the intermediate vessels as and when required, for use throughout the day. The sooner the water bowser is used, the sooner the operator was required to stop tiling and re-fill it with assistance from his colleagues. Although this is an extreme example, the same principle in lesser forms generally applied at the sites audited (e.g. operator has to leave working area and re-fill intermediate vessel at a stand-pipe on the other side of the site).
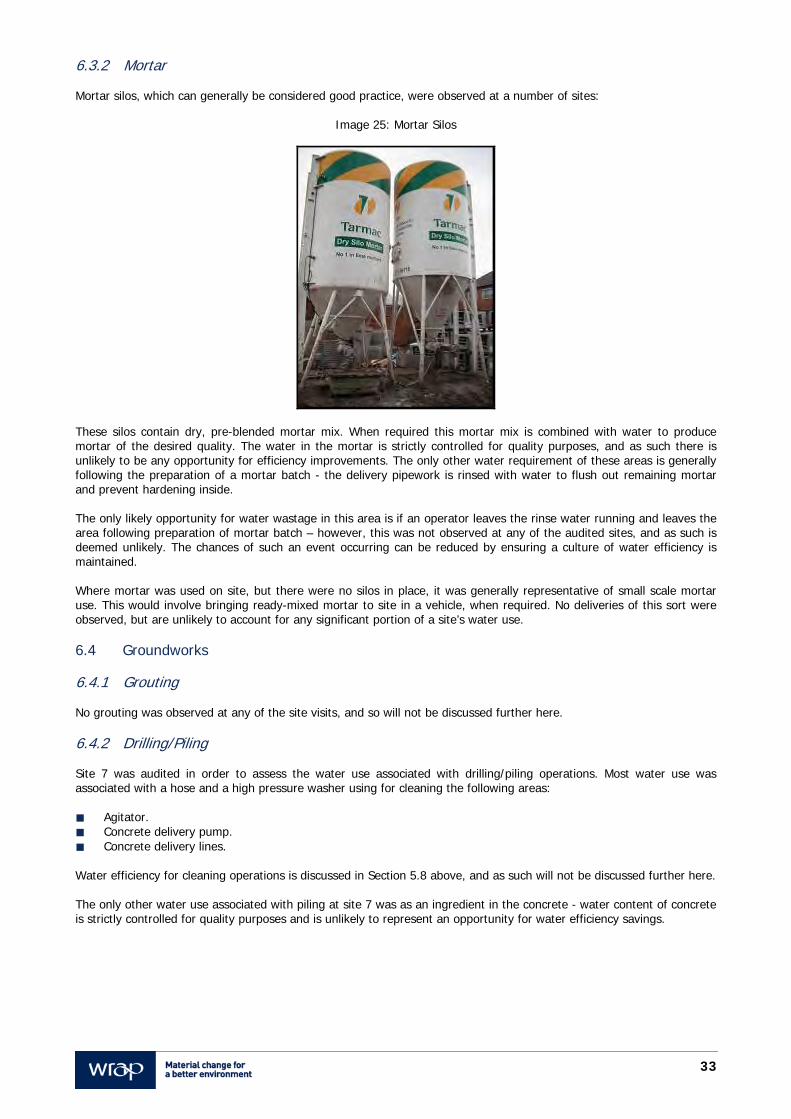
33
6.3.2 Mortar Mortar silos, which can generally be considered good practice, were observed at a number of sites:
Image 25: Mortar Silos
These silos contain dry, pre-blended mortar mix. When required this mortar mix is combined with water to produce mortar of the desired quality. The water in the mortar is strictly controlled for quality purposes, and as such there is unlikely to be any opportunity for efficiency improvements. The only other water requirement of these areas is generally following the preparation of a mortar batch - the delivery pipework is rinsed with water to flush out remaining mortar and prevent hardening inside. The only likely opportunity for water wastage in this area is if an operator leaves the rinse water running and leaves the area following preparation of mortar batch – however, this was not observed at any of the audited sites, and as such is deemed unlikely. The chances of such an event occurring can be reduced by ensuring a culture of water efficiency is maintained. Where mortar was used on site, but there were no silos in place, it was generally representative of small scale mortar use. This would involve bringing ready-mixed mortar to site in a vehicle, when required. No deliveries of this sort were observed, but are unlikely to account for any significant portion of a site’s water use. 6.4 Groundworks 6.4.1 Grouting No grouting was observed at any of the site visits, and so will not be discussed further here. 6.4.2 Drilling/Piling Site 7 was audited in order to assess the water use associated with drilling/piling operations. Most water use was associated with a hose and a high pressure washer using for cleaning the following areas: Agitator. Concrete delivery pump. Concrete delivery lines.
Water efficiency for cleaning operations is discussed in Section 5.8 above, and as such will not be discussed further here. The only other water use associated with piling at site 7 was as an ingredient in the concrete - water content of concrete is strictly controlled for quality purposes and is unlikely to represent an opportunity for water efficiency savings.
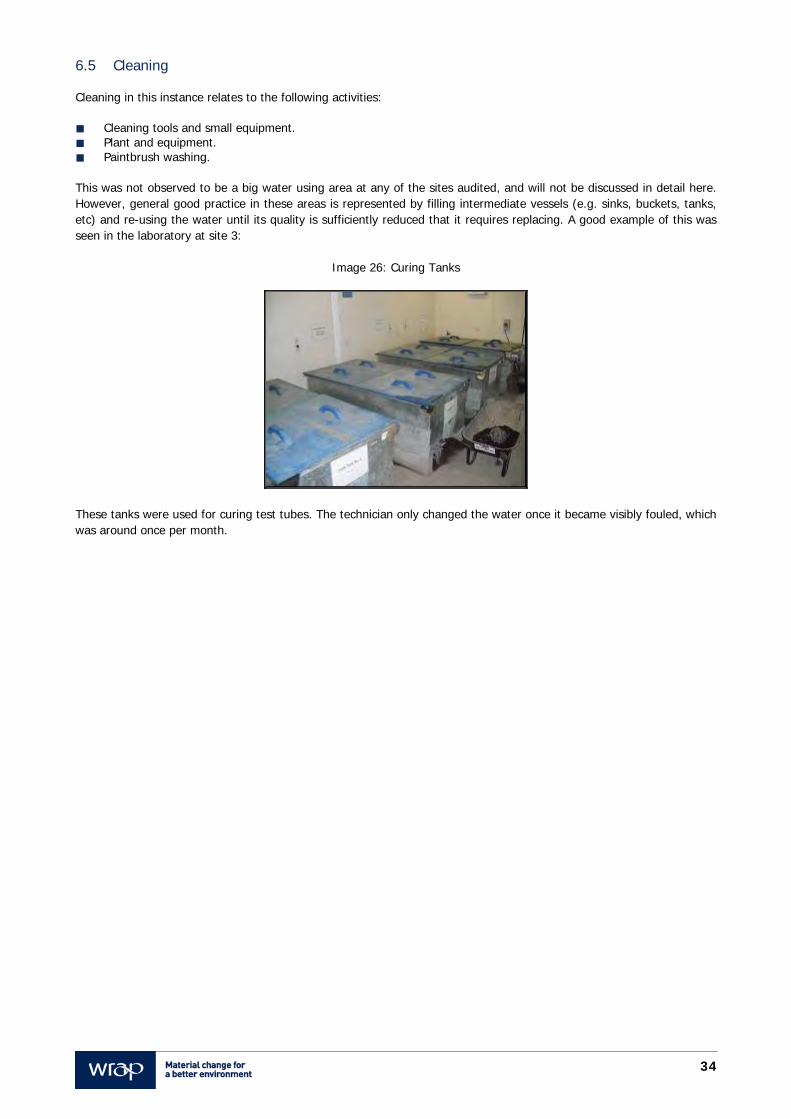
34
6.5 Cleaning Cleaning in this instance relates to the following activities: Cleaning tools and small equipment. Plant and equipment. Paintbrush washing.
This was not observed to be a big water using area at any of the sites audited, and will not be discussed in detail here. However, general good practice in these areas is represented by filling intermediate vessels (e.g. sinks, buckets, tanks, etc) and re-using the water until its quality is sufficiently reduced that it requires replacing. A good example of this was seen in the laboratory at site 3:
Image 26: Curing Tanks
These tanks were used for curing test tubes. The technician only changed the water once it became visibly fouled, which was around once per month.
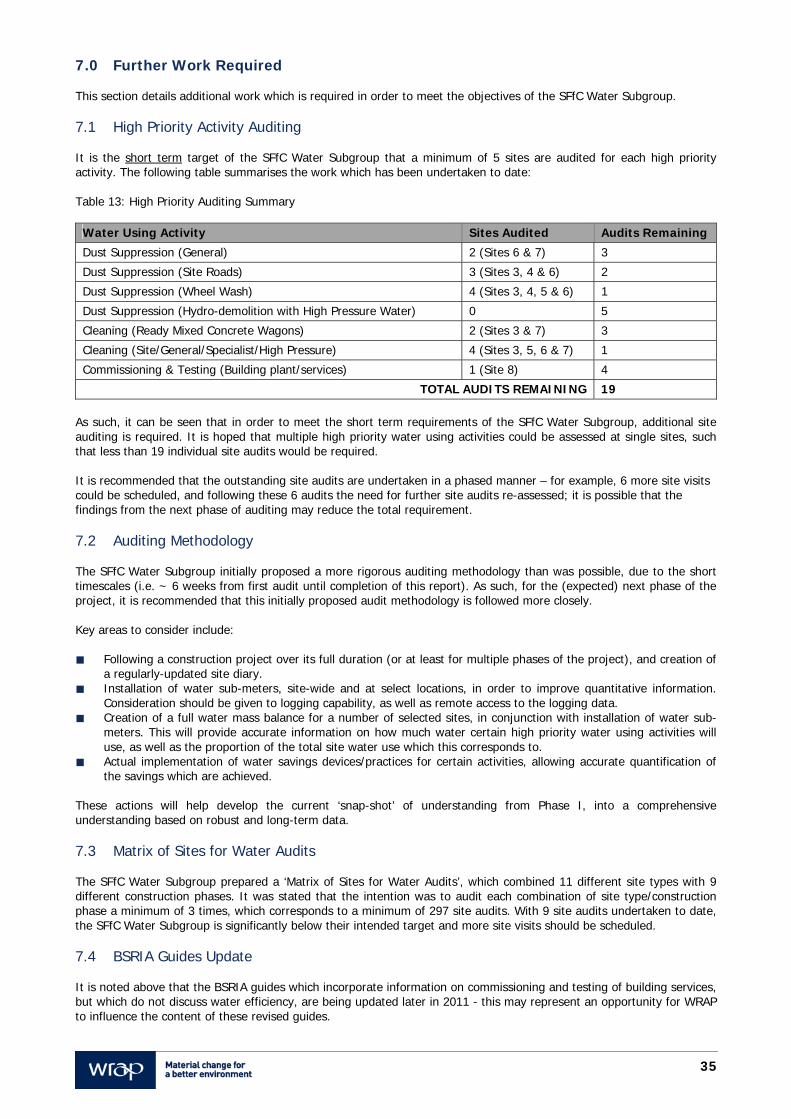
35
7.0 Further Work Required This section details additional work which is required in order to meet the objectives of the SFfC Water Subgroup. 7.1 High Priority Activity Auditing It is the short term target of the SFfC Water Subgroup that a minimum of 5 sites are audited for each high priority activity. The following table summarises the work which has been undertaken to date: Table 13: High Priority Auditing Summary
Water Using Activity Sites Audited Audits Remaining
Dust Suppression (General) 2 (Sites 6 & 7) 3
Dust Suppression (Site Roads) 3 (Sites 3, 4 & 6) 2
Dust Suppression (Wheel Wash) 4 (Sites 3, 4, 5 & 6) 1
Dust Suppression (Hydro-demolition with High Pressure Water) 0 5
Cleaning (Ready Mixed Concrete Wagons) 2 (Sites 3 & 7) 3
Cleaning (Site/General/Specialist/High Pressure) 4 (Sites 3, 5, 6 & 7) 1
Commissioning & Testing (Building plant/services) 1 (Site 8) 4
TOTAL AUDITS REMAINING 19 As such, it can be seen that in order to meet the short term requirements of the SFfC Water Subgroup, additional site auditing is required. It is hoped that multiple high priority water using activities could be assessed at single sites, such that less than 19 individual site audits would be required. It is recommended that the outstanding site audits are undertaken in a phased manner – for example, 6 more site visits could be scheduled, and following these 6 audits the need for further site audits re-assessed; it is possible that the findings from the next phase of auditing may reduce the total requirement. 7.2 Auditing Methodology The SFfC Water Subgroup initially proposed a more rigorous auditing methodology than was possible, due to the short timescales (i.e. ~ 6 weeks from first audit until completion of this report). As such, for the (expected) next phase of the project, it is recommended that this initially proposed audit methodology is followed more closely. Key areas to consider include: Following a construction project over its full duration (or at least for multiple phases of the project), and creation of
a regularly-updated site diary. Installation of water sub-meters, site-wide and at select locations, in order to improve quantitative information.
Consideration should be given to logging capability, as well as remote access to the logging data. Creation of a full water mass balance for a number of selected sites, in conjunction with installation of water sub-
meters. This will provide accurate information on how much water certain high priority water using activities will use, as well as the proportion of the total site water use which this corresponds to.
Actual implementation of water savings devices/practices for certain activities, allowing accurate quantification of the savings which are achieved.
These actions will help develop the current ‘snap-shot’ of understanding from Phase I, into a comprehensive understanding based on robust and long-term data. 7.3 Matrix of Sites for Water Audits The SFfC Water Subgroup prepared a ‘Matrix of Sites for Water Audits’, which combined 11 different site types with 9 different construction phases. It was stated that the intention was to audit each combination of site type/construction phase a minimum of 3 times, which corresponds to a minimum of 297 site audits. With 9 site audits undertaken to date, the SFfC Water Subgroup is significantly below their intended target and more site visits should be scheduled. 7.4 BSRIA Guides Update It is noted above that the BSRIA guides which incorporate information on commissioning and testing of building services, but which do not discuss water efficiency, are being updated later in 2011 - this may represent an opportunity for WRAP to influence the content of these revised guides.
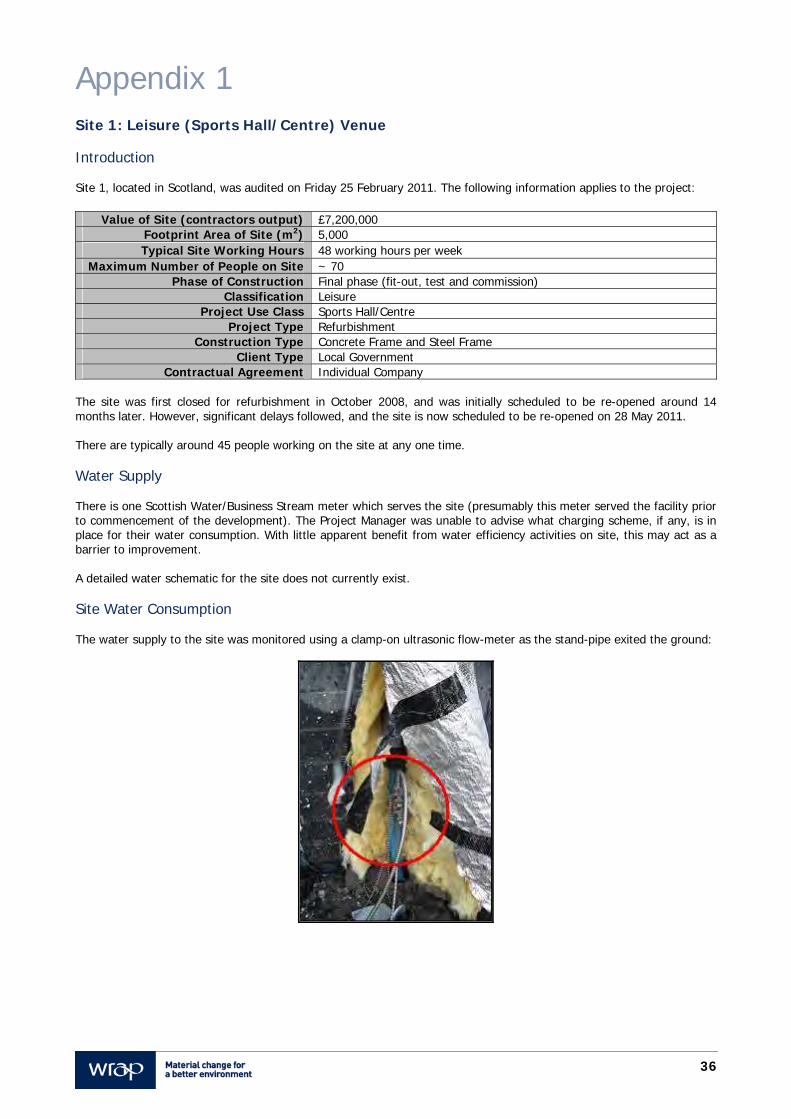
36
Appendix 1 Site 1: Leisure (Sports Hall/Centre) Venue Introduction Site 1, located in Scotland, was audited on Friday 25 February 2011. The following information applies to the project:
Value of Site (contractors output) £7,200,000 Footprint Area of Site (m2) 5,000 Typical Site Working Hours 48 working hours per week
Maximum Number of People on Site ~ 70 Phase of Construction Final phase (fit-out, test and commission)
Classification Leisure Project Use Class Sports Hall/Centre
Project Type Refurbishment Construction Type Concrete Frame and Steel Frame
Client Type Local Government Contractual Agreement Individual Company
The site was first closed for refurbishment in October 2008, and was initially scheduled to be re-opened around 14 months later. However, significant delays followed, and the site is now scheduled to be re-opened on 28 May 2011. There are typically around 45 people working on the site at any one time. Water Supply There is one Scottish Water/Business Stream meter which serves the site (presumably this meter served the facility prior to commencement of the development). The Project Manager was unable to advise what charging scheme, if any, is in place for their water consumption. With little apparent benefit from water efficiency activities on site, this may act as a barrier to improvement. A detailed water schematic for the site does not currently exist. Site Water Consumption The water supply to the site was monitored using a clamp-on ultrasonic flow-meter as the stand-pipe exited the ground:
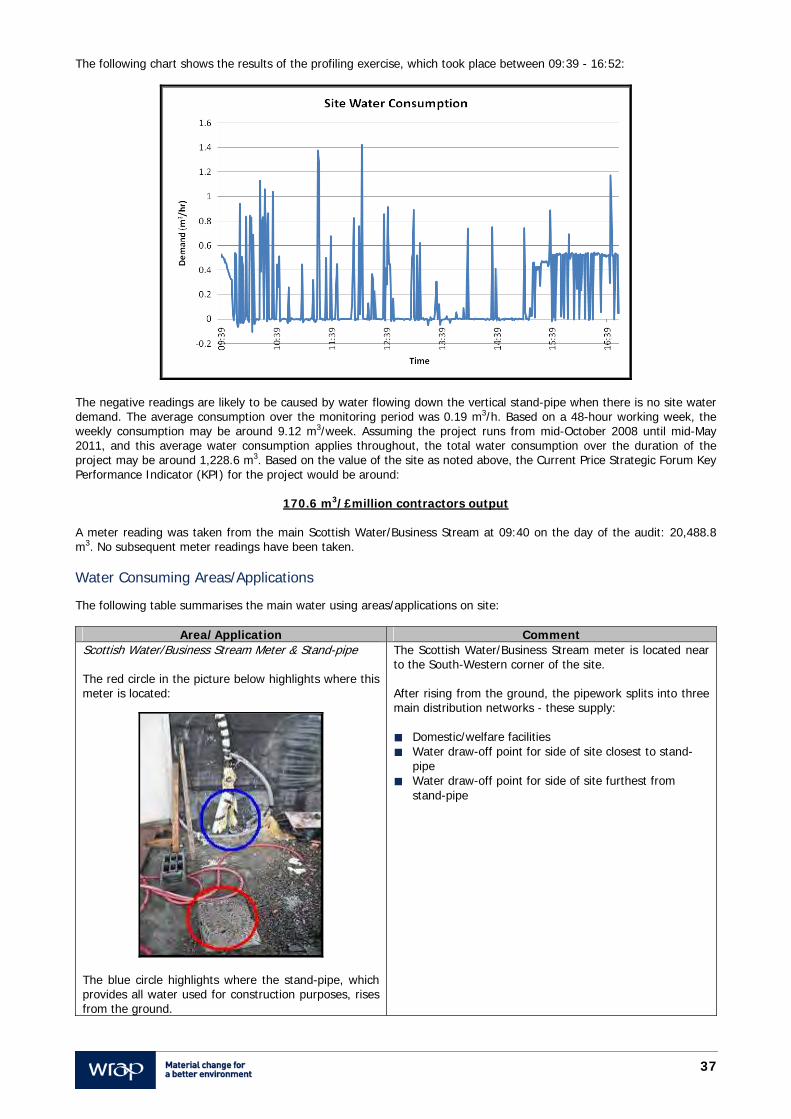
37
The following chart shows the results of the profiling exercise, which took place between 09:39 - 16:52:
The negative readings are likely to be caused by water flowing down the vertical stand-pipe when there is no site water demand. The average consumption over the monitoring period was 0.19 m3/h. Based on a 48-hour working week, the weekly consumption may be around 9.12 m3/week. Assuming the project runs from mid-October 2008 until mid-May 2011, and this average water consumption applies throughout, the total water consumption over the duration of the project may be around 1,228.6 m3. Based on the value of the site as noted above, the Current Price Strategic Forum Key Performance Indicator (KPI) for the project would be around:
170.6 m3/£million contractors output A meter reading was taken from the main Scottish Water/Business Stream at 09:40 on the day of the audit: 20,488.8 m3. No subsequent meter readings have been taken. Water Consuming Areas/Applications
The following table summarises the main water using areas/applications on site:
Area/Application Comment Scottish Water/Business Stream Meter & Stand-pipe The red circle in the picture below highlights where this meter is located:
The blue circle highlights where the stand-pipe, which provides all water used for construction purposes, rises from the ground.
The Scottish Water/Business Stream meter is located near to the South-Western corner of the site. After rising from the ground, the pipework splits into three main distribution networks - these supply: Domestic/welfare facilities Water draw-off point for side of site closest to stand-
pipe Water draw-off point for side of site furthest from
stand-pipe
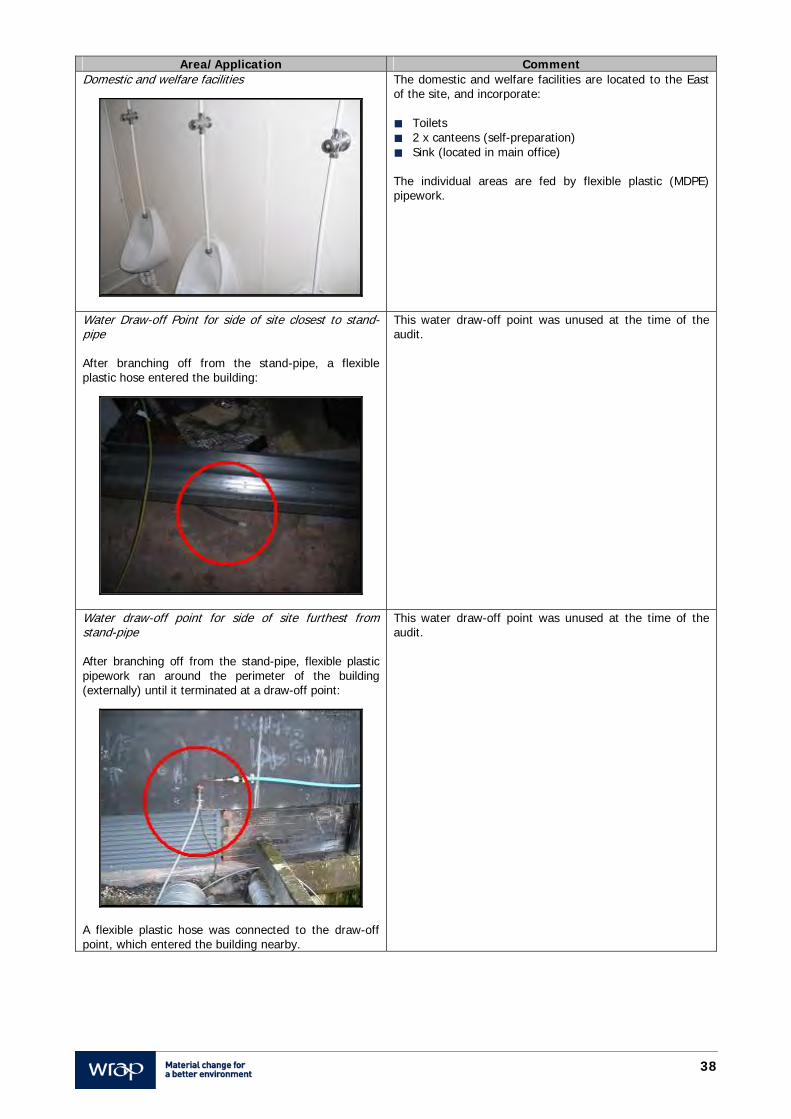
38
Area/Application Comment Domestic and welfare facilities
The domestic and welfare facilities are located to the East of the site, and incorporate: Toilets 2 x canteens (self-preparation) Sink (located in main office) The individual areas are fed by flexible plastic (MDPE) pipework.
Water Draw-off Point for side of site closest to stand-pipe After branching off from the stand-pipe, a flexible plastic hose entered the building:
This water draw-off point was unused at the time of the audit.
Water draw-off point for side of site furthest from stand-pipe After branching off from the stand-pipe, flexible plastic pipework ran around the perimeter of the building (externally) until it terminated at a draw-off point:
A flexible plastic hose was connected to the draw-off point, which entered the building nearby.
This water draw-off point was unused at the time of the audit.
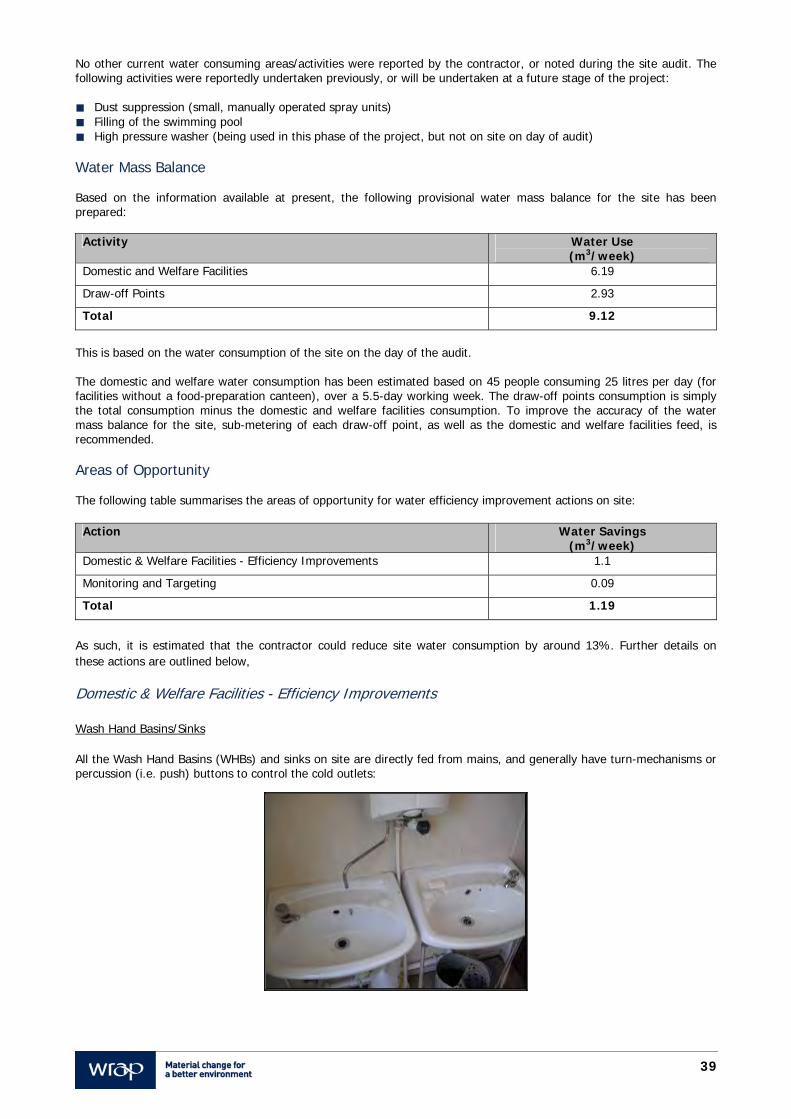
39
No other current water consuming areas/activities were reported by the contractor, or noted during the site audit. The following activities were reportedly undertaken previously, or will be undertaken at a future stage of the project: Dust suppression (small, manually operated spray units) Filling of the swimming pool High pressure washer (being used in this phase of the project, but not on site on day of audit)
Water Mass Balance Based on the information available at present, the following provisional water mass balance for the site has been prepared:
Activity Water Use (m3/week)
Domestic and Welfare Facilities 6.19
Draw-off Points 2.93
Total 9.12
This is based on the water consumption of the site on the day of the audit. The domestic and welfare water consumption has been estimated based on 45 people consuming 25 litres per day (for facilities without a food-preparation canteen), over a 5.5-day working week. The draw-off points consumption is simply the total consumption minus the domestic and welfare facilities consumption. To improve the accuracy of the water mass balance for the site, sub-metering of each draw-off point, as well as the domestic and welfare facilities feed, is recommended. Areas of Opportunity The following table summarises the areas of opportunity for water efficiency improvement actions on site:
Action Water Savings (m3/week)
Domestic & Welfare Facilities - Efficiency Improvements 1.1
Monitoring and Targeting 0.09
Total 1.19
As such, it is estimated that the contractor could reduce site water consumption by around 13%. Further details on these actions are outlined below, Domestic & Welfare Facilities - Efficiency Improvements Wash Hand Basins/Sinks All the Wash Hand Basins (WHBs) and sinks on site are directly fed from mains, and generally have turn-mechanisms or percussion (i.e. push) buttons to control the cold outlets:
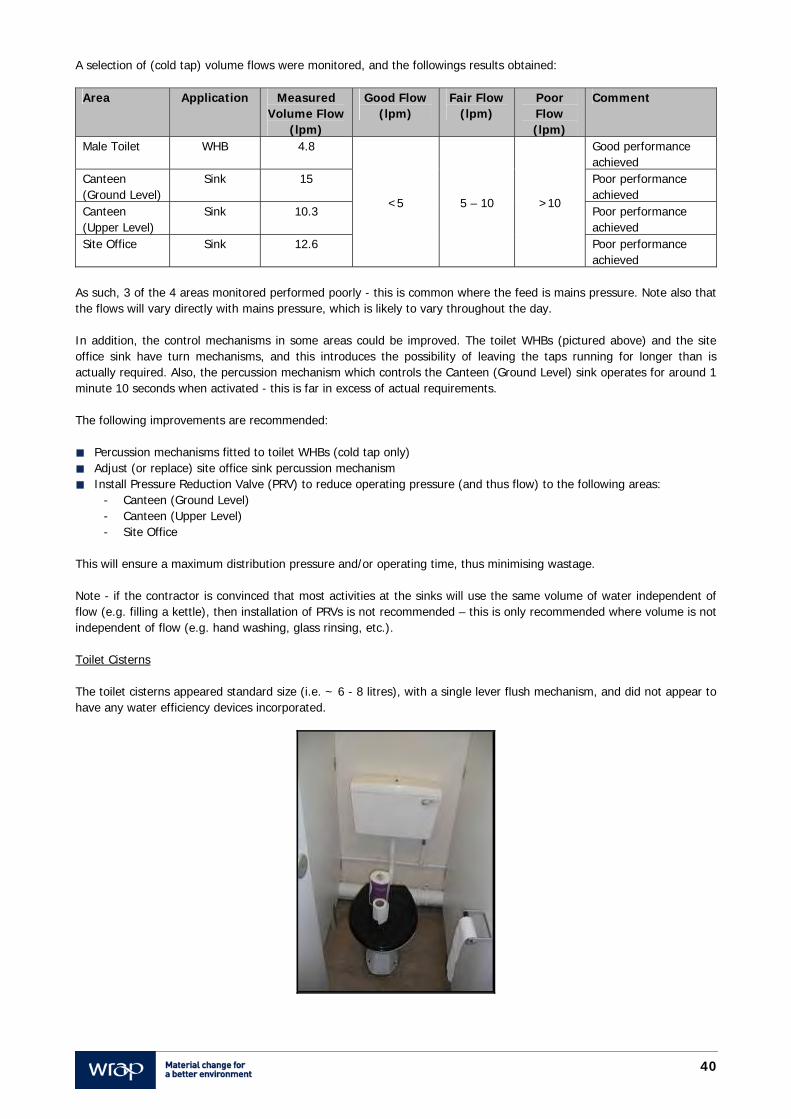
40
A selection of (cold tap) volume flows were monitored, and the followings results obtained:
Area Application Measured Volume Flow
(lpm)
Good Flow (lpm)
Fair Flow (lpm)
Poor Flow (lpm)
Comment
Male Toilet WHB 4.8
<5 5 – 10 >10
Good performance achieved
Canteen (Ground Level)
Sink 15 Poor performance achieved
Canteen (Upper Level)
Sink 10.3 Poor performance achieved
Site Office Sink 12.6 Poor performance achieved
As such, 3 of the 4 areas monitored performed poorly - this is common where the feed is mains pressure. Note also that the flows will vary directly with mains pressure, which is likely to vary throughout the day. In addition, the control mechanisms in some areas could be improved. The toilet WHBs (pictured above) and the site office sink have turn mechanisms, and this introduces the possibility of leaving the taps running for longer than is actually required. Also, the percussion mechanism which controls the Canteen (Ground Level) sink operates for around 1 minute 10 seconds when activated - this is far in excess of actual requirements. The following improvements are recommended:
Percussion mechanisms fitted to toilet WHBs (cold tap only) Adjust (or replace) site office sink percussion mechanism Install Pressure Reduction Valve (PRV) to reduce operating pressure (and thus flow) to the following areas:
- Canteen (Ground Level) - Canteen (Upper Level) - Site Office
This will ensure a maximum distribution pressure and/or operating time, thus minimising wastage. Note - if the contractor is convinced that most activities at the sinks will use the same volume of water independent of flow (e.g. filling a kettle), then installation of PRVs is not recommended – this is only recommended where volume is not independent of flow (e.g. hand washing, glass rinsing, etc.). Toilet Cisterns The toilet cisterns appeared standard size (i.e. ~ 6 - 8 litres), with a single lever flush mechanism, and did not appear to have any water efficiency devices incorporated.
41
In the first instance, the cistern volumes should be confirmed. Where a cistern volume is 6 litres or less, retro-fitting of water efficiency devices is not recommended. However, where the cistern volume is 7 litres or more, consideration should be given to the installation of Cistern Volume Adjusters (CVAs). CVAs can sometimes be installed inside toilet cisterns to reduce effective flushing volumes (by displacing a portion of the water inside) without adversely affecting performance. Following discussions with the cistern manufacturer(s) to confirm suitability, CVAs should be installed in any cisterns with capacities equal to or above 7 litres. Although larger (i.e. ~3 litres) CVAs are available, 1 litre ‘Save-A-Flush’ systems are recommended in this instance. More information can be found at http://www.dry-planet.com/products.html. Estimated Savings Assuming 70% of the water consumption of the domestic and welfare facilities is associated with WHBs/sinks and toilet flushing, and that 25% savings can be achieved, weekly savings of around 1.1 m3/week could be achieved. Monitoring & Targeting It is recommended that the contractor implement a simple Monitoring and Targeting (M&T) system for the site’s water consumption - initially requiring the installation of a sub-meter, this will then involve undertaking two main actions on a regular basis (at a minimum): Track water consumed (m3) per week, and assess for erroneous consumption. Once per month, conduct brief out-of-hours assessment of baseload water consumption. These actions should help identify (and eliminate) unnecessary water consumption on site. The contractor can also consider utilising KPIs, which relate water consumption to some measure of site activity (e.g. average staff numbers on site over the monitoring period). Estimating the savings associated with such an action is difficult, and an arbitrary figure of 1% of the current site water consumption will be used - this accounts to 0.09 m3/week.
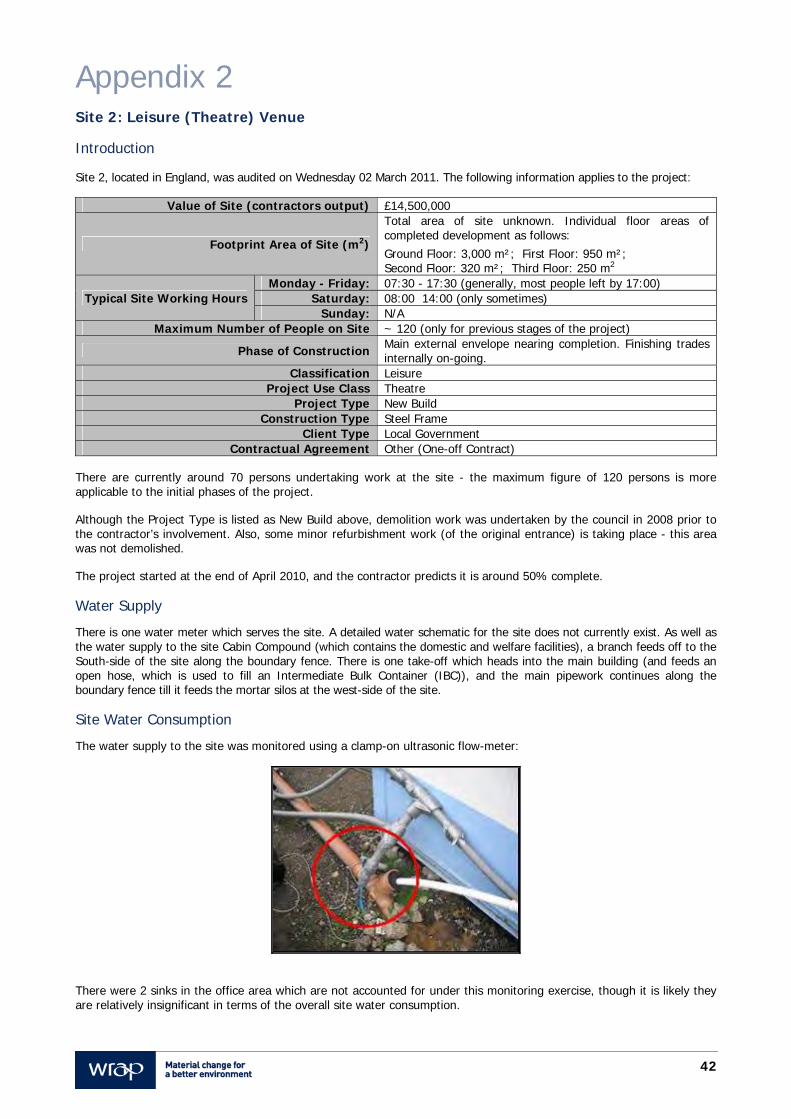
42
Appendix 2 Site 2: Leisure (Theatre) Venue
Introduction
Site 2, located in England, was audited on Wednesday 02 March 2011. The following information applies to the project:
Value of Site (contractors output) £14,500,000
Footprint Area of Site (m2)
Total area of site unknown. Individual floor areas of completed development as follows: Ground Floor: 3,000 m²; First Floor: 950 m²; Second Floor: 320 m²; Third Floor: 250 m2
Typical Site Working Hours Monday - Friday: 07:30 - 17:30 (generally, most people left by 17:00)
Saturday: 08:00 14:00 (only sometimes) Sunday: N/A
Maximum Number of People on Site ~ 120 (only for previous stages of the project)
Phase of Construction Main external envelope nearing completion. Finishing trades internally on-going.
Classification Leisure Project Use Class Theatre
Project Type New Build Construction Type Steel Frame
Client Type Local Government Contractual Agreement Other (One-off Contract)
There are currently around 70 persons undertaking work at the site - the maximum figure of 120 persons is more applicable to the initial phases of the project.
Although the Project Type is listed as New Build above, demolition work was undertaken by the council in 2008 prior to the contractor’s involvement. Also, some minor refurbishment work (of the original entrance) is taking place - this area was not demolished.
The project started at the end of April 2010, and the contractor predicts it is around 50% complete.
Water Supply
There is one water meter which serves the site. A detailed water schematic for the site does not currently exist. As well as the water supply to the site Cabin Compound (which contains the domestic and welfare facilities), a branch feeds off to the South-side of the site along the boundary fence. There is one take-off which heads into the main building (and feeds an open hose, which is used to fill an Intermediate Bulk Container (IBC)), and the main pipework continues along the boundary fence till it feeds the mortar silos at the west-side of the site.
Site Water Consumption
The water supply to the site was monitored using a clamp-on ultrasonic flow-meter:
There were 2 sinks in the office area which are not accounted for under this monitoring exercise, though it is likely they are relatively insignificant in terms of the overall site water consumption.
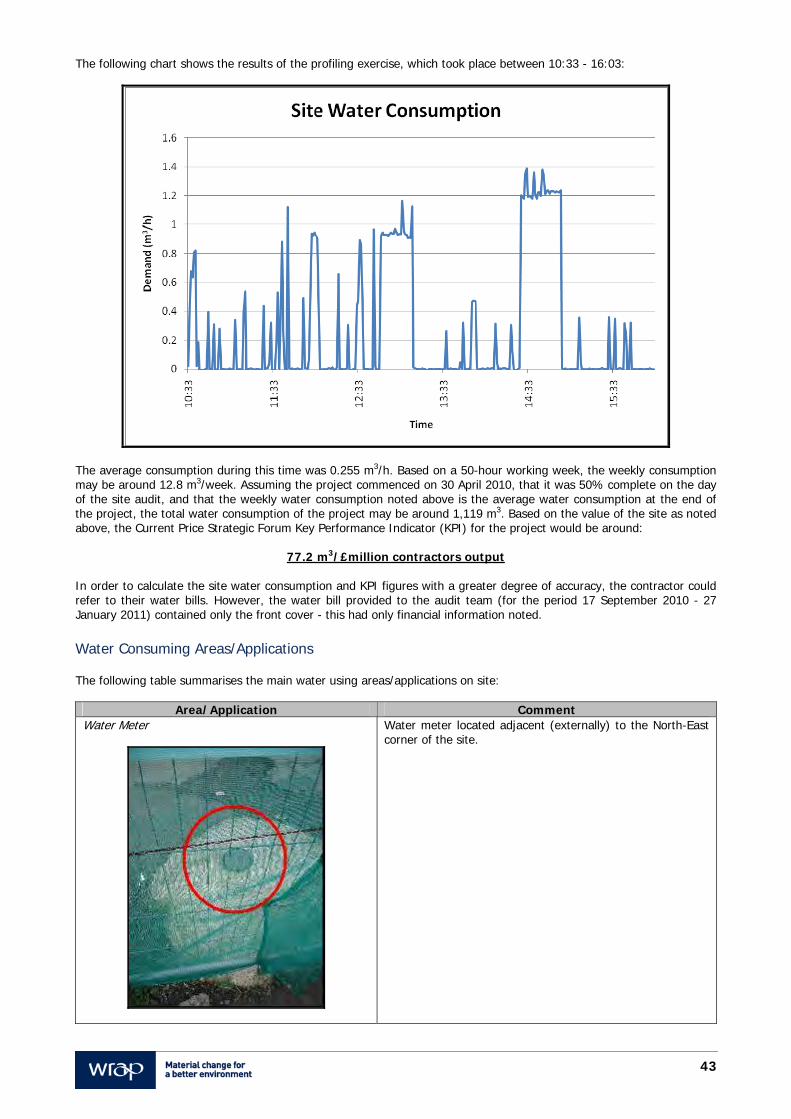
43
The following chart shows the results of the profiling exercise, which took place between 10:33 - 16:03:
The average consumption during this time was 0.255 m3/h. Based on a 50-hour working week, the weekly consumption may be around 12.8 m3/week. Assuming the project commenced on 30 April 2010, that it was 50% complete on the day of the site audit, and that the weekly water consumption noted above is the average water consumption at the end of the project, the total water consumption of the project may be around 1,119 m3. Based on the value of the site as noted above, the Current Price Strategic Forum Key Performance Indicator (KPI) for the project would be around:
77.2 m3/£million contractors output In order to calculate the site water consumption and KPI figures with a greater degree of accuracy, the contractor could refer to their water bills. However, the water bill provided to the audit team (for the period 17 September 2010 - 27 January 2011) contained only the front cover - this had only financial information noted. Water Consuming Areas/Applications The following table summarises the main water using areas/applications on site:
Area/Application Comment Water Meter
Water meter located adjacent (externally) to the North-East corner of the site.
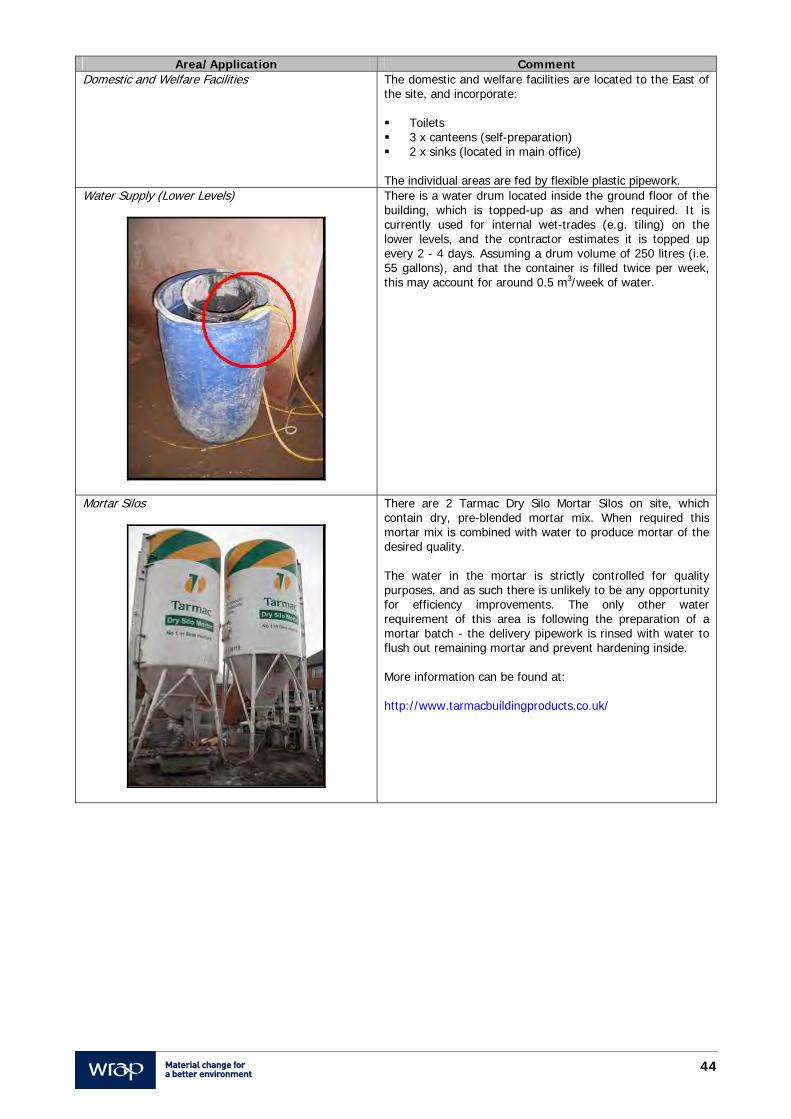
44
Area/Application Comment Domestic and Welfare Facilities
The domestic and welfare facilities are located to the East of the site, and incorporate: Toilets 3 x canteens (self-preparation) 2 x sinks (located in main office) The individual areas are fed by flexible plastic pipework.
Water Supply (Lower Levels)
There is a water drum located inside the ground floor of the building, which is topped-up as and when required. It is currently used for internal wet-trades (e.g. tiling) on the lower levels, and the contractor estimates it is topped up every 2 - 4 days. Assuming a drum volume of 250 litres (i.e. 55 gallons), and that the container is filled twice per week, this may account for around 0.5 m3/week of water.
Mortar Silos
There are 2 Tarmac Dry Silo Mortar Silos on site, which contain dry, pre-blended mortar mix. When required this mortar mix is combined with water to produce mortar of the desired quality. The water in the mortar is strictly controlled for quality purposes, and as such there is unlikely to be any opportunity for efficiency improvements. The only other water requirement of this area is following the preparation of a mortar batch - the delivery pipework is rinsed with water to flush out remaining mortar and prevent hardening inside. More information can be found at: http://www.tarmacbuildingproducts.co.uk/
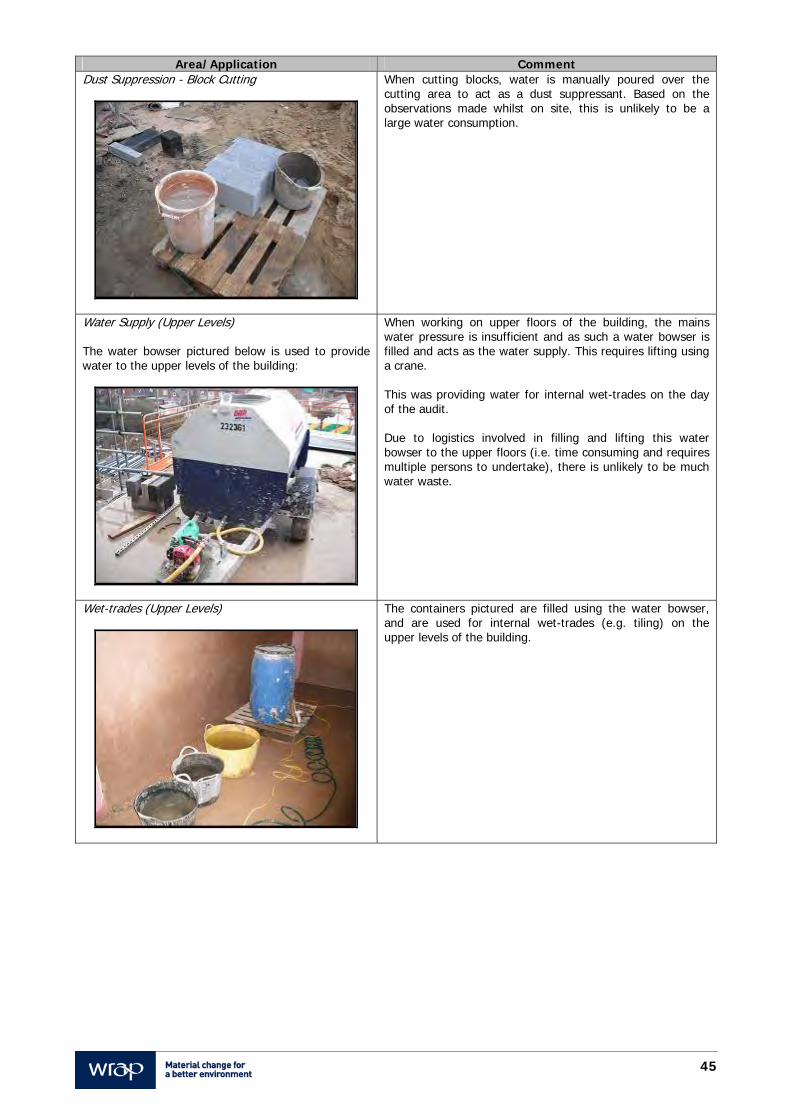
45
Area/Application Comment Dust Suppression - Block Cutting
When cutting blocks, water is manually poured over the cutting area to act as a dust suppressant. Based on the observations made whilst on site, this is unlikely to be a large water consumption.
Water Supply (Upper Levels) The water bowser pictured below is used to provide water to the upper levels of the building:
When working on upper floors of the building, the mains water pressure is insufficient and as such a water bowser is filled and acts as the water supply. This requires lifting using a crane. This was providing water for internal wet-trades on the day of the audit. Due to logistics involved in filling and lifting this water bowser to the upper floors (i.e. time consuming and requires multiple persons to undertake), there is unlikely to be much water waste.
Wet-trades (Upper Levels)
The containers pictured are filled using the water bowser, and are used for internal wet-trades (e.g. tiling) on the upper levels of the building.
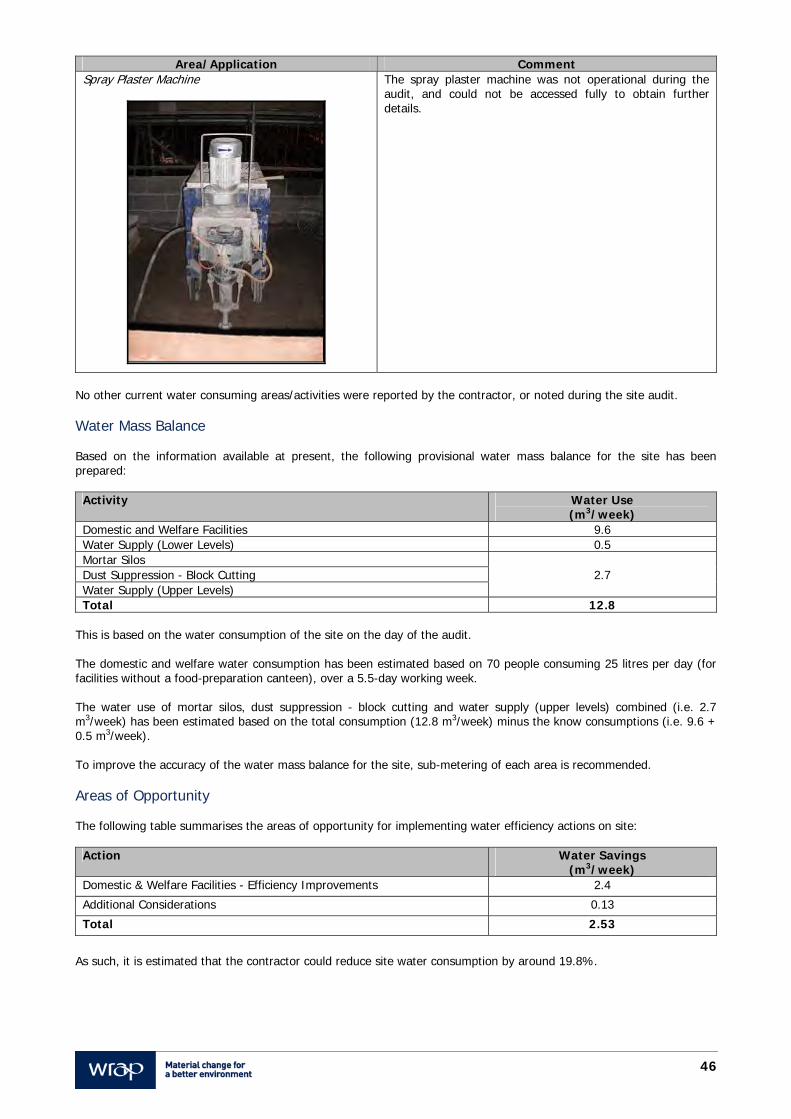
46
Area/Application Comment Spray Plaster Machine
The spray plaster machine was not operational during the audit, and could not be accessed fully to obtain further details.
No other current water consuming areas/activities were reported by the contractor, or noted during the site audit. Water Mass Balance Based on the information available at present, the following provisional water mass balance for the site has been prepared:
Activity Water Use (m3/week)
Domestic and Welfare Facilities 9.6 Water Supply (Lower Levels) 0.5 Mortar Silos
2.7 Dust Suppression - Block Cutting Water Supply (Upper Levels) Total 12.8
This is based on the water consumption of the site on the day of the audit. The domestic and welfare water consumption has been estimated based on 70 people consuming 25 litres per day (for facilities without a food-preparation canteen), over a 5.5-day working week. The water use of mortar silos, dust suppression - block cutting and water supply (upper levels) combined (i.e. 2.7 m3/week) has been estimated based on the total consumption (12.8 m3/week) minus the know consumptions (i.e. 9.6 + 0.5 m3/week). To improve the accuracy of the water mass balance for the site, sub-metering of each area is recommended. Areas of Opportunity The following table summarises the areas of opportunity for implementing water efficiency actions on site:
Action Water Savings (m3/week)
Domestic & Welfare Facilities - Efficiency Improvements 2.4
Additional Considerations 0.13
Total 2.53
As such, it is estimated that the contractor could reduce site water consumption by around 19.8%.
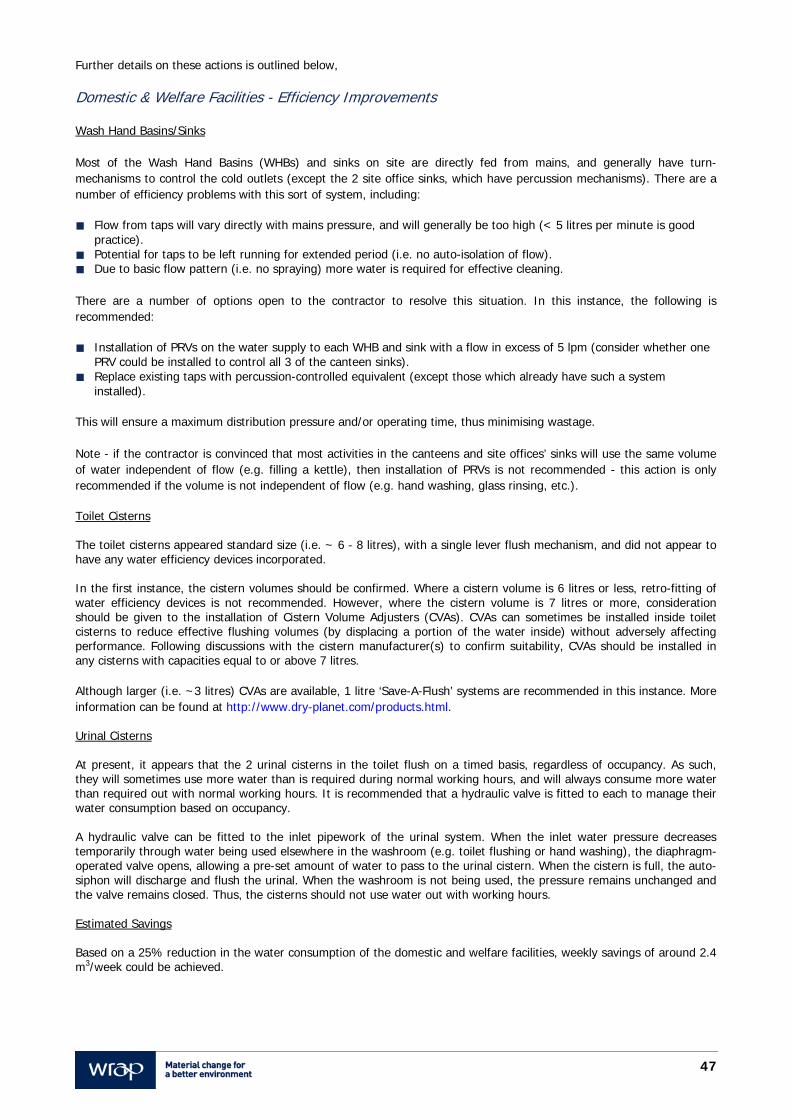
47
Further details on these actions is outlined below, Domestic & Welfare Facilities - Efficiency Improvements Wash Hand Basins/Sinks Most of the Wash Hand Basins (WHBs) and sinks on site are directly fed from mains, and generally have turn-mechanisms to control the cold outlets (except the 2 site office sinks, which have percussion mechanisms). There are a number of efficiency problems with this sort of system, including: Flow from taps will vary directly with mains pressure, and will generally be too high (< 5 litres per minute is good
practice). Potential for taps to be left running for extended period (i.e. no auto-isolation of flow). Due to basic flow pattern (i.e. no spraying) more water is required for effective cleaning. There are a number of options open to the contractor to resolve this situation. In this instance, the following is recommended: Installation of PRVs on the water supply to each WHB and sink with a flow in excess of 5 lpm (consider whether one
PRV could be installed to control all 3 of the canteen sinks). Replace existing taps with percussion-controlled equivalent (except those which already have such a system
installed).
This will ensure a maximum distribution pressure and/or operating time, thus minimising wastage. Note - if the contractor is convinced that most activities in the canteens and site offices’ sinks will use the same volume of water independent of flow (e.g. filling a kettle), then installation of PRVs is not recommended - this action is only recommended if the volume is not independent of flow (e.g. hand washing, glass rinsing, etc.). Toilet Cisterns The toilet cisterns appeared standard size (i.e. ~ 6 - 8 litres), with a single lever flush mechanism, and did not appear to have any water efficiency devices incorporated.
In the first instance, the cistern volumes should be confirmed. Where a cistern volume is 6 litres or less, retro-fitting of water efficiency devices is not recommended. However, where the cistern volume is 7 litres or more, consideration should be given to the installation of Cistern Volume Adjusters (CVAs). CVAs can sometimes be installed inside toilet cisterns to reduce effective flushing volumes (by displacing a portion of the water inside) without adversely affecting performance. Following discussions with the cistern manufacturer(s) to confirm suitability, CVAs should be installed in any cisterns with capacities equal to or above 7 litres. Although larger (i.e. ~3 litres) CVAs are available, 1 litre ‘Save-A-Flush’ systems are recommended in this instance. More information can be found at http://www.dry-planet.com/products.html. Urinal Cisterns At present, it appears that the 2 urinal cisterns in the toilet flush on a timed basis, regardless of occupancy. As such, they will sometimes use more water than is required during normal working hours, and will always consume more water than required out with normal working hours. It is recommended that a hydraulic valve is fitted to each to manage their water consumption based on occupancy. A hydraulic valve can be fitted to the inlet pipework of the urinal system. When the inlet water pressure decreases temporarily through water being used elsewhere in the washroom (e.g. toilet flushing or hand washing), the diaphragm-operated valve opens, allowing a pre-set amount of water to pass to the urinal cistern. When the cistern is full, the auto-siphon will discharge and flush the urinal. When the washroom is not being used, the pressure remains unchanged and the valve remains closed. Thus, the cisterns should not use water out with working hours. Estimated Savings Based on a 25% reduction in the water consumption of the domestic and welfare facilities, weekly savings of around 2.4 m3/week could be achieved.
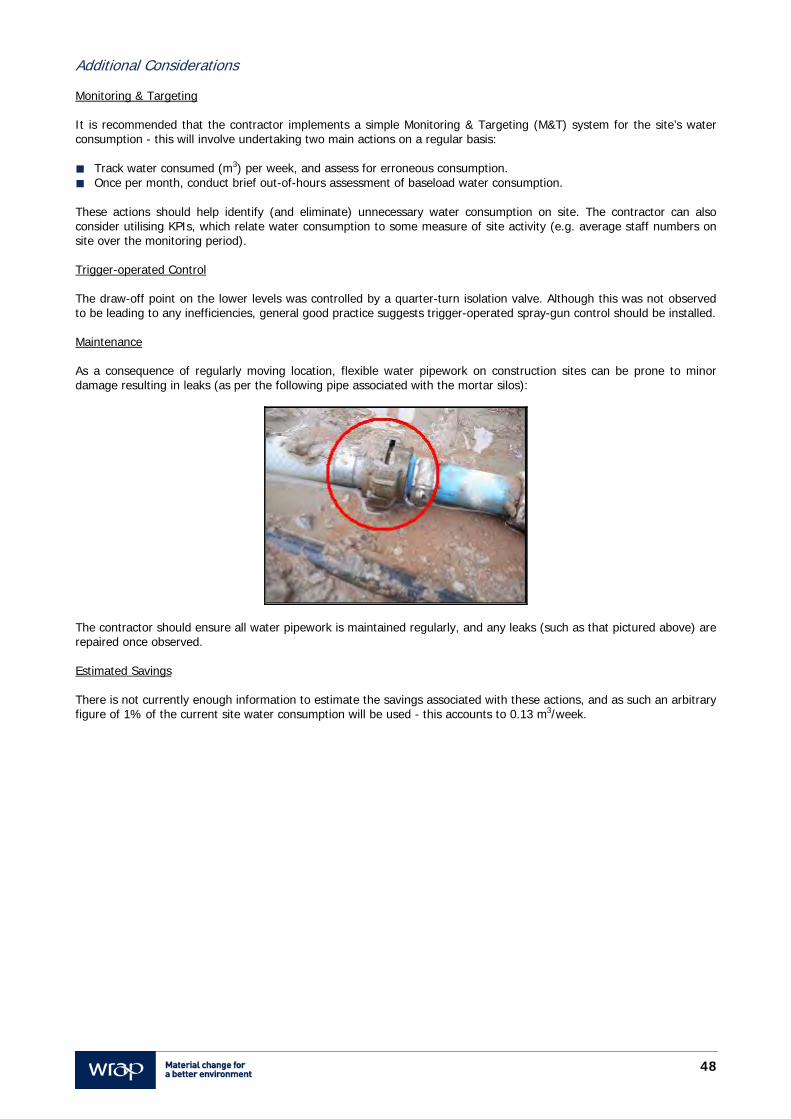
48
Additional Considerations Monitoring & Targeting It is recommended that the contractor implements a simple Monitoring & Targeting (M&T) system for the site’s water consumption - this will involve undertaking two main actions on a regular basis: Track water consumed (m3) per week, and assess for erroneous consumption. Once per month, conduct brief out-of-hours assessment of baseload water consumption.
These actions should help identify (and eliminate) unnecessary water consumption on site. The contractor can also consider utilising KPIs, which relate water consumption to some measure of site activity (e.g. average staff numbers on site over the monitoring period). Trigger-operated Control The draw-off point on the lower levels was controlled by a quarter-turn isolation valve. Although this was not observed to be leading to any inefficiencies, general good practice suggests trigger-operated spray-gun control should be installed. Maintenance As a consequence of regularly moving location, flexible water pipework on construction sites can be prone to minor damage resulting in leaks (as per the following pipe associated with the mortar silos):
The contractor should ensure all water pipework is maintained regularly, and any leaks (such as that pictured above) are repaired once observed. Estimated Savings There is not currently enough information to estimate the savings associated with these actions, and as such an arbitrary figure of 1% of the current site water consumption will be used - this accounts to 0.13 m3/week.
49
Appendix 3 Site 3: Civil Engineering (Road) Site Introduction Site 3, located in England, was audited on Thursday 03 March 2011. The following information applies to the project:
Value of Site (contractors output) £380,000,000 Length of Scheme (km) 28
Typical Site Working Hours Monday - Friday: 07:00 - 19:00 (summer)
08:00 - 17:30 (winter) Saturday: N/A
Sunday: N/A Maximum Number of People on Site 750
Phase of Construction Around 50% of the road has been completed. Classification Civil Engineering
Project Use Class Road Project Type New Build
Construction Type Civil Engineering Client Type Government Agency
Contractual Agreement Individual Company It is estimated that it will be around 14 months (from the audit date) until completion. Some sections of the existing road will be retained for use by local traffic and some sections will be downgraded for use by cyclists, walkers and horse riders and for private means of access. The average number of staff on site is around 650. Water Supply The main site compound appears to get its mains water from an adjacent armed forces base. Current charges are 1.3835 £/m3 for water purchase, and 0.8439 £/m3 for wastewater disposal, totalling 2.2274 £/m3. Within the main site compound, the three main areas are sub-metered: Concrete Batching Plant Caravan Park Site Compound - Remainder
There are also a high number (around 14) of individual stand-pipes which provide mains water at various points across the site - each stand-pipe is monitored, though the current charging scheme for each is unknown. Site Water Consumption The following table summarises the consumption of the 3 main distribution networks on the main site Compound since March 2010:
Distribution Network Weekly Consumption (m3) Concrete Batching Plant 91.6
Caravan Park 95.7 Site Compound - Remainder 61.5
TOTAL 248.8 The following charts summarise the variation in the Specific Water Consumption (SWC) of the Concrete Batching Plant, Caravan Park and the Site Compound - Remainder:
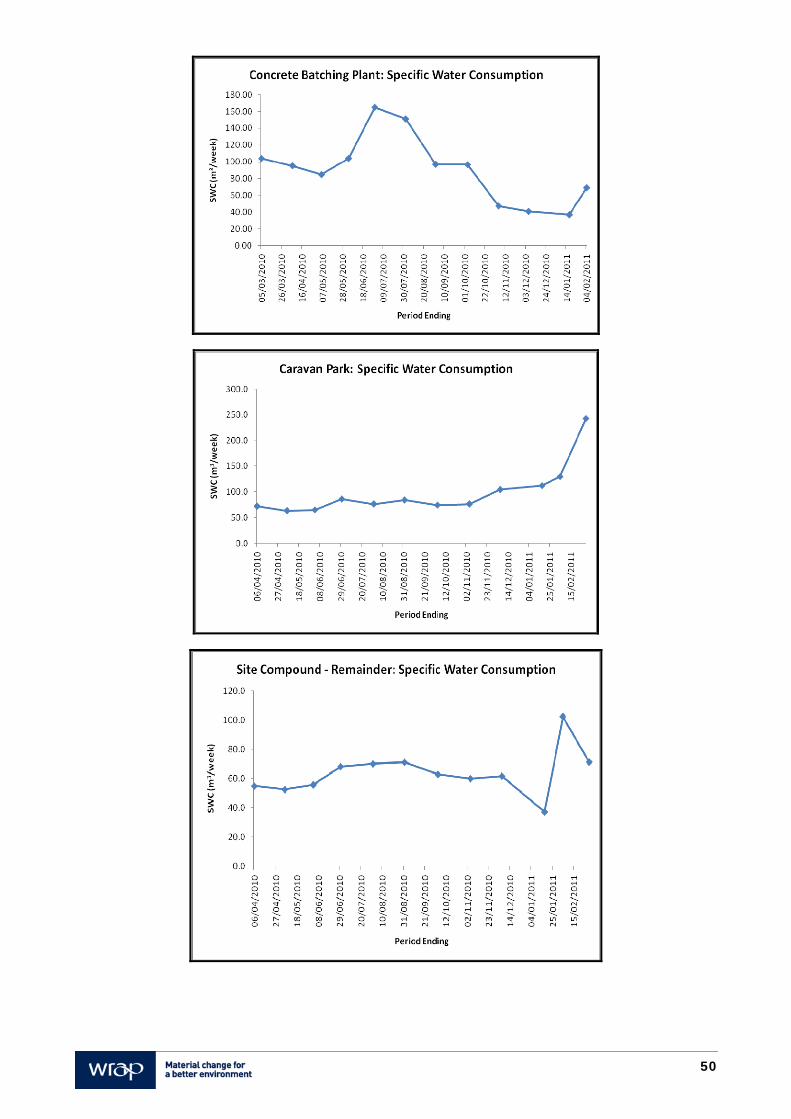
50
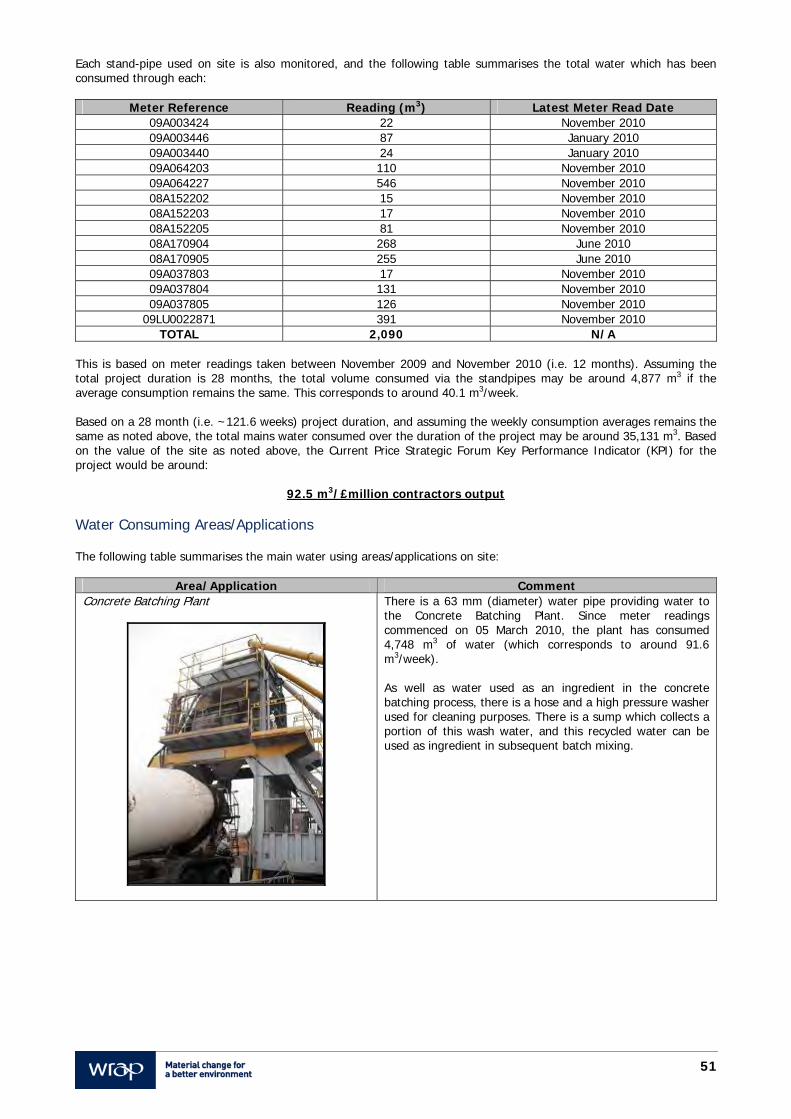
51
Each stand-pipe used on site is also monitored, and the following table summarises the total water which has been consumed through each:
Meter Reference Reading (m3) Latest Meter Read Date 09A003424 22 November 2010 09A003446 87 January 2010 09A003440 24 January 2010 09A064203 110 November 2010 09A064227 546 November 2010 08A152202 15 November 2010 08A152203 17 November 2010 08A152205 81 November 2010 08A170904 268 June 2010 08A170905 255 June 2010 09A037803 17 November 2010 09A037804 131 November 2010 09A037805 126 November 2010
09LU0022871 391 November 2010 TOTAL 2,090 N/A
This is based on meter readings taken between November 2009 and November 2010 (i.e. 12 months). Assuming the total project duration is 28 months, the total volume consumed via the standpipes may be around 4,877 m3 if the average consumption remains the same. This corresponds to around 40.1 m3/week. Based on a 28 month (i.e. ~121.6 weeks) project duration, and assuming the weekly consumption averages remains the same as noted above, the total mains water consumed over the duration of the project may be around 35,131 m3. Based on the value of the site as noted above, the Current Price Strategic Forum Key Performance Indicator (KPI) for the project would be around:
92.5 m3/£million contractors output Water Consuming Areas/Applications The following table summarises the main water using areas/applications on site:
Area/Application Comment Concrete Batching Plant
There is a 63 mm (diameter) water pipe providing water to the Concrete Batching Plant. Since meter readings commenced on 05 March 2010, the plant has consumed 4,748 m3 of water (which corresponds to around 91.6 m3/week). As well as water used as an ingredient in the concrete batching process, there is a hose and a high pressure washer used for cleaning purposes. There is a sump which collects a portion of this wash water, and this recycled water can be used as ingredient in subsequent batch mixing.
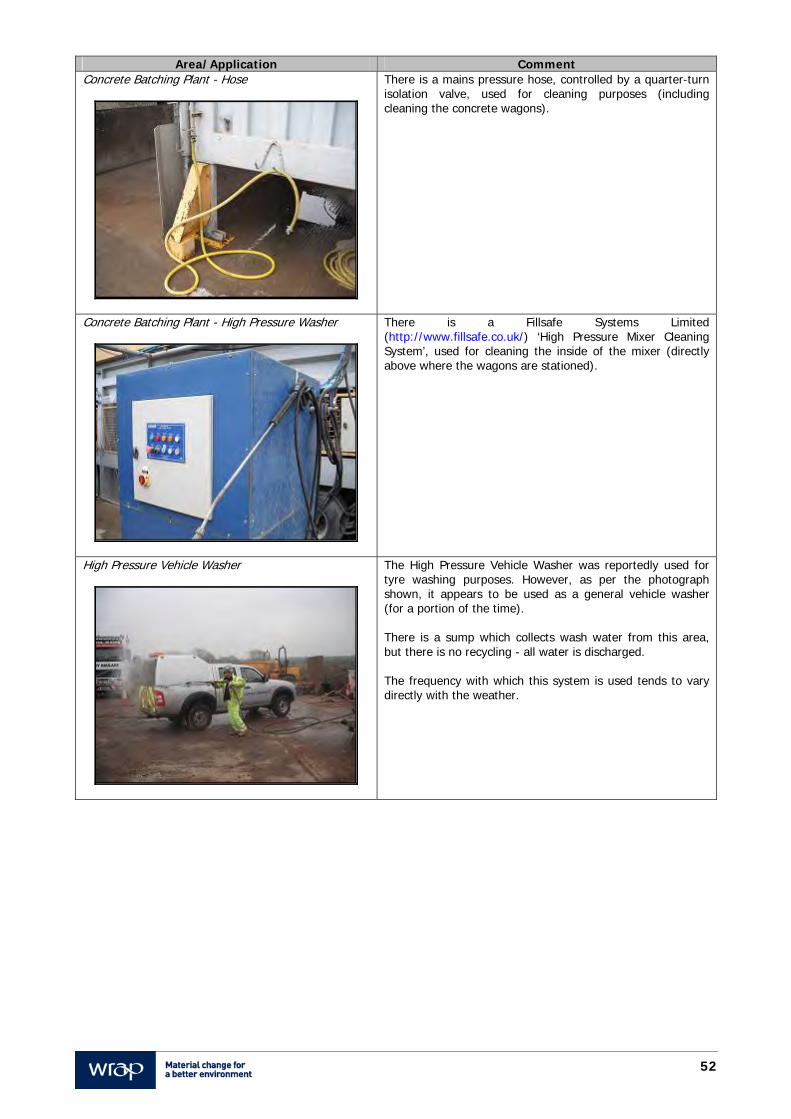
52
Area/Application Comment Concrete Batching Plant - Hose
There is a mains pressure hose, controlled by a quarter-turn isolation valve, used for cleaning purposes (including cleaning the concrete wagons).
Concrete Batching Plant - High Pressure Washer
There is a Fillsafe Systems Limited (http://www.fillsafe.co.uk/) ‘High Pressure Mixer Cleaning System’, used for cleaning the inside of the mixer (directly above where the wagons are stationed).
High Pressure Vehicle Washer
The High Pressure Vehicle Washer was reportedly used for tyre washing purposes. However, as per the photograph shown, it appears to be used as a general vehicle washer (for a portion of the time). There is a sump which collects wash water from this area, but there is no recycling - all water is discharged. The frequency with which this system is used tends to vary directly with the weather.
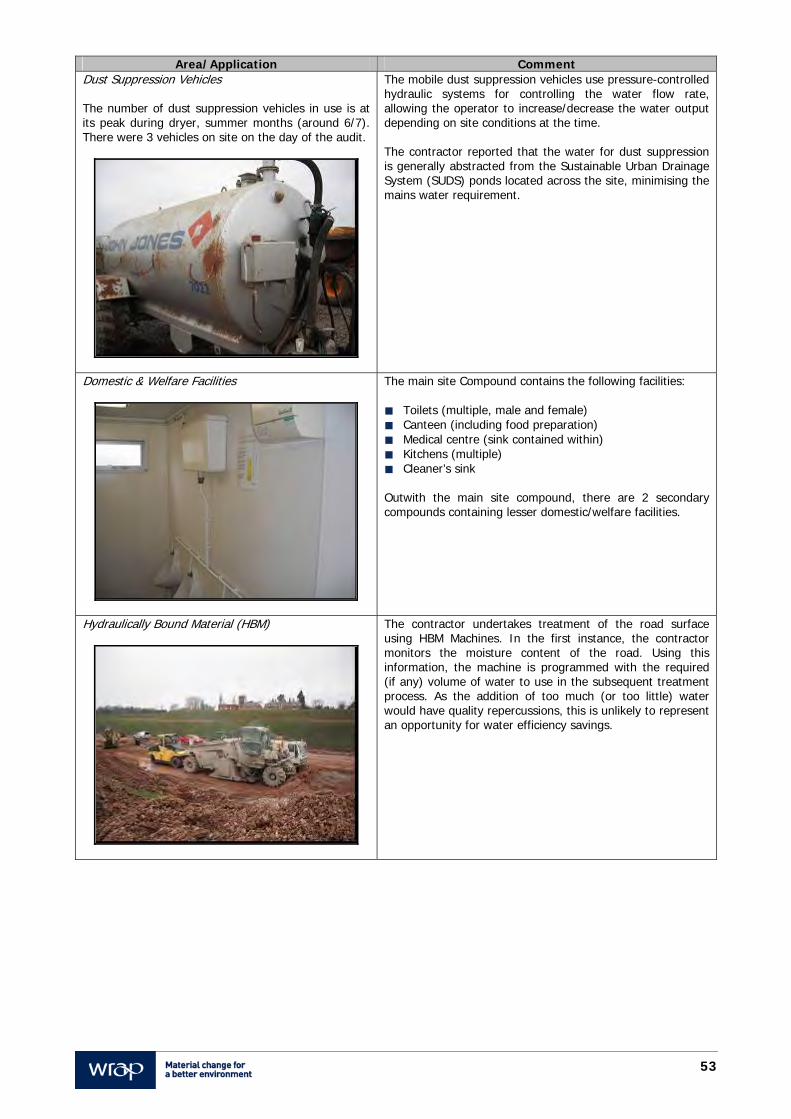
53
Area/Application Comment Dust Suppression Vehicles The number of dust suppression vehicles in use is at its peak during dryer, summer months (around 6/7). There were 3 vehicles on site on the day of the audit.
The mobile dust suppression vehicles use pressure-controlled hydraulic systems for controlling the water flow rate, allowing the operator to increase/decrease the water output depending on site conditions at the time. The contractor reported that the water for dust suppression is generally abstracted from the Sustainable Urban Drainage System (SUDS) ponds located across the site, minimising the mains water requirement.
Domestic & Welfare Facilities
The main site Compound contains the following facilities: Toilets (multiple, male and female) Canteen (including food preparation) Medical centre (sink contained within) Kitchens (multiple) Cleaner’s sink Outwith the main site compound, there are 2 secondary compounds containing lesser domestic/welfare facilities.
Hydraulically Bound Material (HBM)
The contractor undertakes treatment of the road surface using HBM Machines. In the first instance, the contractor monitors the moisture content of the road. Using this information, the machine is programmed with the required (if any) volume of water to use in the subsequent treatment process. As the addition of too much (or too little) water would have quality repercussions, this is unlikely to represent an opportunity for water efficiency savings.
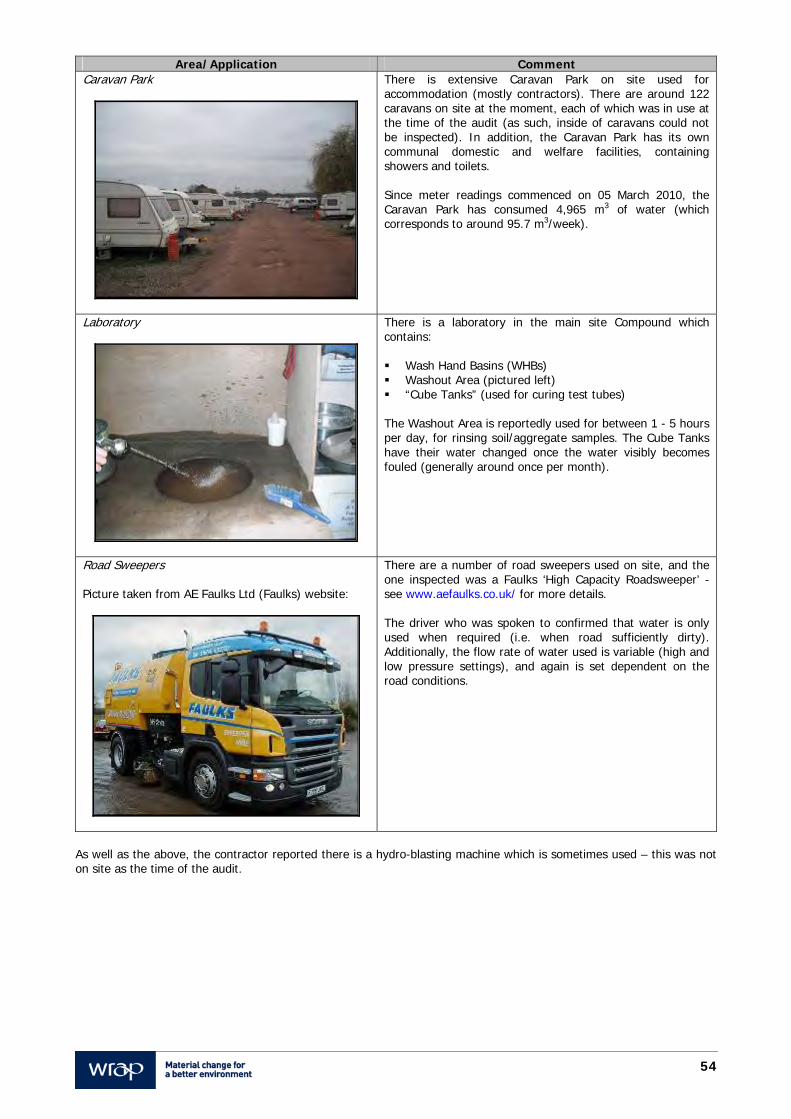
54
Area/Application Comment Caravan Park
There is extensive Caravan Park on site used for accommodation (mostly contractors). There are around 122 caravans on site at the moment, each of which was in use at the time of the audit (as such, inside of caravans could not be inspected). In addition, the Caravan Park has its own communal domestic and welfare facilities, containing showers and toilets. Since meter readings commenced on 05 March 2010, the Caravan Park has consumed 4,965 m3 of water (which corresponds to around 95.7 m3/week).
Laboratory
There is a laboratory in the main site Compound which contains: Wash Hand Basins (WHBs) Washout Area (pictured left) “Cube Tanks” (used for curing test tubes) The Washout Area is reportedly used for between 1 - 5 hours per day, for rinsing soil/aggregate samples. The Cube Tanks have their water changed once the water visibly becomes fouled (generally around once per month).
Road Sweepers Picture taken from AE Faulks Ltd (Faulks) website:
There are a number of road sweepers used on site, and the one inspected was a Faulks ‘High Capacity Roadsweeper’ - see www.aefaulks.co.uk/ for more details. The driver who was spoken to confirmed that water is only used when required (i.e. when road sufficiently dirty). Additionally, the flow rate of water used is variable (high and low pressure settings), and again is set dependent on the road conditions.
As well as the above, the contractor reported there is a hydro-blasting machine which is sometimes used – this was not on site as the time of the audit.
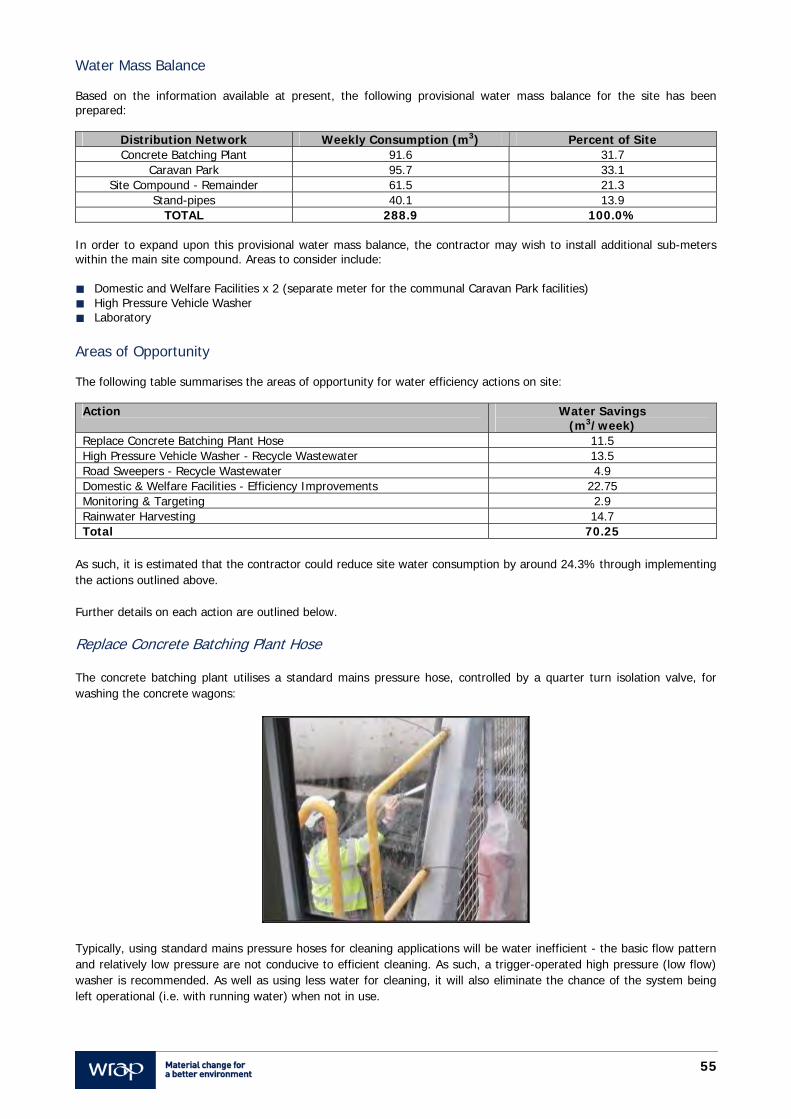
55
Water Mass Balance Based on the information available at present, the following provisional water mass balance for the site has been prepared:
Distribution Network Weekly Consumption (m3) Percent of Site Concrete Batching Plant 91.6 31.7
Caravan Park 95.7 33.1 Site Compound - Remainder 61.5 21.3
Stand-pipes 40.1 13.9 TOTAL 288.9 100.0%
In order to expand upon this provisional water mass balance, the contractor may wish to install additional sub-meters within the main site compound. Areas to consider include: Domestic and Welfare Facilities x 2 (separate meter for the communal Caravan Park facilities) High Pressure Vehicle Washer Laboratory Areas of Opportunity The following table summarises the areas of opportunity for water efficiency actions on site:
Action Water Savings (m3/week)
Replace Concrete Batching Plant Hose 11.5 High Pressure Vehicle Washer - Recycle Wastewater 13.5 Road Sweepers - Recycle Wastewater 4.9 Domestic & Welfare Facilities - Efficiency Improvements 22.75 Monitoring & Targeting 2.9 Rainwater Harvesting 14.7 Total 70.25
As such, it is estimated that the contractor could reduce site water consumption by around 24.3% through implementing the actions outlined above. Further details on each action are outlined below. Replace Concrete Batching Plant Hose The concrete batching plant utilises a standard mains pressure hose, controlled by a quarter turn isolation valve, for washing the concrete wagons:
Typically, using standard mains pressure hoses for cleaning applications will be water inefficient - the basic flow pattern and relatively low pressure are not conducive to efficient cleaning. As such, a trigger-operated high pressure (low flow) washer is recommended. As well as using less water for cleaning, it will also eliminate the chance of the system being left operational (i.e. with running water) when not in use.
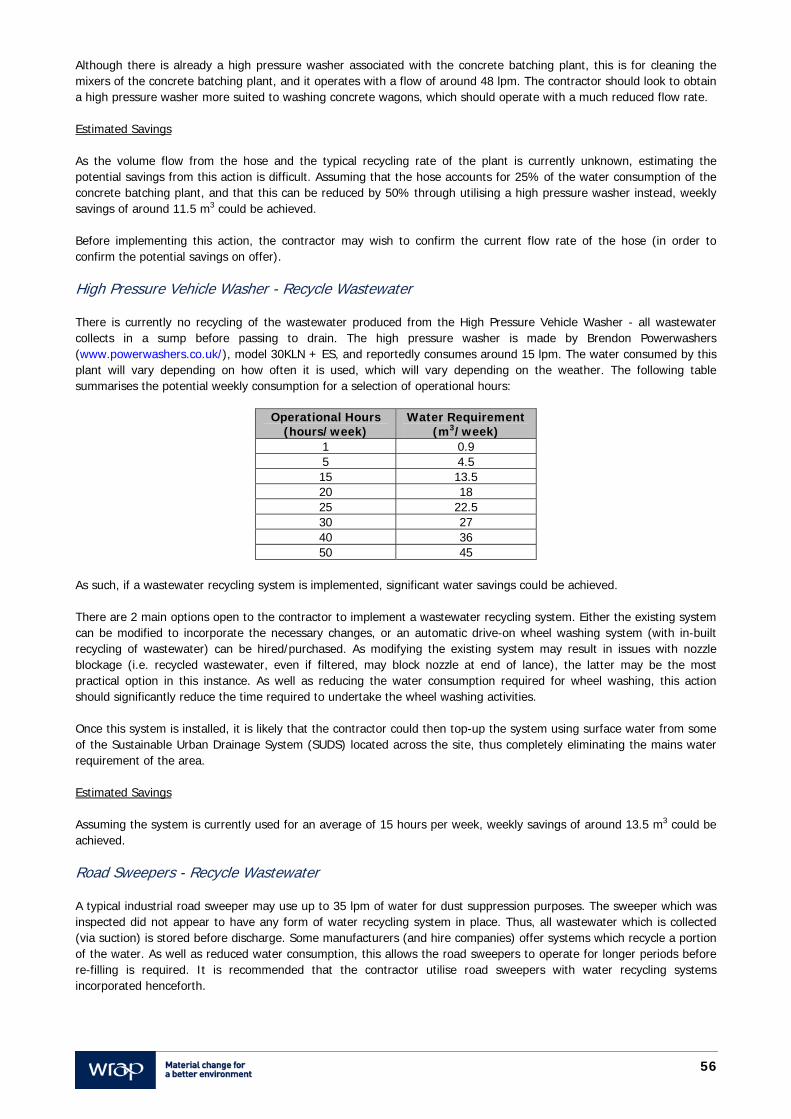
56
Although there is already a high pressure washer associated with the concrete batching plant, this is for cleaning the mixers of the concrete batching plant, and it operates with a flow of around 48 lpm. The contractor should look to obtain a high pressure washer more suited to washing concrete wagons, which should operate with a much reduced flow rate. Estimated Savings As the volume flow from the hose and the typical recycling rate of the plant is currently unknown, estimating the potential savings from this action is difficult. Assuming that the hose accounts for 25% of the water consumption of the concrete batching plant, and that this can be reduced by 50% through utilising a high pressure washer instead, weekly savings of around 11.5 m3 could be achieved. Before implementing this action, the contractor may wish to confirm the current flow rate of the hose (in order to confirm the potential savings on offer). High Pressure Vehicle Washer - Recycle Wastewater There is currently no recycling of the wastewater produced from the High Pressure Vehicle Washer - all wastewater collects in a sump before passing to drain. The high pressure washer is made by Brendon Powerwashers (www.powerwashers.co.uk/), model 30KLN + ES, and reportedly consumes around 15 lpm. The water consumed by this plant will vary depending on how often it is used, which will vary depending on the weather. The following table summarises the potential weekly consumption for a selection of operational hours:
Operational Hours (hours/week)
Water Requirement (m3/week)
1 0.9 5 4.5 15 13.5 20 18 25 22.5 30 27 40 36 50 45
As such, if a wastewater recycling system is implemented, significant water savings could be achieved. There are 2 main options open to the contractor to implement a wastewater recycling system. Either the existing system can be modified to incorporate the necessary changes, or an automatic drive-on wheel washing system (with in-built recycling of wastewater) can be hired/purchased. As modifying the existing system may result in issues with nozzle blockage (i.e. recycled wastewater, even if filtered, may block nozzle at end of lance), the latter may be the most practical option in this instance. As well as reducing the water consumption required for wheel washing, this action should significantly reduce the time required to undertake the wheel washing activities. Once this system is installed, it is likely that the contractor could then top-up the system using surface water from some of the Sustainable Urban Drainage System (SUDS) located across the site, thus completely eliminating the mains water requirement of the area. Estimated Savings Assuming the system is currently used for an average of 15 hours per week, weekly savings of around 13.5 m3 could be achieved. Road Sweepers - Recycle Wastewater A typical industrial road sweeper may use up to 35 lpm of water for dust suppression purposes. The sweeper which was inspected did not appear to have any form of water recycling system in place. Thus, all wastewater which is collected (via suction) is stored before discharge. Some manufacturers (and hire companies) offer systems which recycle a portion of the water. As well as reduced water consumption, this allows the road sweepers to operate for longer periods before re-filling is required. It is recommended that the contractor utilise road sweepers with water recycling systems incorporated henceforth.
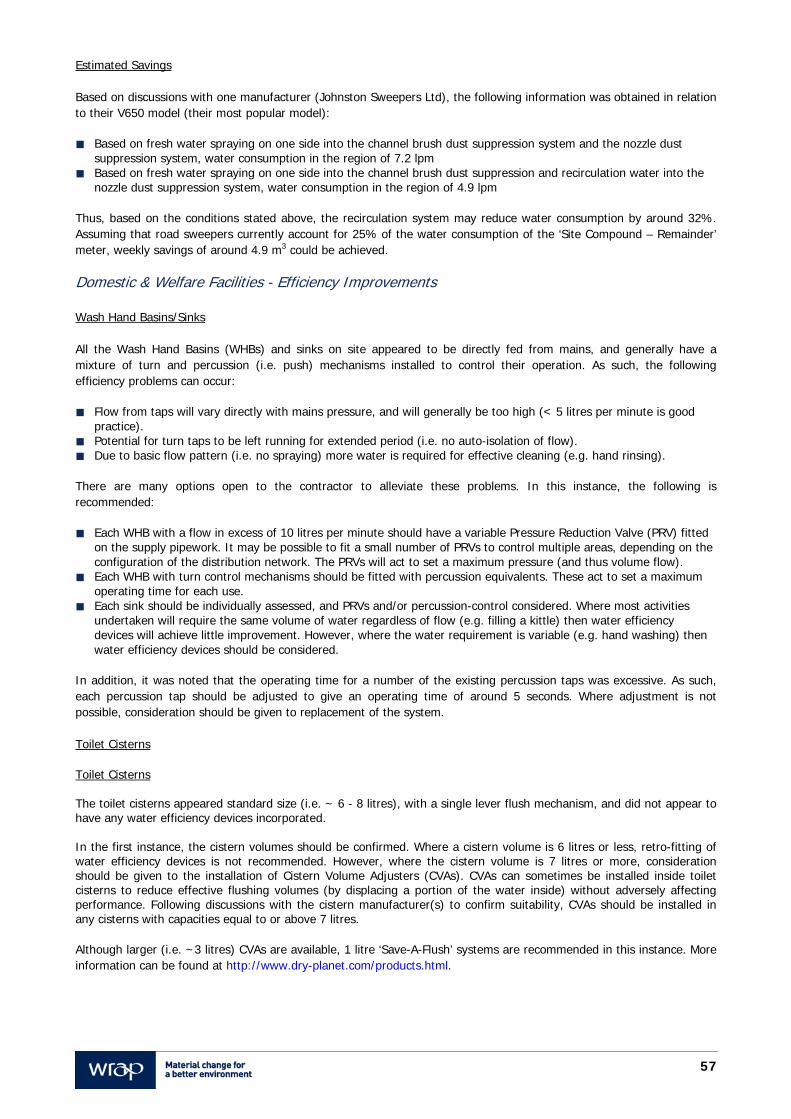
57
Estimated Savings Based on discussions with one manufacturer (Johnston Sweepers Ltd), the following information was obtained in relation to their V650 model (their most popular model): Based on fresh water spraying on one side into the channel brush dust suppression system and the nozzle dust
suppression system, water consumption in the region of 7.2 lpm Based on fresh water spraying on one side into the channel brush dust suppression and recirculation water into the
nozzle dust suppression system, water consumption in the region of 4.9 lpm
Thus, based on the conditions stated above, the recirculation system may reduce water consumption by around 32%. Assuming that road sweepers currently account for 25% of the water consumption of the ‘Site Compound – Remainder’ meter, weekly savings of around 4.9 m3 could be achieved. Domestic & Welfare Facilities - Efficiency Improvements Wash Hand Basins/Sinks All the Wash Hand Basins (WHBs) and sinks on site appeared to be directly fed from mains, and generally have a mixture of turn and percussion (i.e. push) mechanisms installed to control their operation. As such, the following efficiency problems can occur: Flow from taps will vary directly with mains pressure, and will generally be too high (< 5 litres per minute is good
practice). Potential for turn taps to be left running for extended period (i.e. no auto-isolation of flow). Due to basic flow pattern (i.e. no spraying) more water is required for effective cleaning (e.g. hand rinsing).
There are many options open to the contractor to alleviate these problems. In this instance, the following is recommended: Each WHB with a flow in excess of 10 litres per minute should have a variable Pressure Reduction Valve (PRV) fitted
on the supply pipework. It may be possible to fit a small number of PRVs to control multiple areas, depending on the configuration of the distribution network. The PRVs will act to set a maximum pressure (and thus volume flow).
Each WHB with turn control mechanisms should be fitted with percussion equivalents. These act to set a maximum operating time for each use.
Each sink should be individually assessed, and PRVs and/or percussion-control considered. Where most activities undertaken will require the same volume of water regardless of flow (e.g. filling a kittle) then water efficiency devices will achieve little improvement. However, where the water requirement is variable (e.g. hand washing) then water efficiency devices should be considered.
In addition, it was noted that the operating time for a number of the existing percussion taps was excessive. As such, each percussion tap should be adjusted to give an operating time of around 5 seconds. Where adjustment is not possible, consideration should be given to replacement of the system. Toilet Cisterns Toilet Cisterns The toilet cisterns appeared standard size (i.e. ~ 6 - 8 litres), with a single lever flush mechanism, and did not appear to have any water efficiency devices incorporated.
In the first instance, the cistern volumes should be confirmed. Where a cistern volume is 6 litres or less, retro-fitting of water efficiency devices is not recommended. However, where the cistern volume is 7 litres or more, consideration should be given to the installation of Cistern Volume Adjusters (CVAs). CVAs can sometimes be installed inside toilet cisterns to reduce effective flushing volumes (by displacing a portion of the water inside) without adversely affecting performance. Following discussions with the cistern manufacturer(s) to confirm suitability, CVAs should be installed in any cisterns with capacities equal to or above 7 litres. Although larger (i.e. ~3 litres) CVAs are available, 1 litre ‘Save-A-Flush’ systems are recommended in this instance. More information can be found at http://www.dry-planet.com/products.html.
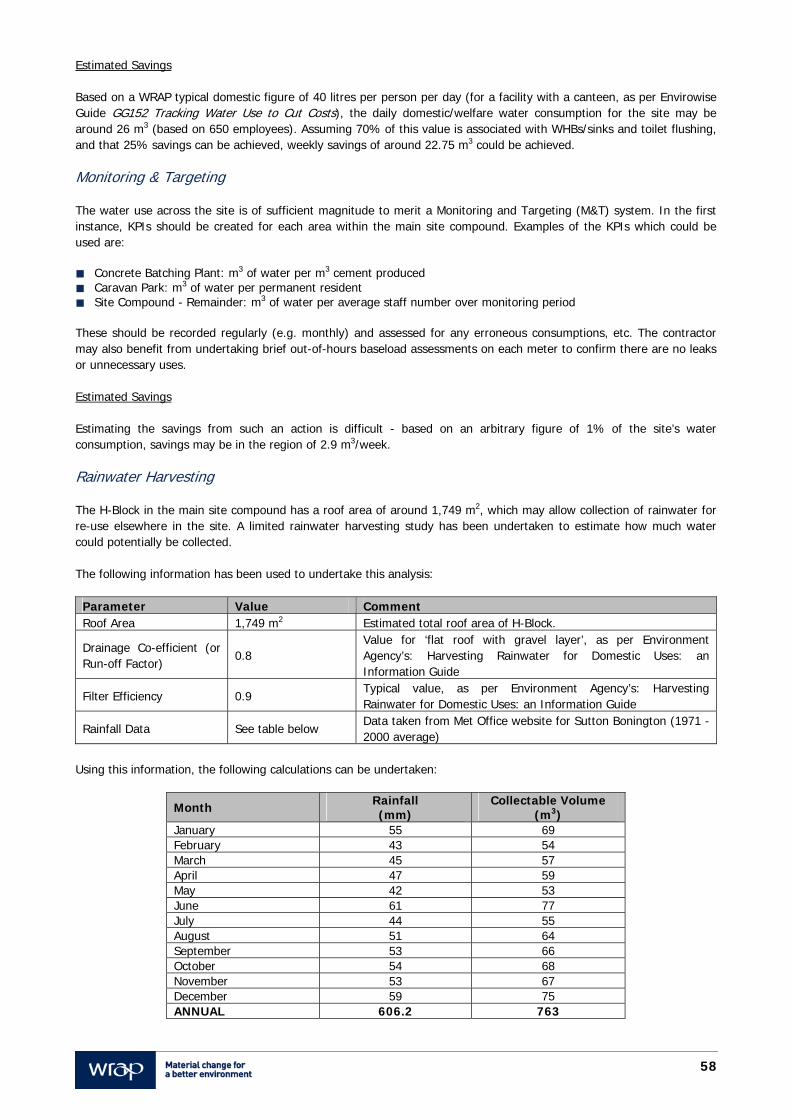
58
Estimated Savings Based on a WRAP typical domestic figure of 40 litres per person per day (for a facility with a canteen, as per Envirowise Guide GG152 Tracking Water Use to Cut Costs), the daily domestic/welfare water consumption for the site may be around 26 m3 (based on 650 employees). Assuming 70% of this value is associated with WHBs/sinks and toilet flushing, and that 25% savings can be achieved, weekly savings of around 22.75 m3 could be achieved. Monitoring & Targeting The water use across the site is of sufficient magnitude to merit a Monitoring and Targeting (M&T) system. In the first instance, KPIs should be created for each area within the main site compound. Examples of the KPIs which could be used are: Concrete Batching Plant: m3 of water per m3 cement produced Caravan Park: m3 of water per permanent resident Site Compound - Remainder: m3 of water per average staff number over monitoring period
These should be recorded regularly (e.g. monthly) and assessed for any erroneous consumptions, etc. The contractor may also benefit from undertaking brief out-of-hours baseload assessments on each meter to confirm there are no leaks or unnecessary uses. Estimated Savings Estimating the savings from such an action is difficult - based on an arbitrary figure of 1% of the site’s water consumption, savings may be in the region of 2.9 m3/week. Rainwater Harvesting The H-Block in the main site compound has a roof area of around 1,749 m2, which may allow collection of rainwater for re-use elsewhere in the site. A limited rainwater harvesting study has been undertaken to estimate how much water could potentially be collected. The following information has been used to undertake this analysis:
Parameter Value Comment Roof Area 1,749 m2 Estimated total roof area of H-Block.
Drainage Co-efficient (or Run-off Factor)
0.8 Value for ‘flat roof with gravel layer’, as per Environment Agency’s: Harvesting Rainwater for Domestic Uses: an Information Guide
Filter Efficiency 0.9 Typical value, as per Environment Agency’s: Harvesting Rainwater for Domestic Uses: an Information Guide
Rainfall Data See table below Data taken from Met Office website for Sutton Bonington (1971 - 2000 average)
Using this information, the following calculations can be undertaken:
Month Rainfall (mm)
Collectable Volume (m3)
January 55 69 February 43 54 March 45 57 April 47 59 May 42 53 June 61 77 July 44 55 August 51 64 September 53 66 October 54 68 November 53 67 December 59 75 ANNUAL 606.2 763

59
As such, around 14.7 m3/week (average figure) of water could be collected for re-use by rainwater harvesting. There are a number of potential areas where this water could be used, including: Hosing water around Concrete Batching Plant High Pressure Vehicle Washer Toilet Flushing Laboratory Washout Area
Estimated Savings Assuming all collected water can be re-used, weekly savings of around 14.7 m3/week may be possible.
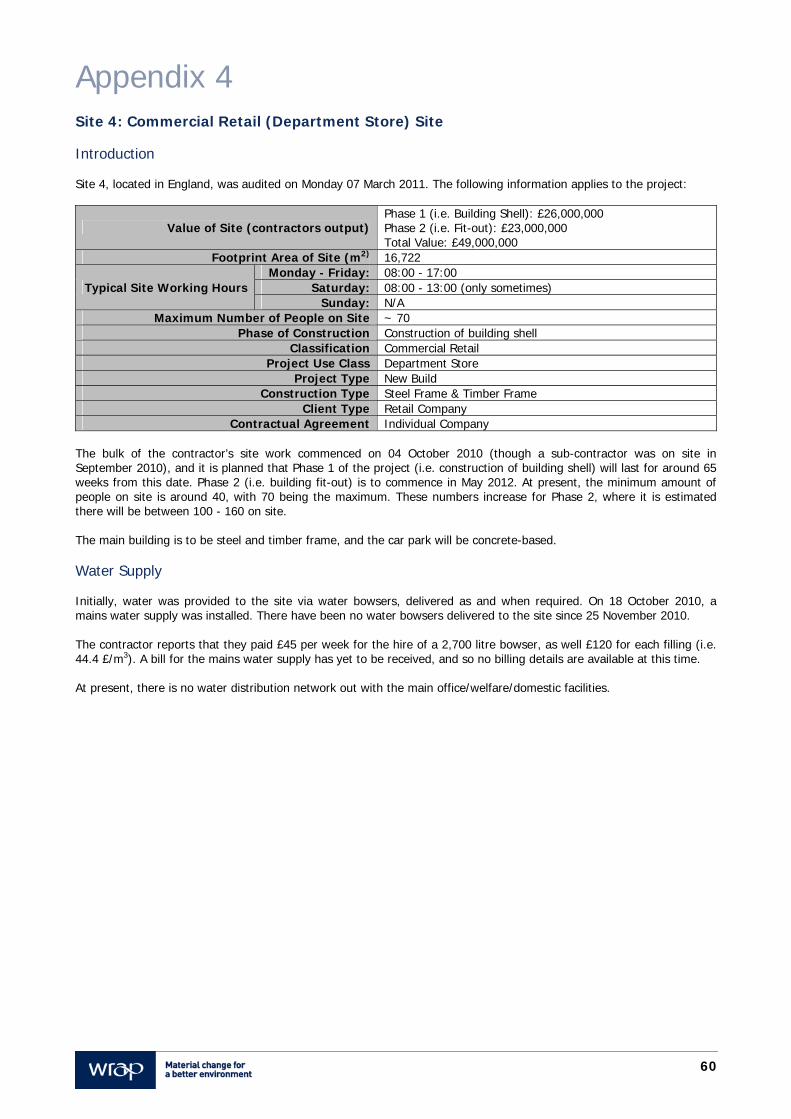
60
Appendix 4 Site 4: Commercial Retail (Department Store) Site Introduction Site 4, located in England, was audited on Monday 07 March 2011. The following information applies to the project:
Value of Site (contractors output)Phase 1 (i.e. Building Shell): £26,000,000 Phase 2 (i.e. Fit-out): £23,000,000 Total Value: £49,000,000
Footprint Area of Site (m2) 16,722
Typical Site Working Hours Monday - Friday: 08:00 - 17:00
Saturday: 08:00 - 13:00 (only sometimes) Sunday: N/A
Maximum Number of People on Site ~ 70 Phase of Construction Construction of building shell
Classification Commercial Retail Project Use Class Department Store
Project Type New Build Construction Type Steel Frame & Timber Frame
Client Type Retail Company Contractual Agreement Individual Company
The bulk of the contractor’s site work commenced on 04 October 2010 (though a sub-contractor was on site in September 2010), and it is planned that Phase 1 of the project (i.e. construction of building shell) will last for around 65 weeks from this date. Phase 2 (i.e. building fit-out) is to commence in May 2012. At present, the minimum amount of people on site is around 40, with 70 being the maximum. These numbers increase for Phase 2, where it is estimated there will be between 100 - 160 on site. The main building is to be steel and timber frame, and the car park will be concrete-based. Water Supply Initially, water was provided to the site via water bowsers, delivered as and when required. On 18 October 2010, a mains water supply was installed. There have been no water bowsers delivered to the site since 25 November 2010. The contractor reports that they paid £45 per week for the hire of a 2,700 litre bowser, as well £120 for each filling (i.e. 44.4 £/m3). A bill for the mains water supply has yet to be received, and so no billing details are available at this time. At present, there is no water distribution network out with the main office/welfare/domestic facilities.
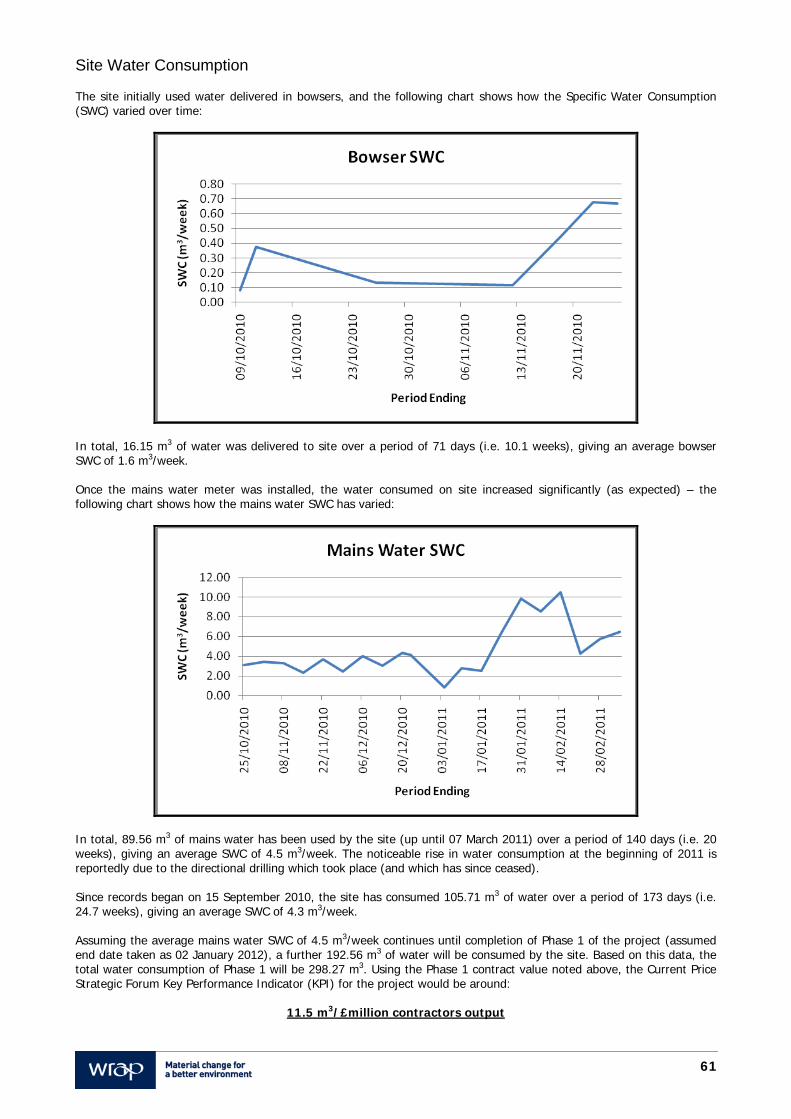
61
Site Water Consumption The site initially used water delivered in bowsers, and the following chart shows how the Specific Water Consumption (SWC) varied over time:
In total, 16.15 m3 of water was delivered to site over a period of 71 days (i.e. 10.1 weeks), giving an average bowser SWC of 1.6 m3/week. Once the mains water meter was installed, the water consumed on site increased significantly (as expected) – the following chart shows how the mains water SWC has varied:
In total, 89.56 m3 of mains water has been used by the site (up until 07 March 2011) over a period of 140 days (i.e. 20 weeks), giving an average SWC of 4.5 m3/week. The noticeable rise in water consumption at the beginning of 2011 is reportedly due to the directional drilling which took place (and which has since ceased). Since records began on 15 September 2010, the site has consumed 105.71 m3 of water over a period of 173 days (i.e. 24.7 weeks), giving an average SWC of 4.3 m3/week. Assuming the average mains water SWC of 4.5 m3/week continues until completion of Phase 1 of the project (assumed end date taken as 02 January 2012), a further 192.56 m3 of water will be consumed by the site. Based on this data, the total water consumption of Phase 1 will be 298.27 m3. Using the Phase 1 contract value noted above, the Current Price Strategic Forum Key Performance Indicator (KPI) for the project would be around:
11.5 m3/£million contractors output
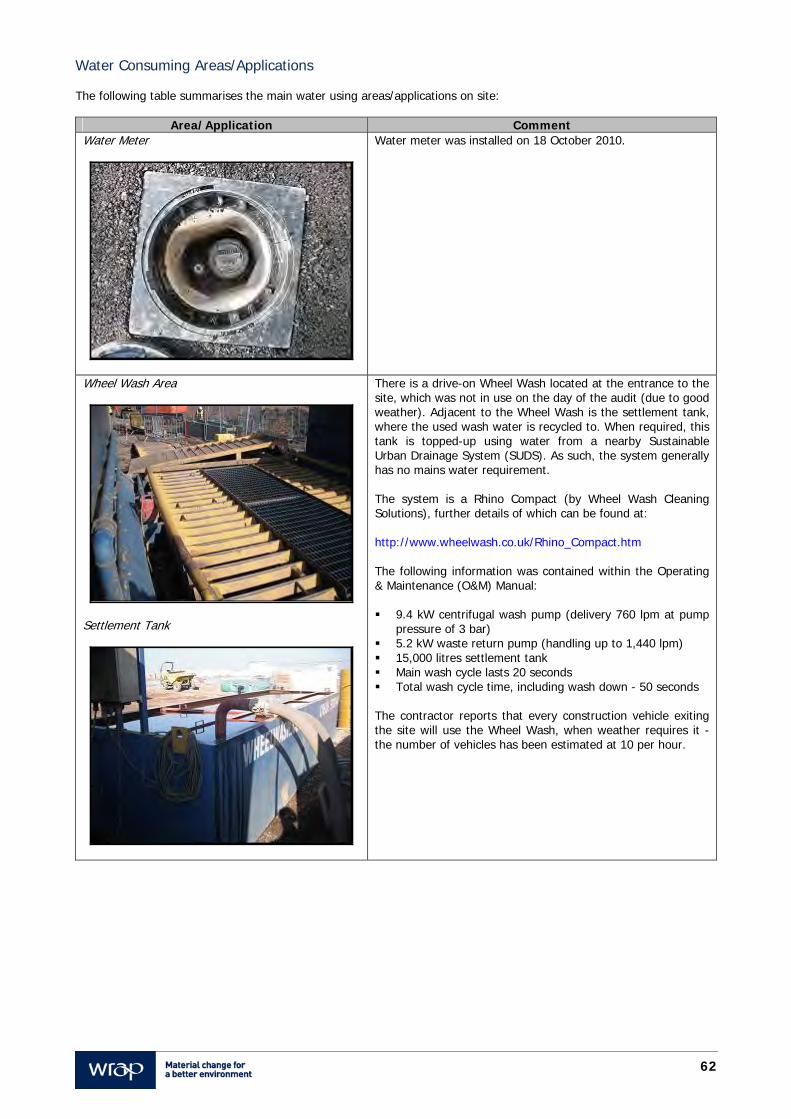
62
Water Consuming Areas/Applications The following table summarises the main water using areas/applications on site:
Area/Application Comment Water Meter
Water meter was installed on 18 October 2010.
Wheel Wash Area
Settlement Tank
There is a drive-on Wheel Wash located at the entrance to the site, which was not in use on the day of the audit (due to good weather). Adjacent to the Wheel Wash is the settlement tank, where the used wash water is recycled to. When required, this tank is topped-up using water from a nearby Sustainable Urban Drainage System (SUDS). As such, the system generally has no mains water requirement. The system is a Rhino Compact (by Wheel Wash Cleaning Solutions), further details of which can be found at: http://www.wheelwash.co.uk/Rhino_Compact.htm The following information was contained within the Operating & Maintenance (O&M) Manual: 9.4 kW centrifugal wash pump (delivery 760 lpm at pump
pressure of 3 bar) 5.2 kW waste return pump (handling up to 1,440 lpm) 15,000 litres settlement tank Main wash cycle lasts 20 seconds Total wash cycle time, including wash down - 50 seconds The contractor reports that every construction vehicle exiting the site will use the Wheel Wash, when weather requires it - the number of vehicles has been estimated at 10 per hour.
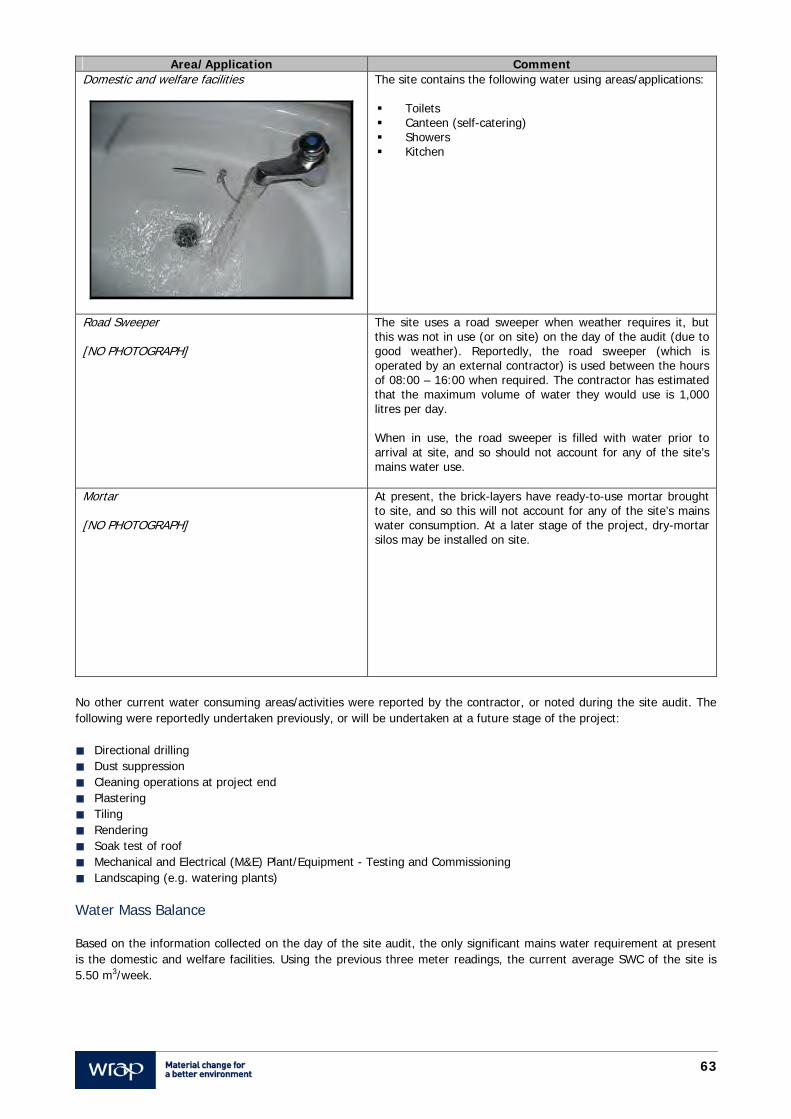
63
Area/Application Comment Domestic and welfare facilities
The site contains the following water using areas/applications: Toilets Canteen (self-catering) Showers Kitchen
Road Sweeper [NO PHOTOGRAPH]
The site uses a road sweeper when weather requires it, but this was not in use (or on site) on the day of the audit (due to good weather). Reportedly, the road sweeper (which is operated by an external contractor) is used between the hours of 08:00 – 16:00 when required. The contractor has estimated that the maximum volume of water they would use is 1,000 litres per day. When in use, the road sweeper is filled with water prior to arrival at site, and so should not account for any of the site’s mains water use.
Mortar [NO PHOTOGRAPH]
At present, the brick-layers have ready-to-use mortar brought to site, and so this will not account for any of the site’s mains water consumption. At a later stage of the project, dry-mortar silos may be installed on site.
No other current water consuming areas/activities were reported by the contractor, or noted during the site audit. The following were reportedly undertaken previously, or will be undertaken at a future stage of the project: Directional drilling Dust suppression Cleaning operations at project end Plastering Tiling Rendering Soak test of roof Mechanical and Electrical (M&E) Plant/Equipment - Testing and Commissioning Landscaping (e.g. watering plants) Water Mass Balance Based on the information collected on the day of the site audit, the only significant mains water requirement at present is the domestic and welfare facilities. Using the previous three meter readings, the current average SWC of the site is 5.50 m3/week.
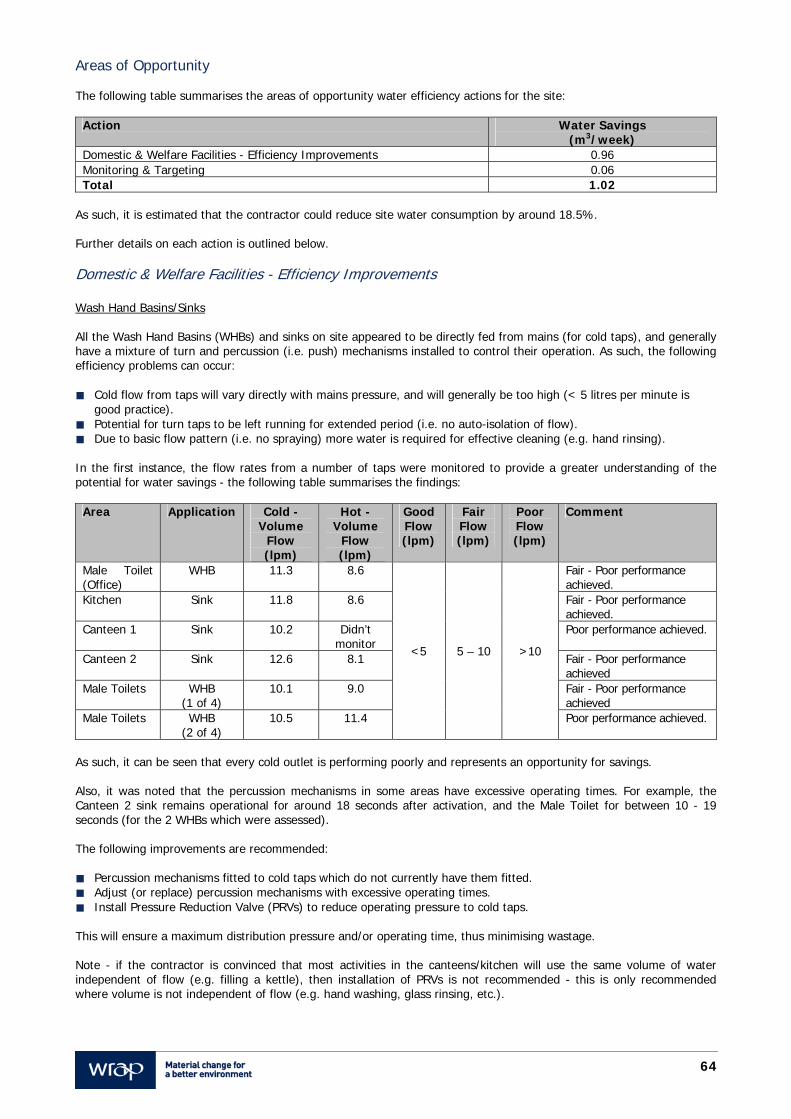
64
Areas of Opportunity The following table summarises the areas of opportunity water efficiency actions for the site:
Action Water Savings (m3/week)
Domestic & Welfare Facilities - Efficiency Improvements 0.96 Monitoring & Targeting 0.06 Total 1.02
As such, it is estimated that the contractor could reduce site water consumption by around 18.5%. Further details on each action is outlined below. Domestic & Welfare Facilities - Efficiency Improvements Wash Hand Basins/Sinks All the Wash Hand Basins (WHBs) and sinks on site appeared to be directly fed from mains (for cold taps), and generally have a mixture of turn and percussion (i.e. push) mechanisms installed to control their operation. As such, the following efficiency problems can occur:
Cold flow from taps will vary directly with mains pressure, and will generally be too high (< 5 litres per minute is
good practice). Potential for turn taps to be left running for extended period (i.e. no auto-isolation of flow). Due to basic flow pattern (i.e. no spraying) more water is required for effective cleaning (e.g. hand rinsing).
In the first instance, the flow rates from a number of taps were monitored to provide a greater understanding of the potential for water savings - the following table summarises the findings:
Area Application Cold - Volume
Flow (lpm)
Hot - Volume
Flow (lpm)
Good Flow (lpm)
Fair Flow (lpm)
Poor Flow (lpm)
Comment
Male Toilet (Office)
WHB 11.3 8.6
<5 5 – 10 >10
Fair - Poor performance achieved.
Kitchen Sink 11.8 8.6 Fair - Poor performance achieved.
Canteen 1 Sink 10.2 Didn’t monitor
Poor performance achieved.
Canteen 2 Sink 12.6 8.1 Fair - Poor performance achieved
Male Toilets WHB (1 of 4)
10.1 9.0 Fair - Poor performance achieved
Male Toilets WHB (2 of 4)
10.5 11.4 Poor performance achieved.
As such, it can be seen that every cold outlet is performing poorly and represents an opportunity for savings. Also, it was noted that the percussion mechanisms in some areas have excessive operating times. For example, the Canteen 2 sink remains operational for around 18 seconds after activation, and the Male Toilet for between 10 - 19 seconds (for the 2 WHBs which were assessed). The following improvements are recommended: Percussion mechanisms fitted to cold taps which do not currently have them fitted. Adjust (or replace) percussion mechanisms with excessive operating times. Install Pressure Reduction Valve (PRVs) to reduce operating pressure to cold taps.
This will ensure a maximum distribution pressure and/or operating time, thus minimising wastage. Note - if the contractor is convinced that most activities in the canteens/kitchen will use the same volume of water independent of flow (e.g. filling a kettle), then installation of PRVs is not recommended - this is only recommended where volume is not independent of flow (e.g. hand washing, glass rinsing, etc.).
65
Toilet Cisterns The toilet cisterns appeared standard size (i.e. ~ 6 – 8 litres), with a single lever flush mechanism, and did not appear to have any water efficiency devices incorporated.
In the first instance, the cistern volumes should be confirmed. Where a cistern volume is 6 litres or less, retro-fitting of water efficiency devices is not recommended. However, where the cistern volume is 7 litres or more, consideration should be given to the installation of Cistern Volume Adjusters (CVAs). CVAs can sometimes be installed inside toilet cisterns to reduce effective flushing volumes (by displacing a portion of the water inside) without adversely affecting performance. Following discussions with the cistern manufacturer(s) to confirm suitability, CVAs should be installed in any cisterns with capacities equal to or above 7 litres. Although larger (i.e. ~3 litres) CVAs are available, 1 litre ‘Save-A-Flush’ systems are recommended in this instance. More information can be found at http://www.dry-planet.com/products.html. Estimated Savings Assuming 70% of current SWC is associated with WHBs/sinks and toilet flushing, and that 25% savings can be achieved, weekly savings of around 0.96 m3 could be achieved. Monitoring & Targeting It is recommended that the contractor implements a simple Monitoring & Targeting (M&T) system for the site’s water consumption - this will involve undertaking two main actions on a regular basis: Track water consumed (m3) per week, and assess for erroneous consumption. Once per month, conduct brief out-of-hours assessment of baseload water consumption.
The contractor may wish to develop a KPI for water, relating it to a factor such as average persons on site for the monitoring period - as a significant portion of the water consumption is associated with domestic/welfare, this should prove a useful analysis. These actions should help identify (and eliminate) unnecessary water consumption on site. Estimated Savings Estimating the savings from such an action is difficult, and will vary from site to site - in this instance an arbitrary figure of 1% of the current site water consumption will be used - this accounts to around 0.06 m3/week.
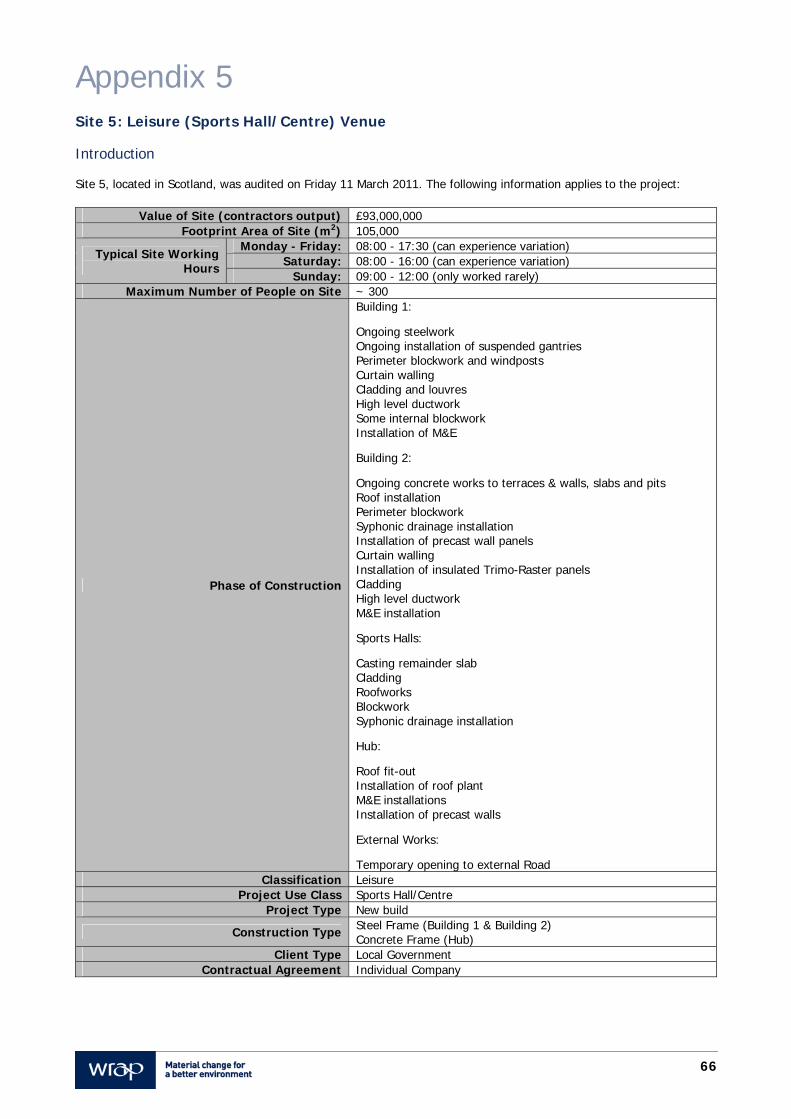
66
Appendix 5 Site 5: Leisure (Sports Hall/Centre) Venue Introduction Site 5, located in Scotland, was audited on Friday 11 March 2011. The following information applies to the project:
Value of Site (contractors output) £93,000,000 Footprint Area of Site (m2) 105,000
Typical Site Working Hours
Monday - Friday: 08:00 - 17:30 (can experience variation) Saturday: 08:00 - 16:00 (can experience variation)
Sunday: 09:00 - 12:00 (only worked rarely) Maximum Number of People on Site ~ 300
Phase of Construction
Building 1:
Ongoing steelwork Ongoing installation of suspended gantries Perimeter blockwork and windposts Curtain walling Cladding and louvres High level ductwork Some internal blockwork Installation of M&E
Building 2:
Ongoing concrete works to terraces & walls, slabs and pits Roof installation Perimeter blockwork Syphonic drainage installation Installation of precast wall panels Curtain walling Installation of insulated Trimo-Raster panels Cladding High level ductwork M&E installation
Sports Halls:
Casting remainder slab Cladding Roofworks Blockwork Syphonic drainage installation
Hub:
Roof fit-out Installation of roof plant M&E installations Installation of precast walls
External Works:
Temporary opening to external Road Classification Leisure
Project Use Class Sports Hall/Centre Project Type New build
Construction Type Steel Frame (Building 1 & Building 2) Concrete Frame (Hub)
Client Type Local Government Contractual Agreement Individual Company
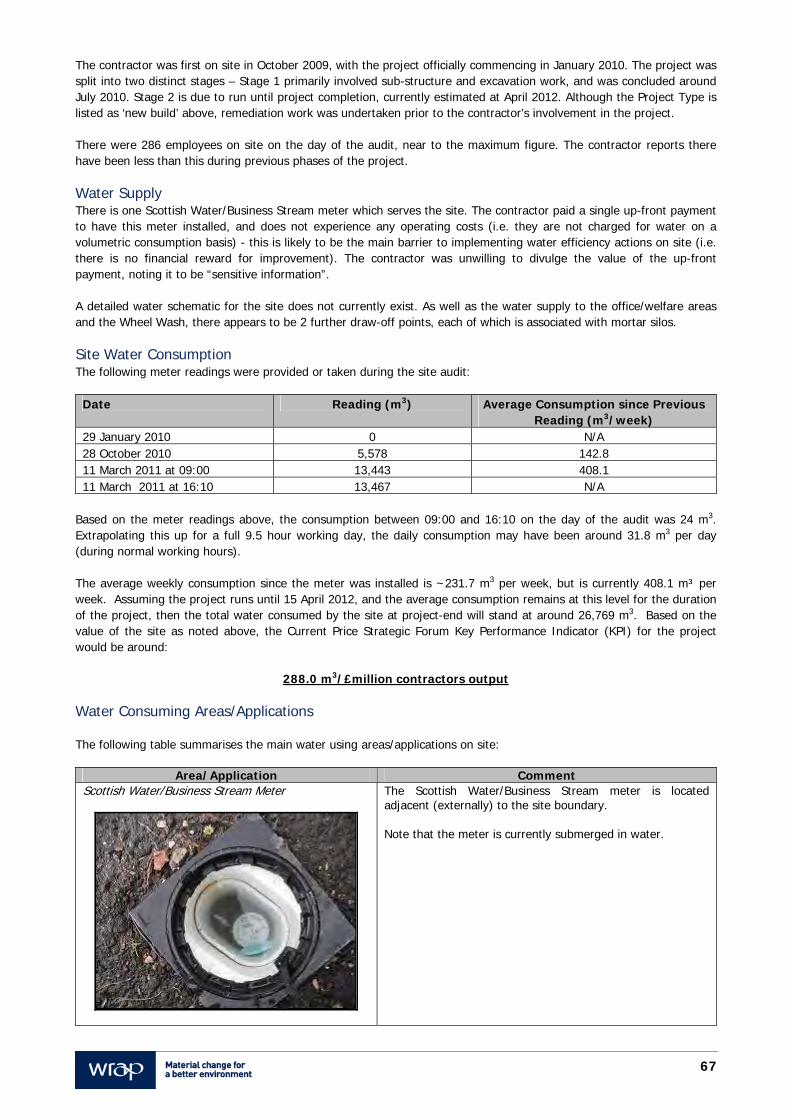
67
The contractor was first on site in October 2009, with the project officially commencing in January 2010. The project was split into two distinct stages – Stage 1 primarily involved sub-structure and excavation work, and was concluded around July 2010. Stage 2 is due to run until project completion, currently estimated at April 2012. Although the Project Type is listed as ‘new build’ above, remediation work was undertaken prior to the contractor’s involvement in the project. There were 286 employees on site on the day of the audit, near to the maximum figure. The contractor reports there have been less than this during previous phases of the project. Water Supply There is one Scottish Water/Business Stream meter which serves the site. The contractor paid a single up-front payment to have this meter installed, and does not experience any operating costs (i.e. they are not charged for water on a volumetric consumption basis) - this is likely to be the main barrier to implementing water efficiency actions on site (i.e. there is no financial reward for improvement). The contractor was unwilling to divulge the value of the up-front payment, noting it to be “sensitive information”. A detailed water schematic for the site does not currently exist. As well as the water supply to the office/welfare areas and the Wheel Wash, there appears to be 2 further draw-off points, each of which is associated with mortar silos. Site Water Consumption The following meter readings were provided or taken during the site audit:
Date Reading (m3) Average Consumption since Previous Reading (m3/week)
29 January 2010 0 N/A 28 October 2010 5,578 142.8 11 March 2011 at 09:00 13,443 408.1 11 March 2011 at 16:10 13,467 N/A
Based on the meter readings above, the consumption between 09:00 and 16:10 on the day of the audit was 24 m3. Extrapolating this up for a full 9.5 hour working day, the daily consumption may have been around 31.8 m3 per day (during normal working hours). The average weekly consumption since the meter was installed is ~231.7 m3 per week, but is currently 408.1 m³ per week. Assuming the project runs until 15 April 2012, and the average consumption remains at this level for the duration of the project, then the total water consumed by the site at project-end will stand at around 26,769 m3. Based on the value of the site as noted above, the Current Price Strategic Forum Key Performance Indicator (KPI) for the project would be around:
288.0 m3/£million contractors output Water Consuming Areas/Applications The following table summarises the main water using areas/applications on site:
Area/Application Comment Scottish Water/Business Stream Meter
The Scottish Water/Business Stream meter is located adjacent (externally) to the site boundary. Note that the meter is currently submerged in water.
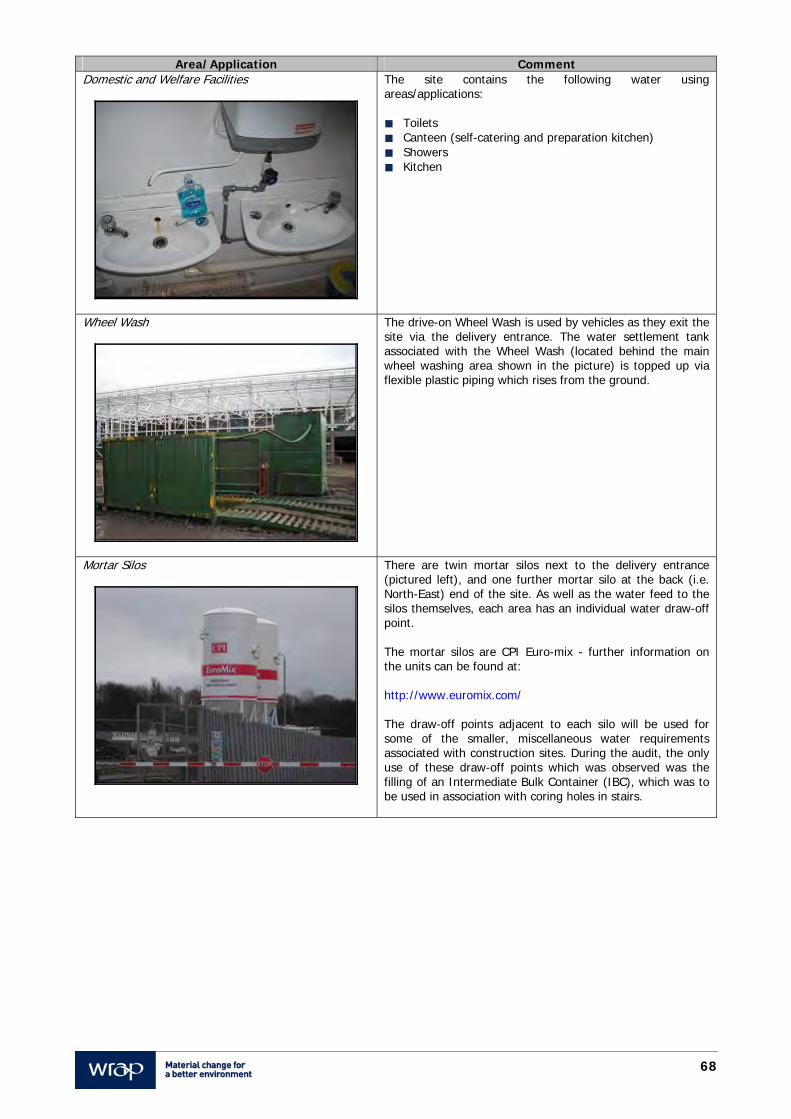
68
Area/Application Comment Domestic and Welfare Facilities
The site contains the following water using areas/applications: Toilets Canteen (self-catering and preparation kitchen) Showers Kitchen
Wheel Wash
The drive-on Wheel Wash is used by vehicles as they exit the site via the delivery entrance. The water settlement tank associated with the Wheel Wash (located behind the main wheel washing area shown in the picture) is topped up via flexible plastic piping which rises from the ground.
Mortar Silos
There are twin mortar silos next to the delivery entrance (pictured left), and one further mortar silo at the back (i.e. North-East) end of the site. As well as the water feed to the silos themselves, each area has an individual water draw-off point. The mortar silos are CPI Euro-mix - further information on the units can be found at: http://www.euromix.com/ The draw-off points adjacent to each silo will be used for some of the smaller, miscellaneous water requirements associated with construction sites. During the audit, the only use of these draw-off points which was observed was the filling of an Intermediate Bulk Container (IBC), which was to be used in association with coring holes in stairs.
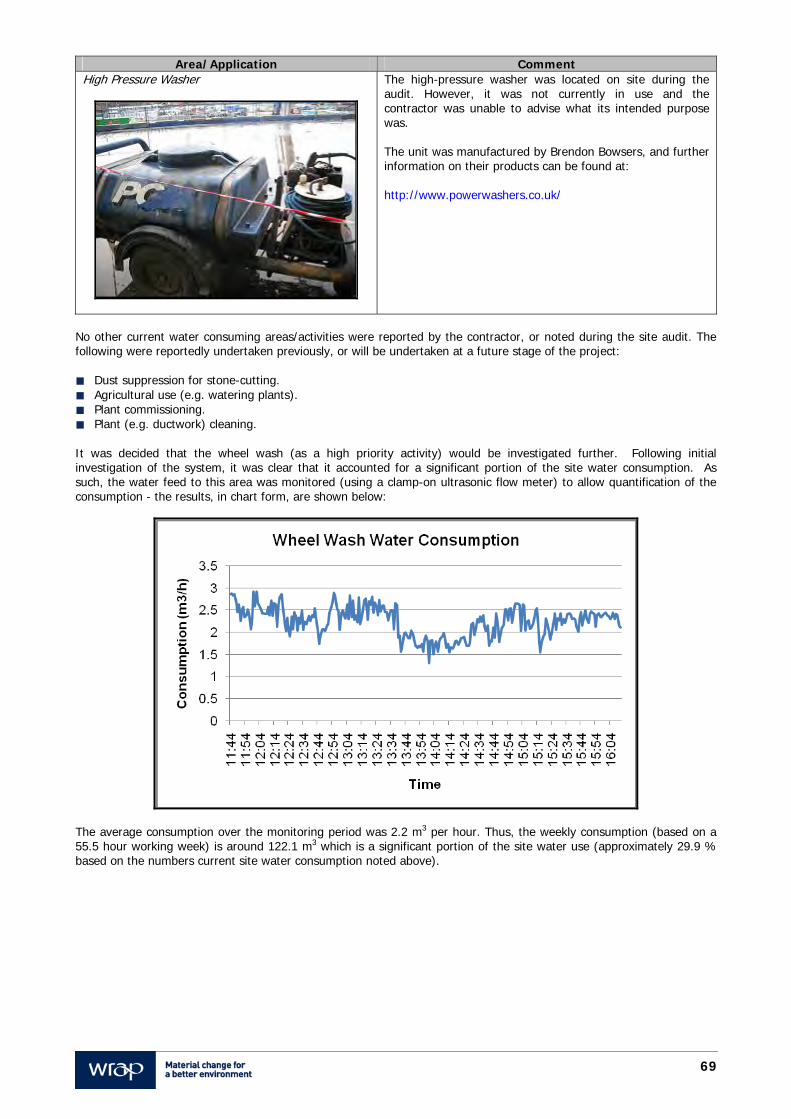
69
Area/Application Comment High Pressure Washer
The high-pressure washer was located on site during the audit. However, it was not currently in use and the contractor was unable to advise what its intended purpose was. The unit was manufactured by Brendon Bowsers, and further information on their products can be found at: http://www.powerwashers.co.uk/
No other current water consuming areas/activities were reported by the contractor, or noted during the site audit. The following were reportedly undertaken previously, or will be undertaken at a future stage of the project: Dust suppression for stone-cutting. Agricultural use (e.g. watering plants). Plant commissioning. Plant (e.g. ductwork) cleaning.
It was decided that the wheel wash (as a high priority activity) would be investigated further. Following initial investigation of the system, it was clear that it accounted for a significant portion of the site water consumption. As such, the water feed to this area was monitored (using a clamp-on ultrasonic flow meter) to allow quantification of the consumption - the results, in chart form, are shown below:
The average consumption over the monitoring period was 2.2 m3 per hour. Thus, the weekly consumption (based on a 55.5 hour working week) is around 122.1 m3 which is a significant portion of the site water use (approximately 29.9 % based on the numbers current site water consumption noted above).
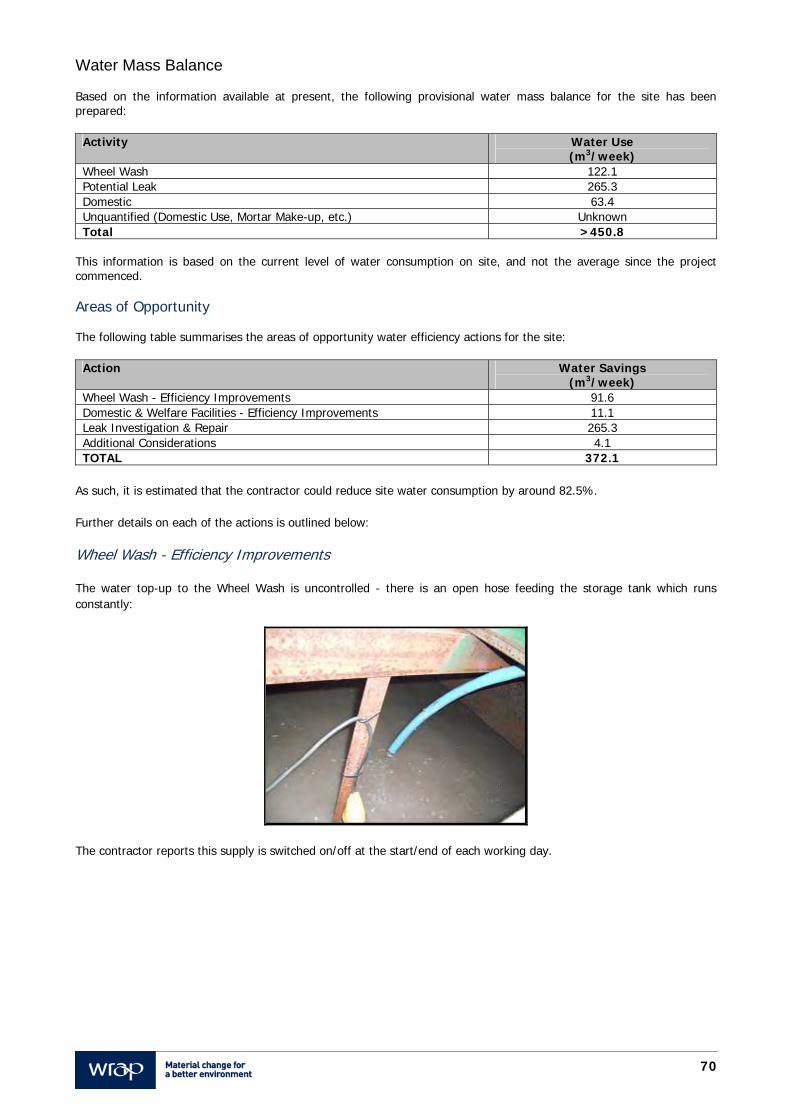
70
Water Mass Balance Based on the information available at present, the following provisional water mass balance for the site has been prepared:
Activity Water Use (m3/week)
Wheel Wash 122.1 Potential Leak 265.3 Domestic 63.4 Unquantified (Domestic Use, Mortar Make-up, etc.) Unknown Total >450.8
This information is based on the current level of water consumption on site, and not the average since the project commenced. Areas of Opportunity The following table summarises the areas of opportunity water efficiency actions for the site:
Action Water Savings (m3/week)
Wheel Wash - Efficiency Improvements 91.6 Domestic & Welfare Facilities - Efficiency Improvements 11.1 Leak Investigation & Repair 265.3 Additional Considerations 4.1 TOTAL 372.1
As such, it is estimated that the contractor could reduce site water consumption by around 82.5%. Further details on each of the actions is outlined below: Wheel Wash - Efficiency Improvements The water top-up to the Wheel Wash is uncontrolled - there is an open hose feeding the storage tank which runs constantly:
The contractor reports this supply is switched on/off at the start/end of each working day.
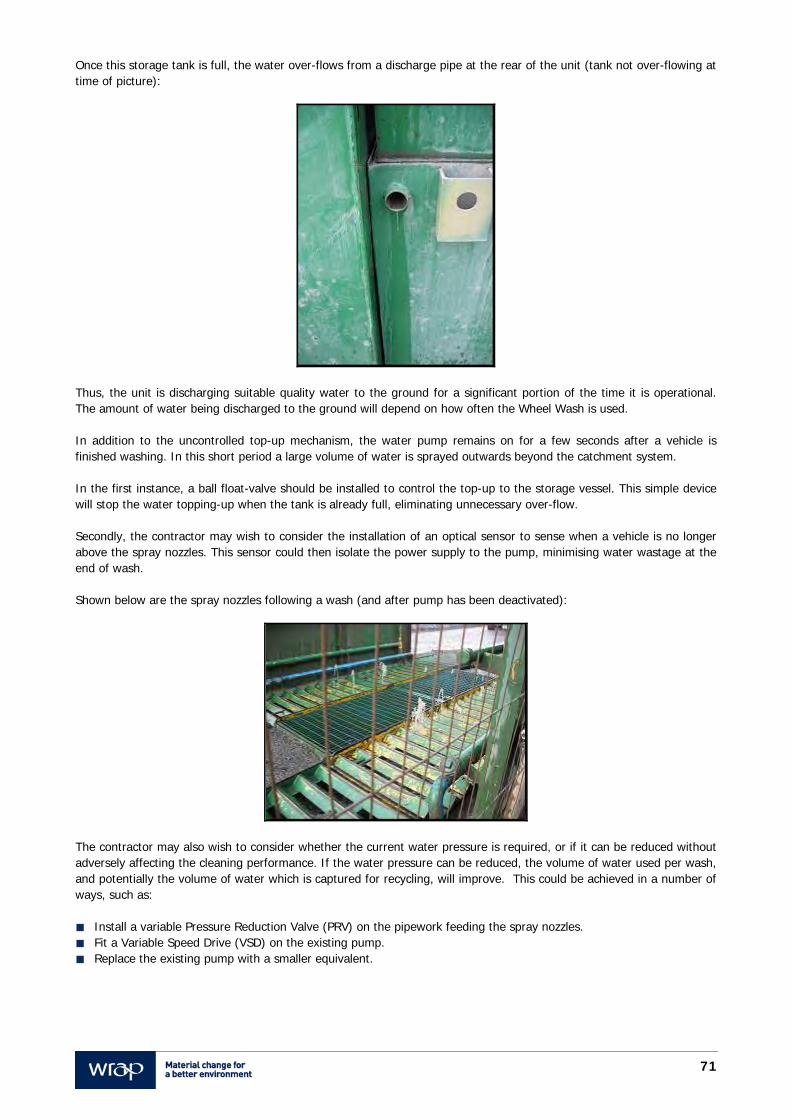
71
Once this storage tank is full, the water over-flows from a discharge pipe at the rear of the unit (tank not over-flowing at time of picture):
Thus, the unit is discharging suitable quality water to the ground for a significant portion of the time it is operational. The amount of water being discharged to the ground will depend on how often the Wheel Wash is used. In addition to the uncontrolled top-up mechanism, the water pump remains on for a few seconds after a vehicle is finished washing. In this short period a large volume of water is sprayed outwards beyond the catchment system. In the first instance, a ball float-valve should be installed to control the top-up to the storage vessel. This simple device will stop the water topping-up when the tank is already full, eliminating unnecessary over-flow. Secondly, the contractor may wish to consider the installation of an optical sensor to sense when a vehicle is no longer above the spray nozzles. This sensor could then isolate the power supply to the pump, minimising water wastage at the end of wash. Shown below are the spray nozzles following a wash (and after pump has been deactivated):
The contractor may also wish to consider whether the current water pressure is required, or if it can be reduced without adversely affecting the cleaning performance. If the water pressure can be reduced, the volume of water used per wash, and potentially the volume of water which is captured for recycling, will improve. This could be achieved in a number of ways, such as: Install a variable Pressure Reduction Valve (PRV) on the pipework feeding the spray nozzles. Fit a Variable Speed Drive (VSD) on the existing pump. Replace the existing pump with a smaller equivalent.
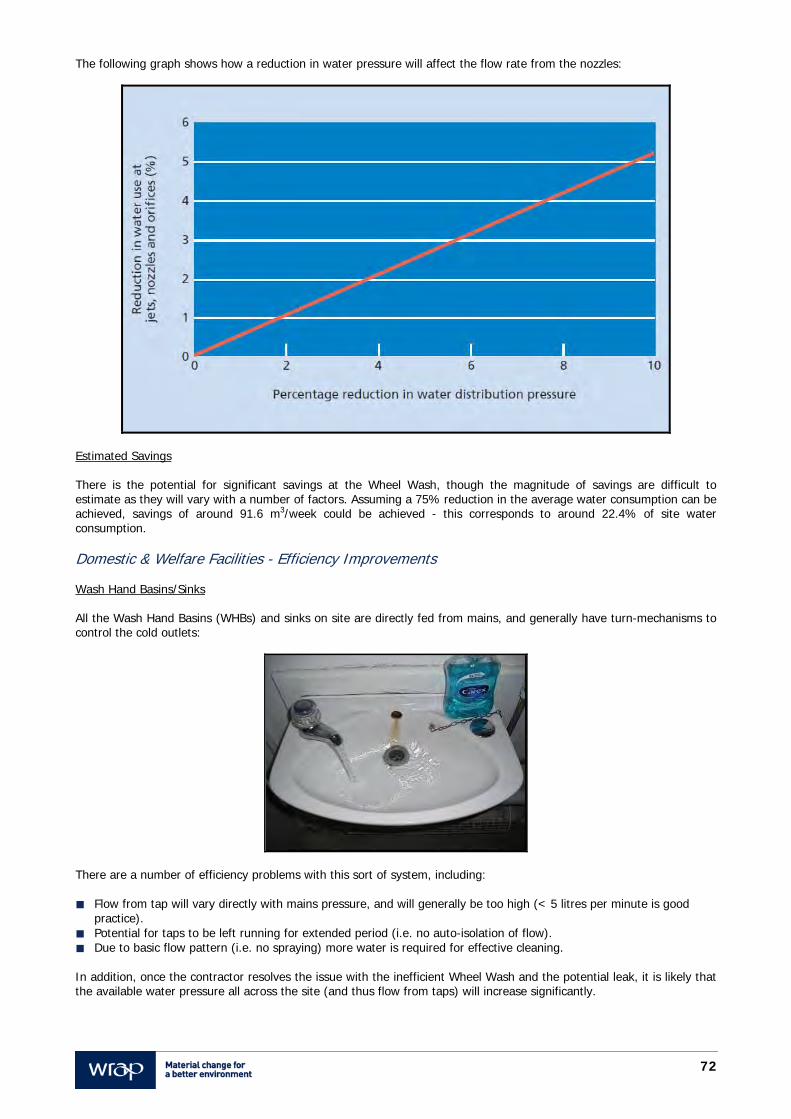
72
The following graph shows how a reduction in water pressure will affect the flow rate from the nozzles:
Estimated Savings There is the potential for significant savings at the Wheel Wash, though the magnitude of savings are difficult to estimate as they will vary with a number of factors. Assuming a 75% reduction in the average water consumption can be achieved, savings of around 91.6 m3/week could be achieved - this corresponds to around 22.4% of site water consumption. Domestic & Welfare Facilities - Efficiency Improvements Wash Hand Basins/Sinks All the Wash Hand Basins (WHBs) and sinks on site are directly fed from mains, and generally have turn-mechanisms to control the cold outlets:
There are a number of efficiency problems with this sort of system, including: Flow from tap will vary directly with mains pressure, and will generally be too high (< 5 litres per minute is good
practice). Potential for taps to be left running for extended period (i.e. no auto-isolation of flow). Due to basic flow pattern (i.e. no spraying) more water is required for effective cleaning.
In addition, once the contractor resolves the issue with the inefficient Wheel Wash and the potential leak, it is likely that the available water pressure all across the site (and thus flow from taps) will increase significantly.
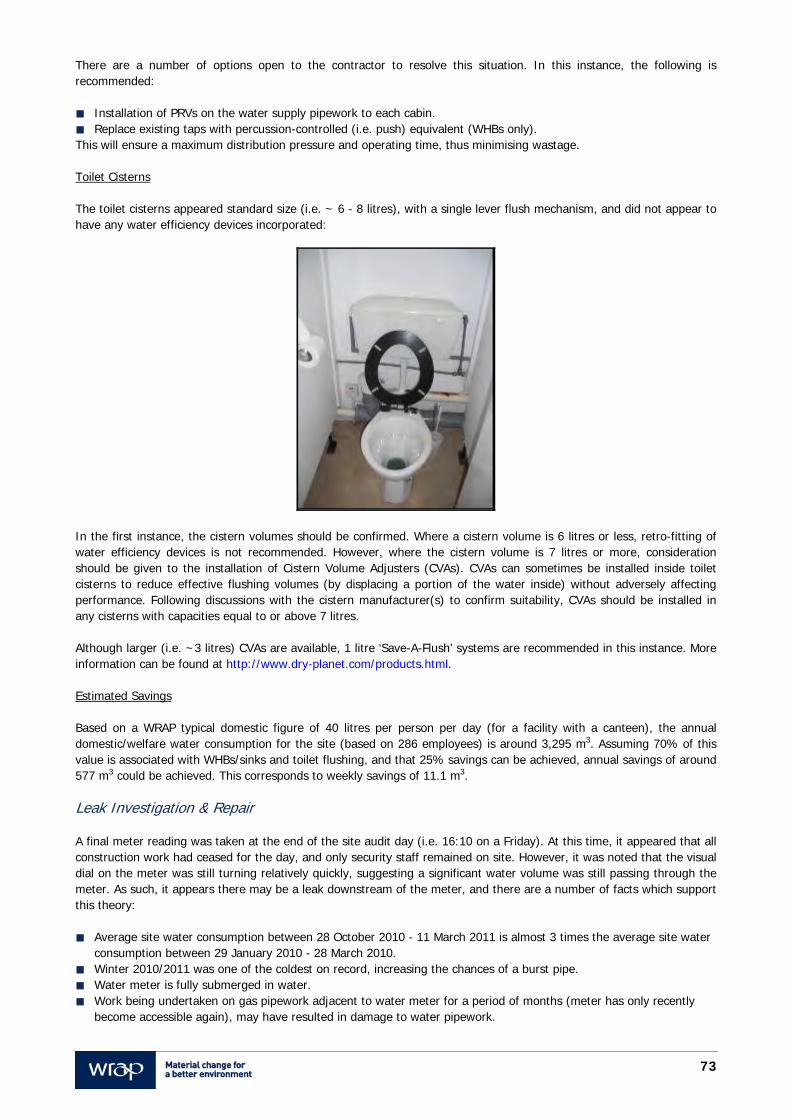
73
There are a number of options open to the contractor to resolve this situation. In this instance, the following is recommended: Installation of PRVs on the water supply pipework to each cabin. Replace existing taps with percussion-controlled (i.e. push) equivalent (WHBs only). This will ensure a maximum distribution pressure and operating time, thus minimising wastage. Toilet Cisterns The toilet cisterns appeared standard size (i.e. ~ 6 - 8 litres), with a single lever flush mechanism, and did not appear to have any water efficiency devices incorporated:
In the first instance, the cistern volumes should be confirmed. Where a cistern volume is 6 litres or less, retro-fitting of water efficiency devices is not recommended. However, where the cistern volume is 7 litres or more, consideration should be given to the installation of Cistern Volume Adjusters (CVAs). CVAs can sometimes be installed inside toilet cisterns to reduce effective flushing volumes (by displacing a portion of the water inside) without adversely affecting performance. Following discussions with the cistern manufacturer(s) to confirm suitability, CVAs should be installed in any cisterns with capacities equal to or above 7 litres. Although larger (i.e. ~3 litres) CVAs are available, 1 litre ‘Save-A-Flush’ systems are recommended in this instance. More information can be found at http://www.dry-planet.com/products.html. Estimated Savings Based on a WRAP typical domestic figure of 40 litres per person per day (for a facility with a canteen), the annual domestic/welfare water consumption for the site (based on 286 employees) is around 3,295 m3. Assuming 70% of this value is associated with WHBs/sinks and toilet flushing, and that 25% savings can be achieved, annual savings of around 577 m3 could be achieved. This corresponds to weekly savings of 11.1 m3. Leak Investigation & Repair A final meter reading was taken at the end of the site audit day (i.e. 16:10 on a Friday). At this time, it appeared that all construction work had ceased for the day, and only security staff remained on site. However, it was noted that the visual dial on the meter was still turning relatively quickly, suggesting a significant water volume was still passing through the meter. As such, it appears there may be a leak downstream of the meter, and there are a number of facts which support this theory: Average site water consumption between 28 October 2010 - 11 March 2011 is almost 3 times the average site water
consumption between 29 January 2010 - 28 March 2010. Winter 2010/2011 was one of the coldest on record, increasing the chances of a burst pipe. Water meter is fully submerged in water. Work being undertaken on gas pipework adjacent to water meter for a period of months (meter has only recently
become accessible again), may have resulted in damage to water pipework.
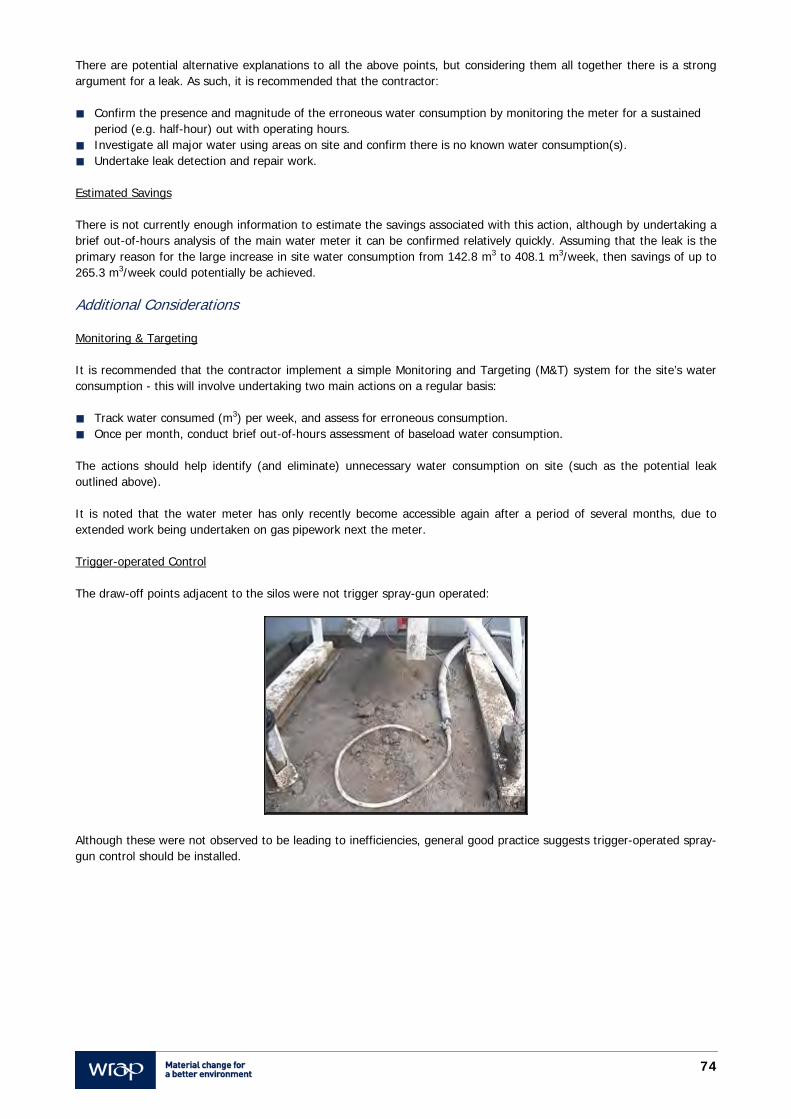
74
There are potential alternative explanations to all the above points, but considering them all together there is a strong argument for a leak. As such, it is recommended that the contractor: Confirm the presence and magnitude of the erroneous water consumption by monitoring the meter for a sustained
period (e.g. half-hour) out with operating hours. Investigate all major water using areas on site and confirm there is no known water consumption(s). Undertake leak detection and repair work. Estimated Savings There is not currently enough information to estimate the savings associated with this action, although by undertaking a brief out-of-hours analysis of the main water meter it can be confirmed relatively quickly. Assuming that the leak is the primary reason for the large increase in site water consumption from 142.8 m3 to 408.1 m3/week, then savings of up to 265.3 m3/week could potentially be achieved. Additional Considerations Monitoring & Targeting It is recommended that the contractor implement a simple Monitoring and Targeting (M&T) system for the site’s water consumption - this will involve undertaking two main actions on a regular basis: Track water consumed (m3) per week, and assess for erroneous consumption. Once per month, conduct brief out-of-hours assessment of baseload water consumption. The actions should help identify (and eliminate) unnecessary water consumption on site (such as the potential leak outlined above). It is noted that the water meter has only recently become accessible again after a period of several months, due to extended work being undertaken on gas pipework next the meter. Trigger-operated Control The draw-off points adjacent to the silos were not trigger spray-gun operated:
Although these were not observed to be leading to inefficiencies, general good practice suggests trigger-operated spray-gun control should be installed.
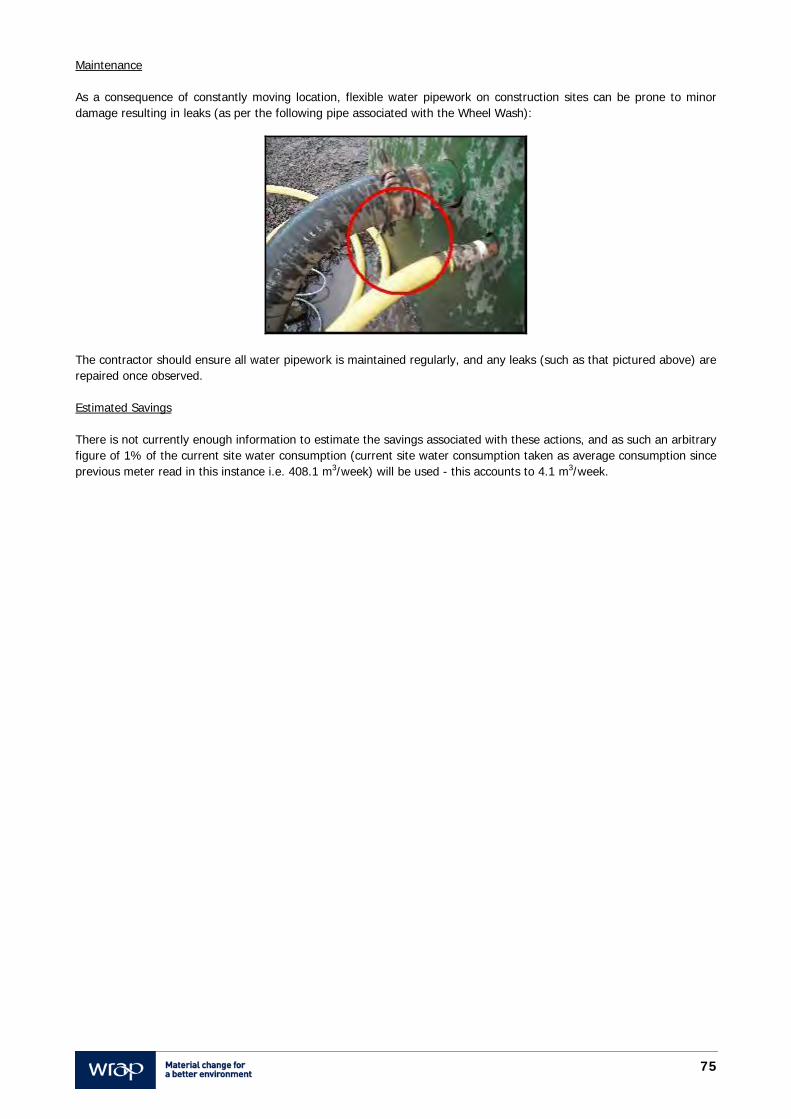
75
Maintenance As a consequence of constantly moving location, flexible water pipework on construction sites can be prone to minor damage resulting in leaks (as per the following pipe associated with the Wheel Wash):
The contractor should ensure all water pipework is maintained regularly, and any leaks (such as that pictured above) are repaired once observed. Estimated Savings There is not currently enough information to estimate the savings associated with these actions, and as such an arbitrary figure of 1% of the current site water consumption (current site water consumption taken as average consumption since previous meter read in this instance i.e. 408.1 m3/week) will be used - this accounts to 4.1 m3/week.
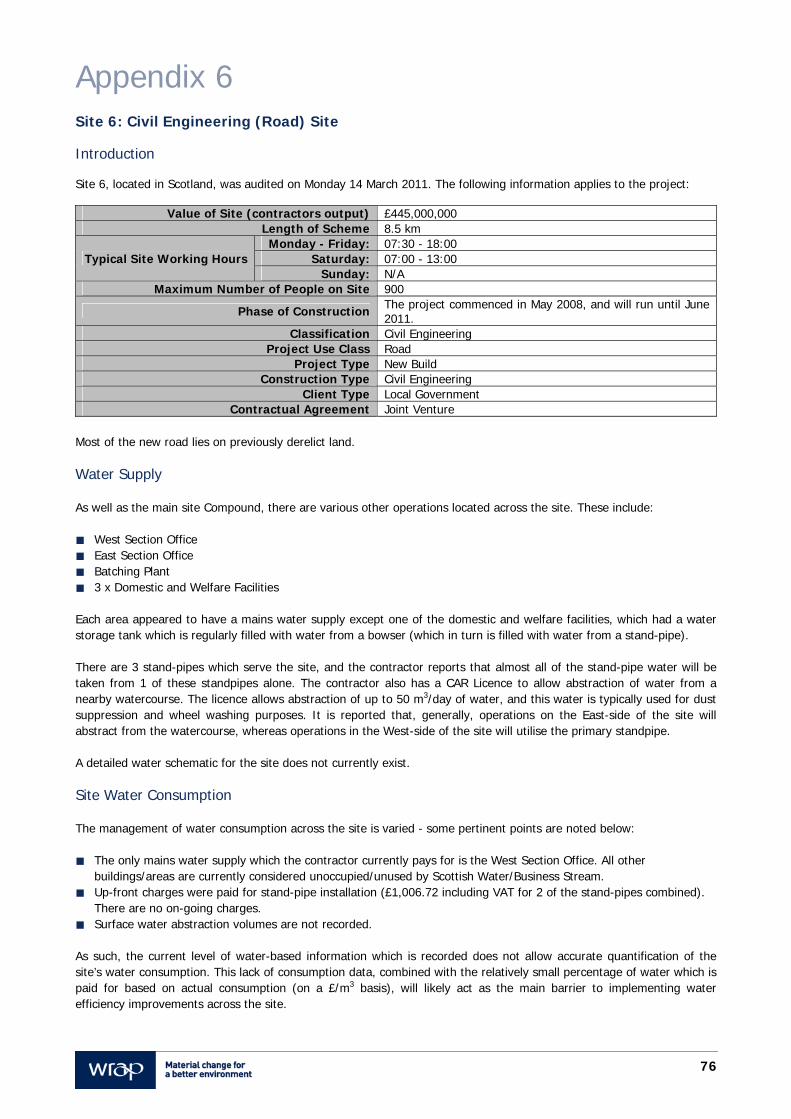
76
Appendix 6 Site 6: Civil Engineering (Road) Site Introduction Site 6, located in Scotland, was audited on Monday 14 March 2011. The following information applies to the project:
Value of Site (contractors output) £445,000,000 Length of Scheme 8.5 km
Typical Site Working Hours Monday - Friday: 07:30 - 18:00
Saturday: 07:00 - 13:00 Sunday: N/A
Maximum Number of People on Site 900
Phase of Construction The project commenced in May 2008, and will run until June 2011.
Classification Civil Engineering Project Use Class Road
Project Type New Build Construction Type Civil Engineering
Client Type Local Government Contractual Agreement Joint Venture
Most of the new road lies on previously derelict land. Water Supply As well as the main site Compound, there are various other operations located across the site. These include: West Section Office East Section Office Batching Plant 3 x Domestic and Welfare Facilities Each area appeared to have a mains water supply except one of the domestic and welfare facilities, which had a water storage tank which is regularly filled with water from a bowser (which in turn is filled with water from a stand-pipe). There are 3 stand-pipes which serve the site, and the contractor reports that almost all of the stand-pipe water will be taken from 1 of these standpipes alone. The contractor also has a CAR Licence to allow abstraction of water from a nearby watercourse. The licence allows abstraction of up to 50 m3/day of water, and this water is typically used for dust suppression and wheel washing purposes. It is reported that, generally, operations on the East-side of the site will abstract from the watercourse, whereas operations in the West-side of the site will utilise the primary standpipe. A detailed water schematic for the site does not currently exist. Site Water Consumption The management of water consumption across the site is varied - some pertinent points are noted below: The only mains water supply which the contractor currently pays for is the West Section Office. All other
buildings/areas are currently considered unoccupied/unused by Scottish Water/Business Stream. Up-front charges were paid for stand-pipe installation (£1,006.72 including VAT for 2 of the stand-pipes combined).
There are no on-going charges. Surface water abstraction volumes are not recorded. As such, the current level of water-based information which is recorded does not allow accurate quantification of the site’s water consumption. This lack of consumption data, combined with the relatively small percentage of water which is paid for based on actual consumption (on a £/m3 basis), will likely act as the main barrier to implementing water efficiency improvements across the site.
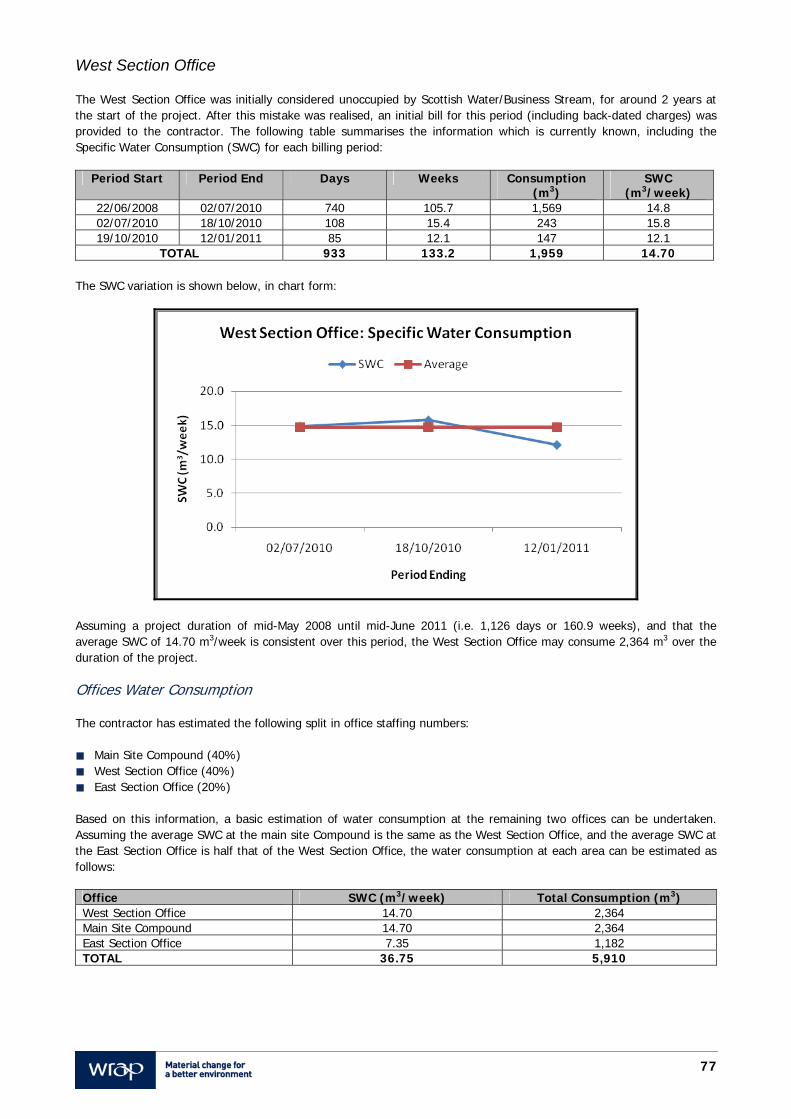
77
West Section Office
The West Section Office was initially considered unoccupied by Scottish Water/Business Stream, for around 2 years at the start of the project. After this mistake was realised, an initial bill for this period (including back-dated charges) was provided to the contractor. The following table summarises the information which is currently known, including the Specific Water Consumption (SWC) for each billing period:
Period Start Period End Days Weeks Consumption (m3)
SWC (m3/week)
22/06/2008 02/07/2010 740 105.7 1,569 14.8 02/07/2010 18/10/2010 108 15.4 243 15.8 19/10/2010 12/01/2011 85 12.1 147 12.1
TOTAL 933 133.2 1,959 14.70 The SWC variation is shown below, in chart form:
Assuming a project duration of mid-May 2008 until mid-June 2011 (i.e. 1,126 days or 160.9 weeks), and that the average SWC of 14.70 m3/week is consistent over this period, the West Section Office may consume 2,364 m3 over the duration of the project. Offices Water Consumption The contractor has estimated the following split in office staffing numbers: Main Site Compound (40%) West Section Office (40%) East Section Office (20%) Based on this information, a basic estimation of water consumption at the remaining two offices can be undertaken. Assuming the average SWC at the main site Compound is the same as the West Section Office, and the average SWC at the East Section Office is half that of the West Section Office, the water consumption at each area can be estimated as follows:
Office SWC (m3/week) Total Consumption (m3) West Section Office 14.70 2,364 Main Site Compound 14.70 2,364 East Section Office 7.35 1,182 TOTAL 36.75 5,910
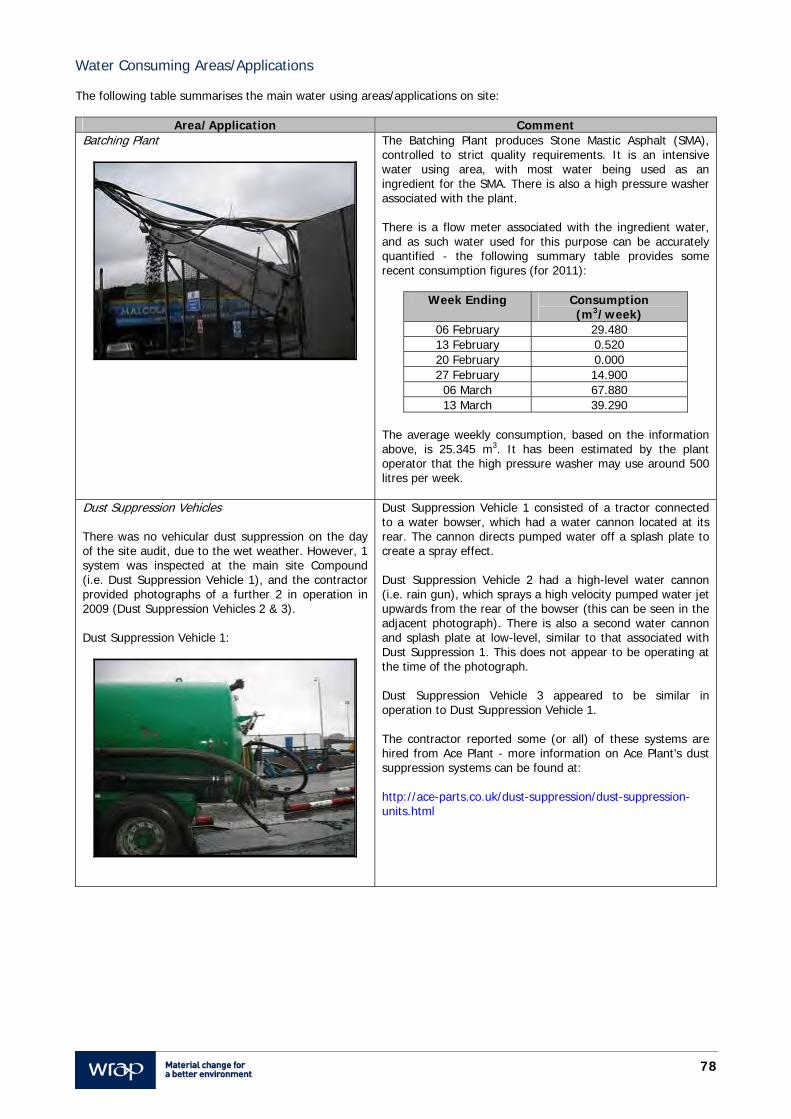
78
Water Consuming Areas/Applications The following table summarises the main water using areas/applications on site:
Area/Application Comment Batching Plant
The Batching Plant produces Stone Mastic Asphalt (SMA), controlled to strict quality requirements. It is an intensive water using area, with most water being used as an ingredient for the SMA. There is also a high pressure washer associated with the plant. There is a flow meter associated with the ingredient water, and as such water used for this purpose can be accurately quantified - the following summary table provides some recent consumption figures (for 2011):
Week Ending Consumption (m3/week)
06 February 29.480 13 February 0.520 20 February 0.000 27 February 14.900 06 March 67.880 13 March 39.290
The average weekly consumption, based on the information above, is 25.345 m3. It has been estimated by the plant operator that the high pressure washer may use around 500 litres per week.
Dust Suppression Vehicles There was no vehicular dust suppression on the day of the site audit, due to the wet weather. However, 1 system was inspected at the main site Compound (i.e. Dust Suppression Vehicle 1), and the contractor provided photographs of a further 2 in operation in 2009 (Dust Suppression Vehicles 2 & 3). Dust Suppression Vehicle 1:
Dust Suppression Vehicle 1 consisted of a tractor connected to a water bowser, which had a water cannon located at its rear. The cannon directs pumped water off a splash plate to create a spray effect. Dust Suppression Vehicle 2 had a high-level water cannon (i.e. rain gun), which sprays a high velocity pumped water jet upwards from the rear of the bowser (this can be seen in the adjacent photograph). There is also a second water cannon and splash plate at low-level, similar to that associated with Dust Suppression 1. This does not appear to be operating at the time of the photograph. Dust Suppression Vehicle 3 appeared to be similar in operation to Dust Suppression Vehicle 1. The contractor reported some (or all) of these systems are hired from Ace Plant - more information on Ace Plant’s dust suppression systems can be found at: http://ace-parts.co.uk/dust-suppression/dust-suppression-units.html
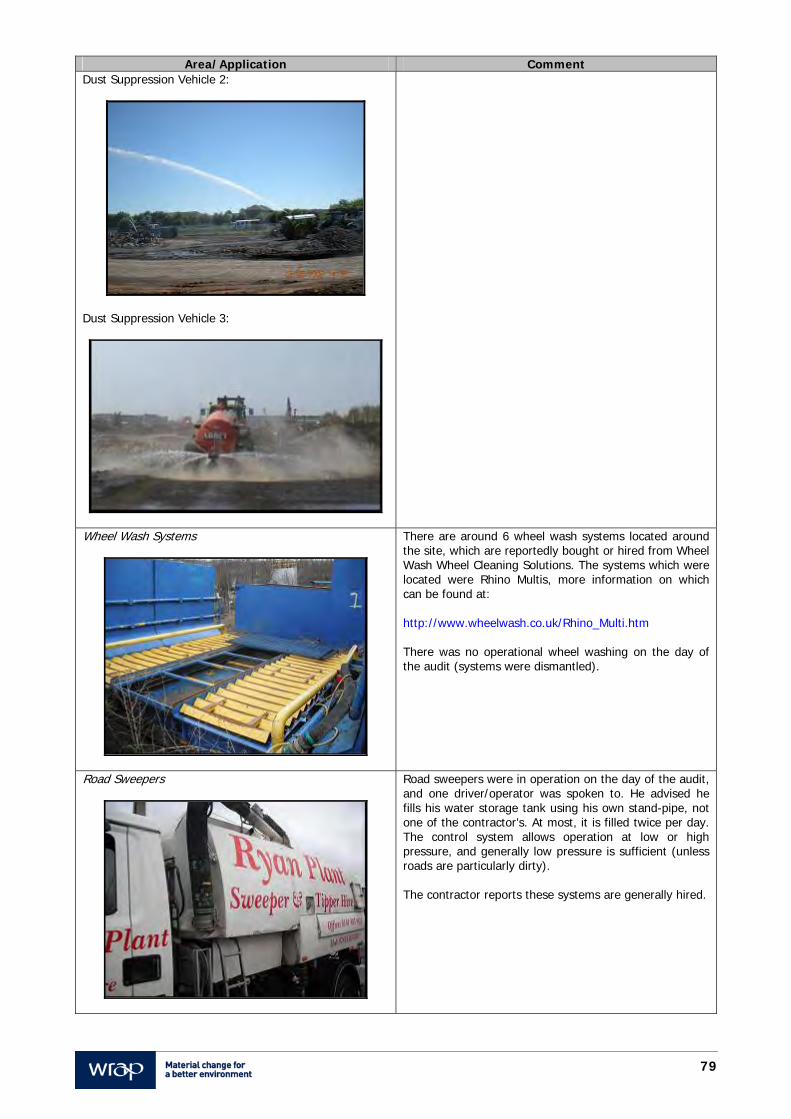
79
Area/Application Comment Dust Suppression Vehicle 2:
Dust Suppression Vehicle 3:
Wheel Wash Systems
There are around 6 wheel wash systems located around the site, which are reportedly bought or hired from Wheel Wash Wheel Cleaning Solutions. The systems which were located were Rhino Multis, more information on which can be found at: http://www.wheelwash.co.uk/Rhino_Multi.htm There was no operational wheel washing on the day of the audit (systems were dismantled).
Road Sweepers
Road sweepers were in operation on the day of the audit, and one driver/operator was spoken to. He advised he fills his water storage tank using his own stand-pipe, not one of the contractor’s. At most, it is filled twice per day. The control system allows operation at low or high pressure, and generally low pressure is sufficient (unless roads are particularly dirty). The contractor reports these systems are generally hired.
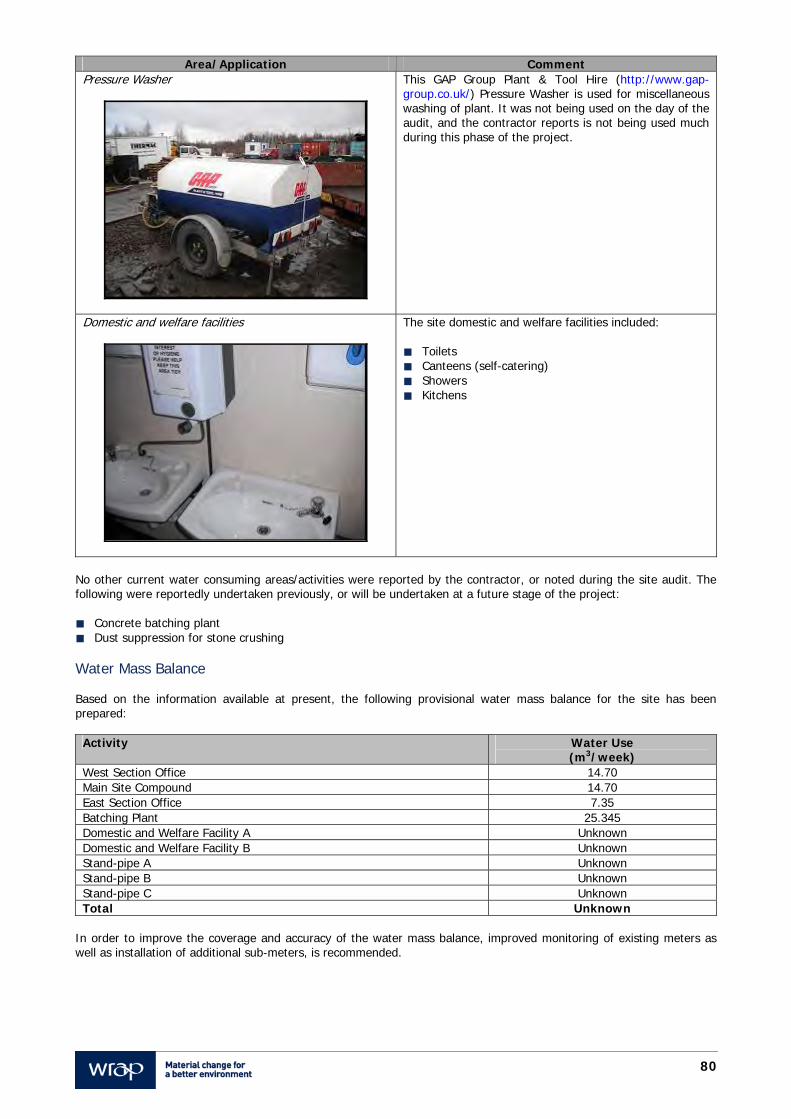
80
Area/Application Comment Pressure Washer
This GAP Group Plant & Tool Hire (http://www.gap-group.co.uk/) Pressure Washer is used for miscellaneous washing of plant. It was not being used on the day of the audit, and the contractor reports is not being used much during this phase of the project.
Domestic and welfare facilities
The site domestic and welfare facilities included: Toilets Canteens (self-catering) Showers Kitchens
No other current water consuming areas/activities were reported by the contractor, or noted during the site audit. The following were reportedly undertaken previously, or will be undertaken at a future stage of the project: Concrete batching plant Dust suppression for stone crushing
Water Mass Balance Based on the information available at present, the following provisional water mass balance for the site has been prepared:
Activity Water Use (m3/week)
West Section Office 14.70 Main Site Compound 14.70 East Section Office 7.35 Batching Plant 25.345 Domestic and Welfare Facility A Unknown Domestic and Welfare Facility B Unknown Stand-pipe A Unknown Stand-pipe B Unknown Stand-pipe C Unknown Total Unknown
In order to improve the coverage and accuracy of the water mass balance, improved monitoring of existing meters as well as installation of additional sub-meters, is recommended.
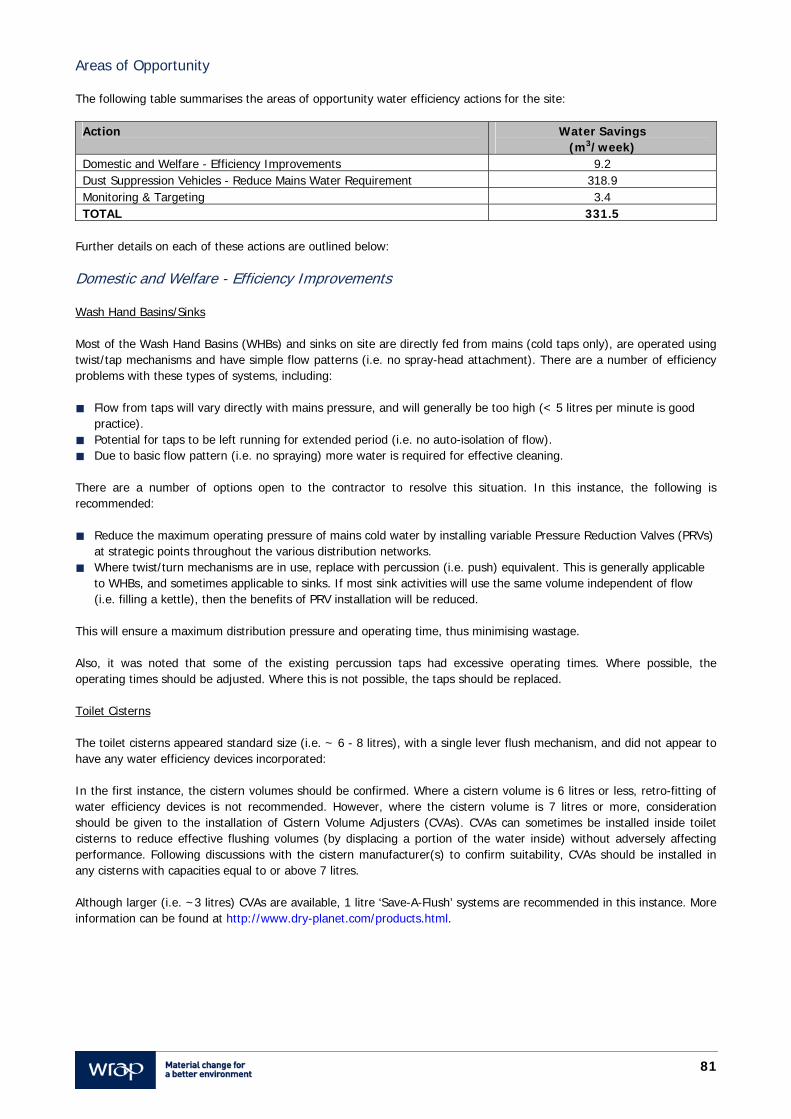
81
Areas of Opportunity The following table summarises the areas of opportunity water efficiency actions for the site:
Action Water Savings (m3/week)
Domestic and Welfare - Efficiency Improvements 9.2 Dust Suppression Vehicles - Reduce Mains Water Requirement 318.9 Monitoring & Targeting 3.4 TOTAL 331.5
Further details on each of these actions are outlined below: Domestic and Welfare - Efficiency Improvements Wash Hand Basins/Sinks Most of the Wash Hand Basins (WHBs) and sinks on site are directly fed from mains (cold taps only), are operated using twist/tap mechanisms and have simple flow patterns (i.e. no spray-head attachment). There are a number of efficiency problems with these types of systems, including: Flow from taps will vary directly with mains pressure, and will generally be too high (< 5 litres per minute is good
practice). Potential for taps to be left running for extended period (i.e. no auto-isolation of flow). Due to basic flow pattern (i.e. no spraying) more water is required for effective cleaning. There are a number of options open to the contractor to resolve this situation. In this instance, the following is recommended: Reduce the maximum operating pressure of mains cold water by installing variable Pressure Reduction Valves (PRVs)
at strategic points throughout the various distribution networks. Where twist/turn mechanisms are in use, replace with percussion (i.e. push) equivalent. This is generally applicable
to WHBs, and sometimes applicable to sinks. If most sink activities will use the same volume independent of flow (i.e. filling a kettle), then the benefits of PRV installation will be reduced.
This will ensure a maximum distribution pressure and operating time, thus minimising wastage. Also, it was noted that some of the existing percussion taps had excessive operating times. Where possible, the operating times should be adjusted. Where this is not possible, the taps should be replaced. Toilet Cisterns The toilet cisterns appeared standard size (i.e. ~ 6 - 8 litres), with a single lever flush mechanism, and did not appear to have any water efficiency devices incorporated:
In the first instance, the cistern volumes should be confirmed. Where a cistern volume is 6 litres or less, retro-fitting of water efficiency devices is not recommended. However, where the cistern volume is 7 litres or more, consideration should be given to the installation of Cistern Volume Adjusters (CVAs). CVAs can sometimes be installed inside toilet cisterns to reduce effective flushing volumes (by displacing a portion of the water inside) without adversely affecting performance. Following discussions with the cistern manufacturer(s) to confirm suitability, CVAs should be installed in any cisterns with capacities equal to or above 7 litres. Although larger (i.e. ~3 litres) CVAs are available, 1 litre ‘Save-A-Flush’ systems are recommended in this instance. More information can be found at http://www.dry-planet.com/products.html.
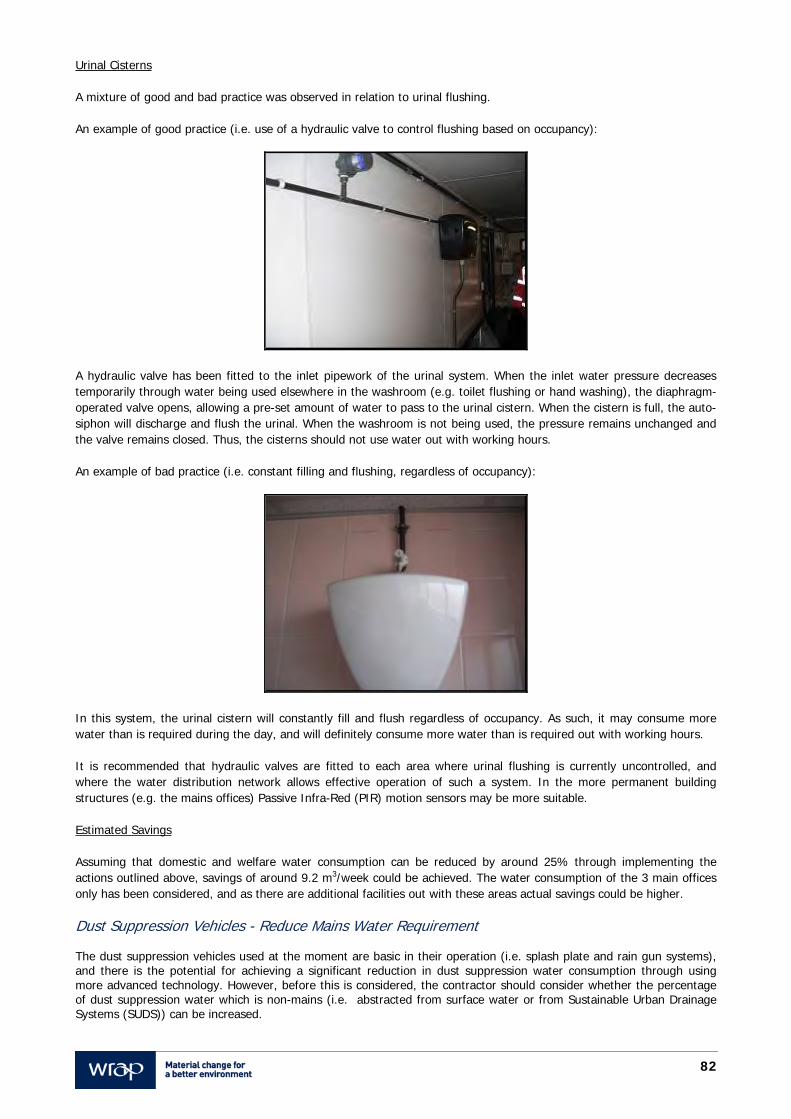
82
Urinal Cisterns A mixture of good and bad practice was observed in relation to urinal flushing. An example of good practice (i.e. use of a hydraulic valve to control flushing based on occupancy):
A hydraulic valve has been fitted to the inlet pipework of the urinal system. When the inlet water pressure decreases temporarily through water being used elsewhere in the washroom (e.g. toilet flushing or hand washing), the diaphragm-operated valve opens, allowing a pre-set amount of water to pass to the urinal cistern. When the cistern is full, the auto-siphon will discharge and flush the urinal. When the washroom is not being used, the pressure remains unchanged and the valve remains closed. Thus, the cisterns should not use water out with working hours. An example of bad practice (i.e. constant filling and flushing, regardless of occupancy):
In this system, the urinal cistern will constantly fill and flush regardless of occupancy. As such, it may consume more water than is required during the day, and will definitely consume more water than is required out with working hours. It is recommended that hydraulic valves are fitted to each area where urinal flushing is currently uncontrolled, and where the water distribution network allows effective operation of such a system. In the more permanent building structures (e.g. the mains offices) Passive Infra-Red (PIR) motion sensors may be more suitable. Estimated Savings Assuming that domestic and welfare water consumption can be reduced by around 25% through implementing the actions outlined above, savings of around 9.2 m3/week could be achieved. The water consumption of the 3 main offices only has been considered, and as there are additional facilities out with these areas actual savings could be higher. Dust Suppression Vehicles - Reduce Mains Water Requirement The dust suppression vehicles used at the moment are basic in their operation (i.e. splash plate and rain gun systems), and there is the potential for achieving a significant reduction in dust suppression water consumption through using more advanced technology. However, before this is considered, the contractor should consider whether the percentage of dust suppression water which is non-mains (i.e. abstracted from surface water or from Sustainable Urban Drainage Systems (SUDS)) can be increased.
83
At present, water for dust suppression comes from a mixture of stand-pipe and surface water abstraction. There is currently no use of SUDS water for this purpose. Due to the low quality requirement of dust suppression water, all non-mains water sources should be considered fully before using mains water. As such, the contractor should optimise use of surface water as much as is practical, as well as investigating whether any of the site’s SUDS are suitable for dust suppression water, before resorting to mains. Once this has been achieved, the contractor can then consider what technologies are available to reduce the mains water requirement for dust suppression. The following actions are recommended: Utilise hydraulic spinning systems as opposed to traditional splash plate system - these systems use a hydraulic
motor to create a fine mist. Due to this efficient mist pattern, the same (or greater) performance can be achieved with significantly less water.
Utilise fan misting systems as opposed to traditional rain gun systems - again, a fine mist is created and sprayed over the required area. Due to this efficient mist pattern, the same (or greater) performance can be achieved with significantly less water.
As well as reducing water consumption, these systems have the added bonus of reduced filling time (due to the reduced water consumption). The contractor could also consider the use of dust suppressant additives to complement these systems. These additives act to reduce the surface tension of water, which effectively increases the time taken for the water to dry out. Note - it is possible that surface or SUDS water could not be used in the misting systems detailed above, due to the reduced water quality. As such, once such systems were purchased/hired, they may only be usable with mains water. Estimated Savings There is currently very little information known regarding the current mains water requirement for dust suppression, and as such it is difficult to estimate savings. The following assumptions have been used in this instance: Current splash plate and rain gun systems have ~ 1,150 lpm capacity Hydraulic spinning systems have ~ 100 lpm capacity Fan misting systems have ~ 35 lpm capacity 4 hours per week of mains-water splash plate system operation converted to hydraulic spinning system (based on
operation at full capacity) 1 hour per week of mains-water rain gun system operation converted to fan misting system (based on operation at
full capacity)
Thus, weekly savings of around 318.9 m3 could be achieved. However, additional investigation is required to confirm the current magnitude of mains water used for dust suppression vehicles, in order to refine the estimation of potential savings. Monitoring & Targeting The contractor’s current management of water consumption across the site could be improved, and the implementation of a structured Monitoring & Targeting (M&T) system is recommended. In the first instance, it is key that the site’s water consumption is more accurately recorded. This will involve taking regular meter readings for areas where meters are installed, and by installing meters where they are not. The following 2 actions are recommended (as a minimum): Track water consumed (m3) per week, and assess for erroneous consumption. Once per month, conduct brief out-of-hours assessment of baseload water consumption.
These actions should help identify (and eliminate) unnecessary water consumption on site. Where possible, KPIs should be created for each area. For the offices, this would likely be ‘m3 consumed per office-based staff member’ or similar. For the batching plant, raw material input or product output could be used. Estimated Savings Estimating the savings from such an action is difficult, and varies from site to site. Based on a 5% reduction in site water consumption, savings of around 3.4 m3/week could be available. As not all areas have been quantified, actual savings could be higher.
84
Appendix 7 Site 7: Education (High School) Site Introduction Site 7, located in England, was audited on Wednesday 23 March 2011. The following information applies to the project:
Value of Site (contractors output) £23,000,000 Footprint Area of Site (m2) 19,295
Typical Site Working Hours Monday - Friday: 08:00 - 18:00
Saturday: 08:00 - 13:00 (only sometimes) Sunday: N/A
Maximum Number of People on Site ~120 Phase of Construction Piling is currently the primary site activity.
Classification Education Project Use Class High School
Project Type Demolition and New build Construction Type Not recorded
Client Type PFI Contractual Agreement Joint Venture
The contractor commenced the project at the end of May 2010. It is intended that the main build (which incorporates demolition of existing buildings, and construction of replacement buildings) will be complete by November 2012. Following this, the remaining works (which will include external hard landscaping and sports pitches) will take place until October 2013. The school is still open to students, and the contractor’s work is currently restricted to an area of 7,575 m2 within the site’s 19,295 m2 envelope. There were 8 employees from the contractor’s company, 10 ground-workers and 6 pilers on site on the day of the audit (i.e. 24 in total). The maximum shown above (i.e. 120) will be reached at a later stage of the project, where site activity may increase. Water Supply The contractor is utilising the school’s existing mains water supply, and have taken branches from this distribution network at 2 points. Each of these distribution networks has been fitted with a sub-meter (SP1 Meter and SP2 Meter), and the contractor is billed by the school for the water they use on a volumetric basis. Although it is eventually intended that SP1 will provide all domestic/welfare water, and SP2 will provide all site water, most of the site water currently comes via SP1. The only water which has been used via the SP2 meter (45 m3 at the time of the audit) was for dust suppression during the demolition a particular Building. A basic site Water Plan is available, which shows: Location of site offices, and domestic/welfare facilities (and corresponding water usage points) Two connections to the school’s mains water supply Sub-meter locations Two external water usage points for site water
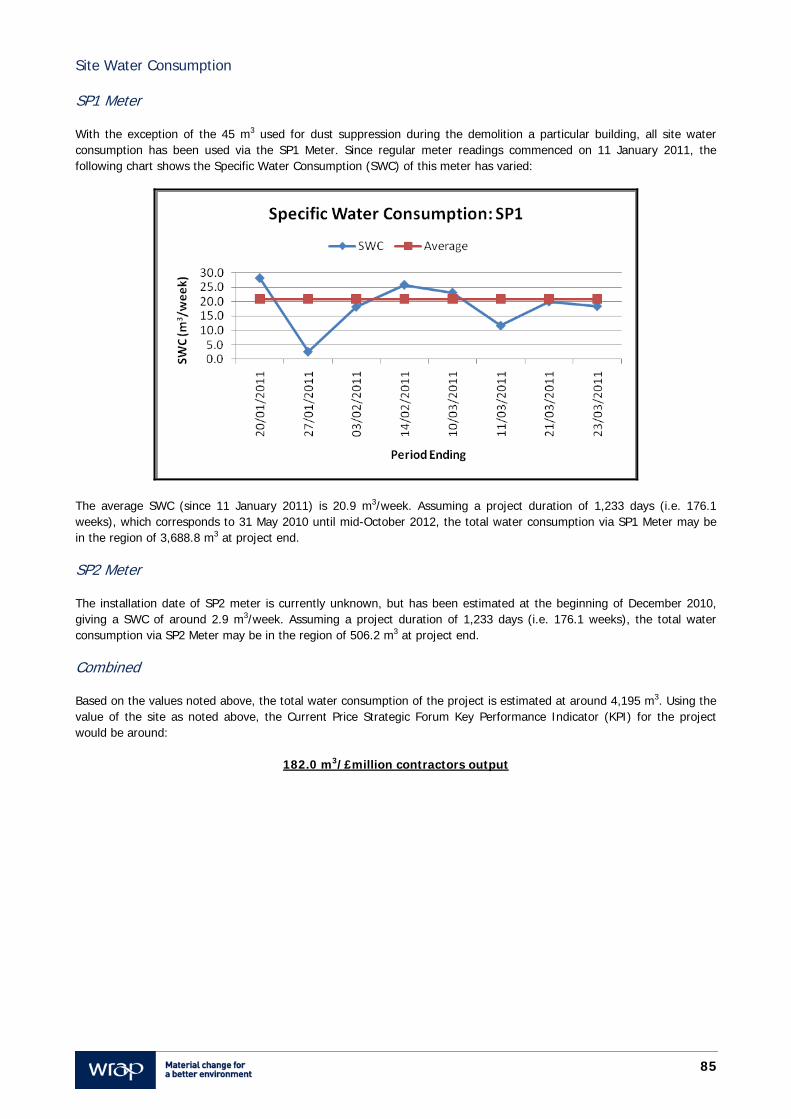
85
Site Water Consumption SP1 Meter With the exception of the 45 m3 used for dust suppression during the demolition a particular building, all site water consumption has been used via the SP1 Meter. Since regular meter readings commenced on 11 January 2011, the following chart shows the Specific Water Consumption (SWC) of this meter has varied:
The average SWC (since 11 January 2011) is 20.9 m3/week. Assuming a project duration of 1,233 days (i.e. 176.1 weeks), which corresponds to 31 May 2010 until mid-October 2012, the total water consumption via SP1 Meter may be in the region of 3,688.8 m3 at project end. SP2 Meter The installation date of SP2 meter is currently unknown, but has been estimated at the beginning of December 2010, giving a SWC of around 2.9 m3/week. Assuming a project duration of 1,233 days (i.e. 176.1 weeks), the total water consumption via SP2 Meter may be in the region of 506.2 m3 at project end. Combined Based on the values noted above, the total water consumption of the project is estimated at around 4,195 m3. Using the value of the site as noted above, the Current Price Strategic Forum Key Performance Indicator (KPI) for the project would be around:
182.0 m3/£million contractors output
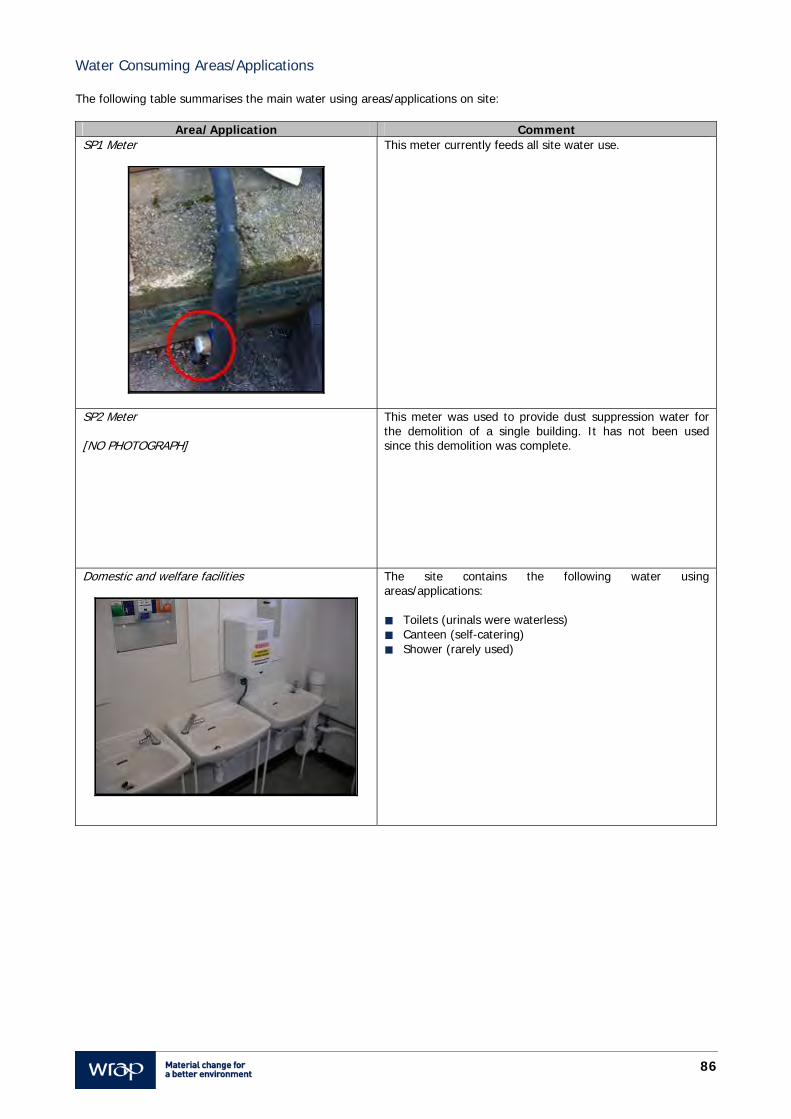
86
Water Consuming Areas/Applications The following table summarises the main water using areas/applications on site:
Area/Application Comment SP1 Meter
This meter currently feeds all site water use.
SP2 Meter [NO PHOTOGRAPH]
This meter was used to provide dust suppression water for the demolition of a single building. It has not been used since this demolition was complete.
Domestic and welfare facilities
The site contains the following water using areas/applications: Toilets (urinals were waterless) Canteen (self-catering) Shower (rarely used)
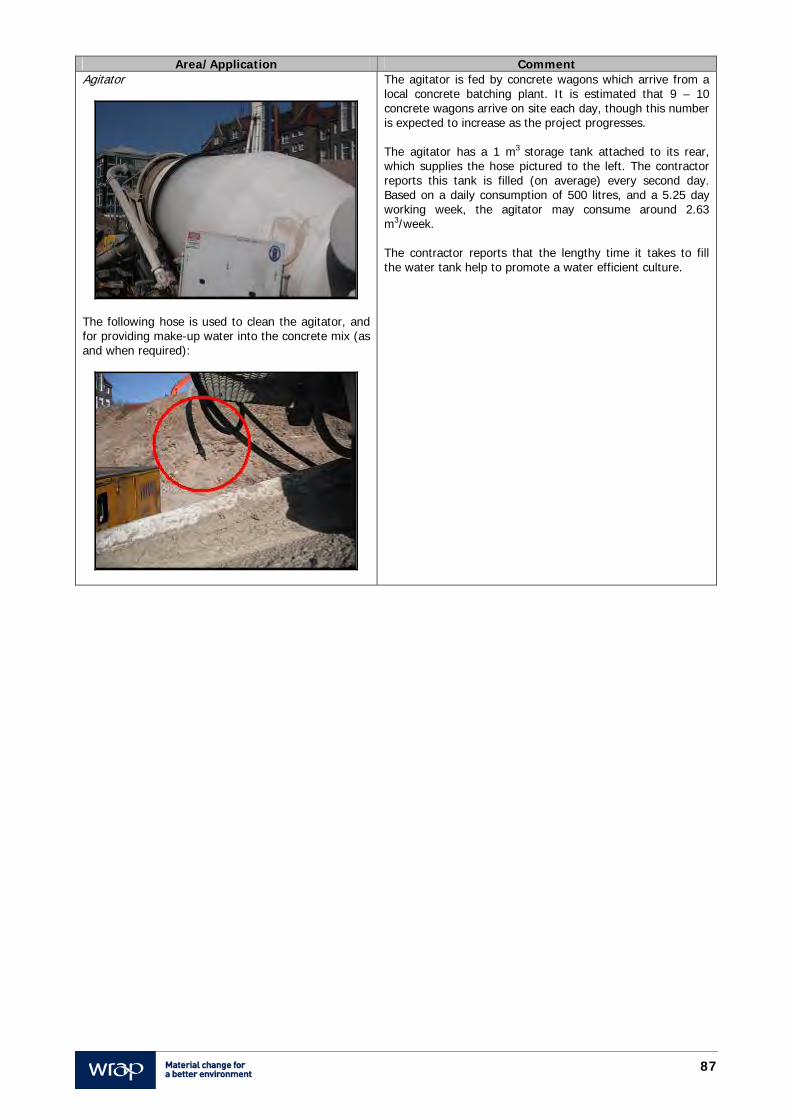
87
Area/Application Comment Agitator
The following hose is used to clean the agitator, and for providing make-up water into the concrete mix (as and when required):
The agitator is fed by concrete wagons which arrive from a local concrete batching plant. It is estimated that 9 – 10 concrete wagons arrive on site each day, though this number is expected to increase as the project progresses. The agitator has a 1 m3 storage tank attached to its rear, which supplies the hose pictured to the left. The contractor reports this tank is filled (on average) every second day. Based on a daily consumption of 500 litres, and a 5.25 day working week, the agitator may consume around 2.63 m3/week. The contractor reports that the lengthy time it takes to fill the water tank help to promote a water efficient culture.
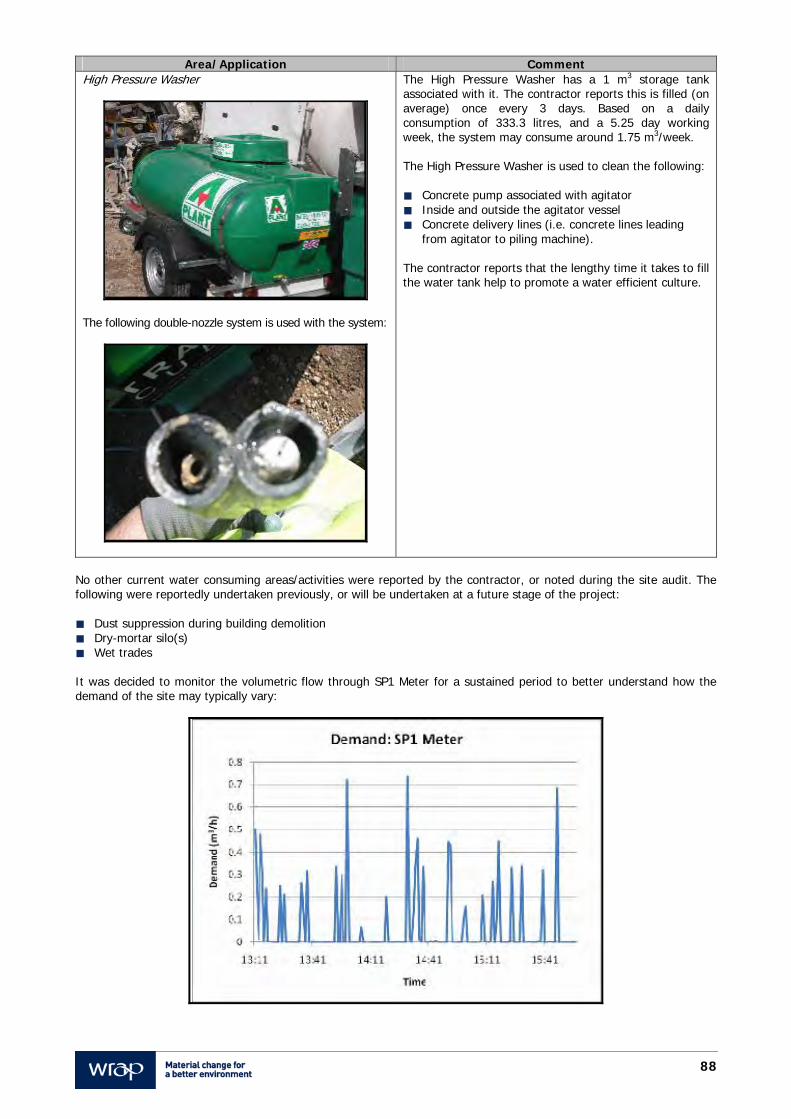
88
Area/Application Comment High Pressure Washer
The following double-nozzle system is used with the system:
The High Pressure Washer has a 1 m3 storage tank associated with it. The contractor reports this is filled (on average) once every 3 days. Based on a daily consumption of 333.3 litres, and a 5.25 day working week, the system may consume around 1.75 m3/week. The High Pressure Washer is used to clean the following: Concrete pump associated with agitator Inside and outside the agitator vessel Concrete delivery lines (i.e. concrete lines leading
from agitator to piling machine). The contractor reports that the lengthy time it takes to fill the water tank help to promote a water efficient culture.
No other current water consuming areas/activities were reported by the contractor, or noted during the site audit. The following were reportedly undertaken previously, or will be undertaken at a future stage of the project: Dust suppression during building demolition Dry-mortar silo(s) Wet trades It was decided to monitor the volumetric flow through SP1 Meter for a sustained period to better understand how the demand of the site may typically vary:
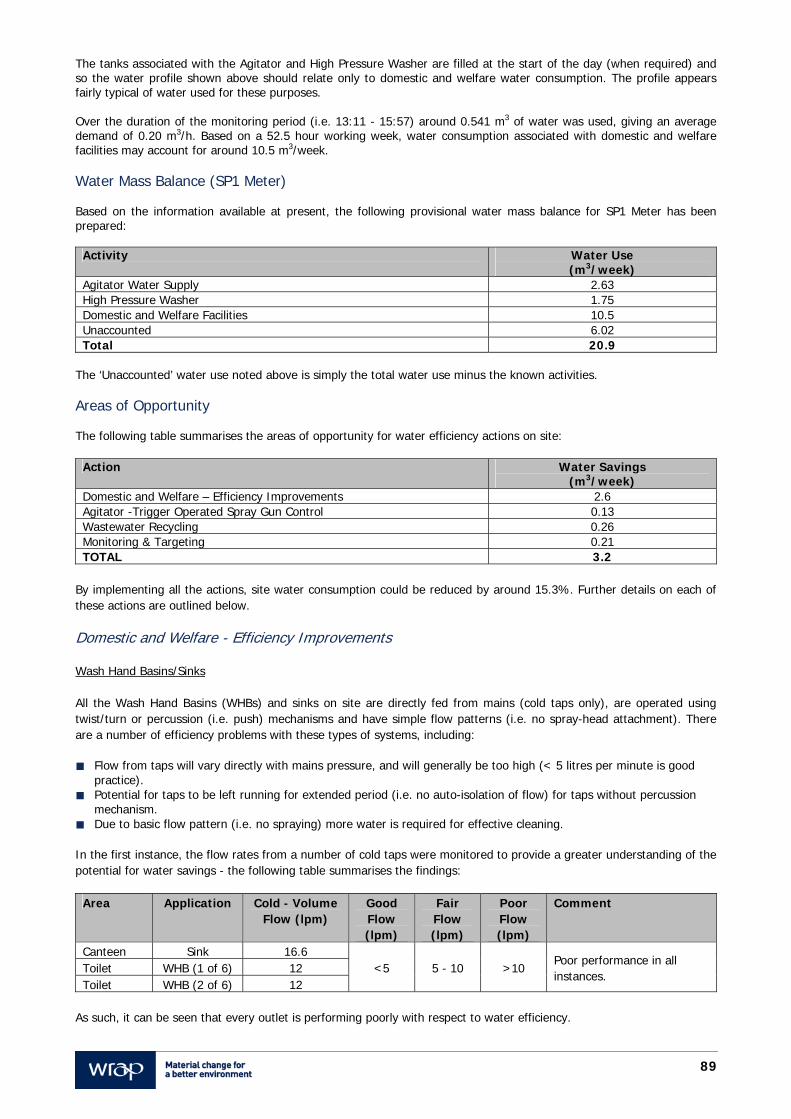
89
The tanks associated with the Agitator and High Pressure Washer are filled at the start of the day (when required) and so the water profile shown above should relate only to domestic and welfare water consumption. The profile appears fairly typical of water used for these purposes. Over the duration of the monitoring period (i.e. 13:11 - 15:57) around 0.541 m3 of water was used, giving an average demand of 0.20 m3/h. Based on a 52.5 hour working week, water consumption associated with domestic and welfare facilities may account for around 10.5 m3/week. Water Mass Balance (SP1 Meter) Based on the information available at present, the following provisional water mass balance for SP1 Meter has been prepared:
Activity Water Use (m3/week)
Agitator Water Supply 2.63 High Pressure Washer 1.75 Domestic and Welfare Facilities 10.5 Unaccounted 6.02 Total 20.9
The ‘Unaccounted’ water use noted above is simply the total water use minus the known activities. Areas of Opportunity The following table summarises the areas of opportunity for water efficiency actions on site:
Action Water Savings (m3/week)
Domestic and Welfare – Efficiency Improvements 2.6 Agitator -Trigger Operated Spray Gun Control 0.13 Wastewater Recycling 0.26 Monitoring & Targeting 0.21 TOTAL 3.2
By implementing all the actions, site water consumption could be reduced by around 15.3%. Further details on each of these actions are outlined below. Domestic and Welfare - Efficiency Improvements Wash Hand Basins/Sinks All the Wash Hand Basins (WHBs) and sinks on site are directly fed from mains (cold taps only), are operated using twist/turn or percussion (i.e. push) mechanisms and have simple flow patterns (i.e. no spray-head attachment). There are a number of efficiency problems with these types of systems, including: Flow from taps will vary directly with mains pressure, and will generally be too high (< 5 litres per minute is good
practice). Potential for taps to be left running for extended period (i.e. no auto-isolation of flow) for taps without percussion
mechanism. Due to basic flow pattern (i.e. no spraying) more water is required for effective cleaning.
In the first instance, the flow rates from a number of cold taps were monitored to provide a greater understanding of the potential for water savings - the following table summarises the findings:
Area Application Cold - Volume Flow (lpm)
Good Flow (lpm)
Fair Flow (lpm)
Poor Flow (lpm)
Comment
Canteen Sink 16.6 <5 5 - 10 >10
Poor performance in all instances.
Toilet WHB (1 of 6) 12 Toilet WHB (2 of 6) 12
As such, it can be seen that every outlet is performing poorly with respect to water efficiency.
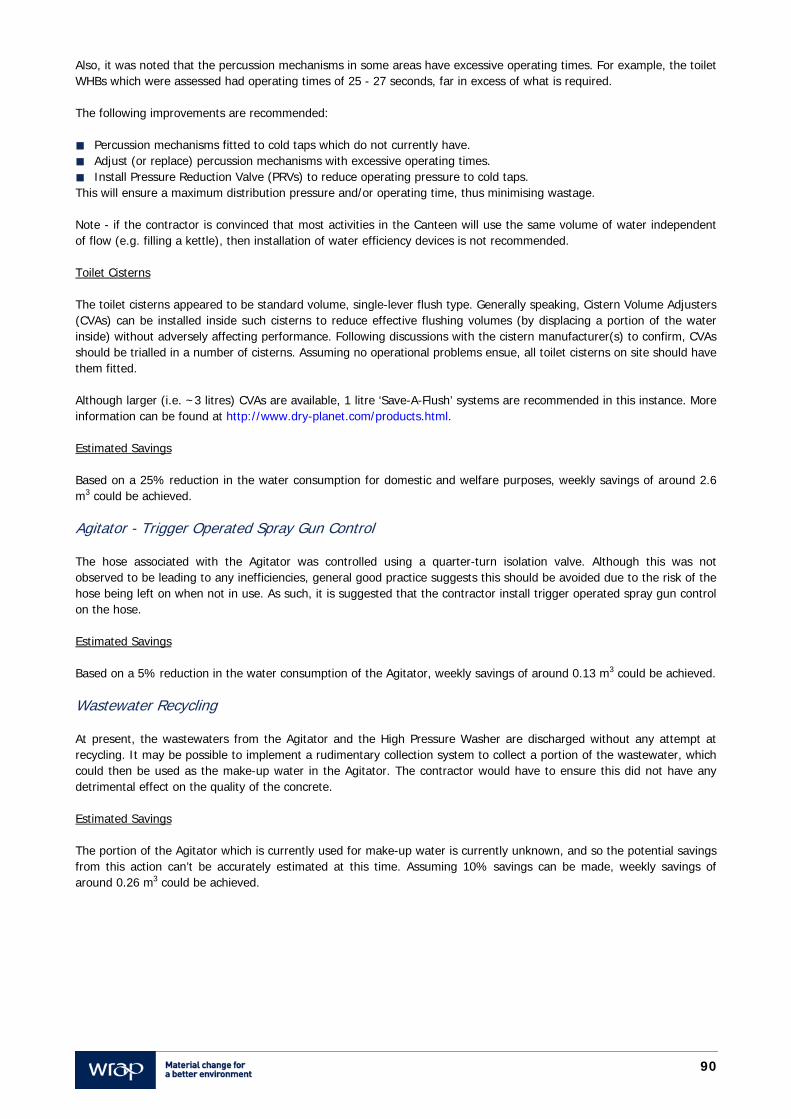
90
Also, it was noted that the percussion mechanisms in some areas have excessive operating times. For example, the toilet WHBs which were assessed had operating times of 25 - 27 seconds, far in excess of what is required. The following improvements are recommended: Percussion mechanisms fitted to cold taps which do not currently have. Adjust (or replace) percussion mechanisms with excessive operating times. Install Pressure Reduction Valve (PRVs) to reduce operating pressure to cold taps. This will ensure a maximum distribution pressure and/or operating time, thus minimising wastage. Note - if the contractor is convinced that most activities in the Canteen will use the same volume of water independent of flow (e.g. filling a kettle), then installation of water efficiency devices is not recommended. Toilet Cisterns The toilet cisterns appeared to be standard volume, single-lever flush type. Generally speaking, Cistern Volume Adjusters (CVAs) can be installed inside such cisterns to reduce effective flushing volumes (by displacing a portion of the water inside) without adversely affecting performance. Following discussions with the cistern manufacturer(s) to confirm, CVAs should be trialled in a number of cisterns. Assuming no operational problems ensue, all toilet cisterns on site should have them fitted. Although larger (i.e. ~3 litres) CVAs are available, 1 litre ‘Save-A-Flush’ systems are recommended in this instance. More information can be found at http://www.dry-planet.com/products.html. Estimated Savings Based on a 25% reduction in the water consumption for domestic and welfare purposes, weekly savings of around 2.6 m3 could be achieved. Agitator - Trigger Operated Spray Gun Control The hose associated with the Agitator was controlled using a quarter-turn isolation valve. Although this was not observed to be leading to any inefficiencies, general good practice suggests this should be avoided due to the risk of the hose being left on when not in use. As such, it is suggested that the contractor install trigger operated spray gun control on the hose. Estimated Savings Based on a 5% reduction in the water consumption of the Agitator, weekly savings of around 0.13 m3 could be achieved. Wastewater Recycling At present, the wastewaters from the Agitator and the High Pressure Washer are discharged without any attempt at recycling. It may be possible to implement a rudimentary collection system to collect a portion of the wastewater, which could then be used as the make-up water in the Agitator. The contractor would have to ensure this did not have any detrimental effect on the quality of the concrete. Estimated Savings The portion of the Agitator which is currently used for make-up water is currently unknown, and so the potential savings from this action can’t be accurately estimated at this time. Assuming 10% savings can be made, weekly savings of around 0.26 m3 could be achieved.
91
Monitoring & Targeting Once the proposed changes to the water distribution system have been implemented (i.e. one meter feeds domestic and welfare facilities only), then it is recommended that the contractor improve their current monitoring system to improve awareness of site water consumption. Actions to consider are: There is currently some variation in the timescales between meter reads - ensure regular weekly reads are taken,
and with this consistency the numbers obtained will begin to take on more meaning (e.g. high or low figures are more likely to be noted).
Consider creation of KPIs, to relate water consumption to a particular measure of site activity (e.g. average staff numbers over the monitoring period). This will improve the contractor’s chances of noting (and eliminating) erroneous water consumption.
On a regular basis (e.g. monthly), conduct a brief out-of-hours baseload assessment to ensure site water consumption drops to zero when there is not activity.
Estimated Savings Estimating the savings from such an action is difficult, and varies from site to site. Based on a 1% reduction in site water consumption, savings of around 0.21 m3/week could be available.
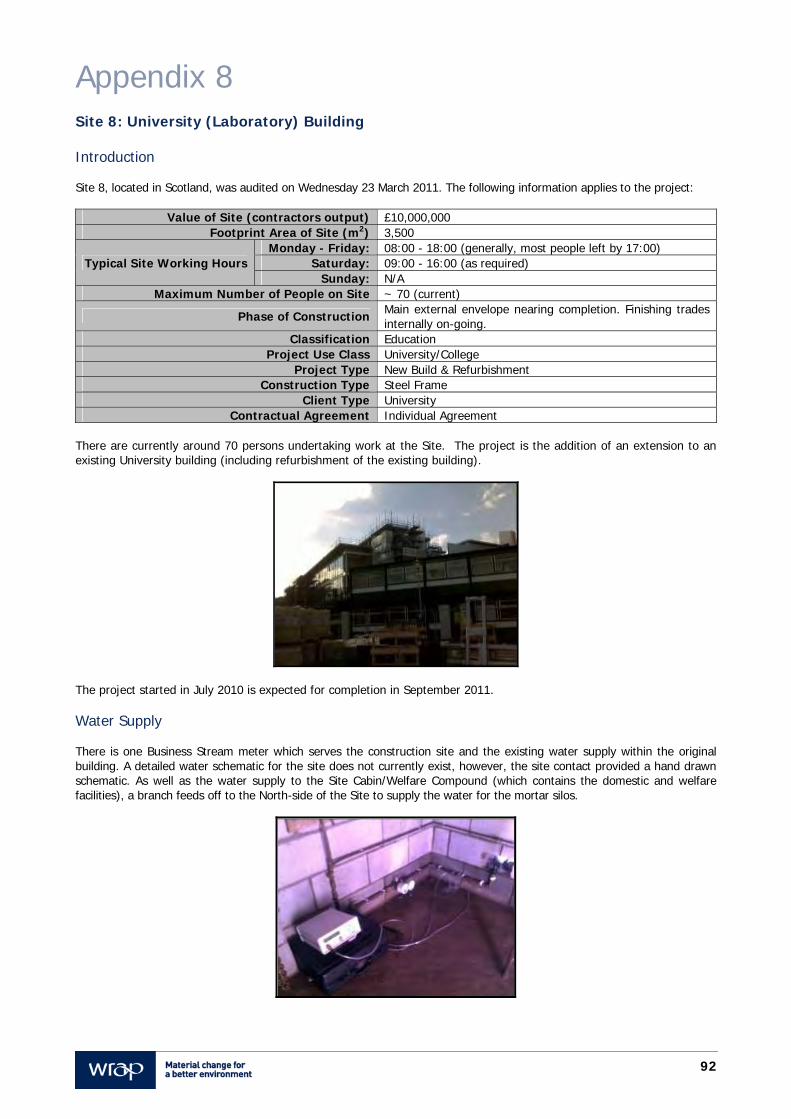
92
Appendix 8 Site 8: University (Laboratory) Building Introduction Site 8, located in Scotland, was audited on Wednesday 23 March 2011. The following information applies to the project:
Value of Site (contractors output) £10,000,000 Footprint Area of Site (m2) 3,500
Typical Site Working Hours Monday - Friday: 08:00 - 18:00 (generally, most people left by 17:00)
Saturday: 09:00 - 16:00 (as required) Sunday: N/A
Maximum Number of People on Site ~ 70 (current)
Phase of Construction Main external envelope nearing completion. Finishing trades internally on-going.
Classification Education Project Use Class University/College
Project Type New Build & Refurbishment Construction Type Steel Frame
Client Type University Contractual Agreement Individual Agreement
There are currently around 70 persons undertaking work at the Site. The project is the addition of an extension to an existing University building (including refurbishment of the existing building).
The project started in July 2010 is expected for completion in September 2011. Water Supply There is one Business Stream meter which serves the construction site and the existing water supply within the original building. A detailed water schematic for the site does not currently exist, however, the site contact provided a hand drawn schematic. As well as the water supply to the Site Cabin/Welfare Compound (which contains the domestic and welfare facilities), a branch feeds off to the North-side of the Site to supply the water for the mortar silos.
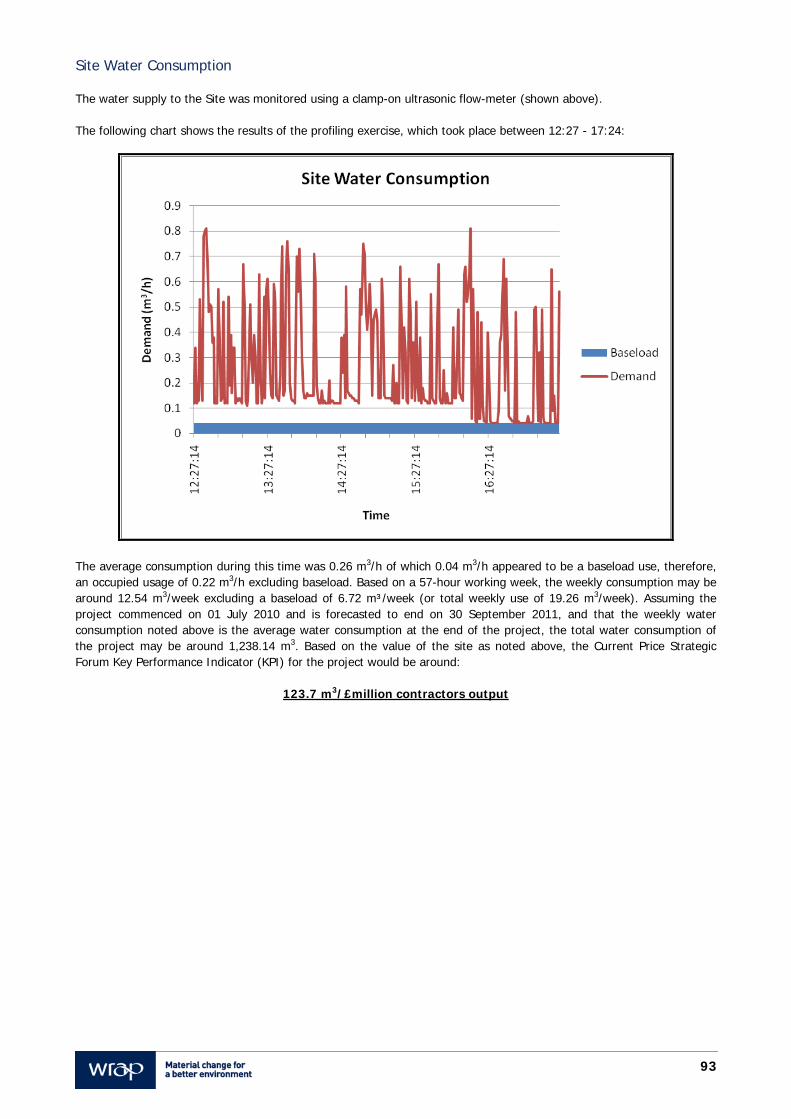
93
Site Water Consumption The water supply to the Site was monitored using a clamp-on ultrasonic flow-meter (shown above). The following chart shows the results of the profiling exercise, which took place between 12:27 - 17:24:
The average consumption during this time was 0.26 m3/h of which 0.04 m3/h appeared to be a baseload use, therefore, an occupied usage of 0.22 m3/h excluding baseload. Based on a 57-hour working week, the weekly consumption may be around 12.54 m3/week excluding a baseload of 6.72 m³/week (or total weekly use of 19.26 m3/week). Assuming the project commenced on 01 July 2010 and is forecasted to end on 30 September 2011, and that the weekly water consumption noted above is the average water consumption at the end of the project, the total water consumption of the project may be around 1,238.14 m3. Based on the value of the site as noted above, the Current Price Strategic Forum Key Performance Indicator (KPI) for the project would be around:
123.7 m3/£million contractors output
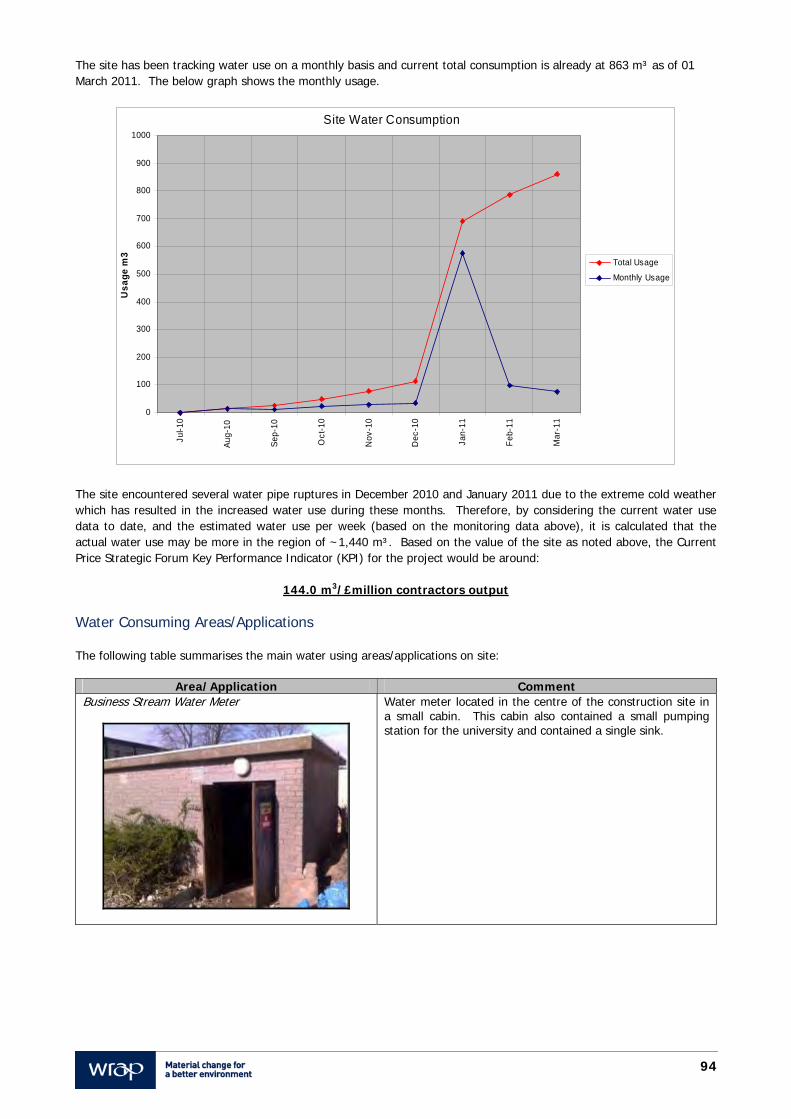
94
The site has been tracking water use on a monthly basis and current total consumption is already at 863 m³ as of 01 March 2011. The below graph shows the monthly usage.
Site Water Consumption
0
100
200
300
400
500
600
700
800
900
1000
Jul-1
0
Aug
-10
Sep
-10
Oct
-10
Nov
-10
Dec
-10
Jan-
11
Feb
-11
Mar
-11
Us
ag
e m
3
Total Usage
Monthly Usage
The site encountered several water pipe ruptures in December 2010 and January 2011 due to the extreme cold weather which has resulted in the increased water use during these months. Therefore, by considering the current water use data to date, and the estimated water use per week (based on the monitoring data above), it is calculated that the actual water use may be more in the region of ~1,440 m³. Based on the value of the site as noted above, the Current Price Strategic Forum Key Performance Indicator (KPI) for the project would be around:
144.0 m3/£million contractors output Water Consuming Areas/Applications The following table summarises the main water using areas/applications on site:
Area/Application Comment Business Stream Water Meter
Water meter located in the centre of the construction site in a small cabin. This cabin also contained a small pumping station for the university and contained a single sink.
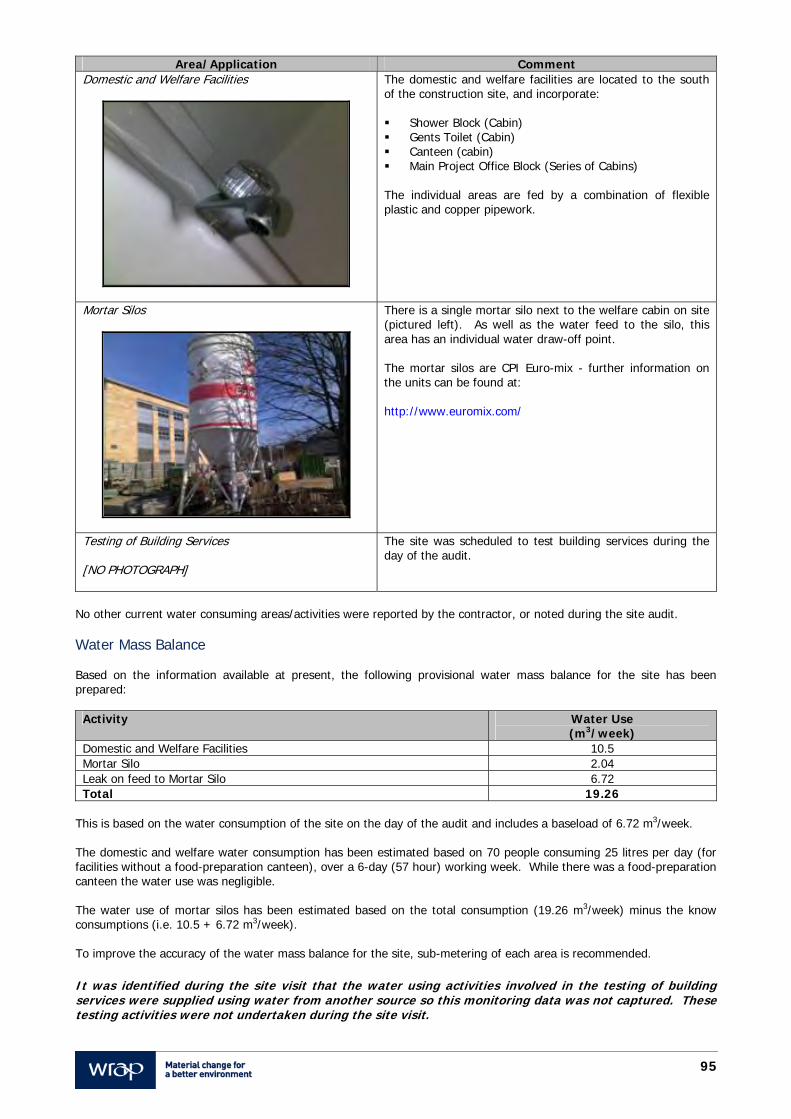
95
Area/Application Comment Domestic and Welfare Facilities
The domestic and welfare facilities are located to the south of the construction site, and incorporate: Shower Block (Cabin) Gents Toilet (Cabin) Canteen (cabin) Main Project Office Block (Series of Cabins) The individual areas are fed by a combination of flexible plastic and copper pipework.
Mortar Silos
There is a single mortar silo next to the welfare cabin on site (pictured left). As well as the water feed to the silo, this area has an individual water draw-off point. The mortar silos are CPI Euro-mix - further information on the units can be found at: http://www.euromix.com/
Testing of Building Services [NO PHOTOGRAPH]
The site was scheduled to test building services during the day of the audit.
No other current water consuming areas/activities were reported by the contractor, or noted during the site audit. Water Mass Balance Based on the information available at present, the following provisional water mass balance for the site has been prepared:
Activity Water Use (m3/week)
Domestic and Welfare Facilities 10.5 Mortar Silo 2.04 Leak on feed to Mortar Silo 6.72 Total 19.26
This is based on the water consumption of the site on the day of the audit and includes a baseload of 6.72 m3/week. The domestic and welfare water consumption has been estimated based on 70 people consuming 25 litres per day (for facilities without a food-preparation canteen), over a 6-day (57 hour) working week. While there was a food-preparation canteen the water use was negligible. The water use of mortar silos has been estimated based on the total consumption (19.26 m3/week) minus the know consumptions (i.e. 10.5 + 6.72 m3/week). To improve the accuracy of the water mass balance for the site, sub-metering of each area is recommended. It was identified during the site visit that the water using activities involved in the testing of building services were supplied using water from another source so this monitoring data was not captured. These testing activities were not undertaken during the site visit.
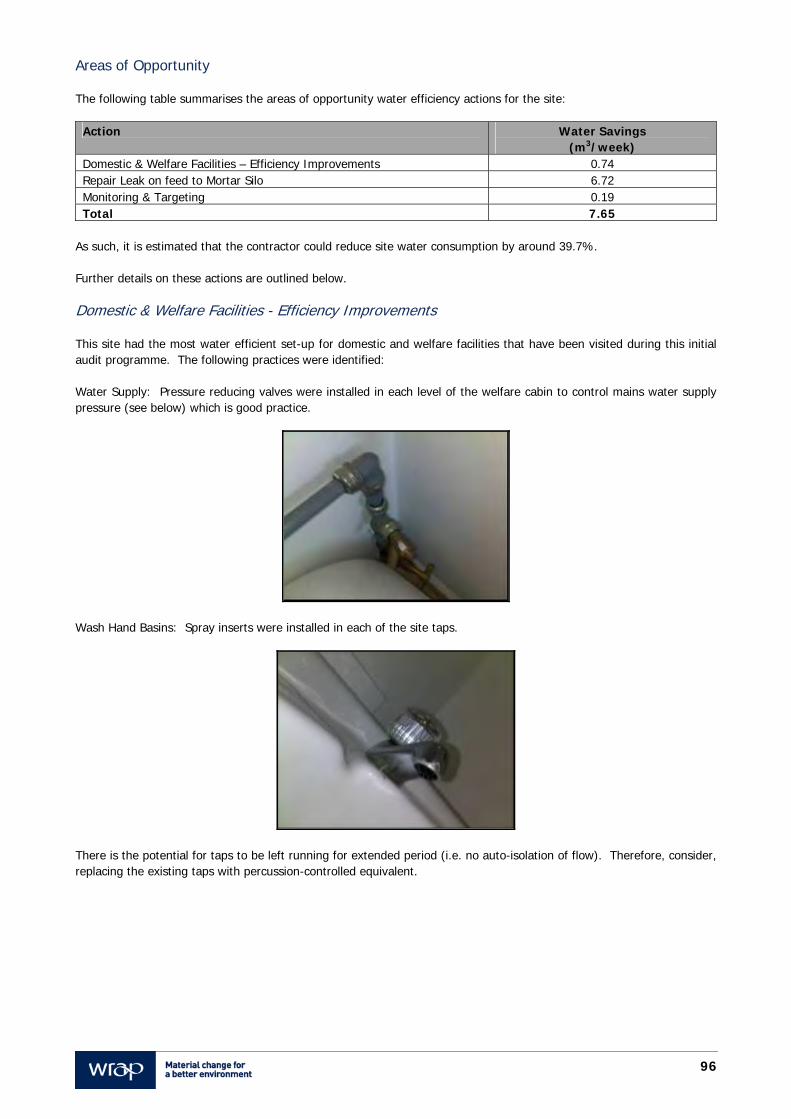
96
Areas of Opportunity The following table summarises the areas of opportunity water efficiency actions for the site:
Action Water Savings (m3/week)
Domestic & Welfare Facilities – Efficiency Improvements 0.74 Repair Leak on feed to Mortar Silo 6.72 Monitoring & Targeting 0.19 Total 7.65
As such, it is estimated that the contractor could reduce site water consumption by around 39.7%. Further details on these actions are outlined below. Domestic & Welfare Facilities - Efficiency Improvements This site had the most water efficient set-up for domestic and welfare facilities that have been visited during this initial audit programme. The following practices were identified: Water Supply: Pressure reducing valves were installed in each level of the welfare cabin to control mains water supply pressure (see below) which is good practice.
Wash Hand Basins: Spray inserts were installed in each of the site taps.
There is the potential for taps to be left running for extended period (i.e. no auto-isolation of flow). Therefore, consider, replacing the existing taps with percussion-controlled equivalent.
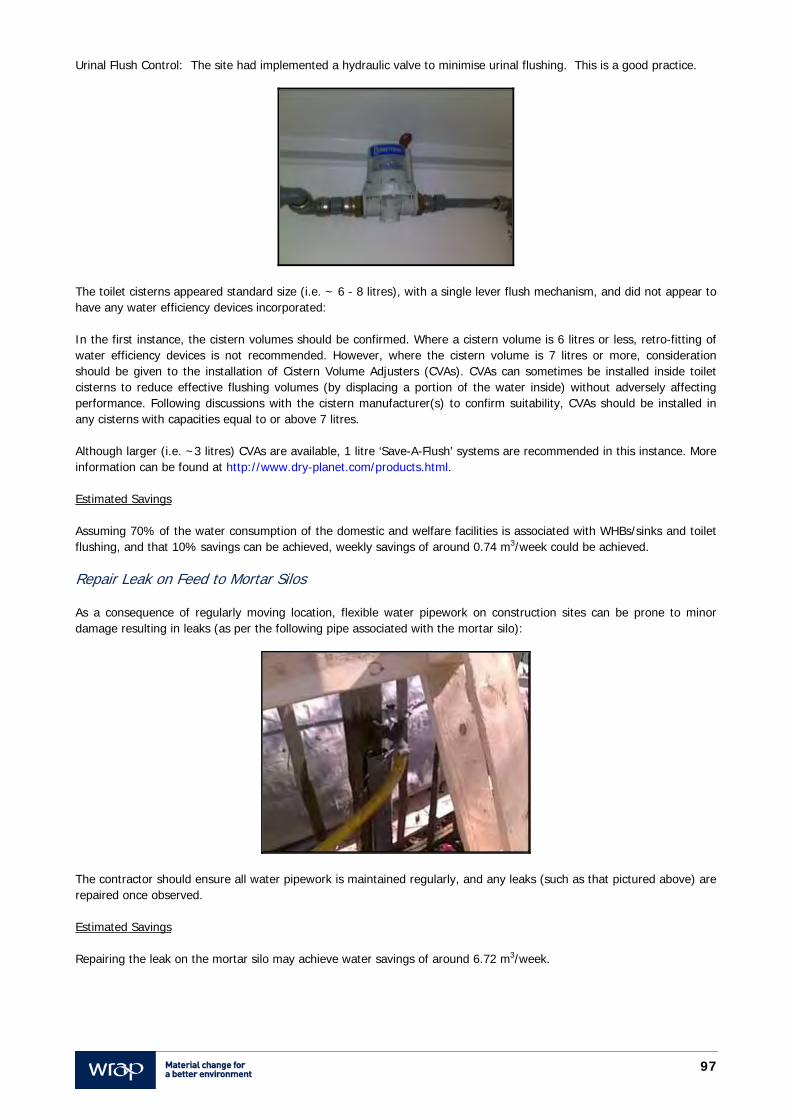
97
Urinal Flush Control: The site had implemented a hydraulic valve to minimise urinal flushing. This is a good practice.
The toilet cisterns appeared standard size (i.e. ~ 6 - 8 litres), with a single lever flush mechanism, and did not appear to have any water efficiency devices incorporated: In the first instance, the cistern volumes should be confirmed. Where a cistern volume is 6 litres or less, retro-fitting of water efficiency devices is not recommended. However, where the cistern volume is 7 litres or more, consideration should be given to the installation of Cistern Volume Adjusters (CVAs). CVAs can sometimes be installed inside toilet cisterns to reduce effective flushing volumes (by displacing a portion of the water inside) without adversely affecting performance. Following discussions with the cistern manufacturer(s) to confirm suitability, CVAs should be installed in any cisterns with capacities equal to or above 7 litres. Although larger (i.e. ~3 litres) CVAs are available, 1 litre ‘Save-A-Flush’ systems are recommended in this instance. More information can be found at http://www.dry-planet.com/products.html. Estimated Savings Assuming 70% of the water consumption of the domestic and welfare facilities is associated with WHBs/sinks and toilet flushing, and that 10% savings can be achieved, weekly savings of around 0.74 m3/week could be achieved. Repair Leak on Feed to Mortar Silos As a consequence of regularly moving location, flexible water pipework on construction sites can be prone to minor damage resulting in leaks (as per the following pipe associated with the mortar silo):
The contractor should ensure all water pipework is maintained regularly, and any leaks (such as that pictured above) are repaired once observed. Estimated Savings Repairing the leak on the mortar silo may achieve water savings of around 6.72 m3/week.

98
Monitoring & Targeting It is recommended that the contractor implements a few improvements to the existing Monitoring & Targeting (M&T) system for the site’s water consumption - this will involve undertaking two main actions on a regular basis: Increase tracking of water consumed to m3 per week, and assess for erroneous consumption (this may have
identified the leaks in December 2010 and January 2011 sooner). Once per month, conduct brief out-of-hours assessment of baseload water consumption. These actions should help identify (and eliminate) unnecessary water consumption on site. Estimated Savings There is not currently enough information to estimate the savings associated with these actions, and as such an arbitrary figure of 1% of the current site water consumption will be used - this accounts to 0.19 m3/week.
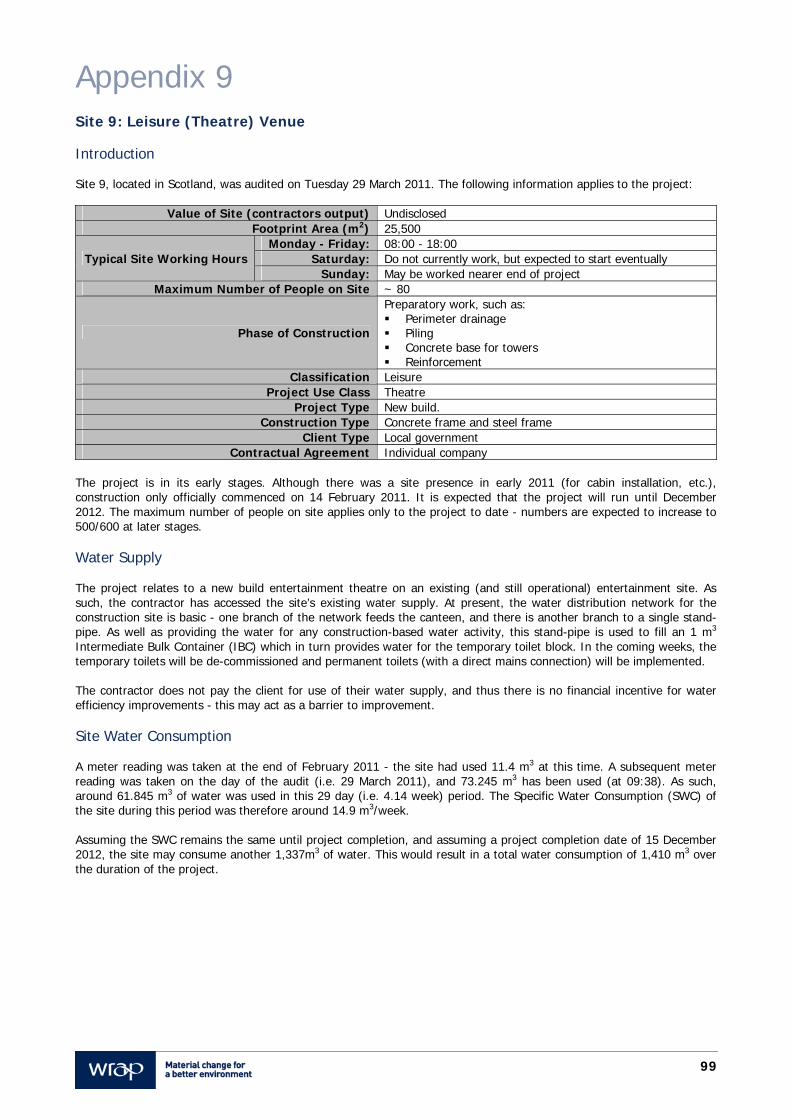
99
Appendix 9 Site 9: Leisure (Theatre) Venue Introduction Site 9, located in Scotland, was audited on Tuesday 29 March 2011. The following information applies to the project:
Value of Site (contractors output) Undisclosed Footprint Area (m2) 25,500
Typical Site Working Hours Monday - Friday: 08:00 - 18:00
Saturday: Do not currently work, but expected to start eventually Sunday: May be worked nearer end of project
Maximum Number of People on Site ~ 80
Phase of Construction
Preparatory work, such as: Perimeter drainage Piling Concrete base for towers Reinforcement
Classification Leisure Project Use Class Theatre
Project Type New build. Construction Type Concrete frame and steel frame
Client Type Local government Contractual Agreement Individual company
The project is in its early stages. Although there was a site presence in early 2011 (for cabin installation, etc.), construction only officially commenced on 14 February 2011. It is expected that the project will run until December 2012. The maximum number of people on site applies only to the project to date - numbers are expected to increase to 500/600 at later stages. Water Supply The project relates to a new build entertainment theatre on an existing (and still operational) entertainment site. As such, the contractor has accessed the site’s existing water supply. At present, the water distribution network for the construction site is basic - one branch of the network feeds the canteen, and there is another branch to a single stand-pipe. As well as providing the water for any construction-based water activity, this stand-pipe is used to fill an 1 m3 Intermediate Bulk Container (IBC) which in turn provides water for the temporary toilet block. In the coming weeks, the temporary toilets will be de-commissioned and permanent toilets (with a direct mains connection) will be implemented. The contractor does not pay the client for use of their water supply, and thus there is no financial incentive for water efficiency improvements - this may act as a barrier to improvement. Site Water Consumption A meter reading was taken at the end of February 2011 - the site had used 11.4 m3 at this time. A subsequent meter reading was taken on the day of the audit (i.e. 29 March 2011), and 73.245 m3 has been used (at 09:38). As such, around 61.845 m3 of water was used in this 29 day (i.e. 4.14 week) period. The Specific Water Consumption (SWC) of the site during this period was therefore around 14.9 m3/week. Assuming the SWC remains the same until project completion, and assuming a project completion date of 15 December 2012, the site may consume another 1,337m3 of water. This would result in a total water consumption of 1,410 m3 over the duration of the project.
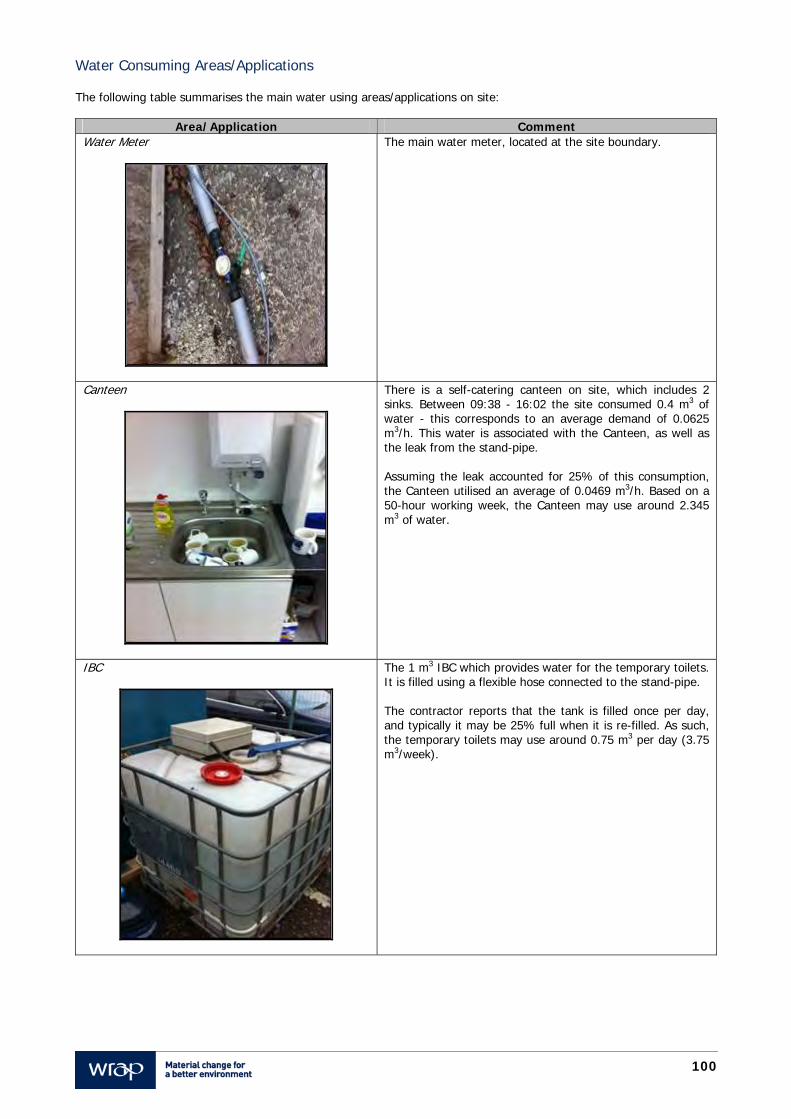
100
Water Consuming Areas/Applications The following table summarises the main water using areas/applications on site:
Area/Application Comment Water Meter
The main water meter, located at the site boundary.
Canteen
There is a self-catering canteen on site, which includes 2 sinks. Between 09:38 - 16:02 the site consumed 0.4 m3 of water - this corresponds to an average demand of 0.0625 m3/h. This water is associated with the Canteen, as well as the leak from the stand-pipe. Assuming the leak accounted for 25% of this consumption, the Canteen utilised an average of 0.0469 m3/h. Based on a 50-hour working week, the Canteen may use around 2.345 m3 of water.
IBC
The 1 m3 IBC which provides water for the temporary toilets. It is filled using a flexible hose connected to the stand-pipe. The contractor reports that the tank is filled once per day, and typically it may be 25% full when it is re-filled. As such, the temporary toilets may use around 0.75 m3 per day (3.75 m3/week).
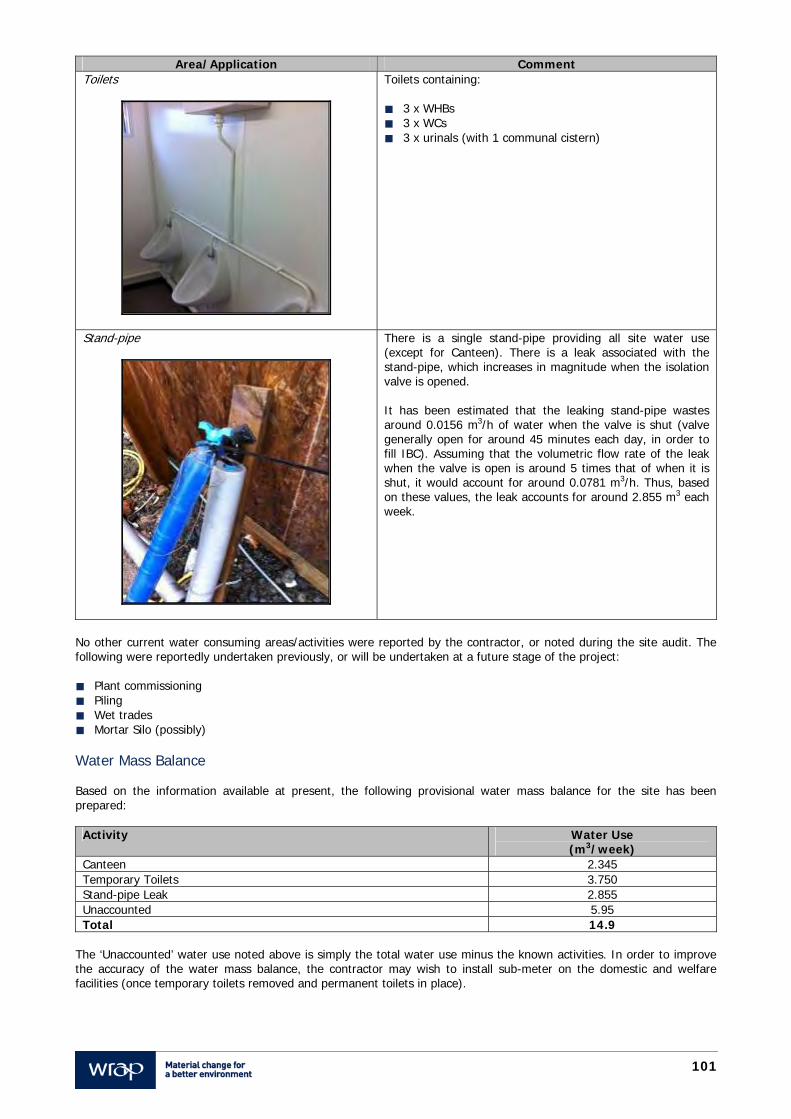
101
Area/Application Comment Toilets
Toilets containing: 3 x WHBs 3 x WCs 3 x urinals (with 1 communal cistern)
Stand-pipe
There is a single stand-pipe providing all site water use (except for Canteen). There is a leak associated with the stand-pipe, which increases in magnitude when the isolation valve is opened. It has been estimated that the leaking stand-pipe wastes around 0.0156 m3/h of water when the valve is shut (valve generally open for around 45 minutes each day, in order to fill IBC). Assuming that the volumetric flow rate of the leak when the valve is open is around 5 times that of when it is shut, it would account for around 0.0781 m3/h. Thus, based on these values, the leak accounts for around 2.855 m3 each week.
No other current water consuming areas/activities were reported by the contractor, or noted during the site audit. The following were reportedly undertaken previously, or will be undertaken at a future stage of the project: Plant commissioning Piling Wet trades Mortar Silo (possibly)
Water Mass Balance Based on the information available at present, the following provisional water mass balance for the site has been prepared:
Activity Water Use (m3/week)
Canteen 2.345 Temporary Toilets 3.750 Stand-pipe Leak 2.855 Unaccounted 5.95 Total 14.9
The ‘Unaccounted’ water use noted above is simply the total water use minus the known activities. In order to improve the accuracy of the water mass balance, the contractor may wish to install sub-meter on the domestic and welfare facilities (once temporary toilets removed and permanent toilets in place).
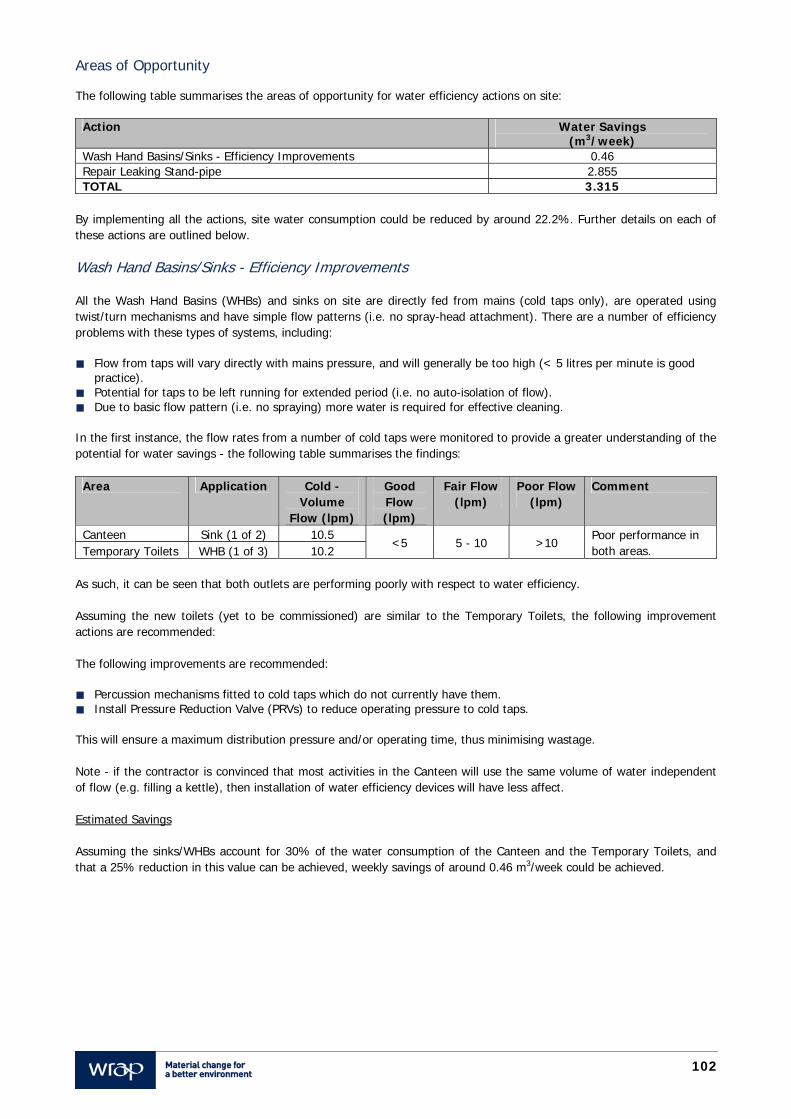
102
Areas of Opportunity The following table summarises the areas of opportunity for water efficiency actions on site:
Action Water Savings (m3/week)
Wash Hand Basins/Sinks - Efficiency Improvements 0.46 Repair Leaking Stand-pipe 2.855 TOTAL 3.315
By implementing all the actions, site water consumption could be reduced by around 22.2%. Further details on each of these actions are outlined below. Wash Hand Basins/Sinks - Efficiency Improvements All the Wash Hand Basins (WHBs) and sinks on site are directly fed from mains (cold taps only), are operated using twist/turn mechanisms and have simple flow patterns (i.e. no spray-head attachment). There are a number of efficiency problems with these types of systems, including: Flow from taps will vary directly with mains pressure, and will generally be too high (< 5 litres per minute is good
practice). Potential for taps to be left running for extended period (i.e. no auto-isolation of flow). Due to basic flow pattern (i.e. no spraying) more water is required for effective cleaning.
In the first instance, the flow rates from a number of cold taps were monitored to provide a greater understanding of the potential for water savings - the following table summarises the findings:
Area Application Cold - Volume
Flow (lpm)
Good Flow (lpm)
Fair Flow (lpm)
Poor Flow (lpm)
Comment
Canteen Sink (1 of 2) 10.5 <5 5 - 10 >10
Poor performance in both areas. Temporary Toilets WHB (1 of 3) 10.2
As such, it can be seen that both outlets are performing poorly with respect to water efficiency. Assuming the new toilets (yet to be commissioned) are similar to the Temporary Toilets, the following improvement actions are recommended: The following improvements are recommended: Percussion mechanisms fitted to cold taps which do not currently have them. Install Pressure Reduction Valve (PRVs) to reduce operating pressure to cold taps.
This will ensure a maximum distribution pressure and/or operating time, thus minimising wastage. Note - if the contractor is convinced that most activities in the Canteen will use the same volume of water independent of flow (e.g. filling a kettle), then installation of water efficiency devices will have less affect. Estimated Savings Assuming the sinks/WHBs account for 30% of the water consumption of the Canteen and the Temporary Toilets, and that a 25% reduction in this value can be achieved, weekly savings of around 0.46 m3/week could be achieved.
103
Repair Leaking Stand-pipe It is recommended that the leaking stand-pipe is repaired, to provide weekly savings of around 2.855 m3. Note – since site audit was undertaken the contractor has repaired this leak (as per photograph below), and regularly checks the condition of the connection:

104
Appendix 10 Water Audit Methodology
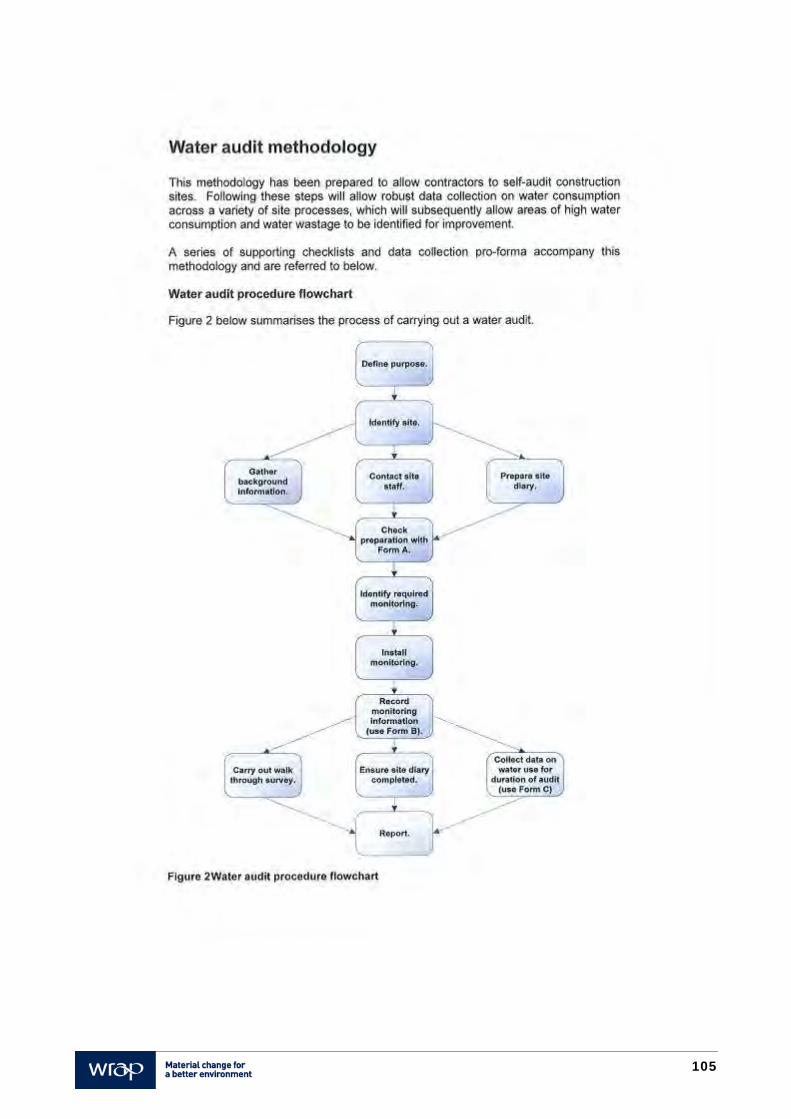
105
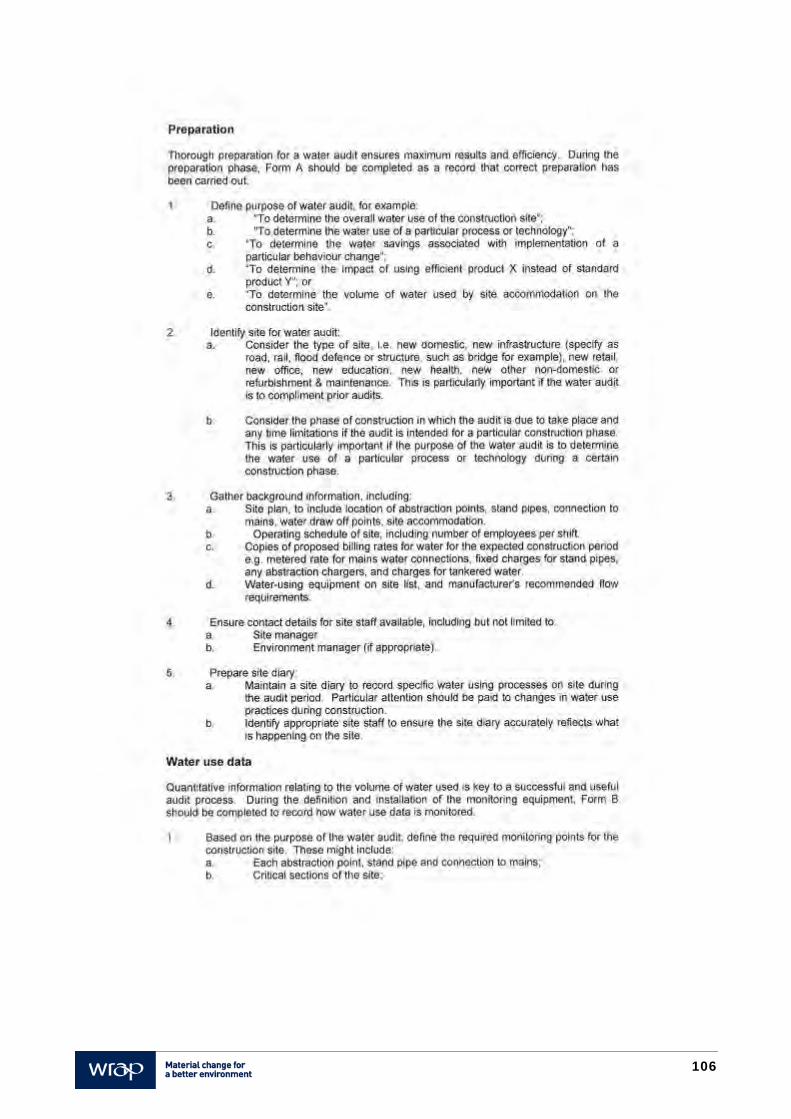
106
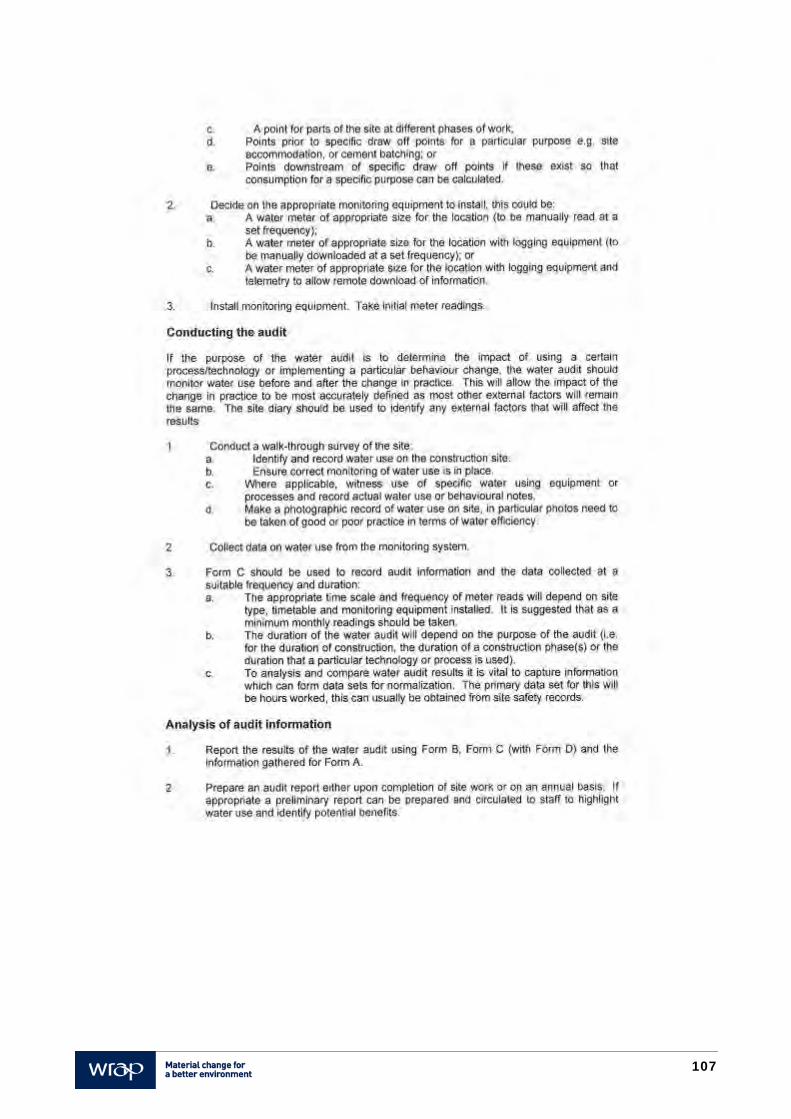
107
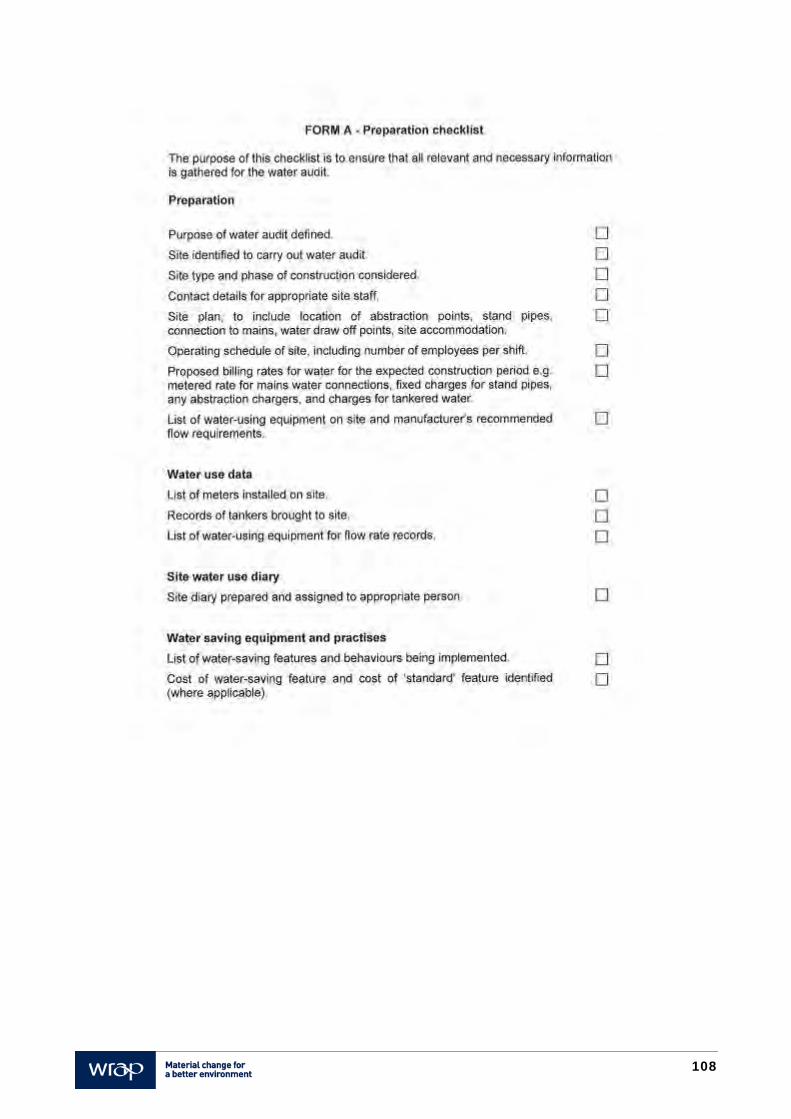
108
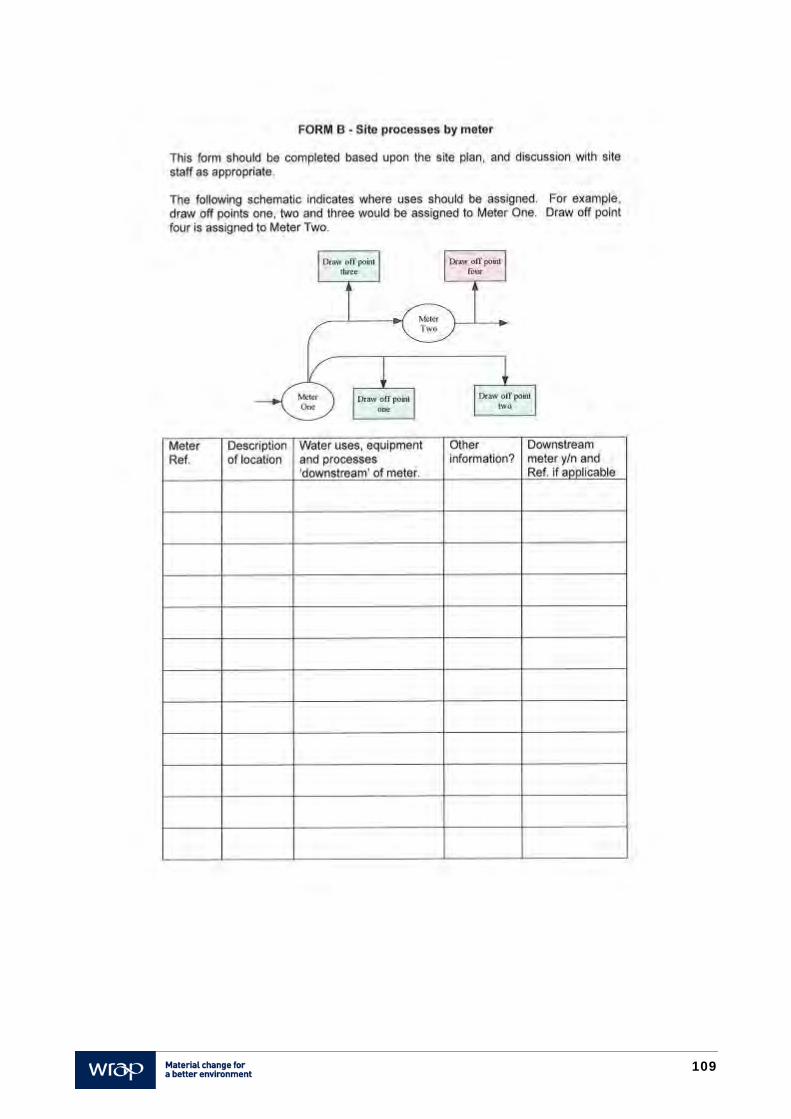
109
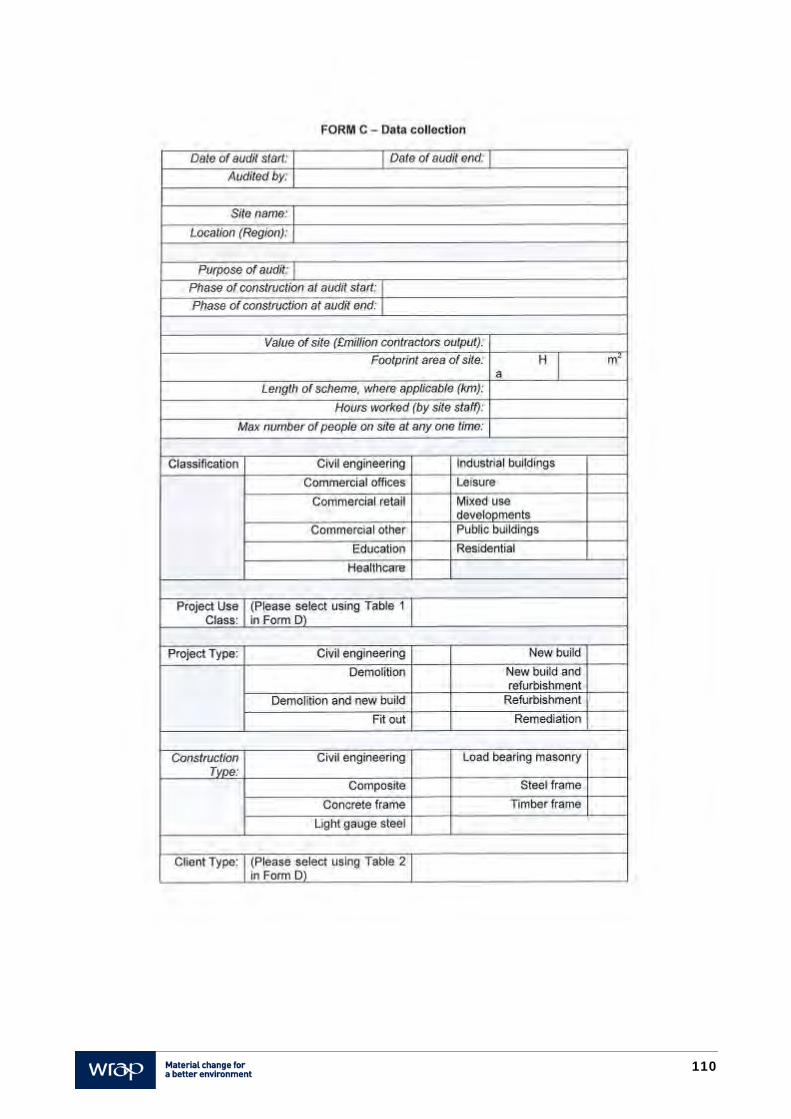
110
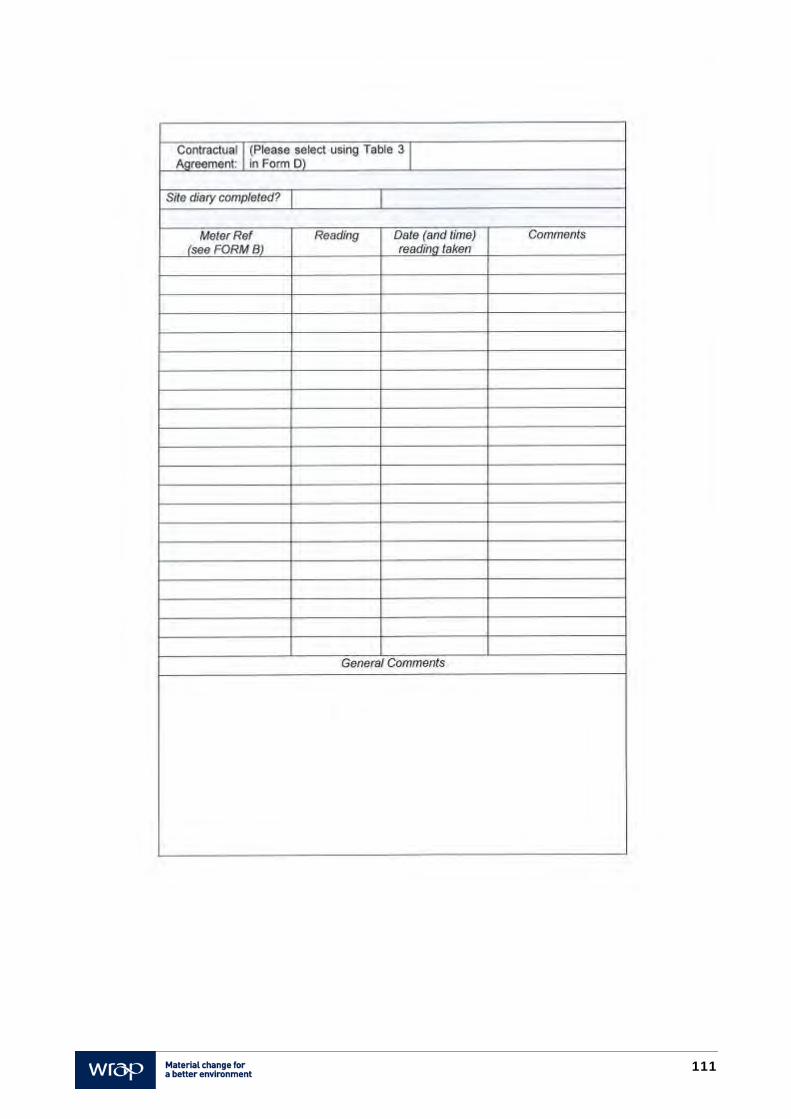
111
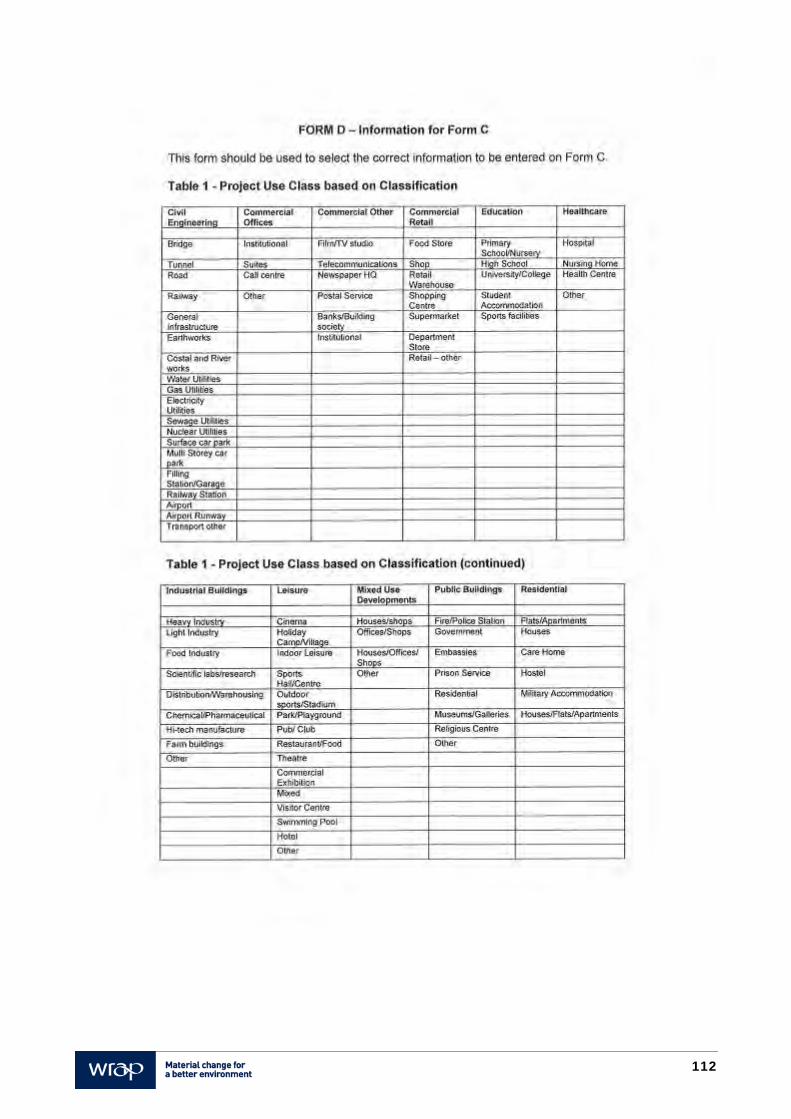
112
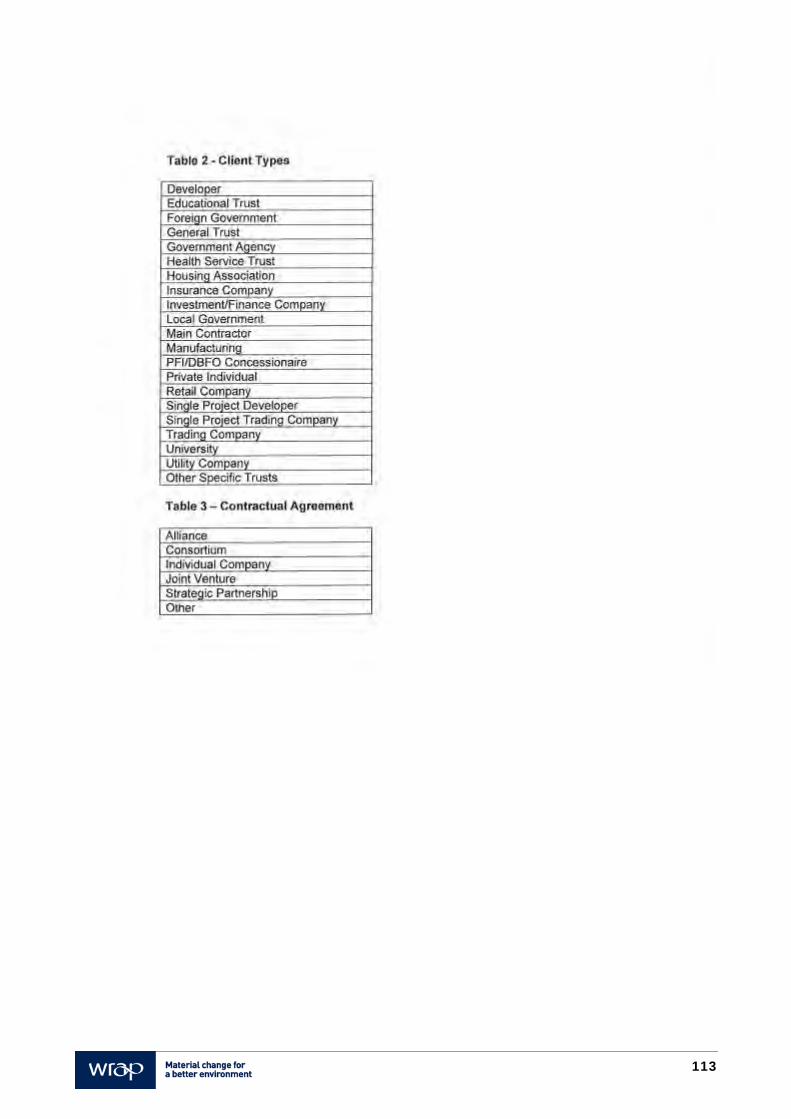
113
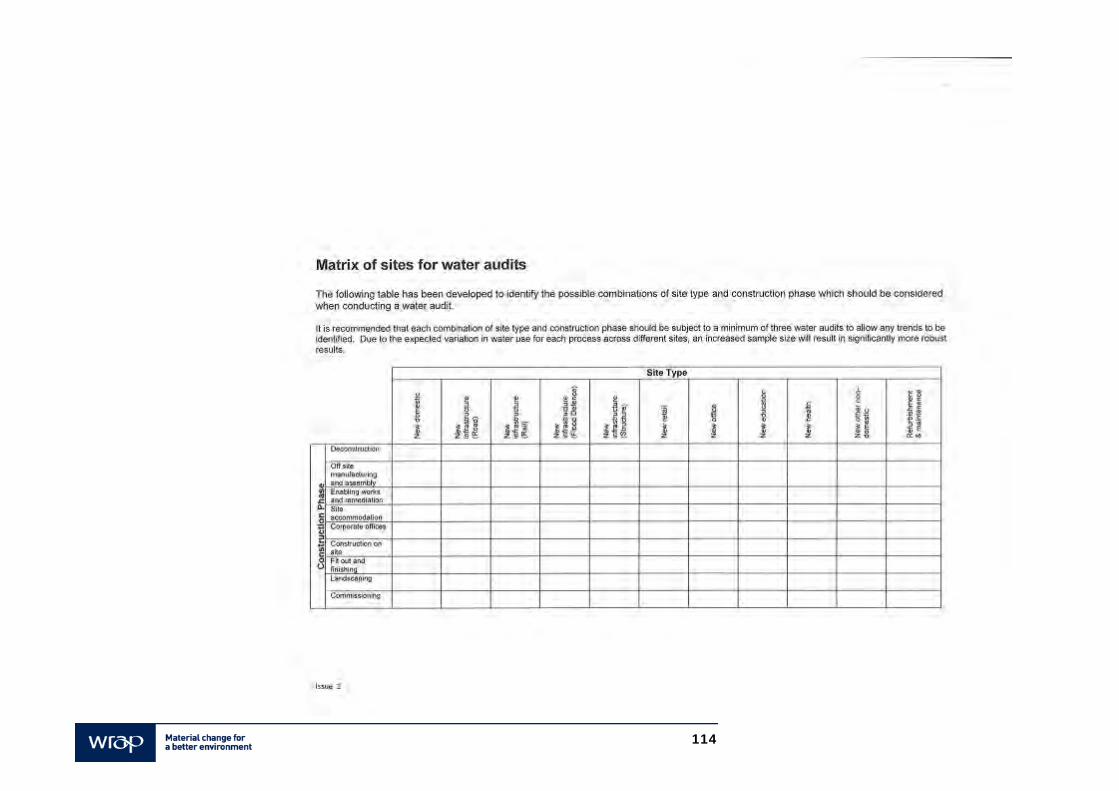
114

www.wrap.org.uk/construction