audit report_2013.indd
23
Independent Auditors’ Report To The Shareholders of Beximco Pharmaceuticals Limited Report on the Financial Statements We have audited the accompanying financial statements of Beximco Pharmaceuticals Limited, which comprise the Statement of Financial Position as at 31 December 2013, the Statements of Comprehensive Income, Changes in Equity and Cash Flows for the year then ended, and notes, comprising a summary of significant accounting policies and other explanatory information. Management’s Responsibility for the Financial Statements Management is responsible for the preparation and fair presentation of these financial statements in accordance with International Financial Reporting Standards (IFRSs), Bangladesh Financial Reporting Standards (BFRSs), the Companies Act 1994, the Securities and Exchange Rules 1987 and other applicable laws and regulations, and for such internal control as management determines is necessary to enable the preparation of financial statements that are free from material misstatement, whether due to fraud or error. Auditors’ Responsibility Our responsibility is to express an opinion on these financial statements based on our audit. We conducted our audit in accordance with International Standards on Auditing (ISA) and Bangladesh Standards on Auditing (BSA). Those standards require that we comply with ethical requirements and plan and perform the audit to obtain reasonable assurance about whether the financial statements are free from material misstatement. An audit involves performing procedures to obtain audit evidence about the amounts and disclosures in the financial statements. The procedures selected depend on our judgment, including the assessment of the risks of material misstatement of the financial statements, whether due to fraud or error. In making those risk assessments, we consider internal control relevant to the entity’s preparation and fair presentation of the financial statements in order to design audit procedure that are appropriate in the circumstance, but not for the purpose of expressing an opinion on the effectiveness of the entity’s internal control. An audit also includes evaluating the appropriateness of accounting policies used and the reasonableness of accounting estimates made by management, as well as evaluating the overall presentation of the financial statements. We believe that the audit evidence we have obtained is sufficient and appropriate to provide a basis for our audit opinion. Opinion In our opinion, the financial statements give a true and fair view of the financial position of the Company as at 31 December 2013, and of its financial performance and its cash flows for the year then ended in accordance with International Financial Reporting Standards (IFRSs) and Bangladesh Financial Reporting Standards (BFRSs), the Companies Act 1994, the Securities and Exchange Rules 1987 and other applicable laws and regulations. Report on Other Legal and Regulatory Requirements In accordance with the requirements of the Companies Act 1994 and the Securities and Exchange Rules 1987, we report that: (a) we have obtained all the information and explanations which to the best of our knowledge and belief were necessary for the purposes of our audit and made due verification thereof; (b) in our opinion, proper books of account as required by law have been kept by the company so far as it appeared from our examination of these books; (c) the Statement of Financial Position ( Balance Sheet) and Statement of Comprehensive Income (Profit and Loss Account) dealt with by the report are in agreement with the books of account; and (d) the expenditure incurred was for the purposes of the company’s business. Dhaka M.J. Abedin & Co. 29 April, 2014 Chartered Accountants 1
Transcript of audit report_2013.indd

Independent Auditors’ ReportTo The Shareholders of
Beximco Pharmaceuticals Limited
Report on the Financial Statements
We have audited the accompanying fi nancial statements of Beximco Pharmaceuticals Limited, which comprise the Statement of Financial Position as at 31 December 2013, the Statements of Comprehensive Income, Changes in Equity and Cash Flows for the year then ended, and notes, comprising a summary of signifi cant accounting policies and other explanatory information.
Management’s Responsibility for the Financial Statements
Management is responsible for the preparation and fair presentation of these fi nancial statements in accordance with International Financial Reporting Standards (IFRSs), Bangladesh Financial Reporting Standards (BFRSs), the Companies Act 1994, the Securities and Exchange Rules 1987 and other applicable laws and regulations, and for such internal control as management determines is necessary to enable the preparation of fi nancial statements that are free from material misstatement, whether due to fraud or error.
Auditors’ Responsibility
Our responsibility is to express an opinion on these fi nancial statements based on our audit. We conducted our audit in accordance with International Standards on Auditing (ISA) and Bangladesh Standards on Auditing (BSA). Those standards require that we comply with ethical requirements and plan and perform the audit to obtain reasonable assurance about whether the fi nancial statements are free from material misstatement.
An audit involves performing procedures to obtain audit evidence about the amounts and disclosures in the fi nancial statements. The procedures selected depend on our judgment, including the assessment of the risks of material misstatement of the fi nancial statements, whether due to fraud or error. In making those risk assessments, we consider internal control relevant to the entity’s preparation and fair presentation of the fi nancial statements in order to design audit procedure that are appropriate in the circumstance, but not for the purpose of expressing an opinion on the effectiveness of the entity’s internal control. An audit also includes evaluating the appropriateness of accounting policies used and the reasonableness of accounting estimates made by management, as well as evaluating the overall presentation of the fi nancial statements.
We believe that the audit evidence we have obtained is suffi cient and appropriate to provide a basis for our audit opinion.
Opinion
In our opinion, the fi nancial statements give a true and fair view of the fi nancial position of the Company as at 31 December 2013, and of its fi nancial performance and its cash fl ows for the year then ended in accordance with International Financial Reporting Standards (IFRSs) and Bangladesh Financial Reporting Standards (BFRSs), the Companies Act 1994, the Securities and Exchange Rules 1987 and other applicable laws and regulations.
Report on Other Legal and Regulatory Requirements
In accordance with the requirements of the Companies Act 1994 and the Securities and Exchange Rules 1987, we report that:
(a) we have obtained all the information and explanations which to the best of our knowledge and belief were necessary for the purposes of our audit and made due verifi cation thereof;
(b) in our opinion, proper books of account as required by law have been kept by the company so far as it appeared from our examination of these books;
(c) the Statement of Financial Position ( Balance Sheet) and Statement of Comprehensive Income (Profi t and Loss Account) dealt with by the report are in agreement with the books of account; and
(d) the expenditure incurred was for the purposes of the company’s business.
Dhaka M.J. Abedin & Co.
29 April, 2014 Chartered Accountants
1

Beximco Pharmaceuticals Limited
Statement of Financial Position
As at 31 December 2013 Notes 2013 2012
ASSETS
Non-Current Assets 18,567,329,474 16,392,388,639 Property, Plant and Equipment- Carrying Value 4 (a) 18,364,313,070 16,201,858,216 Intangible Assets 3.3 & 5 198,223,509 187,079,147 Investment in Shares 6 4,792,895 3,451,276
Current Assets 8,903,422,328 8,197,421,953 Inventories 7 2,411,881,986 2,433,987,981 Spares & Supplies 8 433,352,407 396,175,790 Accounts Receivable 9 1,249,434,697 1,162,404,807 Loans, Advances and Deposits 10 1,186,637,111 965,276,373 Short Term Investment 11 3,026,383,161 2,686,598,326 Cash and Cash Equivalents 12 595,732,966 552,978,676
TOTAL ASSETS 27,470,751,802 24,589,810,592
EQUITY AND LIABILITIES
Shareholders’ Equity 19,775,552,465 18,408,161,859 Issued Share Capital 13 3,503,349,070 3,046,390,500 Share Premium 5,269,474,690 5,269,474,690 Excess of Issue Price over Face Value of GDRs 14 1,689,636,958 1,689,636,958 Capital Reserve on Merger 294,950,950 294,950,950 Revaluation Surplus 4(b) 1,349,578,805 1,406,527,880 Fair Value Gain on Investment 6 1,341,619 - Retained Earnings 7,667,220,373 6,701,180,881
Non-Current Liabilities 3,312,618,059 3,116,703,964 Long Term Borrowings-Net off Current Maturity (Secured) 15 1,151,400,702 1,469,621,611 Liability for Gratuity and WPPF & Welfare Funds 16 610,628,150 499,622,784 Deferred Tax Liability 17 1,550,589,207 1,147,459,569
Current Liabilities and Provisions 4,382,581,278 3,064,944,769 Short Term Borrowings (Secured) 18 2,776,266,125 1,526,449,918 Long Term Borrowings-Current Maturity (Secured) 19 754,903,558 664,712,728 Creditors and Other Payables 20 383,170,553 470,097,685 Accrued Expenses 21 141,582,304 128,598,961 Dividend Payable 973,367 1,020,948 Income Tax Payable 22 325,685,371 274,064,529
TOTAL EQUITY AND LIABILITIES 27,470,751,802 24,589,810,592
The Notes are an integral part of the Financial Statements. Approved and authorised for issue by the Board of Directors on 29 April, 2014 and signed for and on behalf of the Board :
M. J. Abedin & Co.
Chartered AccountantsDhaka29 April, 2014
Amount in Taka
Per our report of even date.
Salman F Rahman
Vice ChairmanNazmul Hassan
Managing DirectorAli Nawaz
Chief Financial Offi cer
2
Beximco Pharmaceuticals Limited
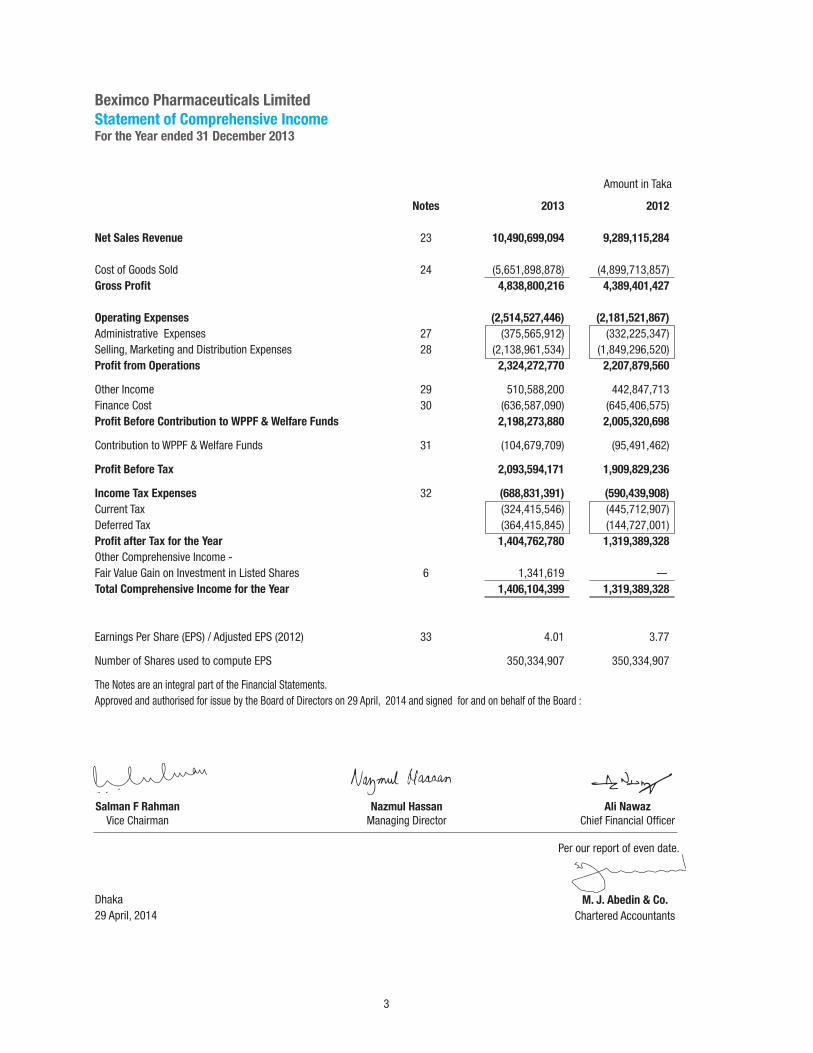
Statement of Comprehensive IncomeFor the Year ended 31 December 2013
Notes 2013 2012
Net Sales Revenue 23 10,490,699,094 9,289,115,284
Cost of Goods Sold 24 (5,651,898,878) (4,899,713,857)Gross Profi t 4,838,800,216 4,389,401,427
Operating Expenses (2,514,527,446) (2,181,521,867)
Administrative Expenses 27 (375,565,912) (332,225,347)Selling, Marketing and Distribution Expenses 28 (2,138,961,534) (1,849,296,520)Profi t from Operations 2,324,272,770 2,207,879,560
Other Income 29 510,588,200 442,847,713 Finance Cost 30 (636,587,090) (645,406,575)Profi t Before Contribution to WPPF & Welfare Funds 2,198,273,880 2,005,320,698
Contribution to WPPF & Welfare Funds 31 (104,679,709) (95,491,462)
Profi t Before Tax 2,093,594,171 1,909,829,236
Income Tax Expenses 32 (688,831,391) (590,439,908)
Current Tax (324,415,546) (445,712,907)Deferred Tax (364,415,845) (144,727,001)Profi t after Tax for the Year 1,404,762,780 1,319,389,328
Other Comprehensive Income - Fair Value Gain on Investment in Listed Shares 6 1,341,619 - Total Comprehensive Income for the Year 1,406,104,399 1,319,389,328
Earnings Per Share (EPS) / Adjusted EPS (2012) 33 4.01 3.77
Number of Shares used to compute EPS 350,334,907 350,334,907
The Notes are an integral part of the Financial Statements. Approved and authorised for issue by the Board of Directors on 29 April, 2014 and signed for and on behalf of the Board :
Amount in Taka
Dhaka29 April, 2014
M. J. Abedin & Co.
Chartered Accountants
Per our report of even date.
Salman F Rahman
Vice ChairmanNazmul Hassan
Managing DirectorAli Nawaz
Chief Financial Offi cer
3

Amount in Taka
Beximco Pharmaceuticals Limited
Statement of Changes in Equity For the Year ended 31 December 2013
Dhaka29 April, 2014
M. J. Abedin & Co.
Chartered Accountants
Per our report of even date.
The Notes are an integral part of the Financial Statements.
Approved and authorised for issue by the Board of Directors on 29 April, 2014 and signed for and on behalf of the Board :
Balance as on
January 01, 2013
Total Comprehensive
Income for 2013:
Profi t for the yearOther Comprehensive Income
Transactions with
the Shareholders:
Stock Dividend for 2012
Adjustment for Depreciation on Revalued Assets
Adjustment for Deferred Tax on Revalued Assets
Balance as on
December 31, 2013
Number of SharesNet Asset Value (NAV) Per Share
3,046,390,500
- -
456,958,570
-
-
3,503,349,070
5,269,474,690
- -
-
-
-
5,269,474,690
1,689,636,958
--
-
-
-
1,689,636,958
294,950,950
--
-
-
-
294,950,950
1,406,527,880
--
-
(18,235,282)
(38,713,793)
1,349,578,805
-
- 1,341,619
-
-
-
1,341,619
Share
Capital
Share
Premium
Excess of Issue
Price over Face
Value of GDRs
Capital
Reserve on
Merger
Revaluation
Surplus
Fair Value
Gain on
Investment
Retained
Earnings
Total
6,701,180,881
1,404,762,780-
(456,958,570)
18,235,282
-
7,667,220,373
18,408,161,859
1,404,762,780 1,341,619
-
-
(38,713,793)
19,775,552,465
350,334,907
56.45
Salman F Rahman
Vice ChairmanNazmul Hassan
Managing DirectorAli Nawaz
Chief Financial Offi cer
4

Amount in Taka
M. J. Abedin & Co.
Chartered Accountants
Per our report of even date.
Beximco Pharmaceuticals Limited
Statement of Cash Flows
For the Year ended 31 December 2013
2013 2012Cash Flows from Operating Activities :
Receipts from Customers and Others 10,407,897,987 9,107,836,251 Payments to Suppliers and Employees (7,880,610,113) (6,855,119,972)Cash Generated from Operations 2,527,287,874 2,252,716,279
Interest Paid (636,587,090) (645,406,575)Interest Received 512,424,678 437,201,038 Income Tax Paid (272,794,704) (187,130,672)Net Cash Generated from Operating Activities 2,130,330,758 1,857,380,070
Cash Flows from Investing Activities :
Acquisition of Property, Plant and Equipment (2,739,061,076) (1,033,862,245)Intangible Assets (25,370,921) (65,272,280)Disposal of Property, Plant and Equipment 5,401,817 4,730,688 Short Term Investment (339,784,835) (493,174,766)Net Cash Used in Investing Activities (3,098,815,015) (1,587,578,603)
Cash Flows from Financing Activities :
Net Decrease in Long Term Borrowings (228,030,079) (119,484,493)Net Increase / (Decrease) in Short Term Borrowings 1,239,316,207 (115,766,090)Dividend Paid (47,581) (340,504)Net Cash Generated from Financing Activities 1,011,238,547 (235,591,087)
Increase in Cash and Cash Equivalents 42,754,290 34,210,380
Cash and Cash Equivalents at Beginning of Year 552,978,676 518,768,296 Cash and Cash Equivalents at End of Year 595,732,966 552,978,676
Net Operating Cash Flow Per Share 6.08 6.10
Number of Shares used to compute Net Operating Cash Flow Per Share 350,334,907 304,639,050
The Notes are an integral part of the Financial Statements.
Approved and authorised for issue by the Board of Directors on 29 April, 2014 and signed for and on behalf of the Board :
Dhaka29 April, 2014
Salman F Rahman
Vice ChairmanNazmul Hassan
Managing DirectorAli Nawaz
Chief Financial Offi cer
5

Beximco Pharmaceuticals Limited
Notes to the Financial StatementsAs at and for the year ended 31 December 2013
1. Reporting entity
1.1 About the company
Beximco Pharmaceuticals Limited (BPL/ the Company) was incorporated as a public limited company in Bangladesh in 1976. It commenced its manufacturing operation in 1980. The company was listed with Dhaka Stock Exchange in 1985 and with Chittagong Stock Exchange on its debut in 1995. In 2005, BPL took over Beximco Infusions Ltd., a listed company of the Beximco Group engaged in manufacturing and marketing of intravenous fl uids and got enlisted with the Alternative Investment Market (AIM) of the London Stock Exchange through issuance of Global Depository Receipts (GDRs). Shares of the Company are traded in Dhaka and Chittagong Stock Exchanges of Bangladesh and its GDRs in AIM of the London Stock Exchange.
The registered offi ce of the company is located at House No. 17, Road No. 2, Dhanmondi R/A, Dhaka. The industrial units are located at Tongi and Kaliakoir of Gazipur district – vicinities close to the capital city Dhaka.
1.2 Nature of Business
The company is engaged in manufacturing and marketing of generic pharmaceuticals formulation products including life saving intravenous fl uids and Active Pharmaceutical Ingredients (APIs). Products of the company are sold in domestic and international markets. The company also provides contract manufacturing services.
2. Basis of Preparation of Financial Statements
2.1 Basis of Measurement
The fi nancial statements have been prepared on Historical Cost Basis except land, building and plant & machinery being revalued on 31 December 2008, investment in shares of listed company being valued at year end quoted price and the cash fl ow statement being prepared on cash basis.
2.2 Statement of Compliance
The fi nancial statements have been prepared in compliance with the requirements of the Companies Act, 1994, the Securities & Exchange Rules 1987, the Listing Regulations of Dhaka and Chittagong Stock Exchanges and other relevant local laws as applicable and in accordance with the International Financial Reporting Standards (IFRSs), and Bangladesh Financial Reporting Standards (BFRSs).
2.3 Presentation of Financial Statements
The presentation of these fi nancial statements is in accordance with the guidelines provided by IAS 1: Presentation of Financial Statements.
The fi nancial statements comprises of: (a) a Statement of Financial Position as at the end of the year 2013; (b) a Statement of Comprehensive Income for the year 2013; (c) a Statement of Changes in Equity for the year 2013; (d) a Statement of Cash Flows for the year 2013; and (e) notes, comprising summary of signifi cant accounting policies and explanatory information.
2.4 Reporting Period
The fi nancial statements cover one calendar year from January 01, 2013 to December 31, 2013.
2.5 Authorisation for issue
The fi nancial statements have been authorised for issue by the Board of Directors on April 29, 2014.
2.6 Functional and Presentation Currency
The fi nancial statements are prepared and presented in Bangladesh Currency (Taka), which is the company’s functional currency. All fi nancial information presented has been rounded off to the nearest Taka except where indicated otherwise.
6
2.7 Comparative Information
Comparative information has been disclosed in respect of the year 2012 for all numerical information in the fi nancial statements and also the narrative and descriptive information where it is relevant for understanding of the current year’s fi nancial statements.
Figures for the year 2012 have been re-arranged wherever considered necessary to ensure better comparability with the current year.
2.8 Use of Estimates and Judgments
The preparation of fi nancial statements in conformity with the IFRSs including IASs require management to make judgments, estimates and assumptions that affect the application of accounting policies and the reported amounts of assets, liabilities, income and expenses, and for contingent assets and liabilities that require disclosure, during and at the date of the fi nancial statements.
Actual results may differ from these estimates. Estimates and underlying assumptions are reviewed on an ongoing basis. Any revision of accounting estimates are recognized in the period in which the estimate is revised and in any future periods affected.
In particular, the key areas of estimation, uncertainty and critical judgments in applying accounting policies that have the most signifi cant effect on the amounts recognized in the fi nancial statements include depreciation, inventory valuation, accrued expenses, other payable and deferred liability for gratuity.
3. Signifi cant Accounting Policies
The accounting principles and policies in respect of material items of fi nancial statements set out below have been applied consistently to all periods presented in these fi nancial statements.
3.1 Revenue Recognition
In compliance with the requirements of IAS 18: Revenue, revenue receipts from customers against sales is recognized when products are dispatched to customers, that is, when the signifi cant risk and rewards of ownership have been transferred to the buyer, recovery of the consideration is probable, the associated costs and possible return of goods can be estimated reliably, and there is no continuing management involvement with the goods.
Revenue from sales is exclusive of VAT.
Cash dividend income on investment in shares is recognized on approval of said dividend in the annual general meeting. Stock dividend income (Bonus Shares) is not considered as revenue.
3.2 Property, Plant and Equipment
3.2.1 Recognition and Measurement
This has been stated at cost or revalued amount less accumulated depreciation in compliance with the requirements of IAS 16: Property, Plant and Equipment. The cost of acquisition of an asset comprises its purchase price and any directly attributable cost of bringing the assets to its working condition for its intended use inclusive of inward freight, duties and non-refundable taxes.
3.2.2 Maintenance Activities
The company incurs maintenance costs for all its major items of property, plant and equipment. Repair and maintenance costs are charged as expenses when incurred.
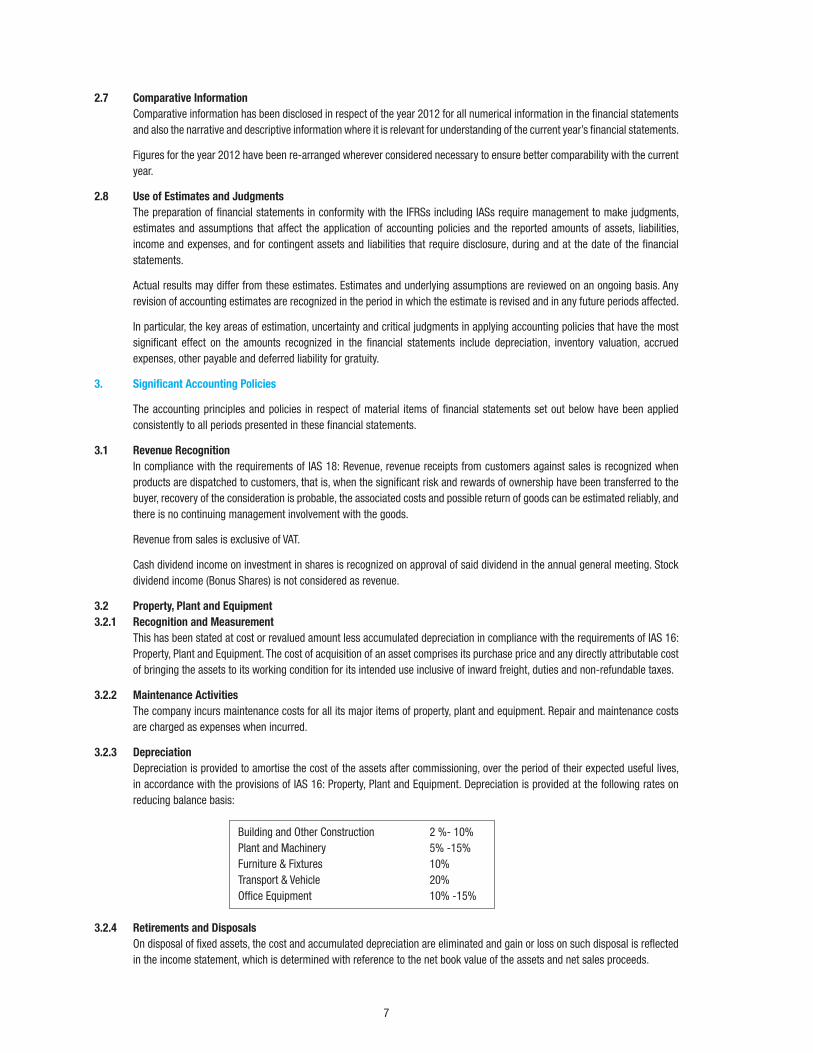
3.2.3 Depreciation
Depreciation is provided to amortise the cost of the assets after commissioning, over the period of their expected useful lives, in accordance with the provisions of IAS 16: Property, Plant and Equipment. Depreciation is provided at the following rates on reducing balance basis:
Building and Other Construction 2 %- 10% Plant and Machinery 5% -15% Furniture & Fixtures 10% Transport & Vehicle 20% Offi ce Equipment 10% -15%
3.2.4 Retirements and Disposals
On disposal of fi xed assets, the cost and accumulated depreciation are eliminated and gain or loss on such disposal is refl ected in the income statement, which is determined with reference to the net book value of the assets and net sales proceeds.
7

3.3 Intangible Assets
Intangible assets are stated at cost less provisions for amortization and impairments. Licenses, patents, know-how and marketing rights acquired are amortized over their estimated useful lives, using the straight line basis, from the time they are available for use. The cost of acquiring and developing computer software for internal use and internet sites for external use are capitalized as intangible fi xed assets where the software or site supports a signifi cant business system and the expenditure leads to the creation of a durable asset. Also, the research and development expenditures that are defi nite to yield benefi t to the company are capitalized.
3.4 Leased Assets
In compliance with the IAS 17: Leases, cost of assets acquired under fi nance lease along with related obligation has been accounted for as assets and liabilities respectively of the company, and the interest element has been charged as expenses. Lease payments made under fi nance leases are apportioned between the fi nance expenses and the reduction of the outstanding liability.
3.5 Financial Instruments
A fi nancial instrument is any contract that gives rise to a fi nancial asset of one entity and a fi nancial liability or equity instrument of another entity.
3.5.1 Financial assets
Financial assets of the company include cash and cash equivalents, accounts receivable and other receivables. The company initially recognizes receivable on the date they are originated. All others fi nancial assets are recognized initially on the date at which the company becomes a party to the contractual provisions of the transaction. The company derecognizes a fi nancial asset when, and only when the contractual rights or probabilities of receiving the cash fl ows from the asset expire or it transfer the rights to receive the contractual cash fl ows on the fi nancial asset in a transaction in which substantially all the risk and rewards of ownership of the fi nancial asset are transferred.
3.5.1(a) Accounts Receivable
Accounts receivable are created at original invoice amount less any provisions for doubtful debts. Provisions are made where there is evidence of a risk of non-payment, taking into account aging, previous experience and general economic conditions. When an accounts receivable is determined to be uncollected it is written off, fi rstly against any provision available and then to the profi t and loss account. Subsequent recoveries of amounts previously provided for are credited to the profi t and loss account.
3.5.1(b) Cash and Cash Equivalents
Cash and cash equivalents include cash in hand, in transit and with banks on current and deposit accounts which are held and available for use by the company without any restriction. There is insignifi cant risk of change in value of the same.
3.5.1(c) Investment in Shares
Investment in shares of listed company is valued at a price quoted in the stock exchange at year end. Investment in other shares is valued at cost.
3.5.2 Financial Liability
Financial liabilities are recognized initially on the transaction date at which the company becomes a party to the contractual provisions of the liability. The company derecognizes a fi nancial liability when its contractual obligations are discharged or cancelled or expire.
Finance liabilities include payable for expenses, liability for capital expenditure and other current liabilities.
3.6 Impairment
(a) Financial Assets
Accounts receivable and other receivables are assessed at each reporting date to determine whether there is any objective evidence of impairment. Financial assets are impaired if objective evidence indicates that a loss event has occurred after the initial recognition of the asset and that the loss event had a negative effects on the estimated future cash fl ows of that asset, that can be estimated reliably. Objective evidence that fi nancial assets are impaired can include default or delinquency by a debtor, indications that a debtor or issuer will enter bankruptcy etc.
(b) Non-Financial Assets
An asset is impaired when its carrying amount exceeds its recoverable amount. The company assesses at each reporting date whether there is any indication that an asset may be impaired. If any such indication exists, the company estimates the recoverable amount of the asset. The recoverable amount of an asset is the higher of its fair value less costs to sell and its
8
value in use. Carrying amount of the assets is reduced to its recoverable amount by recognizing an impairment loss if, and only if, the recoverable amount of the asset is less than its carrying amount. Impairment loss is recognized immediately in profi t or loss, unless the asset is carried at revalued amount. Any impairment loss of a revalued asset shall be treated as a revaluation decrease.
3.7 Inventories
Inventories are carried at the lower of cost and net realizable value as prescribed by IAS 2: Inventories. Cost is determined on weighted average cost basis. The cost of inventories comprises of expenditure incurred in the normal course of business in bringing the inventories to their present location and condition. Net realizable value is based on estimated selling price less any further costs expected to be incurred to make the sale.
3.8 Provisions
A provision is recognized in the statement of fi nancial position when the company has a legal or constructive obligation as a result of a past event, it is probable that an outfl ow of economic benefi ts will be required to settle the obligation and a reliable estimate can be made of the amount of the obligation. Provision is ordinarily measured at the best estimate of the expenditure required to settle the present obligation at the date of statement of fi nancial position. Where the effect of time value of money is material, the amount of provision is measured at the present value of the expenditures expected to be required to settle the obligation.
3.9 Income Tax Expense
Income tax expense comprises of current and deferred tax. Income tax expense is recognized in the Statement of Comprehensive Income and accounted for in accordance with the requirements of IAS 12 : Income Tax.
Current Tax
Current tax is the expected tax payable on the taxable income for the year, and any adjustment to tax payable in respect of previous years. The company qualifi es as a “Publicly Traded Company”; hence the applicable Tax Rate is 27.50%.
Deferred Tax
The company has recognized deferred tax using balance sheet method in compliance with the provisions of IAS 12: Income Taxes. The company’s policy of recognition of deferred tax assets/ liabilities is based on temporary differences (Taxable or deductible) between the carrying amount (Book value) of assets and liabilities for fi nancial reporting purpose and its tax base, and accordingly, deferred tax income/expenses has been considered to determine net profi t after tax and earnings per shares (EPS).
A deferred tax asset is recognized to the extent that it is probable that future taxable profi t will be available, against which temporary differences can be utilized. Deferred tax assets are reviewed at each reporting date and reduced to the extent that it is no longer probable that the related tax benefi t will be realized.
3.10 Interest Income
Interest income is recognized on accrual basis.
3.11 Borrowing Cost
Borrowing costs are recognized as expenses in the period in which they are incurred unless capitalization of such is allowed under IAS 23 : Borrowing Costs.
3.12 Employee Benefi ts
The company maintains both defi ned contribution plan and defi ned benefi t plan for its eligible permanent employees. The eligibility is determined according to the terms and conditions set forth in the respective deeds.
The company has accounted for and disclosed employee benefi ts in compliance with the provisions of IAS 19: Employee Benefi ts.
The cost of employee benefi ts is charged off as revenue expenditure in the period to which the contributions relate.
The company’s employee benefi ts include the following:
(a) Defi ned Contribution Plan (Provident Fund)
The company has a registered provident fund scheme (Defi ned Contribution Plan) for employees of the company eligible to be members of the fund in accordance with the rules of the provident fund constituted under an irrevocable trust. All permanent employees contribute 10% of their basic salary to the provident fund and the company also makes equal contribution.
The company recognizes contribution to defi ned contribution plan as an expense when an employee has rendered services in exchange for such contribution. The legal and constructive obligation is limited to the amount it agrees to contribute to the fund.
9

(b) Defi ned Benefi t Plan (Gratuity)
This represents unfunded gratuity scheme for its permanent employees. Employees are entitled to gratuity benefi t after completion of minimum fi ve years of service in the company. The gratuity is calculated on the latest applicable basic pay and is payable at the rate of one month basic pay for every completed year of service.
Though no valuation was done to quantify actuarial liabilities as per the IAS 19 : Employee Benefi ts, such valuation in not likely to yield a result signifi cantly different from the current provision.
(c) Short-term employee benefi ts
Short-term employee benefi ts include salaries, bonuses, leave encashment, etc. Obligations for such benefi ts are measured on an undiscounted basis and are expensed as the related service is provided.
(d) Contribution to Workers’ Profi t Participation and Welfare Funds
This represents 5% of net profi t before tax contributed by the company as per provisions of the Bangladesh Labor (amendment) Act 2013 and is payable to workers as defi ned in the said law.
(e) Insurance Scheme
Employees of the company are covered under insurance schemes.
3.13 Share Premium
The Share Premium shall be utilized in accordance with the provisions of the Companies Act, 1994 and as per direction of the Securities and Exchange Commission in this respect.
3.14 Proposed Dividend
The amount of proposed dividend has not been accounted for but disclosed in the notes to the accounts in accordance with the requirements of International Accounting Standard (IAS) 1: Presentation of Financial Statements. Also, the proposed dividend has not been considered as “Liability” in accordance with the requirements of International Accounting Standard (IAS) 10: Events After The Reporting Period, because no obligation exists at the time of approval of accounts and recommendation of dividend by the Board of Directors.
3.15 Earnings per Share (EPS)
This has been calculated in compliance with the requirements of IAS 33: Earnings Per Share by dividing the basic earnings by the weighted average number of ordinary shares outstanding during the year.
Current Year (2013)
The Bonus Shares issued during the year 2013 were treated as if they always had been in issue. Hence, in computing the Basic EPS of 2013, the total number of shares including the said bonus shares has been considered as the Weighted Average Number of Shares outstanding during the year 2013.
Earlier Year (2012)
The number of shares outstanding before the bonus issue has been adjusted for the proportionate change in the number of shares outstanding as if the bonus issue had occurred at the beginning of the earliest period reported (2012), and accordingly, in calculating the adjusted EPS of 2012, the total number of shares including the subsequent bonus issued in 2013 has been considered as the Weighted Average number of Shares outstanding during the year 2012.
The basis of computation of number of shares as stated above is in line with the provisions of IAS 33: Earning per Share. The logic behind this basis, as stated in the said IAS is that the bonus Shares are issued to the existing shareholders without any consideration, and therefore, the number of shares outstanding is increased without an increase in resources.
Diluted Earnings per Share
No diluted EPS is required to be calculated for the year as there was no scope for dilution during the year under review.
3.16 Foreign Currency Transactions
Foreign currency transactions are recorded at the applicable rates of exchange ruling at the transaction date. The monetary assets and liabilities, if any, denominated in foreign currencies at the fi nancial position date are translated at the applicable rates of exchanges ruling at that date. Exchange differences are charged off as revenue expenditure in compliance with the provisions of IAS 21: The Effects of Changes in Foreign Exchange Rates.
10
17,974,348,272
460,448,056 2,357,835,572
(4,572,208) 20,788,059,692
4,114,780,827 575,639,144
(3,605,130)
4,686,814,841
16,101,244,851
2,263,068,219
18,364,313,070
3.17 Statement of Cash Flows
The Statement of Cash Flow has been prepared in accordance with the requirements of IAS 7: Statement of Cash Flows. The cash generated from operating activities has been reported using the Direct Method as prescribed by the Securities and Exchange Rules, 1987 and as the benchmark treatment of IAS 7, whereby major classes of gross cash receipts and gross cash payments from operating activities are disclosed.
3.18 Events after Reporting Period
Events after the reporting period that provide additional information about the company’s position at the date of Statement of Financial Position or those that indicate that the going concern assumption is not appropriate are refl ected in the fi nancial statements. Events after reporting period that are not adjusting events are disclosed in the notes when material.
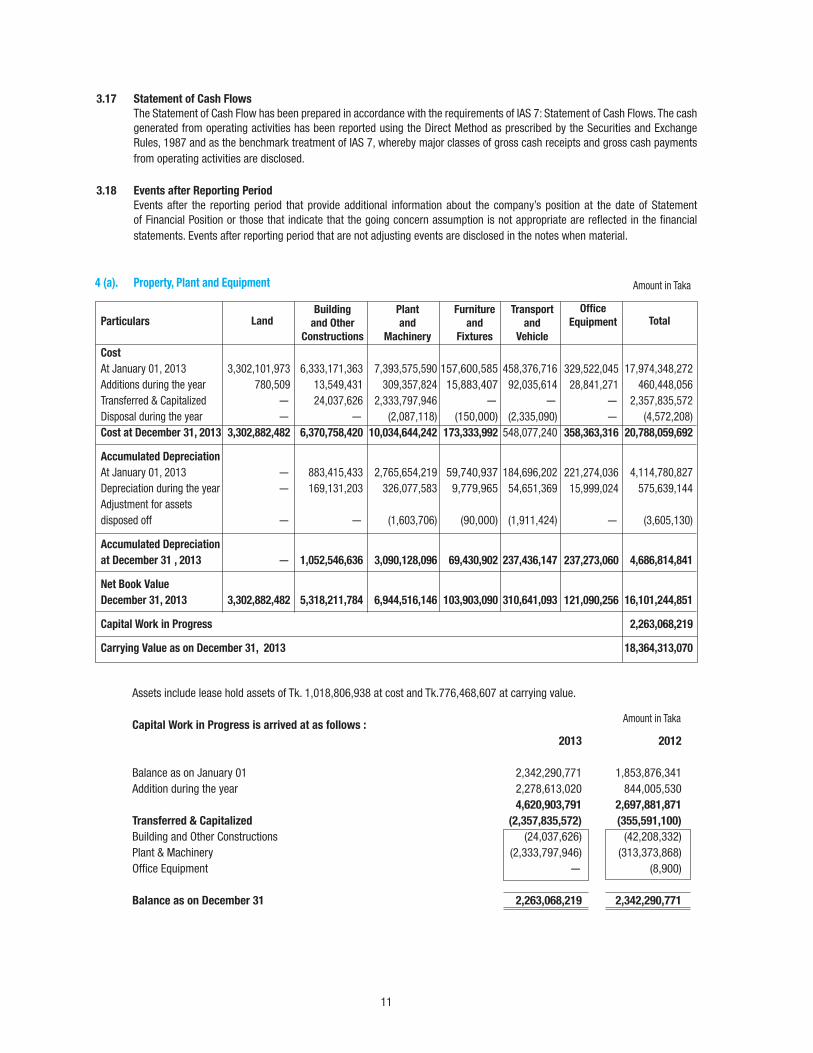
4 (a). Property, Plant and Equipment
Assets include lease hold assets of Tk. 1,018,806,938 at cost and Tk.776,468,607 at carrying value. Capital Work in Progress is arrived at as follows : 2013 2012
Balance as on January 01 2,342,290,771 1,853,876,341Addition during the year 2,278,613,020 844,005,530 4,620,903,791 2,697,881,871
Transferred & Capitalized (2,357,835,572) (355,591,100)
Building and Other Constructions (24,037,626) (42,208,332)Plant & Machinery (2,333,797,946) (313,373,868)Offi ce Equipment - (8,900) Balance as on December 31 2,263,068,219 2,342,290,771
Amount in Taka
Amount in Taka
Particulars LandBuilding
and Other
Constructions
Plant
and
Machinery
Furniture
and
Fixtures
Transport
and
Vehicle
Offi ce
Equipment Total
6,333,171,363 13,549,431 24,037,626
- 6,370,758,420
883,415,433 169,131,203
-
1,052,546,636
5,318,211,784
7,393,575,590
309,357,824 2,333,797,946
(2,087,118) 10,034,644,242
2,765,654,219 326,077,583
(1,603,706)
3,090,128,096
6,944,516,146
3,302,101,973 780,509
-
-
3,302,882,482
-
-
-
-
3,302,882,482
157,600,585
15,883,407-
(150,000) 173,333,992
59,740,937 9,779,965
(90,000)
69,430,902
103,903,090
458,376,716 92,035,614
-(2,335,090)
548,077,240
184,696,202 54,651,369
(1,911,424)
237,436,147
310,641,093
329,522,045 28,841,271
- -
358,363,316
221,274,036 15,999,024
-
237,273,060
121,090,256
Cost
At January 01, 2013Additions during the yearTransferred & CapitalizedDisposal during the yearCost at December 31, 2013
Accumulated Depreciation
At January 01, 2013Depreciation during the yearAdjustment for assetsdisposed off
Accumulated Depreciation
at December 31 , 2013
Net Book Value
December 31, 2013
Capital Work in Progress
Carrying Value as on December 31, 2013
11
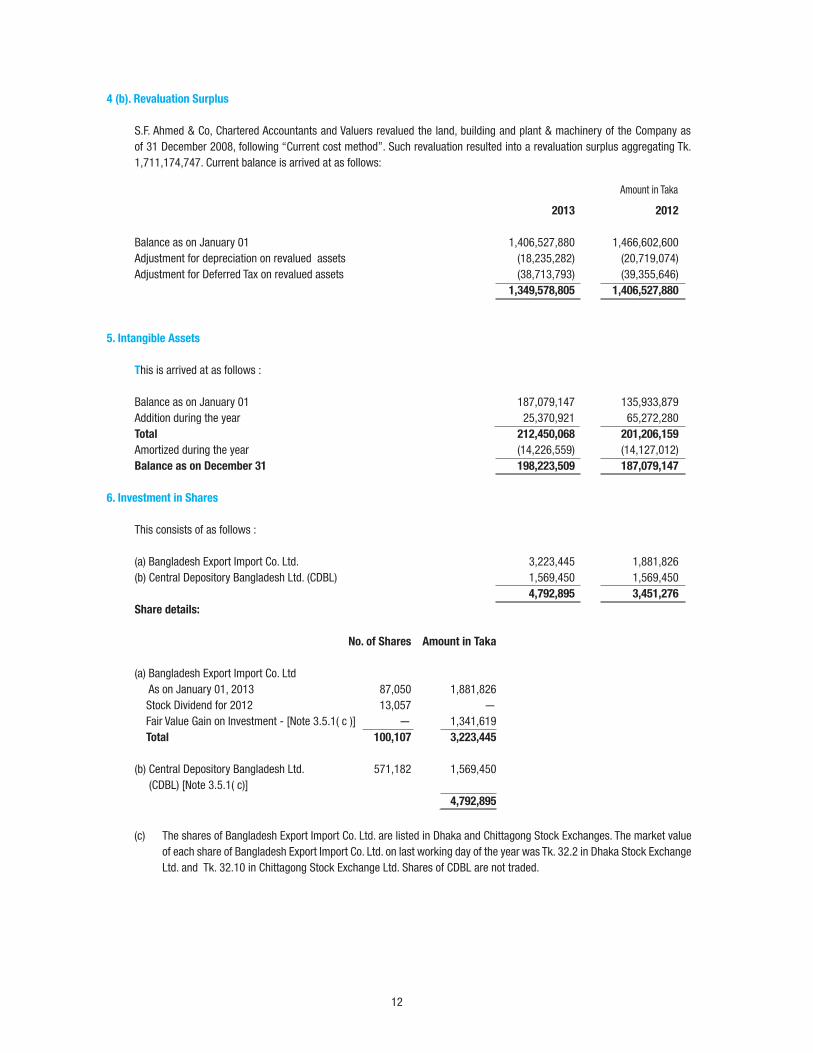
4 (b). Revaluation Surplus
S.F. Ahmed & Co, Chartered Accountants and Valuers revalued the land, building and plant & machinery of the Company as of 31 December 2008, following “Current cost method”. Such revaluation resulted into a revaluation surplus aggregating Tk. 1,711,174,747. Current balance is arrived at as follows:
2013 2012
Balance as on January 01 1,406,527,880 1,466,602,600 Adjustment for depreciation on revalued assets (18,235,282) (20,719,074)Adjustment for Deferred Tax on revalued assets (38,713,793) (39,355,646) 1,349,578,805 1,406,527,880
5. Intangible Assets
This is arrived at as follows : Balance as on January 01 187,079,147 135,933,879 Addition during the year 25,370,921 65,272,280 Total 212,450,068 201,206,159
Amortized during the year (14,226,559) (14,127,012)Balance as on December 31 198,223,509 187,079,147
6. Investment in Shares
This consists of as follows : (a) Bangladesh Export Import Co. Ltd. 3,223,445 1,881,826 (b) Central Depository Bangladesh Ltd. (CDBL) 1,569,450 1,569,450 4,792,895 3,451,276
Share details: No. of Shares Amount in Taka
(a) Bangladesh Export Import Co. Ltd As on January 01, 2013 87,050 1,881,826 Stock Dividend for 2012 13,057 - Fair Value Gain on Investment - [Note 3.5.1( c )] - 1,341,619 Total 100,107 3,223,445
(b) Central Depository Bangladesh Ltd. 571,182 1,569,450 (CDBL) [Note 3.5.1( c)] 4,792,895
Amount in Taka
(c) The shares of Bangladesh Export Import Co. Ltd. are listed in Dhaka and Chittagong Stock Exchanges. The market value of each share of Bangladesh Export Import Co. Ltd. on last working day of the year was Tk. 32.2 in Dhaka Stock Exchange Ltd. and Tk. 32.10 in Chittagong Stock Exchange Ltd. Shares of CDBL are not traded.
12

Amount in Taka
This includes receivable of Tk.158,658,136 equivalent to US$ 2,049,754 (on 31-12-2012 Tk. 138,233,280 equivalent to US$ 1,727,916) against export sales.
This also includes Tk.1,018,513,082 due from I & I Services Ltd., who provides distribution service to the Company and a “Related Party”. The maximum amount due from that company during the year was Tk. 1,051,200,320 on 31-10-2013.
No amount was due from the directors, managing agent, managers and other offi cers of the company and any of them severally or jointly with any other person.
7. Inventories
This consists of as follows : 2013 2012
Finished Goods 644,005,694 629,828,725 Work in Process 204,755,943 246,214,085 Raw Materials 787,194,854 832,312,053 Packing Materials 440,279,801 455,793,262 Laboratory Chemicals 800,984 1,051,434 Physician Samples 92,234,008 65,863,326 Raw & Packing Materials in Transit 242,610,702 202,925,096
2,411,881,986 2,433,987,981
8. Spares & Supplies
This consists of as follows :
Spares & Accessories 318,538,085 286,649,212 Stock of Stationery 9,829,034 5,712,885 Literature & Promotional Materials 104,985,288 103,813,693 433,352,407 396,175,790
9. Accounts Receivable
10. Loans, Advances and Deposits
This is unsecured, considered good and consists of as follows :
Clearing & Forwarding 43,788,956 19,350,585 VAT 224,271,781 215,793,398 Claims Receivable 12,824,382 15,735,731 Security Deposit & Earnest Money 21,814,251 23,151,164 Lease Deposit 18,238,318 15,262,058 Capital Expenditure/ Project 39,234,247 54,725,188 Expenses 85,456,445 57,125,828 Bank Guarantee Margin 39,939,537 869,546 Advance against Salary 51,306,101 64,266,534 Rent Advance 9,692,064 6,573,135 Motor Cycle 156,328,603 132,314,896 Raw & Packing Material 409,577,706 330,283,008 Prepaid Expenses 28,932,441 - Overseas Liaison Offi ce 9,968,983 - Others 35,263,296 29,825,302 1,186,637,111 965,276,373
(a) The maximum amount due from the employees during the year was Tk.63,249,485 on 31-01-2013.
(b) No amount was due from the directors, managing agent, managers and other offi cers of the company and any of them severally or jointly with any other person, except as stated above.
(c) No amount was due from any related party.
13
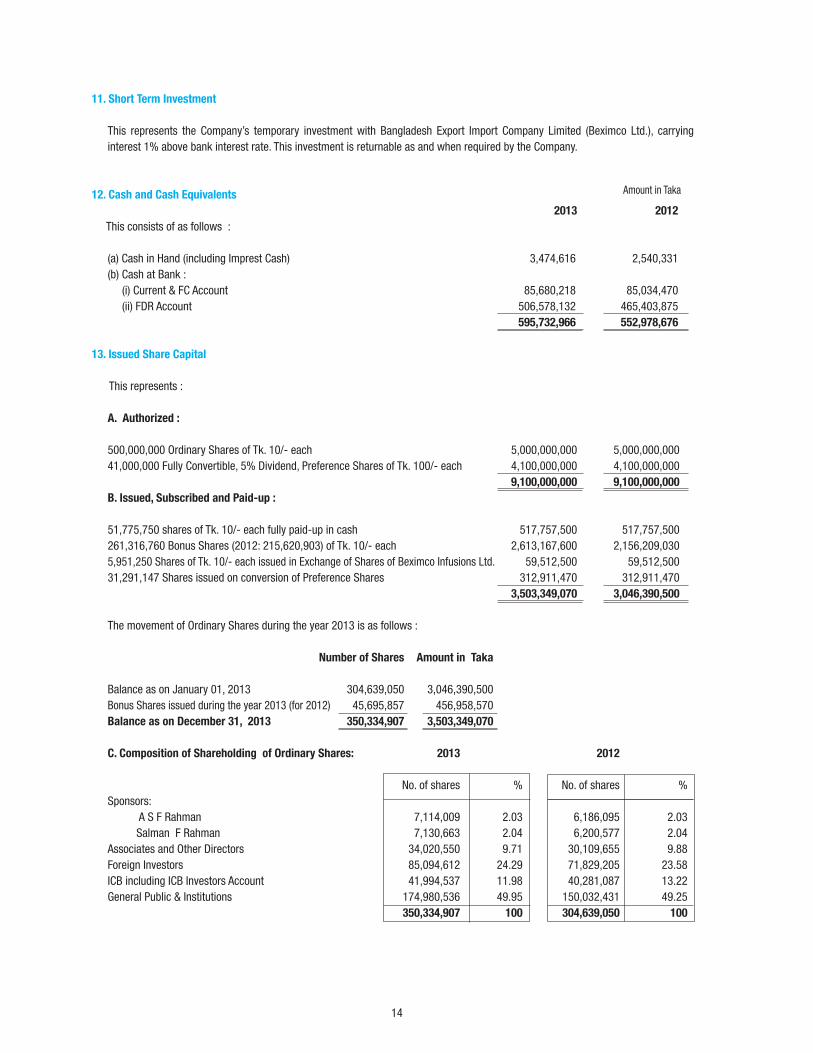
11. Short Term Investment
This represents the Company’s temporary investment with Bangladesh Export Import Company Limited (Beximco Ltd.), carrying interest 1% above bank interest rate. This investment is returnable as and when required by the Company.
12. Cash and Cash Equivalents
2013 2012
This consists of as follows :
(a) Cash in Hand (including Imprest Cash) 3,474,616 2,540,331(b) Cash at Bank : (i) Current & FC Account 85,680,218 85,034,470 (ii) FDR Account 506,578,132 465,403,875 595,732,966 552,978,676
13. Issued Share Capital
This represents :
A. Authorized : 500,000,000 Ordinary Shares of Tk. 10/- each 5,000,000,000 5,000,000,000 41,000,000 Fully Convertible, 5% Dividend, Preference Shares of Tk. 100/- each 4,100,000,000 4,100,000,000 9,100,000,000 9,100,000,000
B. Issued, Subscribed and Paid-up :
51,775,750 shares of Tk. 10/- each fully paid-up in cash 517,757,500 517,757,500261,316,760 Bonus Shares (2012: 215,620,903) of Tk. 10/- each 2,613,167,600 2,156,209,0305,951,250 Shares of Tk. 10/- each issued in Exchange of Shares of Beximco Infusions Ltd. 59,512,500 59,512,50031,291,147 Shares issued on conversion of Preference Shares 312,911,470 312,911,470 3,503,349,070 3,046,390,500
The movement of Ordinary Shares during the year 2013 is as follows : Number of Shares Amount in Taka
Balance as on January 01, 2013 304,639,050 3,046,390,500 Bonus Shares issued during the year 2013 (for 2012) 45,695,857 456,958,570Balance as on December 31, 2013 350,334,907 3,503,349,070
C. Composition of Shareholding of Ordinary Shares: 2013 2012
No. of shares % No. of shares %Sponsors: A S F Rahman 7,114,009 2.03 6,186,095 2.03 Salman F Rahman 7,130,663 2.04 6,200,577 2.04 Associates and Other Directors 34,020,550 9.71 30,109,655 9.88 Foreign Investors 85,094,612 24.29 71,829,205 23.58 ICB including ICB Investors Account 41,994,537 11.98 40,281,087 13.22 General Public & Institutions 174,980,536 49.95 150,032,431 49.25 350,334,907 100 304,639,050 100
Amount in Taka
14

D. Distribution Schedule of Ordinary Shares:
1 to 499 68,939 65,708 74.26% 76.15% 8,836,043 8,097,306 2.52% 2.66%500 to 5,000 21,066 18,277 22.69% 21.18% 29,757,275 24,648,855 8.49% 8.09%5,001 to 10,000 1,509 1,216 1.63% 1.41% 10,448,670 8,417,999 2.98% 2.76%10,001 to 20,000 674 517 0.73% 0.60% 9,334,640 7,136,417 2.67% 2.34%20,001 to 30,000 187 156 0.20% 0.18% 4,535,749 3,837,480 1.29% 1.26%30,001 to 40,000 101 73 0.11% 0.08% 3,520,388 2,525,253 1.01% 0.83%40,001 to 50,000 55 46 0.06% 0.05% 2,457,436 2,042,473 0.70% 0.67%50,001 to 100,000 94 99 0.10% 0.12% 6,548,929 7,089,661 1.87% 2.33%100,001 to 1,000,000 166 159 0.18% 0.18% 49,278,664 47,429,395 14.07% 15.57%Over 1,000,000 40 39 0.04% 0.05% 225,617,113 193,414,211 64.40% 63.49%Total 92,831 86,290 100% 100% 350,334,907 304,639,050 100% 100%
E. Market Price of Ordinary Shares:
The shares are listed with Dhaka, Chittagong and London Stock Exchanges. On the last working day of the year, each share was quoted at Tk. 47.20 (in 2012 Tk.55.90) in Dhaka Stock Exchange Ltd., Tk.47.00 (in 2012 Tk. 55.80) in Chittagong Stock Exchange Ltd., and GBP 0.1375 in London Stock Exchange (in 2012 GBP 0.178).
F. Option on unissued Ordinary shares :
There was no option on unissued shares as on 31-12-2013.
14. Excess of Issue Price over Face Value of GDRs
This represents the issue price of 28,175,750 GDRs at Tk. 2,244,080,670 net off face value of underlying shares against GDRs and GDR issue expenses.
15. Long Term Borrowings - Net off Current Maturity (Secured)
This arrived at as follows : 2013 2012
(a) Project Loan 1,001,325,040 1,336,416,545 (b ) Obligation Under Finance Leases 150,075,662 133,205,066 1,151,400,702 1,469,621,611
(a) Project Loan
This loan was sanctioned under the consortium arrangement of Janata Bank Ltd., Sonali Bank Ltd., Agrani Bank Ltd., Rupali Bank Ltd. and United Commercial Bank Ltd. for the US FDA standard oral solid dosage facility of the company. Janata Bank Ltd. is the lead bank to the consortium.
This Loan is secured against : (i) First (registered mortgage) charge on paripassu basis with the participating banks on 1,113 decimals of land at Kathaldia,
Aushpara, Tongi of Gazipur along with the building and other constructions thereon ; and
(ii) First paripassu charge by way of hypothecation on all assets of the company both present and future. (iii) This Loan, carrying interest at 13.00% to 15.50% per annum, is repayable in quarterly installments ending by 2017.
Amount in Taka
Range of Holdings
In number of shares
No. of Shareholders
2013 2013 2013 20132012 2012 2012 2012
Number of Shares% of Shareholders % of Share Capital
15

Amount in Taka
16. Liability for Gratuity and WPPF & Welfare Funds
Liability for gratuity is the amount payable to the permanent employees at the time of separation from the company. The liability for WPPF refers to the undistributed portion of Workers Profi t Participation and Welfare Fund lying with the company.
(a) Gratuity Payable
2013 2012
Balance as on January 01 223,962,507 187,501,076 Provisions during the year 68,652,000 49,207,664 292,614,507 236,708,740
Paid during the year (8,450,838) (12,746,233) 284,163,669 223,962,507
(b) Workers Profi t Participation and Welfare Fund 326,464,481 275,660,277 610,628,150 499,622,784
17. Deferred Tax Liability
This arrived at as follows :
Balance as on January 01 1,147,459,569 963,376,922 Addition during the year: Deferred Tax on Assets (cost basis)-Note : 32 364,415,845 144,727,001 Deferred Tax on revalued amount 38,713,793 39,355,646 1,550,589,207 1,147,459,569
18. Short Term Borrowings (Secured)
This consists of :
Janata Bank Ltd. -Cash Credit-Hypothecation Loan 1,219,126,718 1,526,449,918 AB Bank, Principal Branch - Overdraft 775,639,407 - Noor Islamic Bank, Dubai - Commodity Murabaha Facility * 781,500,000 - 2,776,266,125 1,526,449,918
* This represents US$ 10 million Commodity Murabaha Facility bearing interest @ 6 month’s LIBOR + 4.5% and repayable by September, 2014.
19. Long Term Borrowings-Current Maturity (Secured)
This consists of as follows and is payable within next twelve months from the Balance Sheet date :
Project Loan 652,689,720 568,588,942 Interest & PAD Block - 3,792,100 Obligation under Finance Leases 102,213,838 92,331,686
754,903,558 664,712,728
20. Creditors and Other Payables
This consists of :
Goods & Services 123,397,754 140,659,520 Provident Fund 254,356,090 323,432,697 Advance Against Export 915,874 472,333 Others 4,500,835 5,533,135
383,170,553 470,097,685
21. Accrued Expenses
This is unsecured, falling due within one year and consists of as follows :
For Expenses 38,282,595 33,107,499 Workers’ Profi t Participation and Welfare Funds - current year’s expense 103,299,709 95,491,462(net off interim payments)
141,582,304 128,598,961
16

Amount in Taka
22. Income Tax Payable
This is arrived at as follows : 2013 2012
Balance on January 01 274,064,529 15,482,294 Provision for the year 305,845,595 334,871,966 Short Provision for previous years 18,569,951 110,840,941 598,480,075 461,195,201
AIT & Treasury deposits during the year (272,794,704) (187,130,672) 325,685,371 274,064,529
23. Net Sales Revenue
This consists of as follows : Local Sales 9,819,409,651 8,818,999,143 Export Sales US$ 8,614,393 (in 2012 US$ 5,791,113) 671,289,443 470,116,141 10,490,699,094 9,289,115,284
Sales represents:
Quantity
Product Category Unit 2013 2012 Tablet, Capsule, Suppository & DPI Million pcs. 3,173.13 2,981.40 Liquid, Cream and Ointment, Suspension, IV Fluid, Amino Acid, Ophthalmic, Nebulizer Solution, Injectable and Inhaler Million pcs. 66.75 63.05 Active Pharmaceutical Ingredients Kg 170,516 158,852 Liquid Nitrogen Liter 387,153 236,597
24. Cost of Goods Sold
This is made-up as follows :
Work-in-Process (Opening) 246,214,085 169,345,787 Materials Consumed (Note: 25) 4,257,643,464 3,831,308,573 Factory Overhead (Note: 26) 1,493,080,956 1,269,375,857 Total Manufacturing Cost 5,996,938,505 5,270,030,217
Work-in-Process (Closing) (204,755,943) (246,214,085)Cost of Goods Manufactured 5,792,182,562 5,023,816,132
Finished Goods (Opening) 629,828,725 639,241,751 Finished Goods available 6,422,011,287 5,663,057,883
Cost of Physician Sample transferred to Sample Stock (126,106,715) (133,515,301)Finished Goods (Closing) (644,005,694) (629,828,725) 5,651,898,878 4,899,713,857
17

Amount in Taka
Item wise quantity and value of Finished Goods Stock are as follows : Stock as January 01, 2013 Unit Quantity Value (Tk.)
Tablet, Capsule, Suppository & DPI Million pcs. 527.72 424,313,622 Liquid, Cream and Ointment, Suspension, IV Fluid, Amino Acid, Ophthalmic, Nebulizer Solution, Injectable and Inhaler Million pcs. 6.35 200,971,815 Active Pharmaceutical Ingredients Kg 1,546 4,543,288 629,828,725
Stock as December 31, 2013
Tablet, Capsule, Suppository & DPI Million pcs. 518.83 394,979,619 Liquid, Cream and Ointment, Suspension, IV Fluid, Amino Acid, Ophthalmic, Nebulizer Solution, Injectable and Inhaler Million pcs. 6.69 243,292,676 Active Pharmaceutical Ingredients Kg 1,867 5,733,399
644,005,694
25. Materials Consumed
2013 2012
This is made-up as follows :
Opening Stock 1,289,156,749 1,316,611,230 Purchase 4,196,762,354 3,803,854,092 Closing Stock (1,228,275,639) (1,289,156,749) 4,257,643,464 3,831,308,573
26. Factory Overhead
This consists of as follows :
Salary & Allowances 451,123,633 372,287,293 Repairs and Maintenance 91,719,472 81,645,875 Insurance Premium 15,542,159 22,173,473 Municipal Tax & Land Revenue 1,582,778 1,817,215 Advertisement 23,570 74,850 Registration & Renewal 10,397,369 19,997,450 Travelling & Conveyance 4,627,240 3,253,966 Entertainment 937,973 872,098 Research and Development 136,216,539 31,065,735 Printing & Stationery 12,171,521 12,280,051 Telephone, Internet & Postage 4,736,650 4,038,923 Toll Expense / (Income) - Net 127,098,536 86,795,076 Electricity, Gas & Water 65,589,318 60,986,526 Training & Conference 4,940,526 4,162,341 Plant Certifi cation and Regulatory Approvals 38,338,641 41,286,575 Depreciation 520,953,425 520,837,622 Other Expenses 7,081,606 5,800,788
1,493,080,956 1,269,375,857
(a) Salary and allowances include Company’s Contribution to provident fund of Tk. 8,531,034 (in 2012 Tk. 8,002,823).
(b) The value of imported stores and spares consumed is Tk. 53,993,111 which is included in repairs & maintenance expense. This also includes maintenance of offi ce, premises, vehicles, building, machinery, equipment and other infrastructures.
(c) Other Expenses does not include any item exceeding 1% of total revenue.
18

Amount in Taka27. Administrative Expenses
This consists of as follows : 2013 2012 Salary & Allowances 177,266,156 154,929,932 Rent 9,879,000 9,667,400 Repairs and Maintenance 28,111,235 24,581,182 Registration & Renewals 7,262,546 2,680,277 Travelling & Conveyance 18,280,955 18,055,645 Entertainment 3,749,384 4,198,442 Printing & Stationery 2,926,769 2,222,786 Audit Fee 1,200,000 1,000,000 Telephone, Internet & Postage 4,682,370 4,405,177 Electricity, Gas & Water 10,715,700 10,182,415 Legal & Consultancy 13,779,574 7,720,328 AGM, Company Secretarial and Regulatory Expense 41,284,006 44,985,864 Advertisement 19,126 100,000 Training & Conference 6,590,078 5,938,817 Depreciation 20,147,370 20,142,891 Remuneration to Independent Directors 140,000 - Other Expenses 29,531,643 21,414,191
375,565,912 332,225,347
(a) Salary and allowances include provident fund contribution of Tk.4,899,089 (in 2012 Tk. 4,238,310). (b) Repairs and maintenance includes maintenance of offi ce, premises, vehicles, building, equipment and other infrastructures. (C) Remuneration is paid to the Independent Directors for attending Board, Audit Committee and Other Meetings.
28. Selling, Marketing and Distribution Expenses
This consists of as follows : Salary & Allowances 699,256,429 599,784,362 Rent 22,457,790 19,488,948 Repairs and Maintenance 5,559,593 4,618,564 Travelling & Conveyance 293,119,372 260,081,060 Entertainment 21,939,089 20,875,724 Printing & Stationery 26,237,688 22,265,791 Telephone, Internet & Postage 8,985,010 8,854,384 Electricity, Gas & Water 6,191,556 5,888,612 Market Research & New Products 27,872,397 24,876,321 Training & Conference 53,463,511 48,331,042 Insurance Premium 17,460,874 18,280,838 Sample 144,655,691 119,778,787 Promotional Expenses 303,056,182 268,478,952 Literature/News Letter 84,480,104 78,266,167 Registration & Renewals 32,613,811 6,879,929 Export Insurance, Freight and C&F Expenses 60,743,782 36,329,864 Delivery Expense 266,173,800 240,216,876 Depreciation & Amortization 48,764,908 48,657,683 Other Expenses 15,929,947 17,342,616 2,138,961,534 1,849,296,520
(a) Salary and allowances include provident fund contribution of Tk. 15,749,142 (in 2012 Tk. 12,805,617).(b) Delivery expense includes distribution service fee for local sales of Formulation and IV Fluid products paid to I & I Services
Ltd., a “Related Party”. (c) Repairs and maintenance includes maintenance of offi ce, premises, vehicles, building, equipment and other infrastructures.
19

Amount in Taka29. Other Income
This is arrived at as follows : 2013 2012
Interest on FDR & Short term Investment 512,424,678 437,201,038 Dividend Income 3,141,501 456,945 Royalty 7,785,736 3,499,537 Exchange Rate Fluctuation Gain / (Loss)* (17,198,454) (1,055,025)Profi t on Sale of Fixed Assets (Note 35) 4,434,739 2,745,218 510,588,200 442,847,713
* This includes loss of Tk. 10,500,000 arising from conversion of foreign currency loan at prevailing exchange rate on the date of Statement of Financial Position.
30. Finance Cost
This is arrived at as follows : Interest on Working Capital Loan 256,763,094 252,076,640 Interest on Project / Consortium Loan 219,205,840 235,182,666 Interest on Lease Finance 51,362,542 48,268,802 Interest on Loan from PF, WPPF & Welfare Fund 81,687,639 77,425,824Other Bank Charges 27,567,975 32,452,643 636,587,090 645,406,575
31. Contribution To WPPF & Welfare Funds
This represents statutory contribution by the company as per Bangladesh Labour (amendment) Act 2013. The amount is computed @ 5% of net profi t before tax (but after charging such contribution).
32. Income Tax Expenses
This consists of as follows : (a) Current Tax : (i) Tax provision for current year (Note 3.9) 305,845,595 334,871,966 (ii) Short provision for earlier year 18,569,951 110,840,941 324,415,546 445,712,907
(b) Deferred Tax Expense (Note 3.9) 364,415,845 144,727,001
688,831,391 590,439,908
33. Earnings Per Share (EPS)
(a) Earnings attributable to the Ordinary Shareholders Tk. 1,404,762,780 1,319,389,328 (b) Weighted average number of Ordinary Shares outstanding during the year Nos. 350,334,907 350,334,907 Earnings Per Share (EPS) / Adjusted EPS (2012) Tk. 4.01 3.77
20

34. Related Party Disclosures
Following transactions were carried out with related parties in the normal course of business on arms length basis: Name of Related Parties Nature of Transactions Value of Balance at
Transaction in 2013 year end (a) I & I Services Ltd. Local Delivery 10,777,493,691 Distribution Service Fee 172,137,233 (b) Bangladesh Export Import Co. Ltd. Short Term Investment & Interest there on 460,034,835 3,026,383,161 The Companies are subject to common control from same source.
35. Particulars of Disposal of Property, Plant and Equipment The following assets were disposed off during the year ended 31 December 2013:
36. Payment / Perquisites to Managers and Directors
(a) The aggregate amounts paid to/ provided for the Managers and Directors of the company is disclosed below : 2013 2012
Remuneration 129,950,600 113,343,480 Gratuity 5,088,500 4,393,600 Contribution to Provident Fund 6,106,200 5,175,720 Bonus 10,177,000 8,787,200 Medical 3,303,706 3,229,995 Others 29,345,360 28,736,153 Total 183,971,366 163,666,148
(b) The above includes salary, allowances and perquisites amounting to Tk. 13,818,434 paid to the Managing Director. This also includes Tk. 140,000 paid to the Independent Directors for attending Board, Audit Committee and other meetings.(c) Excepting as stated in (b) above, no board meetting fee was paid to any Directors of the Company. (d) No amount of money was expended by the company for compensating any member of the board for special services rendered.
37. Production Capacity and Utilization
Amount in Taka
Particulars of Assets
Plant and MachineryFurnitureTransport & Vehicle Tk.
Cost
2,087,118 150,000
2,335,090 4,572,208
Accumulated
Depreciation
1,603,706 90,000
1,911,424 3,605,130
Written Down
Value 483,412
60,000 423,666 967,078
Sales Price
2,505,937 60,000
2,835,880 5,401,817
Profi t /
(Loss)
2,022,525 -
2,412,214 4,434,739
Mode of
Disposal
NegotiationNegotiationNegotiation
Name of Parties
Various Individuals Various Individuals Various Individuals
Item
Tablet, Capsule, Suppository & DPI Liquid, Cream and Ointment, Suspension, IV Fluid, Amino Acid, Ophthalmic, Nebulizer Solution, Injectable and Inhaler
Unit
Million Pcs
Million Pcs
2013
3,973.90
87.62
2012
3,890.93
86.90
2013
3,287.61
68.88
2013
82.73%
78.61%
2012
3,096.81
60.75
2012
79.59%
69.91%
Production Capacity Actual Production Capacity Utilization
Production does not include goods manufactured under contract manufacturing arragement from third partys’ manufacturing sites.
1,018,513,082
21

38. Capital Expenditure Commitment
There was no capital expenditure contracted but not incurred or provided for at 31-12-2013.
39. Finance Lease Commitment
At 31 December 2013, the company had annual commitment under fi nance leases as set out below : Leases expiring within 1 year 102,213,838 Leases expiring within 2-5 years (inclusive) 150,075,662 Tk. 252,289,500
40. Claim not Acknowledged as Debt
There was no claim against the company not acknowledged as debt as on 31-12-2013.
41. Un-availed Credit Facilities
There is no credit facilities available to the company under any contract, not availed of as on 31-12-2013 other than trade credit available in the ordinary course of business.
42. Payments Made in Foreign Currency :
Foreign Currency (Equivalent US$) Taka Import of Machinery, Equipments & Spares 4,710,544 368,364,542 Import of Raw & Packing Material 32,923,653 2,618,088,893 Regulatory Fees & Other Expenses 3,254,024 253,501,312 No other expenses including royalty, technical expert and professional advisory fee, interest, etc. was incurred or paid in foreign currencies except as stated above.
43. Foreign Exchange Earned / Received :
(a) Collection from Export Sales of US$ 8,288,577. (b) Commodity Murabaha Facility of US$ 10 million received from Noor Islamic Bank, Dubai.
44. Commission / Brokerage to selling agent :
No commission was incurred or paid to any sales agent nor any brokerage or discount other than conventional trade discount was incurred or paid against sales.
45. Contingent Liability
The company has a contingent liability aggregating Tk. 101,289,446 against disputed income tax claims for the year 1999, 2007, 2008 and 2010. The company has fi led Income Tax Reference cases with the High Court Division of the Supreme Court against these claims. There is also a disputed VAT claim aggregating Tk. 144,113,691 against the company. The Company own the verdict of the Appellate Tribunal in it’s favour. The concerned authority fi led appeal to the honorable High Court against this verdict. Additionally, there are claims of custom duty aggregating Tk. 22,507,358 against the indemnity bond issued by the company in connection with import of certain plant and machinery. The company has fi led writ petitions against these claims. If any liability arises on disposal of the cases, the company shall provide for such liability in the year of fi nal disposal.
22
46. Events after The Reporting Period
The directors recommended 10% Cash Dividend (i.e. Tk. 1 per share) and 5% Stock Dividend (i.e. 5 shares for every 100 shares held) for the year 2013.The dividend proposal is subject to shareholders’ approval in the forthcoming annual general meeting. Excepting to that, no circumstances have arisen since the date of Statement of Financial Position which would require adjustment to, or disclosure in, the fi nancial statements or notes thereto.
47. Financial Risk Management
The management of company has overall responsibility for the establishment and oversight of the company’s risk management framework. Risk management policies, procedures and systems are reviewed regularly to refl ect changes in market conditions and the company’s activities. The company has exposure to the following risks for its use of fi nancial instruments.
-Credit risk -Liquidity risk -Market risk
47.01 Credit Risk
Credit risk is the risk of a fi nancial loss to the company if a customer or counterparty to a fi nancial instrument fails to meet its contractual obligations and arises principally from the company’s receivables. Management has a credit policy in place and exposure to credit risk is monitored on an ongoing basis. As at 31 December 2013 substantial part of the receivables are those from its related company and subject to insignifi cant credit risk. Risk exposures from other fi nancial assets. i.e. Cash at bank and other external receivables are nominal.
47.02 Liquidity Risk
Liquidity risk is the risk that the company will not be able to meet its fi nancial obligations as they fall due. The company’s approach to managing liquidity ( cash and cash equivalents) is to ensure as far as possible, that it will always have suffi cient liquidity to meet its liabilities when due under both normal and stressed conditions without incurring unacceptable losses or risking damage to the company’s reputation. Typically, the company ensures that it has suffi cient cash and cash equivalent to meet expected operational expenses including fi nancial obligations through preparation of the cash fl ow forecast with due consideration of time line of payment of the fi nancial obligation and accordingly arrange for suffi cient liquidity/fund to make the expected payment within due date. In extreme stressed conditions the company may get support from the related company in the form of short term fi nancing.
47.03 Market Risk
Market risk is the risk that any change in market prices such as foreign exchange rates and interest will affect the company’s income or the value of its holdings fi nancial instruments. The objective of market risk management is to manage and control market risk exposures within acceptable parameters.
(a) Currency risk The company is exposed to currency risk on certain revenues and purchases such as revenue from foreign customers and import of raw material, machineries and equipment. Majority of the company’s foreign currency transactions are denominated in USD and relate to procurement of raw materials, machineries and equipment from abroad. The company have received foreign currency loan which shall be repaid in foreign currency.
(b) Interest rate risk Interest rate risk is the risk that arises due to changes in interest rates on borrowing. The foreign currency loan is subject to fl oating rates of interest. Local loans are, however, not signifi cantly affected by fl uctuations in interest rates. The company has not entered into any type of derivative instrument in order to hedge interest rate risk as at the reporting date.
Dhaka 29 April 2014
Salman F Rahman
Vice ChairmanNazmul Hassan
Managing DirectorAli Nawaz
Chief Financial Offi cer
23