Audit fees and capital structure decision - ترجمه...
36
0 Audit fees and capital structure decision Anmol Bhatia Department of Economics and Finance, La Trobe Business School, La Trobe University, Australia Muhammad Jahangir Ali Department of Accounting, La Trobe Business School, La Trobe University, Australia Balasingham Balachandran* Department of Economics and Finance, La Trobe Business School, La Trobe University, Australia Doureige Jurdi Department of Economics and Finance, La Trobe Business School, La Trobe University, Australia 5 Feb 2015 *Corresponding author: Professor Balasingham Balachandran, Department of Economics and Finance, La Trobe Business School, La Trobe University, Australia. Telephone (+ 613) 9479 3103; Email: [email protected] We appreciate the helpful comments and suggestions from the participants of Department of Finance seminar, La Trobe University. Any remaining errors are ours.
Transcript of Audit fees and capital structure decision - ترجمه...
0
Audit fees and capital structure decision
Anmol Bhatia
Department of Economics and Finance, La Trobe Business School, La Trobe University, Australia
Muhammad Jahangir Ali
Department of Accounting, La Trobe Business School, La Trobe University, Australia
Balasingham Balachandran*
Department of Economics and Finance, La Trobe Business School, La Trobe University, Australia
Doureige Jurdi
Department of Economics and Finance, La Trobe Business School, La Trobe University, Australia
5 Feb 2015
*Corresponding author:
Professor Balasingham Balachandran,
Department of Economics and Finance, La Trobe Business School,
La Trobe University, Australia.
Telephone (+ 613) 9479 3103;
Email: [email protected]
We appreciate the helpful comments and suggestions from the participants of Department of
Finance seminar, La Trobe University. Any remaining errors are ours.

1
Audit fees and capital structure decision
Abstract
Prior studies in the US have examined the impact of Big 6 auditors on financing decision and find
that firms engaged with Big 6 auditors tend to issue equity as opposed to debt. Using a broad US
sample, this study examines the impact of audit fees on capital structure decision. We use audit fees
as a proxy for audit quality. Our results show that firms with higher audit fees tend to have higher
leverage. We further find that firms paying high audit fees are more inclined to issue debt. As a
robustness check we also use expected audit fees as a proxy for audit quality and find consistent
results. These findings suggest that the impact of audit fees has significant effect on capital structure
decision.
Keywords: audit quality; capital structure; Big 6 auditors; audit fee
JEL classifications G14, G32

2
Audit fees and capital structure decision
1. Introduction
The theoretical literature has long recognised that agency conflicts can affect companies financing
decisions. Jensen and Meckling (1976) argue that managers favour the interests of stockholders and
transfer wealth away from debt holders. To remove conflicts between owners–managers and
owners–debt-holders (agency conflicts), client firms demand audit quality (Jenson and Meckling,
1976). They also report that an independent audit is expected to lend credibility to financial
statements. Mansi, Maxwell and Miller (2004) document that the potential conflicts of interests
among owners, managers, and other security holders create an environment in which an outside
auditor may contribute significant value to investors. Generally that bigger, more esteemed audit
firms have greater incentives to execute a high-quality audit at a high-quality audit pricing. Beatty
(1989) finds that the higher than expected audit fees have been used to indicate greater audit quality
supplied through greater auditor effort. They also find that firms are willing to pay higher audit
charges for higher audit quality. Carcello, Harmanson, Neal and Riley (2002) contend that in the
case where firms demand higher audit assurance, audit fees will be higher because more work is
required. Stanley and DeZoort (2007) also report that the higher audit fees are associated with
improved audit quality.
By focusing on audit fees we provide new empirical evidence and further insights regarding
the existing theory of capital structure decision. Chang, Dasgupta and Hilary (2009) document that
the companies audited by Big 6 firms (compared to those audited by small audit firms) are more
likely to issue equity as opposed to debt. Reichelt and Wang (2010) document that auditors with
industry expertise appear to charge higher audit fees, implying that they produce higher audit
quality. Surprisingly, the impact of audit fees on capital structure is limited with the exception of
Chang, Dasgupta and Hilary (2009). Since more than 75% of the US companies are engaged with

3
high quality auditors, further research is warranted in examining the audit quality using another
proxy for audit quality measure. This motivates us to examine how capital structure decision is
influenced by audit fees.
De Angelo (1981) classifies audit quality by two-dimensional description: first, detecting
misstatements and errors in financial statement and second, reporting these material misstatements
and errors. According to De Angelo’s (1981) explanation, audit quality is a role of the auditor’s
ability to detect material misstatements (technical capabilities) and reporting the errors (auditor
independence). Previous studies (see for example Francis, Reichelt, and Wang, (2005), Choi et al.,
(2008), Mitra, Deis and Hossain, 2009)), use audit fee as a key measure of audit quality. Willenborg
(1999) states that it is widely perceived that bigger, more esteemed firms have greater incentives not
to execute a low-quality audit at higher audit fees. In line with previous studies we employ audit fee
as a proxy for audit quality to examine the impact on capital structure design. Myers and Majluf
(1984) explain how adverse selection can lead companies to refuse to issue equity and forgo
profitable projects. Chang et al. (2009) argue that a firm’s financial statements play a key role in
reducing this asymmetry, and their integrity is essential to well-functioning capital markets. But
audit firms may not offer same level of audit service with same audit fee. Pervious literature
documents that big audit firms are generally offer a higher level of audit quality associated with
higher audit charges. This higher audit charges implies audit quality should reduce the agency
conflicts between managers and outsiders and thus affect a firm’s capital structure decision. Further,
Watts and Zimmerman (1981) contend that large audit firms supply a higher quality audit because
of greater monitoring ability. Knechel, Krishnan, Pevzner, Shefchik and Velury (2013) argue that
society will consider a high-quality audit to be one that avoids economic problems for a company or
the market. Skinner and Srinivasan (2012) show that the high quality firms employ high quality
audit firms. Generally, audit firm size (quality audit) significantly plays a key role to decide the
audit fee premium. Causholli and Knechel (2012) also find that the firms which hire top audit firms
can enjoy lower costs of equity financing. Chang et al. (2009) argue that auditor quality is quite
4
critical to the success of corporate financing decisions as auditors play an important role in assuring
the integrity of financial statements and reducing information asymmetry. They show that
companies audited by big 6 auditors are able to make large equity issues which results in low debt
in the capital structure. However, there is a scarcity of research of the impact of audit fees on the
design of capital structure.
This paper builds on this research gap and aims to shed more light on audit fees by
analysing capital structure decision taking into consideration one of the main determinant of capital
structure i.e. agency conflicts. This study contributes to the literature in several ways. First, no
studies have examined the impact of audit fees on capital structure decision. Second, our study
provides new evidence whether audit fees are associated with the agency conflicts. Third, the
finding of our study will help regulators, market participants and academics in developing the
understanding in establishing the link between capital structure decision and audit fees.
The remainder of the paper is structured as follows: Section 2 focuses on prior research and
hypotheses development. Section 3 outlines the basic elements of the research design while Section
4 discusses the main findings on the impact of audit fees on capital structure decision. Section 5
concludes the paper.
2. Prior research and hypotheses development
The debate on capital structure is ongoing in corporate finance literature since the work of
irrelevance theory of Modigliani and Miller (1958). Several theories have been developed to explain
the determinants of capital structure over the last five decades: Trade-off theory (see for example,
Kraus and Litzenberger, 1973, Haugen and Senbet, 1988, DeAngelo and Masulis, 1980); Pecking
order theory (see for example, Myers 1984 and Myers and Majluf 1984), Agency theory (see for
example, Jensen and Meckling, 1976; Jenson 1986; Stulz 1990) and Market timing theory (see for

5
example, Hovakimian, Olper and Titman, 2001; Baker and Wurgler, 2002; Welch, 2004; Alti, 2006;
Flannery and Rangan, 2006; Kayhan and Titman, 2007).
The “trade-off theory of capital structure assumes the existence of a target debt ratio where
the marginal cost of an additional unit of debt; i.e., the cost of financial distress, equal the marginal
benefits of an additional unit of debt. In other words capital structure is determined by a trade-off
between the benefits of debt and costs of debt. The “pecking order theory” of capital structure
assumes that firms prefer to finance growth opportunities with internal funds, debt, preferred equity
and common equity, in that order. The “agency theory” predicts that managers favour the interests
of stockholders and transfer wealth away from debt holders (see for example Jenson and Mackling,
(1976). Jensen (1986) argues that debt is a governance device useful in reducing the conflicts
between owners–managers and owners–debt-holders (agency conflicts). The “market-timing
theory” suggests that equity market timing is an important aspect of corporate financial decision-
making. This involves the exercise of issuing equity at a high price and repurchasing equity at a low
price. Several authors have proposed further determinants of capital structure decisions: signalling
aspects (Ross, 1977; Brealey, Leland and Pyle, 1977), risk aversion (Fama 1980) and firm history
(Kayhan and Titman 2007).
In this paper we focus on one of the major determinant of capital structure decision i.e.
agency costs (Jenson and Meckling 1976, Easterbrook 1984 and Jenson 1986). Based on (Jenson
and Meckling, 1976) assumption that debt is helpful in reducing agency conflicts which exists
between managers and shareholders and Mansi, Maxwell and Miller (2004) assumption that the
potential conflicts of interests among owners, managers, and other security holders create an
environment in which an outside auditor may contribute significant value to investors, we would
expect that high audit fees paying firms are more leveraged firms and more inclined to issue debt.

6
2.1 Hypotheses development
As pointed out in our discussion there are many theories to explain capital structure decisions.
Among the multitude of explanations, we follow one strand of literature that seems to be especially
promising in the context of audit fees: agency theory. Building on earlier work by Fama and Miller
(1972), Jenson and Meckling (1976) were the first to argue that agency conflicts between managers
and shareholders are related to capital structure decisions. The agency conflicts framework is a
popular and insightful approach to gauge the relative importance to determine the capital structure.
Agency conflicts refer to conflicts between managers and shareholders (see for example, Jenson and
Meckling, 1976). They argue that agency theory’s main purpose is to design alternative governance
structures to mitigate the agency conflicts arising from the possible divergence of interests between
shareholders (principal) and managers (agents). Jenson (1986) contends that too much equity can
lead to free cash flow and conflicts of interest between managers and shareholders. Harris and
Raviv (1990) demonstrate that debt mitigates the problem between investors and managers by
giving investors the option to force liquidation if cash flows are poor. The free-cash-flow
hypothesis of Jenson (1986) emphasizes the disciplinary role of debt as one effective way to reduce
such agency conflicts. These control effects of debt are a potential determinant of capital structure
(Jenson, 1986, p. 324). They also argue that client firms demand audit to remove conflicts between
owners-managers and owners- shareholders.
In determining the capital structure, within an agency conflicts approach, phenomena such
as audit fees proxy will be the important explanatory variable to mitigate the conflicts between
managers and shareholders by issuing debt which means that audit pricing has positive influence on
capital structure decision. Given the role of audit fees in improving agency conflicts, the following
hypotheses are formulated:
H1: Firms with higher audit fees are high leverage firms (less equity oriented firms).
H2: Firms with higher audit fees are more inclined to issue debt instead of equity.
ecup 2227010
Highlight

7
3. Research design
In this section we describe the sample selection procedure and distribution of sample, and variable
definition.
3.1 Data and sample
Our primary source of data constitutes of US Public companies listed on NYSE/ASX during the
period 2001-2012. Initially, we employ COMPUSTAT database to obtain a raw sample of 134,263
observations. In line with Chang et al. (2009), we drop 38,286 observations as these firm
observations are in financial, insurance and real estate industries groups and their capital structures
are also likely to be significantly different from this study’s scope. We further exclude 4,866
observations from regulated utility firms as their financial policies are governed by regulatory
requirements. We also exclude firms without reported total assets and firms which have total assets
less than $5 million. We further exclude firms without audit fees data. The final sample consists of
39,896 firm years. Details of sample exclusions are provided in Table 1. Our sample compares more
favourably with previous studies (see, e.g., Frank and Goyal (2009); Chang et al. 2009).
[INSERT TABLE 1 HERE]
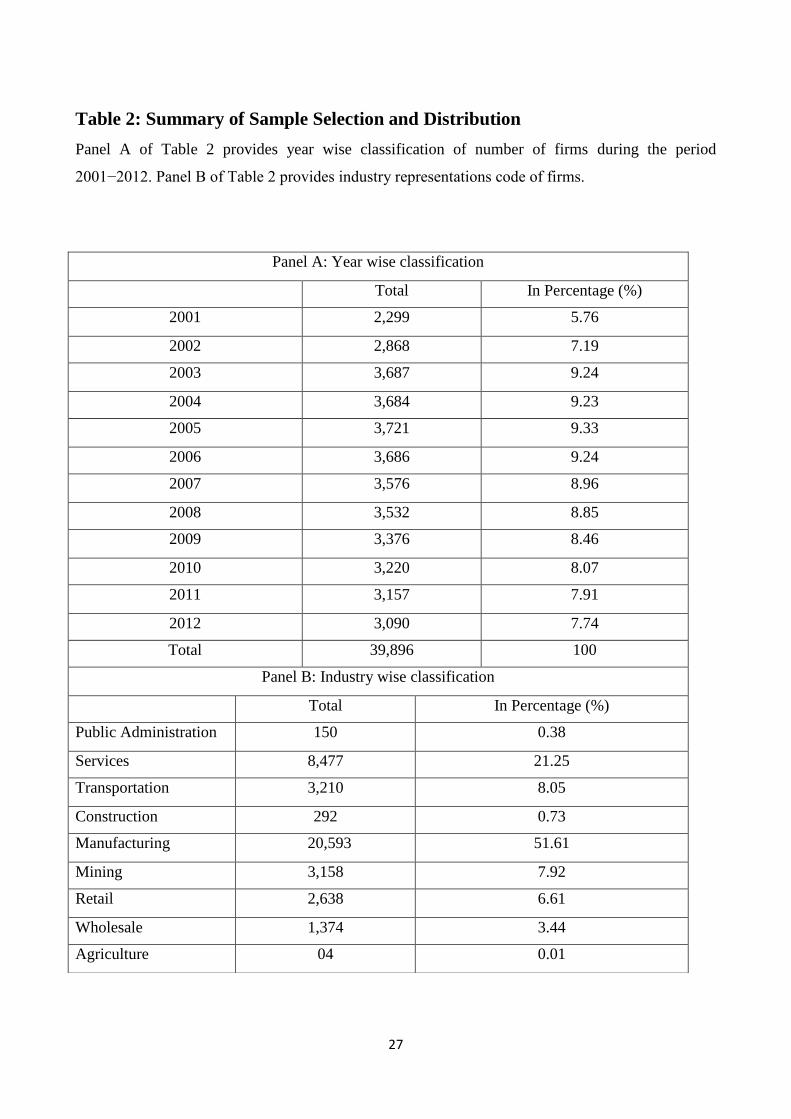
Table 2 provides a descriptive statistics of our sample. Specifically, Panel A shows the year-by-year
classification of firms; Panel B displays a categorization on the basis of industry sectors. Several
features in Table 2 are worthy of note. The sample is predominantly from the manufacturing
industry with 27,343 observations (approx.49.83% of the sample), while services industry are next
most strongly represented.
[INSERT TABLE 2 HERE]
We employ Center for Research in Security Prices (CRSP) database to obtain stock return data. We
collect firm annual accounting data from COMPUSTAT. The definition of variables is shown in
tables 3. We retrieve Audit fee, and Big 6 audit firm information from audit analytics database at
the last balance sheet date.
[INSERT TABLE 3 HERE]

8
3.2 Variable definitions
TDM
TDM is the ratio of debt in current liabilities and long term debt to market value of assets and
market value of assets is the sum of market value of equity (Price close*shares o/s), debt in current
liabilities, long term debt and preferred liquidation value minus deferred taxes and investment tax
credits. Lemon, Roberts and Zender (2008) and Chang et al. (2009) have employed TDM as a
measure of leverage for their study; in U.S context, Frank and Goyal (2009) also use TDM for their
study; for the study of 39 countries, Fan, Titman and Twite (2012) have also employed TDM as a
measure of leverage.
DISSUE
This is a dummy variable equals 1 if debt is issued, and 0 if equity is issued. Companies are defined
as issuing debt (equity) when the net debt (equity) issued divided by total assets exceeds 5 percent.
Cases where companies issue both debt and equity in a given fiscal year are omitted.
Audit quality
Previous studies (see for example Willenborg (1999)) argue that high quality audit should reduce
the information asymmetry among the managers and Investors and thus affect a company’s
financing decision. We use Audit fees, and Big4 auditors as proxies for audit quality. We expect a
positive relation between leverage and audit quality measure.
Francis (2004) shows that a higher audit fee implies higher audit quality either through
greater auditor expertise or more auditor effort. In terms of this opinion we use this variable as a
proxy of Audit quality. Audit fees have many benefits in measuring audit quality. Important benefit
is that they are continuous. Thus, unlike the discrete measures, fees potentially capture subtle
variations in quality.

9
DBAUDFIRM
This is a dummy variable. It takes value of unity if firms are audited by top 6 audit firms and
otherwise zero. Skinner and Srinivasan (2012) shows that the high quality firms employ high
quality audit firms. Chang et al. (2009) find that companies audited by Big 6 firms are more likely
to issue equity as opposed to debt than are those audited by non-big 6 firms. Causholli and Knechel
(2012) find that the firms which hire top audit firms can enjoy lower costs of equity financing.
These arguments support to employ this variable as a proxy of Audit quality.
Size of the firm
We use the natural logarithm of total assets (LNTA) as a proxy for the size of firms which is in line
with other studies in this area (e.g., Lemon, Roberts and Zender, 2008; Frank and Goyal, 2009;
Chang et. al, 2009 and Fan, Titman and Twite, 2012). Warner (1977) and Ang et al. (1982) find that
the ratio of direct bankruptcy costs to the firm value decreases as the firm value increases,
suggesting that the impact of these costs on the borrowing decisions of large firms might be
negligible. Titman and Wessels (1988) argue that larger firms are more diversified and have easier
access to the capital market and borrow at more favourable interest rate. Consistent with these
studies, we expect a positive relation between this proxy and leverage.
According to Frank and Goyal (2009), we also use mature (DMAT) as another proxy for
firm size, which is a dummy variable that takes a value of one if the firm has been listed in the
COMPUSTAT database for more than five years. We expect a positive relation between leverage
and DMAT.
Growth opportunities
We proxy for growth opportunities by the book to market ratio, measured as the ratio of the book
value of assets to the market value of assets. Firms with high book to market ratio have lower
growth opportunities. Growth opportunities are intangible in nature and cannot be collateralized;
10
they are only valuable as long as the firm is alive. Their value will fall precipitously if the firm faces
bankruptcy, which suggests that expected bankruptcy costs for firms with greater growth
opportunities will be higher (Myers, 1984; and Harris and Raviv, 1990). Larger expected
bankruptcy costs would in turn imply lower financial leverage. Consistent with Balachandran et el.
(2008) we expect a positive relation between leverage and book to market ratio.
Previous literature (for example, Titman and Wessels (1988); Frank and Goyal (2009)) use
capital expenditure over total assets (CAPEXTA) as another proxy for growth. Consistent with
Frank and Goyal (2009), we expect a positive relation between leverage and capital expenditure
over total assets ratio (CAPEXTA).
TANGIBILITY
This is computed as net PPE divided by total assets. Tangible assets lower the expected distress
costs as it is easier for the outsiders to value the tangible assets. Tangibility also helps in reducing
agency problems as this makes it difficult for shareholders to substitute high-risk assets for low risk
ones. Consistent with Chang et al (2009) and Frank and Goyal (2009), we assume a positive
relation between leverage and TANGIBILITY.
Industry Median Leverage (INDMEDLEV)
Generally industry median leverage is often used as a proxy for target capital structure (see for
example, Hovakimian, Opler and Titman (2001); Flannery and Rangan (2006)). Hovakimian, Opler
and Titman (2001) contend that firms actively adjust their target debt ratio towards the industry
average. Trade off theory predicts that higher industry median leverage result in more debt. In line
with Frank and Goyal (2009), we assume a positive relation between leverage and INDMEDLEV.
Past Stock Return (PSRETURN)
This is computed as the compounded annual stock return over 12 month’s period. Previous
literature (see for example, Welch 2004) argue that stock returns are very important in explaining
11
debt-equity ratios as firms do not rebalance capital structure changes caused by stock price shocks.
According to market timing theory managers actively timing the equity markets to take advantage
of mispricing and predict that book debt ratios should fall following high stock returns as firms
issue equity. Time varying adverse selection could also result in a negative relation between stock
prices and leverage. Consistent with Chang et al. (2009), we expect a negative relation between
leverage and PSRETURN.
SHARETURN
This is computed as median value of monthly shares traded (volume) divided by shares outstanding
over a 12-months period. Consistent with Chang et al. (2009), we expect a negative relation
between leverage and this proxy.
Profitability (ROA)
This is measures as the ratio of earnings before interest, tax and debt to total assets (ROA). In line
with previous studies (see for example (Titman and Wessels, 1988; Rajan and Zingales, 1995 and
Wald, 1999) we assume a negative relation between leverage and this this proxy because a firm
with high past profitability is expected to have access to the greater internal finance and tend to
have less debt in their capital structure.
Risk
This is calculated by standard deviation of stock return over one year period (return from -260 to
day -61,) and is denoted by stock return volatility (RETVOL). According to pecking order theory
riskier firms have higher leverage because firms with volatile stocks suffer more from adverse
selection costs. In line with the findings of Frank and Goyal (2009), we assume a positive between
leverage and RETVOL. Previous literature (for example, Chang et. al, 2009) uses Unleveragezscore
(UNLEVZSCORE) as a proxy for bankruptcy risk. We expect a positive relation between leverage
and this proxy.

12
DVTAT
This is computed as dividends divided by total assets. Corporate policy is related to capital structure
decisions as if current profits are positively correlated with future profits, then companies expecting
higher future profits tend to pay more dividends and have lower debt ratio by retiring the debt.
Companies expecting high future profits reflect higher debt capacities indicating that firms paying
more dividends may choose higher debt ratio. In line with Chang et al. (2009), we assume a
negative relation between leverage and this proxy.
R& D Expenses (RDSALE)
This is measured as research and development expenses scaled by total assets. According to
pecking order theory R&D expenses affect debt positively as these expenses are particularly prone
to adverse selection problems. In line with frank and Goyal (2009), we assume a positive relation
between leverage and RDSALE.
Unique (DUNIQUE)
This is a dummy variable that takes a value of one if the SIC code of the firm is between 3400 and
4000 (firms producing computers, semiconductors, chemicals, and allied, aircraft, guided missiles,
and space vehicles and other sensitive industries) and zero otherwise. Firms in unique industries
suffer from high financial distress costs because they have more specialized labor which results in
less debt in the capital structure. In line with (Titman, 1984 and Frank and Goyal, 2009), we expect
a negative relation between leverage and DUNIQUE.
RDDUMMY
This is a dummy variable which takes value of unity if R&D expenses are missing or zero
otherwise. In line with Chang et al. (2009), we expect a positive relation between leverage and
RDDUMMY.
13
4. Results
4.1 Firm Characteristics
Table 4 provides descriptive statistics of the characteristics of our sample firms. This table
documents basic nonparametric univariate tests (MV/T-test) for the differences in median and mean
values between first quintile and fifth quintile.
The variables that we examine are: Total debt to Market value of assets (TDM); DISSUE;
Audit fee (AUDFEE); Big 6 auditors (DBAUDFIRM); Total assets (TA); Stock return Volatility
(RETVOL); Past stock return (PSRETURN); Industry median leverage ratio (INDMEDLEV);
Maturity (DMAT); CAPEXTA; Unique (DUNIQUE); Share Turnover (SHARETURN); RDSALE;
RDDUMMY; TANGIBILITY; Unleveraged Z Score (UNLEVZSCORE); Book-to-market ratio
(BM); CURRENTRATIO; Profitability (ROA) and DVTAT.
Several features are worthy of note from the comparison between first quintile and fifth
quintile of Table 4. First, with regards to DISSUE we find that the high leverage firms issue more
debt compare to low leverage firms. Second, when we compare audit fee (AUDFEE), we find that
high leverage firms pay more audit fee. Third, BIG6 auditors (DAUDFIRM) are engaged with high
leverage firms rather than low leverage firms. Fourth, in terms of total assets (TA), large firms are
more leveraged firms (fifth quintile) compared to small firms, consistent with (Frank and Goyal,
2009) findings. Fifth, in terms of return volatility, consistent with Chang et al. (2009) we find that
risky firms are high leverage firms. Sixth, we find that low leverage firms have high past stock
return over 12 month’s period compare to firms with high leverage. Sixth, in terms of maturity
(DMAT), consistent with (Frank and Goyal, 2009) we find that, mature firms are more leveraged
firms compare to young firms. Seventh, we find that the high leverage firms spend more on capital
expenditure. Eighth, in terms of asset growth, high leverage firms have less asset growth. Ninth,
with regards to unique firms low leverage firms are engaged with the production of unique
products. Tenth, with regards to share turnover we find that the low leverage firms have high share
14
turnover over 12 months period. Eleventh, we find that high leverage firms spend less on research
and development expenses. Twelfth, we find that more leverage firms have more tangible assets
which make them able to collateralise those assets as security to get debt. In terms of
unleveragezscore (UNLEVZSCORE) high leverage firms are the risky firms. Thirteen, we find that
more leverage firms have high market to book ratio. Fourteen, in terms of profitability (ROA),
Consistent with Frank and Goyal (2009) and Chang et al. (2009) we find that profitability has
positive impact on leverage.
[INSERT TABLE 4 HERE]
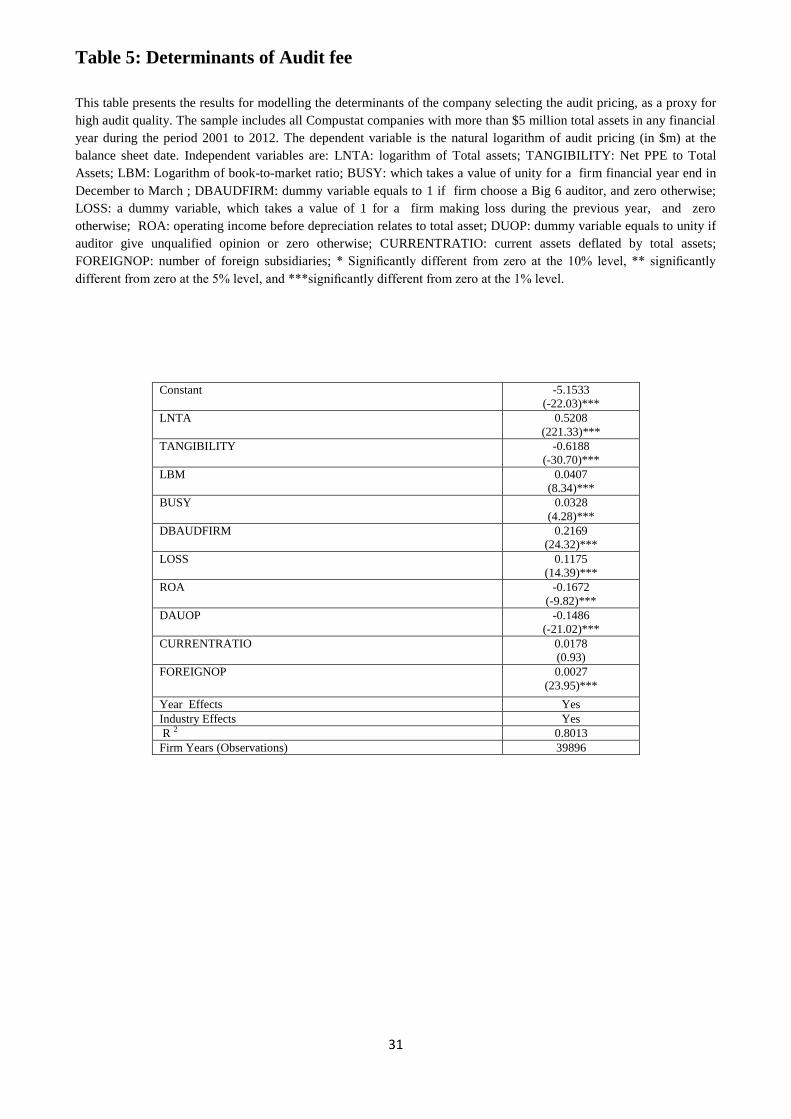
4.2 Determinants of audit fees
In this section we examine the determinants of audit pricing in a regressions setting. In line with
previous literature, we employ various firm characteristics for our control of audit fee model. The
dependent variable is Logarithm value of audit fee at the last balance sheet date. The independent
variables are logarithm of total assets (LNTA); TANGIBILITY; logarithm of book to market ratio
(LBM); BUSY; Big 6 auditor (DBAUDFIRM); LOSS; ROA; auditor opinion (DAUOP); Current
ratio; and foreign operations.
Several features are worthy of note from the Table 5. Most of the previous studies (See for
example, Seetharam et al., (2002)) employ LNTA as a proxy for auditee size as a significant
explanatory variable in determining audit fees. Consistent with previous studies (see for example,
Seetharam et al., (2002) and Gul et al., (2003)) the estimated coefficient on LNTA is significant and
positive for audit fees. The estimated coefficient on TANGIBILITY has a negative sign and
statistically significant indicating firm with more PPE pay lower audit fees. The estimated
coefficient on LBM has a positive sign and statistically significant, indicating that the value of firm
significantly impact on annual audit related charges.
The busy session for audits is considered the time period in which most companies accounts
are audited. The estimated coefficient on BUSY is positive and statistically significant indicating
15
that during the busy period auditor will charge higher pricing for their audit services. The results are
consistent with our prediction that the financial year of companies in US mostly ends in December
31st. As a majority of companies start their audits after this date; this would be the January through
March timeframe in US. It is generally believed that auditors expect better recoveries on standard
charge out rates for busy session audits. We also find that the estimated coefficient on
DBAUDFIRM has a positive sign and statistically significant. These results are consistent with our
prediction that the high growth, and high value firms hire big auditors more often than small audit
firms and large firms pay higher audit fees. The estimated coefficient on loss has a positive sign
and statistically significant in all models. These results are consistent with our prediction that the
risky firm generally pay high audit fees to get external audit services. Moreover, the estimated
coefficient on ROA has negative sign and statistically significant for audit fee indicating that the
audit fee will be lower for the firms with lowers risk. We find that the estimated coefficients on
auditor opinion (DAUOP) is negative and significant, indicating that firms getting unqualified
opinion from audit firms, tend to pay low audit fees. Consistent with (Seetharam et al. (2002)) the
estimated coefficient on CURRENTRATIO has a positive sign and statistically significant,
indicating that firms with more current assets pay high audit fees as large amount of current assets
makes the audit work more complex.
Finally, the estimated coefficient on foreign operations has a positive sign and statistically
significant. These results are consistent with our argument that if the business operations of the
client are more complex, i.e., more diversified or having foreign operations, the audit work is also
complex. More foreign operations require more audit work; therefore, audit firms charge higher
audit fees. Sandra and Patrick (1996) argue that subsidiaries in different countries often have to
comply with a variety of statutory and professional requirements for disclosure and thus this entails
additional audit testing. This implies that the companies have to bear additional charges for audit
work (see for example Langendijk (1997), Collier and Gregory (1996), Sandra and Partrick (1996),

16
and Taylor and Baker (1981)). Overall, we find that firm size, big 6 auditor, risk, current ratio and
foreign operations significantly decide the audit fees.
[INSERT TABLE 5 HERE]
4.3 Impact of audit fees on capital structure decision
In this section we examine the impact of audit fees in determining capital structure using cross
sectional regression model. The dependent variables is the market based leverage which is defined
as total debt (debt in current liabilities plus long term debt) divided by market value of assets. The
independent variables are the logarithm of audit fee and expected audit pricing at the end of balance
sheet date; logarithm of total assets (LNTA); maturity (DMAT); logarithm of book-to-market ratio
(LBM); TANGIBILITY; industry median leverage (INDMEDLEV); past stock return
(PSRETURN); share turnover (SHARETURN); profitability (ROA); stock return volatility
(RETVOL); dividends deflated by total assets (DVTAT); R&D expenses (RDSALE) and Unique
dummy (DUNIQUE).
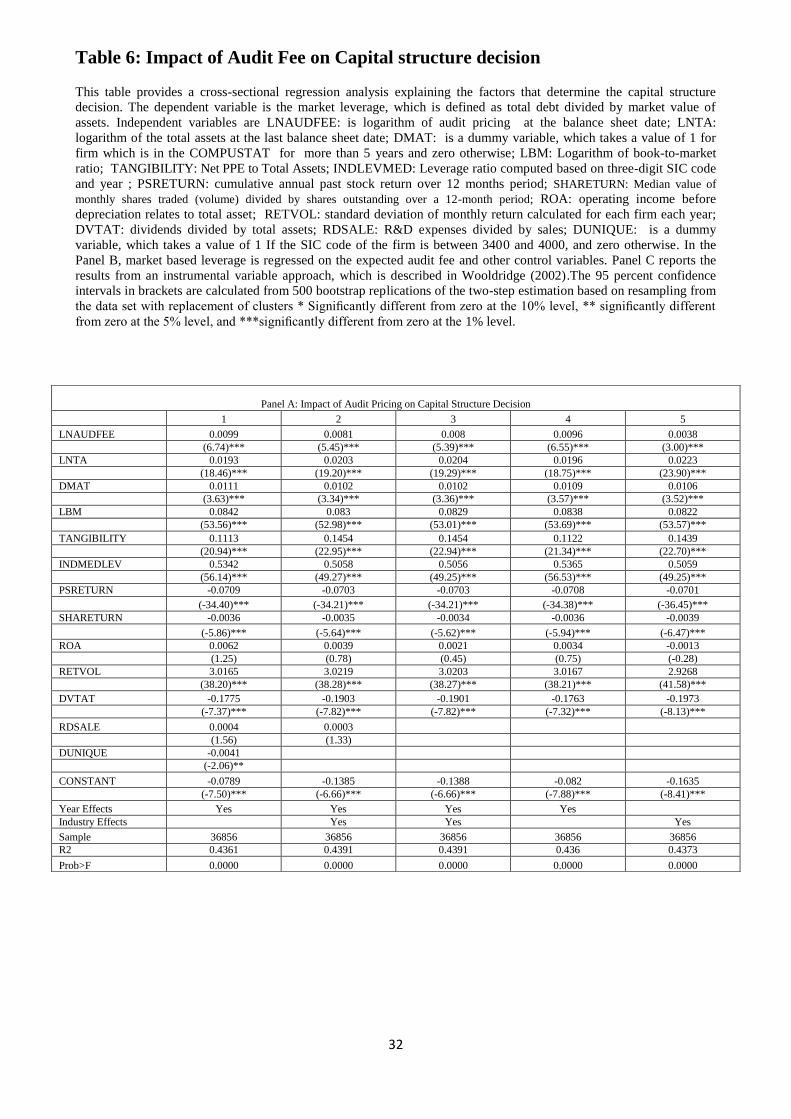
Table 7 reports the results relating to the impact of audit fees on capital structure decision.
Panel A (Panel B) use LNAUDFEE (EXPAUDFEE) as a proxy for audit quality. The key points
from the panel A of table 7 are as follows. First, the estimated coefficient on LNAUDFEE has a
positive sign and statistically significant for market based leverage in all models, indicating that
firms paying high audit fees are high leverage firms. This finding suggests that high leverage firms
pay more audit fees.
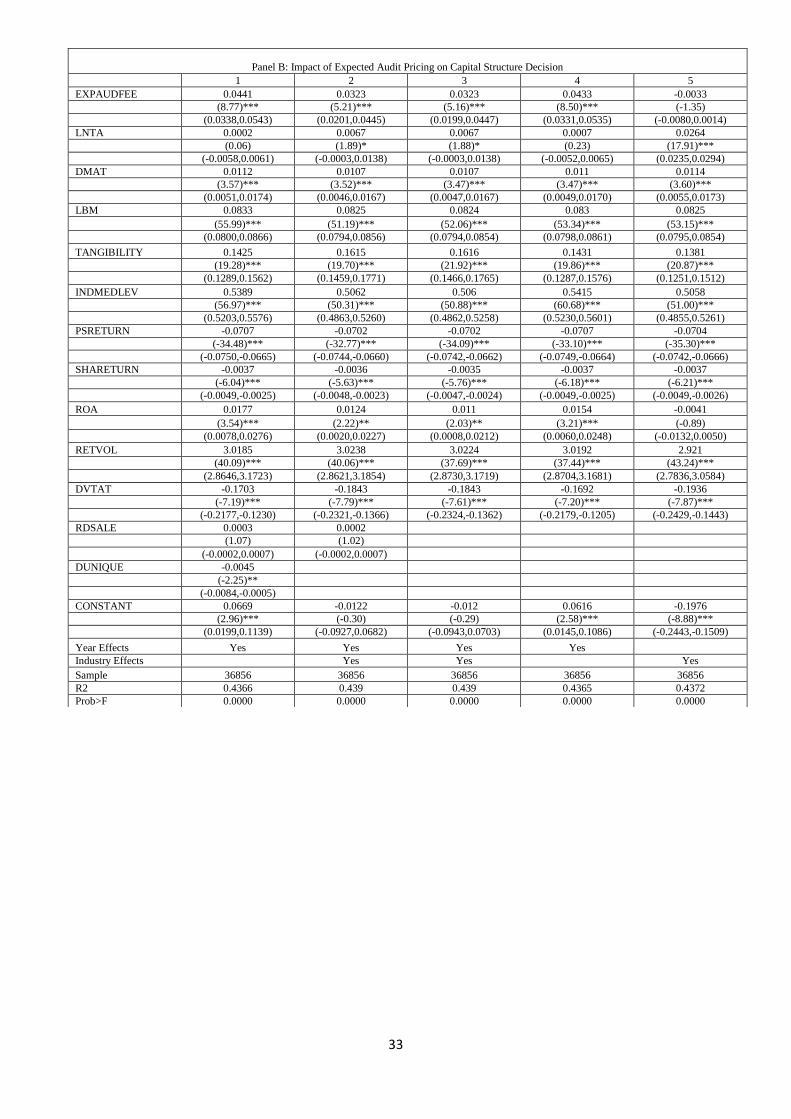
We use further two approaches to mitigate the effect of endogeneity. Moreover, we predict
the likelihood of the company paying high audit fees in the first stage using the specification in
Table 5, and use this expected value (EXPAUDFEE) in the second stage (Panel B).We employ
logarithm of audit fees on the balance sheet date and likelihood of paying audit fees is predicted on
firm specific variables that are lagged one year for this first stage regression model. We also
bootstrap this system 500 times to obtain the 95 percent confidence intervals in the second stage. In
17
the third stage, we follow (Wooldridge, 2002) instrumental technique in which predicted value of
audit fees have been used as an instrument in the instrumental regression. As discussed in Panel B,
the estimated coefficient on EXPAUDFEE has a negative sign and statistically significant for
market based leverage in all models indicating firm with expected high audit fees are low leverage
firms. As panel C results show, the estimated coefficient on LNAUDFEE has a negative sign and
statistically significant for market based leverage in all the models indicating the estimation
procedure has also the similar results that high audit fee paying firms are low leverage firms. The
bootstrapped 95 percent confidence interval, showed in Panel B, and (Wooldridge, 2002) estimation
procedure, showed in panel C reports that the estimated coefficient of audit fee is significantly
different from zero. Thus, our evidence supports our prediction that firms paying high audit fees are
high leverage firms.
Second, the estimated coefficient on LNTA is significant and positive in all models of
(Panel A) indicating that large firms tend to have more leverage. Second, the estimated coefficient
on maturity (DMAT) has a positive sign and statistically significant in all the models of Panel (A, B
and C) indicating that mature firms are more leveraged firms. Third, the estimated coefficient on
logarithm of book-to-market ratio (LBM) has positive sign and statistically significant for the
market based leverage in all models (panel A, B and C) indicating that low growth firms are more
leveraged firms. Fourth, the coefficient on TANGIBILITY is positive and statistically significant
for all models of Panel A, B and C indicating that firms with more PPE tend to have more leverage.
Fifth, the estimated co efficient on INDMEDLEV has a positive sign and statistically significant for
the market based leverage in all models of Panel A, B and C, indicating that firms in industries in
which median firm has high leverage are high leveraged firms. The coefficient on PSRETURN is
negative and statistically significant for all models of Panel A, B and C indicating that firms with
high stock return over 12 months period are low leveraged firms. Sixth, the estimated coefficient
on SHARETURN has negative sign and statistically significant for all models of Panel A, B and C,
which indicate that firms with high median value of monthly shares traded divided by outstanding
18
shares over 12 months period are less leveraged firms. Seventh, the estimated coefficients on ROA
are positive and significant in all models of panel C, indicating that firms with more profitability are
more leveraged firms. Eight, we find that the estimated coefficient on RETVOL are positive and
significant in all models for Panel (A, B and C) indicating that risky firms are more leveraged firms.
Ninth, we find that the estimated coefficient on DVTAT has a negative sign and statistically
significant in all models for panel (A, B and C), which indicate that firms paying dividends are less
leverage firms. Moreover, we find that the estimated coefficient on RDSALE has a positive sign
and statistically significant in model 1 and 2 for Panel C, indicating that firms with more
information disclosure tends to have more leverage. We also find that DUNIQUE is negative and
statistical significant, indicating that the firms producing unique products have less leverage
because of the threat of bankruptcy. Overall, we find that dividend paying firms with more maturity,
more tangible assets, high industry median leverage, low growth, and high audit fees have more
debt in their capital structure.
4.4 Audit fees and debt-equity choice
In this section we turn our attention to the impact of audit fees on the financing decision of the
company. The dependent variable (DISSUE) is based on a dummy variable taking a value of unity
if company issue debt and zero otherwise. The independent variables are logarithm of audit pricing
(LNAUDFEE); predicted value of audit fees (EXPAUDFEE); firm size (LNTA); maturity
(DMAT); logarithm of book-to-market ratio (LBM); industry median leverage (INDMEDLEV);
past stock return (PSRETURN); share turnover (SHARETURN); profitability (ROA); RETVOL;
UNLEVZSCORE; R&D expenses (RDSALE); RDDUMMY and capital expenditure deflated by
total assets (CAPEXTA).
The estimated coefficient on the audit fees (LNAUDFEE) variable has a positive sign and
statistically significant in all models , indicating that firm paying high audit fees tend to issue debt.
19
We use further two approaches to mitigate the effect of endogeneity. Moreover, we predict the
likelihood of the company paying high audit fee in the first stage using the specification in Table 5,
and use this expected value (EXPAUDFEE) in the second stage. We employ audit fee on balance
sheet date and first stage expected based on firm specific variables that are lagged one year for this
first stage regression model. We also bootstrap this system 500 times to obtain the 95 percent
confidence intervals in the second stage. As discussed in model 2, the estimated coefficient on
EXPAUDFEE has a negative sign and statistically significant. Further, we pursue a method
recommended in the previous literature (Wooldridge 2002), which involves using the expected
value of audit fee (EXPAUDFEE) as an instrument in the instrumental regressions (model 3). We
employ a standard instrumental approach, with the expected value (EBAUDFIRM) obtained from
Table 5 as an instrument. The results in model 2 and 3 of Table 9 from these methods are very
similar.
Second, the estimated coefficient on LNTA is significant and positive in first model
indicating that large firms tend to issue more debt. Second, the estimated coefficient on DMAT has
a positive sign and statistically significant for two models indicating that mature firms are more
inclined to issue debt. Third, the estimated coefficient on LBM has a positive sign and statistically
significant in all models, which indicate that low growth firms issue equity. Fifth, the estimated
coefficient on PSRETURN has negative sign and statistically significant for all models, which
indicate that firms with high compounded annual stock return over 12 months period issue equity.
Sixth, the estimated coefficient on share turnover (SHARETURN) has a negative sign and
statistically significant for all the models, indicating that firms with high median value of monthly
shares traded divided by outstanding shares over 12 months period are more inclined to issue
equity. The coefficient on ROA is positive and statistically significant for all models indicating that
profitable firms tend to issue debt. Seventh, the estimated coefficient on UNLEVZSCORE is
positive and statistically significant for model 1, indicating that risky firms tend to issue debt.
Moreover, we find that the estimated coefficient on RDSALE has a negative sign and statistically

20
significant for all models, indicating that firms with more information disclosure are more inclined
to issue equity. We also find that coefficients on RDDUMMY are positive and statistically
insignificant for model 2 and 3, indicating that firms with more information disclosure are more
inclined to issue equity. Finally we find that the estimated coefficient on CAPEXTA has a positive
sign and statistically significant, indicating that firms with more capital expenditures tend to issue
debt.
[INSERT TABLE 7 HERE]
5. Conclusions
We investigate the impact of audit fees on capital structure decision. We also examine how audit
fees impact on issuance choice of the firm. We find that the audit fees are positively related to
leverage. We further document that the firms paying higher audit fees are more inclined to issue
debt as opposed to equity. Overall, our findings suggest that audit fee plays a significant role in
deciding the capital structure of the firm.
21
References
Alti, A., 2006. How persistent is the impact of market timing on capital structure? The Journal of
Finance 4, 1681-1710.
Ang, J.S., J.H. Chua., J.J. McConnell. 1982, 'The administrative costs of corporate bankruptcy: A
Note. Journal of Finance, 37, 337-48.
Baker, M., Wurgler, J., 2002. Market timing and capital structure. The Journal of Finance 1, 1-32.
Balachandran, B., Faff, R., Theobald, M., 2008. Rights offering, take up, and underwriting Status.
Journal of Financial Economics 89, 328-346.
Beatty, R. P., 1989. Auditor reputation and the pricing of initial public offerings. Accounting
Review, 693-709.
Brealey, R., Leland, H. E., & Pyle, D. H. (1977). Informational asymmetries, financial structure,
and financial intermediation. The journal of Finance, 32(2), 371-387.
Carcello, J.V., Harmonson, D.R., Neal, T.L., Riley, R.A. (2002). Board characteristics and audit
fees. Contemporary Accounting Research 19(3), 365-384.
Causholli, M., Knechel, W.R., 2012. An examination of the credence attributes of an audit.
Accounting Horizons 26, 631-656.
Chang, X., Dasgupta, S., Hilary, G., 2009. The effect of auditor quality on financing decisions. The
Accounting Review, 4, 1085- 1117.
Choi, J. H., Kim, J. B., Liu, X., & Simunic, D. A. (2008). Audit pricing, legal liability regimes, and
big 4 premiums: Theory and Cross‐ country evidence*. Contemporary Accounting Research, 25(1),
55-99.
Collier, P., Gregory, A., 1996. Audit committee effectiveness and the audit fee. European
Accounting Review, 5, 177-198.

22
DeAngelo, H., Masulis, R.W., 1980. Optimal capital structure under corporate and personal
taxation. Journal of Financial Economics 8, 3-29.
DeAngelo, L.E., 1981. Auditor size and audit quality. Journal of Accounting and Economics 3,
183-199.
Easterbrook, F. H. (1984). Two agency-cost explanations of dividends. The American Economic
Review, 650-659.
Fama, E. F. (1980). Agency problems and the theory of the firm. The journal of political economy,
288-307.
Fama, E. F., & Miller, M. H. (1972). The Theory of Finance. Holt, Rinehart and Winston: New
York.
Fan, J. P., Titman, S., & Twite, G. (2012). An international comparison of capital structure and debt
maturity choices. Journal of Financial and Quantitative Analysis, 47(1), 23.
Flannery, M. J., Rangan, K. P. (2006). Partial adjustment toward target capital structures. Journal of
Financial Economics, 79(3), 469-506.
Francis, J. R., 2004. What do we know about audit quality? The British Accounting Review 36,
345-368.
Francis, J. R., 2004. What do we know about audit quality? The British Accounting Review 36,
345-368.
Francis, J. R., Reichelt, K., Wang, D., 2005. The pricing of national and city-specific reputations for
industry expertise in the US audit market. The accounting review 80, 113-136.
Frank, M.Z., Goyal, V.K., 2009. Capital structure decisions: which factors are reliably important?
Financial Management, 1-37.

23
Harris, M; and Raviv, A; 1990. Capital structure and information role of debt. The Journal of
Finance 2, 321-349.
Haugen, R.A., Senbet L.W., 1988. Bankruptcy and agency costs: Their significance to the theory of
optimal capital structure. Journal of Financial and Quantitative analysis 23, 27-38.
Hovakimian, A., Opler, T., Titman, S., 2001. The debt equity choice. Journal of Financial and
Quantitative analysis, 36, 1-24.
Jenson, M.C., 1986. Agency theory of free cash flow, corporate finance and takeovers. The
American Economic Review 76, 323-329.
Jenson, M.C., Meckling W.H., 1976. Theory of the firm: Managerial behaviour, agency cost and
ownership structure. Journal of Financial Economics 3, 305-360.
Kayhan, A., Titman, S., 2007. Firm’s histories and their capital structures. Journal of Financial
Economics 83(1), 1-32.
Knechel, W. R., Krishnan, G. V., Pevzner, M., Shefchik, L. B., & Velury, U. K. (2012). Audit
quality: Insights from the academic literature. Auditing: A Journal of Practice & Theory, 32(sp1),
385-421.
Kraus, A., Litzenberger, R.H., 1973. A state preference model of optimal financial leverage. The
Journal of Finance, 911-922.
Langendijk, H., 1997. The market for audit services in the Netherland. European Accounting
Review, 6, 253-264.
Lemmon, M. L., Roberts, M. R., & Zender, J. F. (2008). Back to the beginning: persistence and the
cross‐ section of corporate capital structure. The Journal of Finance, 63(4), 1575-1608.
Mansi, S. A., Maxwell, W. F., Miller, D. P., 2004. Does auditor quality and tenure matter to
investors? Evidence from the bond market. Journal of Accounting Research, 42, 755-793.
24
Mitra, S., Deis, D. R., Hossain, M., 2009. The association between audit pricing and reported
earnings quality in pre-and post-Sarbanes-Oxley regimes. Review of Accounting and Finance, 8,
232-252.
Modigliani, F., Miller, M.H., 1963. Corporate income taxes and the cost of capital: A Correction.
The American Economic Review, 53, 433-443.
Myers, S. C., 1984. The capital structure puzzle. Journal of Finance 34, 575–592.
Myers, S.C., Majluf, N.S., 1984. Corporate financing and investment decisions when firms have
information that investors do not have. Journal of Financial Economic 13, 187-221.
Rajan, R. G., & Zingales, L. (1995). What do we know about capital structure? Some evidence from
international data. The journal of Finance, 50(5), 1421-1460.
Ross, S. A. (1977). The determination of financial structure: the incentive-signalling approach. The
Bell Journal of Economics, 23-40.
Sandra, W.M., Patrick, P.H., 1996. The determinants of audit pricing in Hong Kong: An empirical
study. Asian review of Accounting, 4, 32-50.
Skinner, D. J., Srinivasan, S., 2012. Audit quality and auditor reputation: Evidence from Japan.
The Accounting Review 87, 1737–1765.
Stanley, J. D., Todd DeZoort, F., 2007. Audit firm tenure and financial restatements: An analysis of
industry specialization and fee effects. Journal of Accounting and Public Policy 26, 131-159.
Stulz, R.M., 1990. Managerial discretion and optimal financial policies. Journal of Financial
Economics 26, 3-27.
Taylor, M.E., Baker, R.L., 1981. An analysis of the external audit fee. Accounting and Business
Research, 55-60.
25
Titman, S. (1984). The effect of capital structure on a firm's liquidation decision. Journal of
Financial Economics, 13(1), 137-151.
Titman, S., & Wessels, R. (1988). The determinants of capital structure choice. The Journal of
finance, 43(1), 1-19.
Titman, S., Wessels, R. (1988). The determinants of capital structure choice. The Journal of
Finance, 43(1), 1-19.
Wald, J. K. (1999). How firm characteristics affect capital structure: an international comparison.
Journal of Financial research, 22(2), 161-187.
Warner, J.B., 1977, 'Bankruptcy costs: Some Evidence. Journal of Finance 32, 337-348.
Watts, R., J. Zimmerman (1981). The markets for independence and independent auditors. Journal
of Accounting and Economics, 3(3), 183-199.
Welch, I., 2004. Capital structure and stock returns. Journal of Political Economy 112, 106-132.
Working paper, University of Rochester.
Willenborg, M., 1999. Empirical analysis of the economic demand for auditing in the initial public
offerings market. Journal of Accounting Research, 225-238.
Wooldridge, J.M., 2002. Econometric analysis of cross section and panel data. MIT Press,
Cambridge, MA.

26
Table 1: Summary of Sample Selection and Data Filtering
Reason for Sample Exclusion No of
observatio
ns
Initial Sample of US publicly traded firms 6 1,34,263
Less Exclusions
- Financial, insurance and real estate companies 38,286
- Regulated utilities 4,866
- Firms with missing total assets 4,673
- Small firms with less than $5 million total assets 11,078
- Firms with no identifier
43,304
- Firms without Audit Pricing data 14,969
- Firms with negative TDM 07
- Firms with extreme TDM value 01
- Firms with negative debt in current liabilities
03
Total Exclusions 79,398
Final Sample 39,896
27
Table 2: Summary of Sample Selection and Distribution
Panel A of Table 2 provides year wise classification of number of firms during the period
2001−2012. Panel B of Table 2 provides industry representations code of firms.
Panel A: Year wise classification
Total In Percentage (%)
2001 2,299 5.76
2002 2,868 7.19
2003 3,687 9.24
2004 3,684 9.23
2005 3,721 9.33
2006 3,686 9.24
2007 3,576 8.96
2008 3,532 8.85
2009 3,376 8.46
2010 3,220 8.07
2011 3,157 7.91
2012 3,090 7.74
Total 39,896 100
Panel B: Industry wise classification
Total In Percentage (%)
Public Administration 150 0.38
Services 8,477 21.25
Transportation 3,210 8.05
Construction 292 0.73
Manufacturing 20,593 51.61
Mining 3,158 7.92
Retail 2,638 6.61
Wholesale 1,374 3.44
Agriculture 04 0.01

28
Table 3: Variable Definitions
Variable Name Definition
TDM Total debt to market value of assets
DISSUE dummy variable equals to one if company issues debt or zero otherwise
AUDFEE Audit pricing in $m at the balance sheet date
LNAUDFEE logarithm of audit pricing at the balance sheet date
DAUDFIRM a dummy variable, which takes a value of 1 for a Big 6 audit firm and 0 for other firms
TA Total Assets at the balance sheet date
LNTA logarithm of total assets
BM Total assets/ Total assets+ Market value of equity-book value of equity
LBM logarithm of book-to-market ratio
RDSALE R&D divided by sales
RDDUMMY a dummy variable, which takes a value of 1 if R&D expenses are missing and zero
otherwise
RETVOL standard deviation of monthly return calculated for each firm each year
UNLEVZSCORE (3.3 * pretax income + sales + 1.4 * retained earnings + 1.2* [current assets – current
liabilities])/total assets.
TANGIBILITY Net PPE-to-assets ratio
PSRETURN Cumulative annual past stock return over 12 months period
INDLEVMED Leverage ratio computed based on three-digit SIC code and year
DMAT is a dummy variable, which takes a value of 1 for firm which is in the COMPUSTAT for
more than 5 years , and zero otherwise
CAPEXTA capital expenditure relates to total assets
DUNIQUE is a dummy variable, which takes a value of 1 If the SIC code of the firm is between 3400
and 4000, and zero otherwise
SHARETURN Median value of monthly shares traded (volume) divided by shares outstanding over a 12-
month period
CURRENTRATIO ratio of current assets to total assets
ROA income before depreciation and amortization divided by total assets
FOREIGNOP number of foreign subsidiaries
29
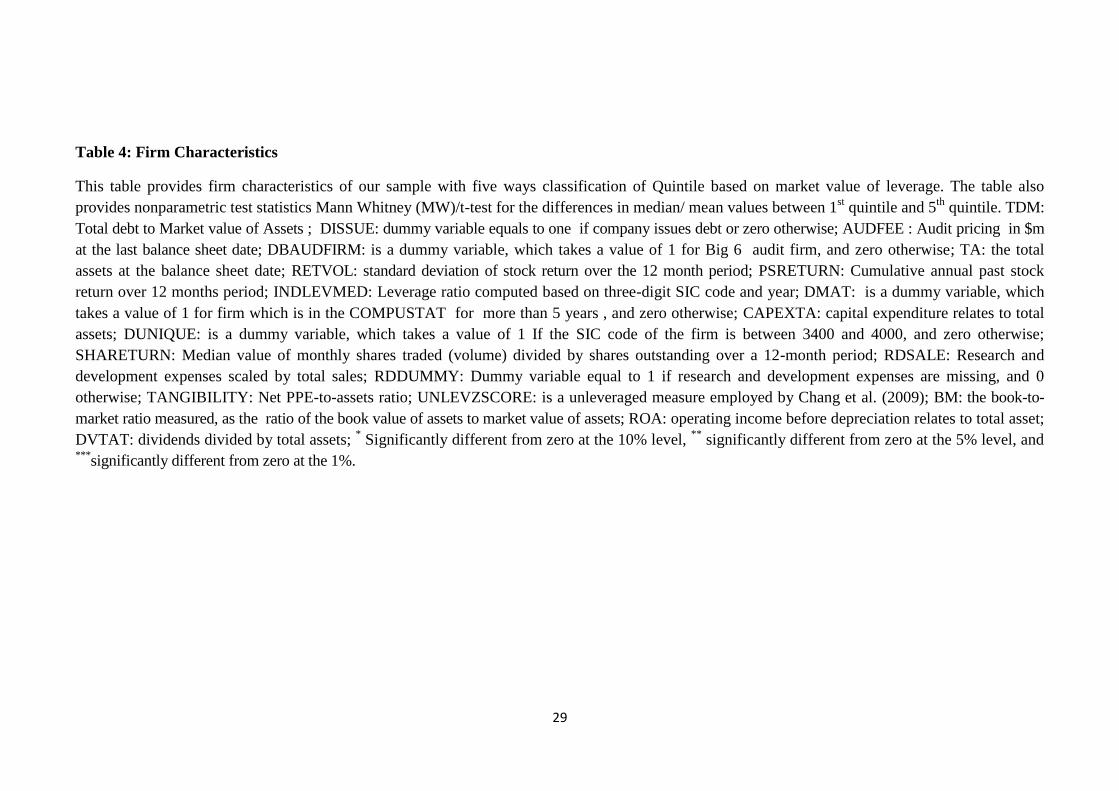
Table 4: Firm Characteristics
This table provides firm characteristics of our sample with five ways classification of Quintile based on market value of leverage. The table also
provides nonparametric test statistics Mann Whitney (MW)/t-test for the differences in median/ mean values between 1st quintile and 5
th quintile. TDM:
Total debt to Market value of Assets ; DISSUE: dummy variable equals to one if company issues debt or zero otherwise; AUDFEE : Audit pricing in $m
at the last balance sheet date; DBAUDFIRM: is a dummy variable, which takes a value of 1 for Big 6 audit firm, and zero otherwise; TA: the total
assets at the balance sheet date; RETVOL: standard deviation of stock return over the 12 month period; PSRETURN: Cumulative annual past stock
return over 12 months period; INDLEVMED: Leverage ratio computed based on three-digit SIC code and year; DMAT: is a dummy variable, which
takes a value of 1 for firm which is in the COMPUSTAT for more than 5 years , and zero otherwise; CAPEXTA: capital expenditure relates to total
assets; DUNIQUE: is a dummy variable, which takes a value of 1 If the SIC code of the firm is between 3400 and 4000, and zero otherwise;
SHARETURN: Median value of monthly shares traded (volume) divided by shares outstanding over a 12-month period; RDSALE: Research and
development expenses scaled by total sales; RDDUMMY: Dummy variable equal to 1 if research and development expenses are missing, and 0
otherwise; TANGIBILITY: Net PPE-to-assets ratio; UNLEVZSCORE: is a unleveraged measure employed by Chang et al. (2009); BM: the book-to-
market ratio measured, as the ratio of the book value of assets to market value of assets; ROA: operating income before depreciation relates to total asset;
DVTAT: dividends divided by total assets; * Significantly different from zero at the 10% level,
** significantly different from zero at the 5% level, and
***significantly different from zero at the 1%.

30
Variables Q1 Q2 Q3 Q4 Q5
Q1 Vs Q5
t-test/MV
TDM Mean (%) 0.00 0.02 0.12 0.29 0.61 (2.90)**
Median (%) 0.38 0.51 0.81 1.03 0.95 (115.48)***
DISSUE Mean 0.11 0.71 0.78 0.82 0.85 (72.53)***
Median 0.00 1.00 1.00 1.00 1.00 (50.46)***
AUDFEE Mean ($m) 0.52 0.99 1.98 2.20 1.89 (24.68)***
Median ($m) 0.38 0.51 0.81 1.03 0.95 (41.63)***
DBAUDFIRM Mean 0.71 0.72 0.78 0.80 0.76 (6.63)***
Median 1.00 1.00 1.00 1.00 1.00 (6.62)***
TA Mean ($m) 409.20 1745.89 4218.87 5036.49 4131.57 (24.56)***
Median ($m) 104.24 138.39 415.98 673.63 679.52 (55.89)***
RETVOL Mean 0.04 0.04 0.03 0.03 0.04 (-9.16)***
Median 0.03 0.03 0.03 0.03 0.03 (-1.92)*
PSRETURN Mean 0.15 0.23 0.18 0.13 -0.01 (14.85)***
Median 0.11 0.19 0.18 0.14 0.00 (14.53)***
INDLEVMED Mean 0.06 0.08 0.13 0.18 0.25 (94.15)***
Median 0.02 0.04 0.12 0.20 0.23 (76.96)***
DMAT Mean 0.85 0.85 0.91 0.91 0.89 (6.22)***
Median 1.00 1.00 1.00 1.00 1.00 (6.22)***
CAPEXTA Mean (%) 0.04 0.05 0.06 0.06 0.06 (20.48)***
Median (%) 0.02 0.03 0.04 0.04 0.04 (27.51)***
DUNIQUE Mean 0.34 0.32 0.30 0.27 0.18 (22.55)***
Median 0.00 0.00 0.00 0.00 0.00 (22.55)***
SHARETURN Mean (%) 1.57 1.63 1.56 1.58 1.44 (3.55)***
Median (%) 1.06 1.20 1.19 1.29 1.07 (6.33)***
RDSALE Mean (%) 0.96 0.92 0.41 0.19 0.13 (14.36)***
Median (%) 0.07 0.04 0.00 0.00 0.00 (56.84)***
RDDUMMY Mean 0.24 0.25 0.35 0.44 0.57 (44.56)***
Median 0.00 0.00 0.00 0.00 1.00 (41.97)***
TANGIBILITY Mean (%) 0.14 0.19 0.27 0.32 0.38 (66.26)***
Median (%) 0.08 0.13 0.19 0.25 0.35 (62.21)***
UNLEVZSCORE Mean 522.27 3060.08 7014.60 6377.35 3518.13 (18.06)***
Median 50.74 82.07 547.09 741.07 353.12 (31.01)***
BM Mean (%) -0.58 -0.61 -0.35 -0.77 0.18 (46.36)***
Median (%) -0.61 -0.65 -0.31 -0.00 0.22 (62.62)***
ROA Mean (%) -0.12 0.00 0.07 0.08 0.07 (23.30)***
Median (%) 0.06 0.09 0.13 0.12 0.09 (15.67)***
DVTAT Mean (%) 0.01 0.01 0.01 0.01 0.01 (6.72)***
Median (%) 0.01 0.01 0.01 0.01 0.01 (17.38)***
Sample
39,896 39,896 39,896 39,896 39,896
31
Table 5: Determinants of Audit fee
This table presents the results for modelling the determinants of the company selecting the audit pricing, as a proxy for
high audit quality. The sample includes all Compustat companies with more than $5 million total assets in any financial
year during the period 2001 to 2012. The dependent variable is the natural logarithm of audit pricing (in $m) at the
balance sheet date. Independent variables are: LNTA: logarithm of Total assets; TANGIBILITY: Net PPE to Total
Assets; LBM: Logarithm of book-to-market ratio; BUSY: which takes a value of unity for a firm financial year end in
December to March ; DBAUDFIRM: dummy variable equals to 1 if firm choose a Big 6 auditor, and zero otherwise;
LOSS: a dummy variable, which takes a value of 1 for a firm making loss during the previous year, and zero
otherwise; ROA: operating income before depreciation relates to total asset; DUOP: dummy variable equals to unity if
auditor give unqualified opinion or zero otherwise; CURRENTRATIO: current assets deflated by total assets;
FOREIGNOP: number of foreign subsidiaries; * Significantly different from zero at the 10% level, ** significantly
different from zero at the 5% level, and ***significantly different from zero at the 1% level.
Constant -5.1533
(-22.03)***
LNTA 0.5208
(221.33)***
TANGIBILITY -0.6188
(-30.70)***
LBM 0.0407
(8.34)***
BUSY 0.0328
(4.28)***
DBAUDFIRM 0.2169
(24.32)***
LOSS 0.1175
(14.39)***
ROA -0.1672
(-9.82)***
DAUOP -0.1486
(-21.02)***
CURRENTRATIO 0.0178
(0.93)
FOREIGNOP 0.0027
(23.95)***
Year Effects Yes
Industry Effects Yes
R 2 0.8013
Firm Years (Observations) 39896
32
Table 6: Impact of Audit Fee on Capital structure decision
This table provides a cross-sectional regression analysis explaining the factors that determine the capital structure
decision. The dependent variable is the market leverage, which is defined as total debt divided by market value of
assets. Independent variables are LNAUDFEE: is logarithm of audit pricing at the balance sheet date; LNTA:
logarithm of the total assets at the last balance sheet date; DMAT: is a dummy variable, which takes a value of 1 for
firm which is in the COMPUSTAT for more than 5 years and zero otherwise; LBM: Logarithm of book-to-market
ratio; TANGIBILITY: Net PPE to Total Assets; INDLEVMED: Leverage ratio computed based on three-digit SIC code
and year ; PSRETURN: cumulative annual past stock return over 12 months period; SHARETURN: Median value of
monthly shares traded (volume) divided by shares outstanding over a 12-month period; ROA: operating income before
depreciation relates to total asset; RETVOL: standard deviation of monthly return calculated for each firm each year;
DVTAT: dividends divided by total assets; RDSALE: R&D expenses divided by sales; DUNIQUE: is a dummy
variable, which takes a value of 1 If the SIC code of the firm is between 3400 and 4000, and zero otherwise. In the
Panel B, market based leverage is regressed on the expected audit fee and other control variables. Panel C reports the
results from an instrumental variable approach, which is described in Wooldridge (2002).The 95 percent confidence
intervals in brackets are calculated from 500 bootstrap replications of the two-step estimation based on resampling from
the data set with replacement of clusters * Significantly different from zero at the 10% level, ** significantly different
from zero at the 5% level, and ***significantly different from zero at the 1% level.
Panel A: Impact of Audit Pricing on Capital Structure Decision
1 2 3 4 5
LNAUDFEE 0.0099 0.0081 0.008 0.0096 0.0038
(6.74)*** (5.45)*** (5.39)*** (6.55)*** (3.00)***
LNTA 0.0193 0.0203 0.0204 0.0196 0.0223
(18.46)*** (19.20)*** (19.29)*** (18.75)*** (23.90)***
DMAT 0.0111 0.0102 0.0102 0.0109 0.0106
(3.63)*** (3.34)*** (3.36)*** (3.57)*** (3.52)***
LBM 0.0842 0.083 0.0829 0.0838 0.0822
(53.56)*** (52.98)*** (53.01)*** (53.69)*** (53.57)***
TANGIBILITY 0.1113 0.1454 0.1454 0.1122 0.1439
(20.94)*** (22.95)*** (22.94)*** (21.34)*** (22.70)***
INDMEDLEV 0.5342 0.5058 0.5056 0.5365 0.5059
(56.14)*** (49.27)*** (49.25)*** (56.53)*** (49.25)***
PSRETURN -0.0709 -0.0703 -0.0703 -0.0708 -0.0701
(-34.40)*** (-34.21)*** (-34.21)*** (-34.38)*** (-36.45)***
SHARETURN -0.0036 -0.0035 -0.0034 -0.0036 -0.0039
(-5.86)*** (-5.64)*** (-5.62)*** (-5.94)*** (-6.47)***
ROA 0.0062 0.0039 0.0021 0.0034 -0.0013
(1.25) (0.78) (0.45) (0.75) (-0.28)
RETVOL 3.0165 3.0219 3.0203 3.0167 2.9268
(38.20)*** (38.28)*** (38.27)*** (38.21)*** (41.58)***
DVTAT -0.1775 -0.1903 -0.1901 -0.1763 -0.1973
(-7.37)*** (-7.82)*** (-7.82)*** (-7.32)*** (-8.13)***
RDSALE 0.0004 0.0003
(1.56) (1.33) DUNIQUE -0.0041
(-2.06)**
CONSTANT -0.0789 -0.1385 -0.1388 -0.082 -0.1635
(-7.50)*** (-6.66)*** (-6.66)*** (-7.88)*** (-8.41)***
Year Effects Yes Yes Yes Yes Industry Effects
Yes Yes
Yes
Sample 36856 36856 36856 36856 36856
R2 0.4361 0.4391 0.4391 0.436 0.4373
Prob>F 0.0000 0.0000 0.0000 0.0000 0.0000
33
Panel B: Impact of Expected Audit Pricing on Capital Structure Decision
1 2 3 4 5
EXPAUDFEE 0.0441 0.0323 0.0323 0.0433 -0.0033
(8.77)*** (5.21)*** (5.16)*** (8.50)*** (-1.35)
(0.0338,0.0543) (0.0201,0.0445) (0.0199,0.0447) (0.0331,0.0535) (-0.0080,0.0014)
LNTA 0.0002 0.0067 0.0067 0.0007 0.0264
(0.06) (1.89)* (1.88)* (0.23) (17.91)***
(-0.0058,0.0061) (-0.0003,0.0138) (-0.0003,0.0138) (-0.0052,0.0065) (0.0235,0.0294)
DMAT 0.0112 0.0107 0.0107 0.011 0.0114
(3.57)*** (3.52)*** (3.47)*** (3.47)*** (3.60)***
(0.0051,0.0174) (0.0046,0.0167) (0.0047,0.0167) (0.0049,0.0170) (0.0055,0.0173)
LBM 0.0833 0.0825 0.0824 0.083 0.0825
(55.99)*** (51.19)*** (52.06)*** (53.34)*** (53.15)***
(0.0800,0.0866) (0.0794,0.0856) (0.0794,0.0854) (0.0798,0.0861) (0.0795,0.0854)
TANGIBILITY 0.1425 0.1615 0.1616 0.1431 0.1381
(19.28)*** (19.70)*** (21.92)*** (19.86)*** (20.87)***
(0.1289,0.1562) (0.1459,0.1771) (0.1466,0.1765) (0.1287,0.1576) (0.1251,0.1512)
INDMEDLEV 0.5389 0.5062 0.506 0.5415 0.5058
(56.97)*** (50.31)*** (50.88)*** (60.68)*** (51.00)***
(0.5203,0.5576) (0.4863,0.5260) (0.4862,0.5258) (0.5230,0.5601) (0.4855,0.5261)
PSRETURN -0.0707 -0.0702 -0.0702 -0.0707 -0.0704
(-34.48)*** (-32.77)*** (-34.09)*** (-33.10)*** (-35.30)***
(-0.0750,-0.0665) (-0.0744,-0.0660) (-0.0742,-0.0662) (-0.0749,-0.0664) (-0.0742,-0.0666)
SHARETURN -0.0037 -0.0036 -0.0035 -0.0037 -0.0037
(-6.04)*** (-5.63)*** (-5.76)*** (-6.18)*** (-6.21)***
(-0.0049,-0.0025) (-0.0048,-0.0023) (-0.0047,-0.0024) (-0.0049,-0.0025) (-0.0049,-0.0026)
ROA 0.0177 0.0124 0.011 0.0154 -0.0041
(3.54)*** (2.22)** (2.03)** (3.21)*** (-0.89)
(0.0078,0.0276) (0.0020,0.0227) (0.0008,0.0212) (0.0060,0.0248) (-0.0132,0.0050)
RETVOL 3.0185 3.0238 3.0224 3.0192 2.921
(40.09)*** (40.06)*** (37.69)*** (37.44)*** (43.24)***
(2.8646,3.1723) (2.8621,3.1854) (2.8730,3.1719) (2.8704,3.1681) (2.7836,3.0584)
DVTAT -0.1703 -0.1843 -0.1843 -0.1692 -0.1936
(-7.19)*** (-7.79)*** (-7.61)*** (-7.20)*** (-7.87)***
(-0.2177,-0.1230) (-0.2321,-0.1366) (-0.2324,-0.1362) (-0.2179,-0.1205) (-0.2429,-0.1443)
RDSALE 0.0003 0.0002 (1.07) (1.02)
(-0.0002,0.0007) (-0.0002,0.0007)
DUNIQUE -0.0045
(-2.25)**
(-0.0084,-0.0005)
CONSTANT 0.0669 -0.0122 -0.012 0.0616 -0.1976
(2.96)*** (-0.30) (-0.29) (2.58)*** (-8.88)***
(0.0199,0.1139) (-0.0927,0.0682) (-0.0943,0.0703) (0.0145,0.1086) (-0.2443,-0.1509)
Year Effects Yes Yes Yes Yes
Industry Effects
Yes Yes
Yes
Sample 36856 36856 36856 36856 36856
R2 0.4366 0.439 0.439 0.4365 0.4372
Prob>F 0.0000 0.0000 0.0000 0.0000 0.0000

34
Panel C: Wooldridge (2002) Instrumental Approach
1 2 3 4 5
LNAUDFEE 0.0468 0.0342 0.0342 0.0455 -0.0032
(8.38)*** (5.08)*** (5.08)*** (8.22)*** (-1.35)
LNTA -0.002 0.0053 0.0053 -0.0011 0.0264
(-0.60) (1.33) (1.33) (-0.34) (17.73)***
DMAT 0.0077 0.0079 0.008 0.0074 0.0116
(2.46)** (2.55)** (2.57)** (2.37)** (3.82)***
LBM 0.0836 0.0825 0.0822 0.0828 0.0825
(52.92)*** (52.73)*** (52.66)*** (52.80)*** (53.61)***
TANGIBILITY 0.1439 0.163 0.1632 0.1449 0.1381
(19.16)*** (20.89)*** (20.87)*** (19.26)*** (20.98)***
INDMEDLEV 0.5414 0.5092 0.5089 0.5456 0.5056
(56.47)*** (49.42)*** (49.39)*** (57.00)*** (49.22)***
PSRETURN -0.0727 -0.0716 -0.0716 -0.0725 -0.0703
(-34.77)*** (-34.30)*** (-34.30)*** (-34.73)*** (-36.48)***
SHARETURN -0.0029 -0.003 -0.003 -0.003 -0.0038
(-4.62)*** (-4.86)*** (-4.82)*** (-4.78)*** (-6.26)***
ROA 0.0189 0.0129 0.0096 0.0134 -0.0039
(3.54)*** (2.33)** (1.89)* (2.76)*** (-0.82)
RETVOL 2.9185 2.952 2.9486 2.9209 2.9269
(36.39)*** (36.69)*** (36.62)*** (36.42)*** (41.58)***
DVTAT -0.1899 -0.1981 -0.1979 -0.1873 -0.1923
(-7.95)*** (-8.20)*** (-8.20)*** (-7.85)*** (-7.85)***
RDSALE 0.0007 0.0006
(2.86)*** (2.33)**
DUNIQUE -0.0077
(-3.79)***
CONSTANT 0.0908 0.0058 0.0064 0.0814 -0.1979
(3.39)*** (0.14) (0.16) (3.09)*** (-8.84)***
Year Effects Yes Yes Yes Yes
Industry Effects
Yes Yes
Yes
N 36856 36856 36856 36856 36856
R2 0.4263 0.4343 0.4343 0.4267 0.4368
Prob>F 0.0000 0.0000 0.0000 0.0000 0.0000

35
Table 7: Audit Pricing and debt-equity choice
This table provides a probit regression analysis explaining the factors that determine the capital structure decision. The dependent
variable is the DISSUE, equals one if debt is issued, and 0 if equity is issued. Independent variables are LNAUDFEE: is logarithm of
audit pricing at the balance sheet date; EXPAUDFEE: predicted value of the audit fee; LNTA: the logarithm of the total assets at the
last balance sheet date; DMAT: is a dummy variable, which takes a value of 1 for firm which is in the COMPUSTAT for more than
5 years and zero otherwise; LBM: Logarithm of book-to-market ratio; ); INDMEDLEV: Leverage ratio computed based on three-
digit SIC code and year; PSRETURN: Cumulative annual past stock return over 12 months period; SHARETURN: Median value of
monthly shares traded (volume) divided by shares outstanding over a 12-month period; ROA: the ratio of earnings before interest,
tax and depreciation to total assets; RETVOL: standard deviation of monthly return calculated for each firm each year;
UNLEVZSCORE: is a unleveraged measure employed by Chang et al. (2009 ; RDSALE: Research and development expenses scaled
by total sales; RDDUMMY: a dummy variable, which takes a value of 1 if R&D expenses are missing and zero otherwise;
CAPEXTA: capital expenditure relates to total assets ;* Significantly different from zero at the 10% level, ** significantly different
from zero at the 5% level, and ***significantly different from zero at the 1% level.
Audit Pricing and Debt Equity choice
1 2 3
LNAUDFEE 0.0736
0.3416
(3.45)***
(3.15)***
EXPAUDFEE 0.3479
(5.21)***
(0.2170,0.4788)
LNTA 0.134 -0.0198 0.0133
(8.03)*** (-0.50) (0.21)
(-0.0981,0.0585)
DMAT 0.239 0.2528 0.11
(6.23)*** (6.65)*** (1.62)
(0.1783,0.3274)
LBM 0.224 0.2221 0.2006
(10.24)*** (10.18)*** (6.19)***
(0.1793,0.2649)
INDMEDLEV 1.0523 1.206 1.7695
(8.09)*** (8.58)*** (6.58)***
(0.9306,1.4813)
PSRETURN -0.2892 -0.2869 -0.2757
(-12.23)*** (-12.01)*** (-7.75)***
(-0.3337,-0.2401)
SHARETURN -0.055 -0.0561 -0.0214
(-6.01)*** (-5.81)*** (-1.38)
(-0.0751,-0.0372)
ROA 0.56 0.6411 0.2182
(8.80)*** (9.59)*** (2.44)**
(0.5101,0.7721)
RETVOL -0.2443 -0.1933 0.2206
(-0.29) (-0.22) (0.18)
(-1.9447,1.5581)
UNLEVZSCORE 0.0000 0.0000 0.0000
(1.71)* (1.09) (0.85)
(-0.0000,0.0000)
RDSALE -0.0133 -0.0142 -0.0114
(-3.93)*** (-4.16)*** (-2.65)***
(-0.0208,-0.0075)
RDDUMMY 0.0283 0.0674 0.1259
(0.85) (1.87)* (2.31)**
(-0.0034,0.1381)
CAPEXTA 0.7707 1.201 3.281
(4.30)*** (5.77)*** (5.19)***
(0.7932,1.6088)
CONSTANT -0.4461 0.7193 0.5582
(-3.09)*** (2.30)** (1.11)
(0.1072,1.3314)
Year Effects Yes Yes Yes
N 10250 10250 10250
Psuedo R2 0.2146 0.2158 chi-squared 1985.579 1942.673 672.7184
Prob>F 0.0000 0.0000 0.0000