ATWOOD OCEANICS, INC. - AnnualReports.com€¦ · THE COMPANY This Annual Report is for Atwood...
47
ATWOOD OCEANICS, INC. 2006 ANNUAL REPORT
Transcript of ATWOOD OCEANICS, INC. - AnnualReports.com€¦ · THE COMPANY This Annual Report is for Atwood...

ATWOOD OCEANICS, INC.
2006 ANNUAL REPORT

2006 ANNUAL REPORT TO SHAREHOLDERSTHE COMPANY
This Annual Report is for Atwood Oceanics, Inc. and its subsidiaries, which
are collectively referred to as “we”, “our”, or the “Company” except where stated
otherwise. We are engaged in the international offshore drilling and completion of
exploratory and developmental oil and gas wells and related support, manage-
ment and consulting services. Presently, we own and operate a premium, modern
fleet of eight mobile offshore drilling units and manage the operations of two
operator-owned platform drilling units currently located in Northwest Australia.
Since fiscal year 1997, we invested approximately $510 million in upgrading
seven mobile offshore drilling units and constructing an ultra-premium jack-up
unit, the ATWOOD BEACON. Upon its expected delivery on or before September
2008, the ATWOOD AURORA will be our ninth active mobile offshore drilling unit.
We support our operations from our Houston headquarters and offices currently
located in Australia, Malaysia, Malta, Egypt, Indonesia, Singapore and the United
Kingdom.
FINANCIAL HIGHLIGHTS
2006 2005
(In Thousands)
FOR THE YEAR ENDED SEPTEMBER 30:
REVENUES $276,625 $176,156
NET INCOME 86,122 26,011
CAPITAL EXPENDITURES 78,464 25,563
AT SEPTEMBER 30:
NET PROPERTY AND EQUIPMENT $436,166 $390,778
TOTAL ASSETS 593,829 495,694
TOTAL SHAREHOLDERS’ EQUITY 458,894 362,137
%%TRANSMSG*** Transmitting Job: H41700 PCN: 001000000 ***%%PCMSG| |00004|Yes|No|12/19/2006 02:47|0|0|Page is valid, no graphics -- Color: D|
2
0
40
80
120
160
200
240
280
2004 2005 200620032002
0.0
12.5
25.0
37.5
50.0
62.5
75.0
87.5
100.0
2004 200520032002 2006-15
0
15
30
45
60
75
90
2004 200520032002 2006
0
10
20
30
40
50
60
70
80
90
100
110
2004 200520032002 2006
CONTRACT REVENUES($ MILLIONS)
NET INCOME (LOSS)($ MILLIONS)
CAPITAL EXPENDITURES($ MILLIONS)
OPERATING INCOME($ MILLIONS)
PRESIDENTS MESSAGE
TO OUR SHAREHOLDERS AND EMPLOYEES:
We are pleased to report revenues, operating cash flows and net income for fiscal year 2006 were thehighest in our thirty-nine year history. Our net income of $86 million, or $2.74 per diluted share, was morethan twice our previous record net income in fiscal year 1998.
Fiscal year 2006 ends with the Company in a strong position for the future. Our fleet utilization for thefiscal year was 100% and there were a number of accomplishments during the fiscal year in other key areas.Our contract backlog in terms of available rig days for our eight units, all contracted at historically highdayrates, is approximately 95% for fiscal year 2007, 80% for fiscal year 2008 and 40% for fiscal year 2009. Thiscontract backlog provides strong upside visibility for fiscal year 2007 and further upside potential beyondfiscal year 2007, particularly with our deepwater and international jack-up leverage and with the ATWOODHUNTER, ATWOOD SOUTHERN CROSS and RICHMOND contracts repricing in fiscal year 2008. Also,this year, our future visibility is enhanced with the change from well or well-to-well contracts to termcontracts on the VICKSBURG, ATWOOD HUNTER, ATWOOD FALCON, SEAHAWK and ATWOODBEACON. The ATWOOD SOUTHERN CROSS has a contract that continues into fiscal year 2008, and theATWOOD EAGLE has a two-year contract at a high dayrate, currently estimated to commence in the firstquarter of fiscal year 2009. Our new, ultra-premium jack-up, the ATWOOD AURORA, scheduled for deliveryon or before September 2008, will offer growth potential when it commences operation as our ninth ownedoffshore drilling unit. Our remaining unit, the RICHMOND, is operating in the U.S. Gulf of Mexico. TheRICHMOND has operated profitably in the Gulf of Mexico for many years.
We continue to focus daily on safe, high standards of performance, our people and the continuingdevelopment of our organization for the future. Our safety and operational performance this fiscal year hasbeen recognized by many of our clients.
The Company also continued its fleet upgrade, enhancement and new construction program during theyear with the successful completion of three shipyard update projects (the ATWOOD SOUTHERN CROSS,SEAHAWK and ATWOOD FALCON). Total expenditures of approximately $50 million for these projectsbrought our total project expenditures, since 1997, for fleet upgrade, renewal and construction completed, toover $500 million. Construction of our new, ultra-premium jack-up, the ATWOOD AURORA, also com-menced this year.
We are pleased with the Company’s current position: a strong balance sheet with a current debt to totalcapitalization ratio of approximately 12% and a continuing trend for improvements in cash flows and financialresults at historic levels. The demand by our clients for the services and equipment that our Companyprovides continues at a high level. Our strategy of focusing on safe, quality operations, premium equipment,long-standing client relationships, and being leveraged to attractive international markets has served uswell — and we believe will serve us well in the future.
We are in a position to be opportunistic, when the time is right, and, accordingly, continue to pursueand explore other future opportunities, as well as evaluating the best use of future cash flow balances.
As always, we thank our shareholders for their confidence and our employees for their many contribu-tions and achievements during fiscal year 2006, and we look forward to fiscal year 2007.
JOHN R. IRWIN
3
%%TRANSMSG*** Transmitting Job: H41700 PCN: 002000000 ***%%PCMSG|3 |00004|Yes|No|12/14/2006 11:28|0|0|Page/graphics valid 12/14/2006 11:29 -- Color: D|

4
RICHMOND
SEAHAWK
ATWOOD SOUTHERN CRO
ATWOOD HUNTER
Corporate Headquarters
Office / Shorebase
Rig
Legend
C
Malta
Great
WORLD WIDE
* Rig locations are as of December 12, 2006.
**The rig is being mobilized to India with estimated arrival before the end of December 2006.

5
ATWOOD EAGLE
VICKSBURG
ATWOOD FALCON
SS
ATWOOD BEACON**
Jakarta
Kuala Lumpur
Singapore
Perth
NORTH RANKIN ‘A’
GOODWYN ‘A’
Cairo
t Yarmouth
OPERATIONS*
6
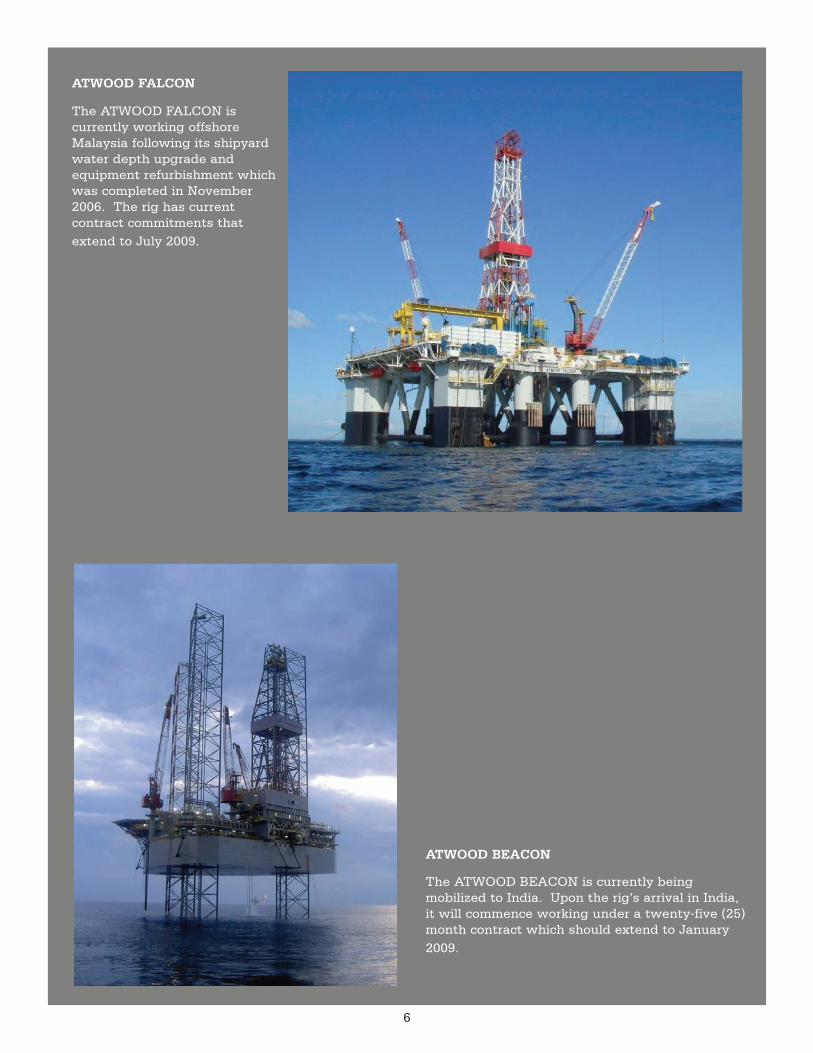
ATWOOD BEACON
The ATWOOD BEACON is currently beingmobilized to India. Upon the rig’s arrival in India,it will commence working under a twenty-five (25)month contract which should extend to January2009.
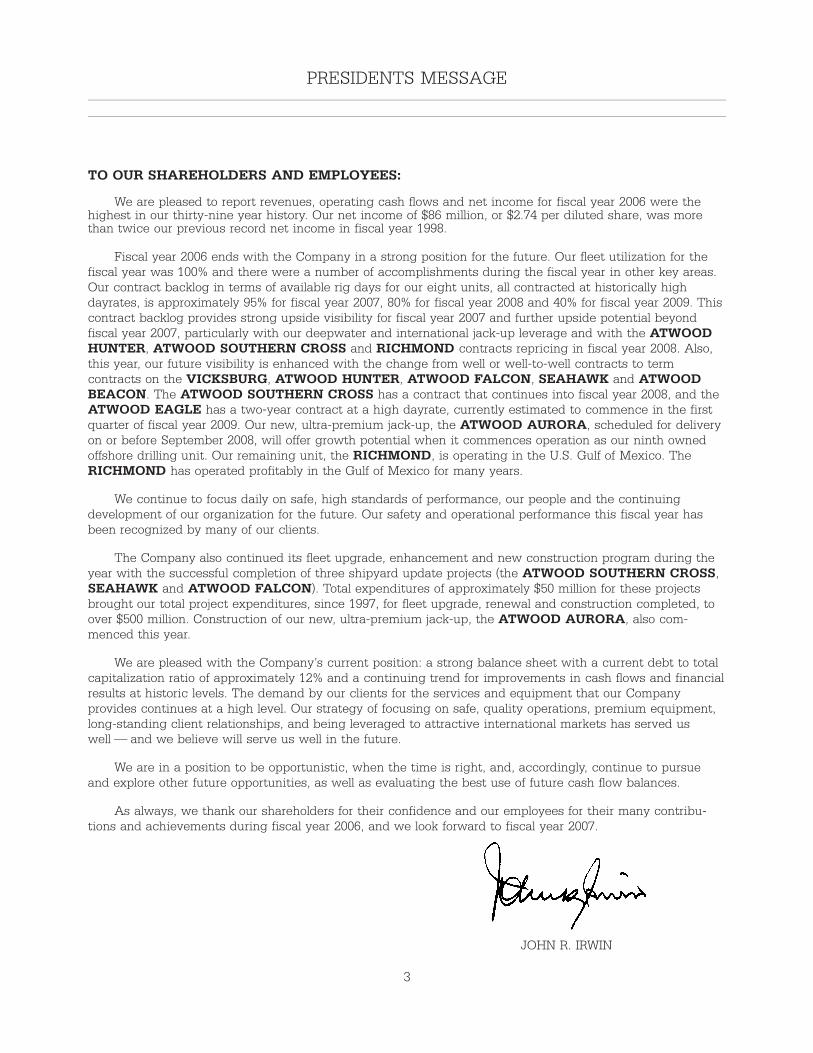
ATWOOD FALCON
The ATWOOD FALCON iscurrently working offshoreMalaysia following its shipyardwater depth upgrade andequipment refurbishment whichwas completed in November2006. The rig has currentcontract commitments thatextend to July 2009.

7
ATWOOD SEAHAWK
The SEAHAWK is currently working offshore Equatorial Guinea following its shipyard upgrade andrelocation from Southeast Asia. The rig has a current contract commitment that extends through fiscal
year 2008 and, if all options are exercised, could extend through fiscal year 2010.

Atwood Oceanics, Inc. and Subsidiaries
FIVE YEAR FINANCIAL REVIEW
(In thousands, except per share amounts, fleetdata and ratios) 2006 2005 2004 2003 2002
At or For the Years Ended September 30,
STATEMENTS OF OPERATIONS DATA:Revenues . . . . . . . . . . . . . . . . . . . . . . . . . . . . $ 276,625 $ 176,156 $163,454 $144,765 $149,157Contract drilling costs . . . . . . . . . . . . . . . . . . (144,366) (102,849) (98,936) (98,500) (75,088)Depreciation. . . . . . . . . . . . . . . . . . . . . . . . . . (26,401) (26,735) (31,582) (25,758) (23,882)General and administrative expenses . . . . . . (20,630) (14,245) (11,389) (14,015) (10,080)Gain on sale of equipment . . . . . . . . . . . . . . 10,548 — — — —
OPERATING INCOME . . . . . . . . . . . . . . . . . . 95,776 32,327 21,547 6,492 40,107Other expense . . . . . . . . . . . . . . . . . . . . . . . . (3,940) (6,719) (9,145) (4,856) (1,330)Tax (provision) benefit . . . . . . . . . . . . . . . . . . (5,714) 403 (4,815) (14,438) (10,492)
NET INCOME (LOSS). . . . . . . . . . . . . . . $ 86,122 $ 26,011 $ 7,587 $ (12,802) $ 28,285
PER SHARE DATA(1):Earnings (loss) per common share:
Basic . . . . . . . . . . . . . . . . . . . . . . . . . . . . . . $ 2.78 $ 0.86 $ 0.27 $ (0.46) $ 1.02Diluted . . . . . . . . . . . . . . . . . . . . . . . . . . . . $ 2.74 $ 0.83 $ 0.27 $ (0.46) $ 1.01
Average common shares outstanding:Basic . . . . . . . . . . . . . . . . . . . . . . . . . . . . . . 30,936 30,412 27,718 27,692 27,678Diluted . . . . . . . . . . . . . . . . . . . . . . . . . . . . 31,442 31,220 28,064 27,692 27,988
FLEET DATA:Number of rigs owned or managed, at end
of period . . . . . . . . . . . . . . . . . . . . . . . . . . . 10 11 11 11 10Utilization rate for in-service rigs(2) . . . . . . . 100% 98% 93% 92% 86%
BALANCE SHEET DATA:Cash and cash equivalents . . . . . . . . . . . . . . $ 32,276 $ 18,982 $ 16,416 $ 21,551 $ 27,655Working capital . . . . . . . . . . . . . . . . . . . . . . . 86,308 35,894 32,913 26,063 43,735Net property and equipment . . . . . . . . . . . . . 436,166 390,778 401,141 443,102 368,397Total assets . . . . . . . . . . . . . . . . . . . . . . . . . . 593,829 495,694 498,936 522,674 445,238Total long-term debt (including current
portion) . . . . . . . . . . . . . . . . . . . . . . . . . . . . 64,000 90,000 181,000 205,000 115,000Shareholders’ equity(3)(4) . . . . . . . . . . . . . . . 458,894 362,137 271,589 263,467 276,133Ratio of current assets to current
liabilities . . . . . . . . . . . . . . . . . . . . . . . . . . . 2.41 1.64 1.55 1.52 2.44
Notes —(1) Fiscal years 2005, 2004, 2003 and 2002 have been restated to reflect a two-for-one stock
split effected on March 2, 2006. See Note 7 to the consolidated financial statements forfurther discussion.
(2) Excludes managed rigs, the SEASCOUT (sold in fiscal year 2006), and contractual downtimeon rigs upgraded.
(3) We have never paid any cash dividends on our common stock.
(4) In October 2004, we sold 2,350,000 shares of common stock in a public offering.
8
%%TRANSMSG*** Transmitting Job: H41700 PCN: 003000000 ***%%PCMSG|8 |00004|Yes|No|12/18/2006 18:47|0|0|Page is valid, no graphics -- Color: D|

OFF
SHO
RE
DR
ILLI
NG
OPE
RA
TIO
NS
Rig
Nam
eY
ear
Up
gra
ded
Max
imu
mW
ater
Dep
th
Per
cen
tag
eof
FY
2006
Rev
enu
es
Loc
atio
nat
Dec
emb
er12
,20
06C
ust
omer
Con
trac
tS
tatu
sat
Dec
emb
er12
,20
06
SE
MIS
UB
ME
RS
IBL
ES
—A
TW
OO
DE
AG
LE20
00/2
002
5,00
0Ft
.17
%O
ffsho
reA
ustr
alia
BH
PB
ILLI
TO
NPE
TR
OLE
UM
PTY
(‘‘B
HPB
”)
The
rig
iscu
rren
tlyw
orki
ngun
der
adr
illin
gpr
ogra
mfo
rB
HPB
whi
chco
uld
exte
nd,i
fal
lopt
ion
wel
lsar
edr
illed
,to
Nov
embe
r20
07.
Upo
nco
mpl
etio
nof
this
drill
ing
com
mit
men
t,th
eri
gha
sa
one
(1)
wel
lcon
trac
tco
mm
itm
ent
wit
hE
NI
Aus
tral
iaB
V,fo
llow
edby
atw
o(2
)ye
arco
ntra
ctco
mm
itm
ent
wit
hW
oods
ide
Ene
rgy,
Ltd.
Itsh
ould
take
unti
lDec
embe
r20
09be
fore
thes
edr
illin
gco
mm
itm
ents
are
com
plet
ed.
AT
WO
OD
HU
NT
ER
1997
/200
15,
000
Ft.
23%
Offs
hore
Mau
rita
nia
WO
OD
SID
EE
NE
RG
Y,LT
D.
(‘‘W
OO
DSI
DE
”)
The
rig
iscu
rren
tlyw
orki
ngun
der
adr
illin
gpr
ogra
mfo
rW
oods
ide
whi
chex
tend
sto
Apr
il20
08.
AT
WO
OD
FALC
ON
1998
/200
65,
000
Ft.
11%
Offs
hore
Mal
aysi
aSA
RA
WA
KSH
ELL
BE
RH
AD
(‘‘SH
ELL
”)
The
rig
iscu
rren
tlyw
orki
ngun
der
alo
ng-t
erm
drill
ing
com
mit
men
tw
ith
Shel
lwhi
chex
tend
sto
July
2009
.
AT
WO
OD
SOU
TH
ER
NC
RO
SS19
97/2
006
2,00
0Ft
.11
%O
ffsho
reTu
rkey
TO
RE
AD
OR
TU
RK
EY
LIM
ITE
D(‘‘
TO
RE
AD
OR
”)A
ND
ME
LRO
SER
ESO
UR
CE
S(‘‘
ME
LRO
SE”)
The
rig
iscu
rren
tlyw
orki
ngun
der
drill
ing
com
mit
men
tsfo
rsi
x(6
)w
ells
plus
two
(2)
opti
ons
for
Tore
ador
and
Mel
rose
whi
chco
uld
take
unti
lJul
y20
07to
com
plet
e.Fo
llow
ing
com
plet
ion
ofth
ese
com
mit
men
ts,
the
rig
has
drill
ing
com
mit
men
tsin
the
Bla
ckSe
afo
rTu
rkiy
ePe
trol
leri
A.O
.and
Van
cow
hich
coul
dex
tend
toA
pril
2008
.
CA
NT
ILE
VE
RJA
CK
-UP
S—
AT
WO
OD
BE
AC
ON
Con
stru
cted
in20
0340
0Ft
.12
%M
obili
zing
toIn
dia
GU
JAR
AT
STA
TE
PET
RO
LEU
MC
OR
POR
AT
ION
LTD
.(‘‘
GSP
C”)
The
rig
iscu
rren
tlybe
ing
mob
ilize
dto
Indi
ato
com
men
cea
twen
ty-f
ive
(25)
mon
thco
ntra
ctfo
rG
SPC
.
VIC
KSB
UR
G19
9830
0Ft
.11
%O
ffsho
reT
haila
ndC
HE
VR
ON
OV
ER
SEA
SPE
TR
OLE
UM
(‘‘C
HE
VR
ON
”)
The
rig
iscu
rren
tlyw
orki
ngun
der
alo
ng-t
erm
drill
ing
com
mit
men
tfo
rC
hevr
onw
hich
will
exte
ndto
June
2009
.
AT
WO
OD
AU
RO
RA
Und
erC
onst
ruct
ion
400
Ft.
0%N
/AN
/AT
heri
gis
unde
rco
nstr
ucti
onin
Bro
wns
ville
,Te
xas
wit
hex
pect
edco
mpl
etio
non
orbe
fore
Sept
embe
r20
08.
SU
BM
ER
SIB
LE
—R
ICH
MO
ND
2000
/200
270
Ft.
7%U
.S.
Gul
fof
Mex
ico
HE
LIS
OIL
&G
AS
(‘‘H
ELI
S”)
The
rig
iscu
rren
tlyw
orki
ngfo
rH
elis
unde
ra
cont
ract
whi
chco
uld
exte
ndto
May
/Jun
e20
07.
9
%%TRANSMSG*** Transmitting Job: H41700 PCN: 004000000 ***%%PCMSG|9 |00010|Yes|No|12/19/2006 21:48|0|0|Page is valid, no graphics -- Color: D|

Rig
Nam
eY
ear
Up
gra
ded
Max
imu
mW
ater
Dep
th
Per
cen
tag
eof
FY
2006
Rev
enu
es
Loc
atio
nat
Dec
emb
er12
,20
06C
ust
omer
Con
trac
tS
tatu
sat
Dec
emb
er12
,20
06
SE
MIS
UB
ME
RS
IBL
ET
EN
DE
RA
SS
IST
UN
IT—
SEA
HA
WK
1992
/199
9/20
0660
0Ft
.4%
Offs
hore
Equ
ator
ial
Gui
nea
AM
ER
AD
AH
ESS
EQ
UA
TO
RIA
LG
UIN
EA
,IN
C.
(‘‘H
ESS
”)
The
rig
iscu
rren
tlyw
orki
ngun
der
atw
o-ye
arco
ntra
ctua
lco
mm
itm
ent
wit
hH
ess
whi
chex
tend
sto
Sept
embe
r20
08.
Hes
sal
soha
sfo
ur(4
)si
x-m
onth
opti
ons.
MO
DU
LA
RP
LA
TF
OR
MS
—
MA
NA
GE
ME
NT
CO
NT
RA
CT
GO
OD
WY
N‘A
’an
dN
OR
TH
RA
NK
IN‘A
’N
/A4%
*A
ustr
alia
WO
OD
SID
EB
oth
the
GO
OD
WY
N‘A
’an
dN
OR
TH
RA
NK
IN‘A
’ar
eid
lew
ith
plan
ned
brea
ksin
drill
ing
acti
vity
.We
are
curr
ently
prov
idin
gri
gm
aint
enan
cese
rvic
esto
thes
eri
gs.
*F
orb
oth
un
its,
coll
ecti
vel
y.
10
%%TRANSMSG*** Transmitting Job: H41700 PCN: 005000000 ***%%PCMSG|10 |00007|Yes|No|12/18/2006 18:47|0|0|Page is valid, no graphics -- Color: D|

SECURITIES LITIGATION SAFE HARBOR STATEMENT
Statements included in this report which arenot historical facts (including any statementsconcerning plans and objectives of managementfor future operations or economic performance, orassumptions related thereto) are “forward-lookingstatements” within the meaning of the PrivateSecurities Litigation Reform Act of 1995. In addi-tion, we and our representatives may from totime to time make other oral or written state-ments which are also forward-looking statements.
These forward-looking statements are madebased upon management’s current plans, expec-tations, estimates, assumptions and beliefs con-cerning future events impacting us and thereforeinvolve a number of risks and uncertainties. Wecaution that forward-looking statements are notguarantees and that actual results could differmaterially from those expressed or implied in theforward-looking statements.
Important factors that could cause our actualresults of operations or our actual financial condi-tions to differ include, but are not necessarilylimited to:
• our dependence on the oil and gasindustry;
• the operational risks involved in drilling foroil and gas;
• changes in rig utilization and dayrates inresponse to the level of activity in the oiland gas industry, which is significantlyaffected by indications and expectationsregarding the level and volatility of oil andgas prices, which in turn are affected bysuch things as political, economic andweather conditions affecting or potentiallyaffecting regional or worldwide demandfor oil and gas, actions or anticipatedactions by OPEC, inventory levels, deliver-ability constraints, and future marketactivity;
• the extent to which customers and poten-tial customers continue to pursue deepwa-ter drilling;
• exploration success or lack of explorationsuccess by our customers and potentialcustomers;
• the highly competitive and cyclical natureof our business, with periods of lowdemand and excess rig availability;
• the impact of the war with Iraq or othermilitary operations, terrorist acts or embar-goes elsewhere;
• our ability to enter into and the terms offuture drilling contracts;
• the availability of qualified personnel;
• our failure to retain the business of one ormore significant customers;
• the termination or renegotiation of con-tracts by customers;
• the availability of adequate insurance at areasonable cost;
• the occurrence of an uninsured loss;
• the risks of international operations,including possible economic, political,social or monetary instability, and compli-ance with foreign laws;
• the effect public health concerns couldhave on our international operations andfinancial results;
• compliance with or breach of environmen-tal laws;
• the incurrence of secured debt or addi-tional unsecured indebtedness or otherobligations by us or our subsidiaries;
• the adequacy of sources of liquidity;
• currently unknown rig repair needs and/oradditional opportunities to accelerateplanned maintenance expenditures due topresently unanticipated rig downtime;
• higher than anticipated accruals for perfor-mance-based compensation due to betterthan anticipated performance by us,higher than anticipated severance
11
%%TRANSMSG*** Transmitting Job: H41700 PCN: 006000000 ***%%PCMSG|11 |00003|Yes|No|12/14/2006 11:28|0|0|Page is valid, no graphics -- Color: D|

expenses due to unanticipated employeeterminations, higher than anticipated legaland accounting fees due to unanticipatedfinancing or other corporate transactions,and other factors that could increase gen-eral and administrative expenses;
• the actions of our competitors in the off-shore drilling industry, which could signif-icantly influence rig dayrates andutilization;
• changes in the geographic areas in whichour customers plan to operate, which inturn could change our expected effectivetax rate;
• changes in oil and gas drilling technologyor in our competitors’ drilling rig fleetsthat could make our drilling rigs less com-petitive or require major capital invest-ments to keep them competitive;
• rig availability;
• the effects and uncertainties of legal andadministrative proceedings and othercontingencies;
• the impact of governmental laws and reg-ulations and the uncertainties involved intheir administration, particularly in someforeign jurisdictions;
• changes in accepted interpretations ofaccounting guidelines and other account-ing pronouncements and tax laws;
• the risks involved in the construction,upgrade, and repair of our drillingunits; and
• such other factors as may be discussed inour reports filed with the Securities andExchange Commission, or SEC.
These factors are not necessarily all of theimportant factors that could cause actual resultsto differ materially from those expressed in any ofour forward-looking statements. Other unknownor unpredictable factors could also have materialadverse effects on future results. The words“believe,” “impact,” “intend,” “estimate,” “antici-pate,” “plan” and similar expressions identify for-ward-looking statements. These forward-lookingstatements are found at various places through-out this report. When considering any forward-looking statement, you should also keep in mindthe risk factors described in our Form 10-K forthe year ended September 30, 2006, particularlyin Item 1A Risk Factors, to which this AnnualReport is an exhibit, and in other reports orfilings we make with the SEC from time to time.Undue reliance should not be placed on theseforward-looking statements, which are applicableonly on the date hereof. Neither we nor ourrepresentatives have a general obligation torevise or update these forward-looking state-ments to reflect events or circumstances thatarise after the date hereof or to reflect the occur-rence of unanticipated events.
12
%%TRANSMSG*** Transmitting Job: H41700 PCN: 007000000 ***%%PCMSG|12 |00006|Yes|No|12/14/2006 08:59|0|0|Page is valid, no graphics -- Color: D|
MANAGEMENT’S DISCUSSION AND ANALYSISOF FINANCIAL CONDITION AND RESULTS OF OPERATIONS
OUTLOOK
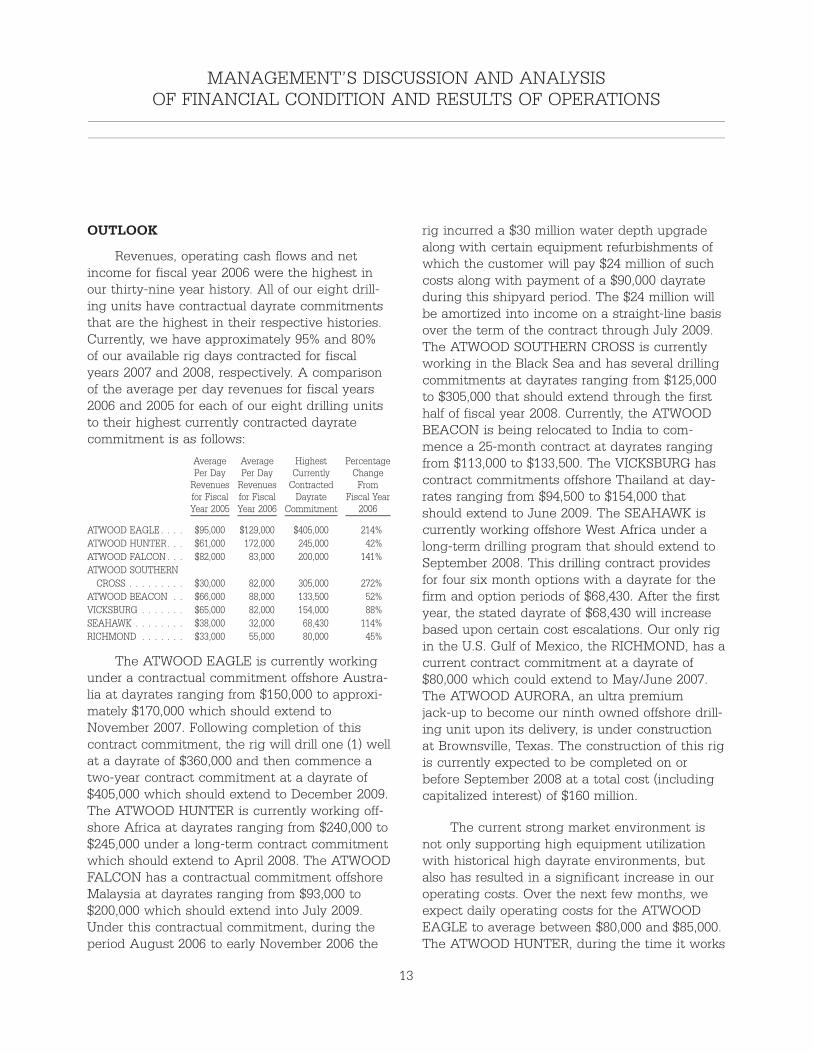
Revenues, operating cash flows and netincome for fiscal year 2006 were the highest inour thirty-nine year history. All of our eight drill-ing units have contractual dayrate commitmentsthat are the highest in their respective histories.Currently, we have approximately 95% and 80%of our available rig days contracted for fiscalyears 2007 and 2008, respectively. A comparisonof the average per day revenues for fiscal years2006 and 2005 for each of our eight drilling unitsto their highest currently contracted dayratecommitment is as follows:
AveragePer Day
Revenuesfor FiscalYear 2005
AveragePer Day
Revenuesfor FiscalYear 2006
HighestCurrently
ContractedDayrate
Commitment
PercentageChange
FromFiscal Year
2006
ATWOOD EAGLE . . . . $95,000 $129,000 $405,000 214%ATWOOD HUNTER. . . $61,000 172,000 245,000 42%ATWOOD FALCON . . . $82,000 83,000 200,000 141%ATWOOD SOUTHERN
CROSS . . . . . . . . . $30,000 82,000 305,000 272%ATWOOD BEACON . . $66,000 88,000 133,500 52%VICKSBURG . . . . . . . $65,000 82,000 154,000 88%SEAHAWK . . . . . . . . $38,000 32,000 68,430 114%RICHMOND . . . . . . . $33,000 55,000 80,000 45%
The ATWOOD EAGLE is currently workingunder a contractual commitment offshore Austra-lia at dayrates ranging from $150,000 to approxi-mately $170,000 which should extend toNovember 2007. Following completion of thiscontract commitment, the rig will drill one (1) wellat a dayrate of $360,000 and then commence atwo-year contract commitment at a dayrate of$405,000 which should extend to December 2009.The ATWOOD HUNTER is currently working off-shore Africa at dayrates ranging from $240,000 to$245,000 under a long-term contract commitmentwhich should extend to April 2008. The ATWOODFALCON has a contractual commitment offshoreMalaysia at dayrates ranging from $93,000 to$200,000 which should extend into July 2009.Under this contractual commitment, during theperiod August 2006 to early November 2006 the
rig incurred a $30 million water depth upgradealong with certain equipment refurbishments ofwhich the customer will pay $24 million of suchcosts along with payment of a $90,000 dayrateduring this shipyard period. The $24 million willbe amortized into income on a straight-line basisover the term of the contract through July 2009.The ATWOOD SOUTHERN CROSS is currentlyworking in the Black Sea and has several drillingcommitments at dayrates ranging from $125,000to $305,000 that should extend through the firsthalf of fiscal year 2008. Currently, the ATWOODBEACON is being relocated to India to com-mence a 25-month contract at dayrates rangingfrom $113,000 to $133,500. The VICKSBURG hascontract commitments offshore Thailand at day-rates ranging from $94,500 to $154,000 thatshould extend to June 2009. The SEAHAWK iscurrently working offshore West Africa under along-term drilling program that should extend toSeptember 2008. This drilling contract providesfor four six month options with a dayrate for thefirm and option periods of $68,430. After the firstyear, the stated dayrate of $68,430 will increasebased upon certain cost escalations. Our only rigin the U.S. Gulf of Mexico, the RICHMOND, has acurrent contract commitment at a dayrate of$80,000 which could extend to May/June 2007.The ATWOOD AURORA, an ultra premiumjack-up to become our ninth owned offshore drill-ing unit upon its delivery, is under constructionat Brownsville, Texas. The construction of this rigis currently expected to be completed on orbefore September 2008 at a total cost (includingcapitalized interest) of $160 million.
The current strong market environment isnot only supporting high equipment utilizationwith historical high dayrate environments, butalso has resulted in a significant increase in ouroperating costs. Over the next few months, weexpect daily operating costs for the ATWOODEAGLE to average between $80,000 and $85,000.The ATWOOD HUNTER, during the time it works
13
%%TRANSMSG*** Transmitting Job: H41700 PCN: 008000000 ***%%PCMSG|13 |00010|Yes|No|12/18/2006 18:47|0|0|Page is valid, no graphics -- Color: D|

offshore Mauritania and Libya, is expected toincur daily operating costs between $55,000 and$60,000; however, costs could be higher duringany relocation period or during any period whenthe rig is undergoing required inspections. TheATWOOD HUNTER is expected to be off dayratefor ten to fourteen days in December 2006 forrequired regulatory inspections and maintenance.Operating costs during this period could averagebetween $60,000 and $65,000 per day. We expectthat the ATWOOD FALCON will incur averagedaily operating costs between $45,000 and$50,000 while working offshore Malaysia; how-ever, costs will be significantly higher during thefirst quarter of fiscal year 2007 ($85,000 to$95,000 per day) due to expensing certain costsincurred during the period the rig was in theshipyard undergoing its water depth upgrade.The ATWOOD SOUTHERN CROSS is alsoexpected to have average daily operating costs inthe Black Sea between $45,000 and $50,000; how-ever, during the rig’s relocation to the Black Seaduring October 2006, operating costs wereexpected to average around $60,000 per day.Operating costs for our bottom supported drillingunits (ATWOOD BEACON, VICKSBURG, andRICHMOND) should average between $30,000and $35,000 per day. The SEAHAWK is expectedto incur operating costs between $60,000 and$65,000 per day while working offshore EquatorialGuinea; however, these figures include anapproximate $16,000 per day amortization of cer-tain deferred costs on a straight-line basis overthe life of the applicable drilling contract whichwill be more than offset by the amortization ofrelated deferred fees of approximately $19,000 perday which are also recognized and earned on astraight-line basis over the life of the contract.Operating costs will vary for all rigs dependingupon each rig’s specific operating activities. Forexample, cost may increase when a rig is beingrelocated to a new drilling location, when a rig isundergoing required inspection or when a rig isundergoing extraordinary maintenance or equip-ment replacement.
Despite the increase in operating costs forfiscal year 2006, our operating results signifi-cantly increased for fiscal year 2006 compared tofiscal year 2005. Although we anticipate a con-tinuing trend for increases in operating costsduring the next fiscal year, with our backlog ofcontracted days providing increasing revenueexpectations, we anticipate that revenues, oper-ating cash flows and earnings for fiscal years2007 and 2008 will reflect a significant improve-ment over fiscal year 2006 operating results andare expected to be the highest in our history.
RESULTS OF OPERATIONS
Fiscal Year 2006 Versus Fiscal Year 2005
Revenues for fiscal year 2006 increased 57%compared to the prior fiscal year. A comparativeanalysis of revenues by rig for fiscal years 2006and 2005 is as follows:
Fiscal2006
Fiscal2005 Variance
REVENUES(In millions)
ATWOOD HUNTER. . . . . . . . . $ 62.8 $ 22.1 $ 40.7ATWOOD SOUTHERN
CROSS . . . . . . . . . . . . . . . . 29.9 10.8 19.1ATWOOD EAGLE . . . . . . . . . . 47.0 34.6 12.4RICHMOND . . . . . . . . . . . . . . 20.2 11.9 8.3ATWOOD BEACON . . . . . . . . 32.1 24.2 7.9AUSTRALIA MANAGEMENT
CONTRACTS . . . . . . . . . . . 12.9 5.2 7.7VICKSBURG . . . . . . . . . . . . . . 30.0 23.6 6.4ATWOOD FALCON . . . . . . . . . 30.1 29.8 0.3SEAHAWK . . . . . . . . . . . . . . . 11.6 13.9 (2.3)
$276.6 $176.1 $100.5
The increase in fleetwide revenues is prima-rily attributable to the increase in average day-rates due to improving market conditions andstrong demand for offshore drilling equipment asnoted in Market Outlook. Thus, unless otherwisenoted below, the increase in revenues for eachrig is due to the increases in contractual dayratesin fiscal year 2006 compared to fiscal year 2005.
During the last quarter of fiscal year 2005,the ATWOOD SOUTHERN CROSS was relocated
14
%%TRANSMSG*** Transmitting Job: H41700 PCN: 009000000 ***%%PCMSG|14 |00010|Yes|No|12/18/2006 18:47|0|0|Page is valid, no graphics -- Color: D|
from Southeast Asia to the Mediterranean Seawith no revenues being realized during this relo-cation period. This relocation resulted in earnedmobilization fees for the ATWOOD SOUTHERNCROSS increasing from $0.8 million in fiscal year2005 to $8.1 million in fiscal year 2006, which,along with increases in contracted dayratesaccounts for its increase in revenues. Increasesin revenues for the ATWOOD HUNTER,ATWOOD EAGLE, VICKSBURG, ATWOOD BEA-CON, ATWOOD FALCON and the RICHMONDwere related to each of these drilling units work-ing under higher dayrate contracts in fiscal year2006 compared to fiscal year 2005. The increasein revenues from the AUSTRALIA MANAGE-MENT CONTRACTS was due to one of thesemanaged rigs returning to active drilling. Thedecline in revenues for the SEAHAWK was dueto the unit being upgraded in fiscal year 2006,with no revenues being realized during thisupgrade period.
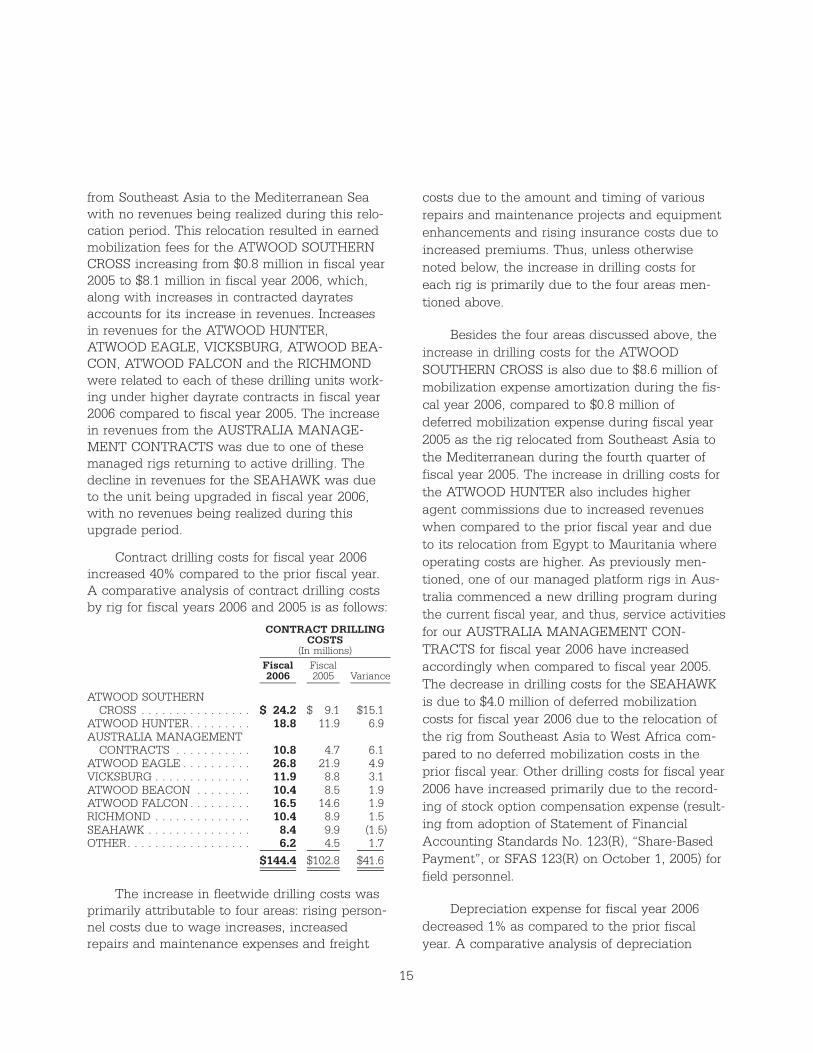
Contract drilling costs for fiscal year 2006increased 40% compared to the prior fiscal year.A comparative analysis of contract drilling costsby rig for fiscal years 2006 and 2005 is as follows:
Fiscal2006
Fiscal2005 Variance
(In millions)
CONTRACT DRILLINGCOSTS
ATWOOD SOUTHERNCROSS . . . . . . . . . . . . . . . . $ 24.2 $ 9.1 $15.1
ATWOOD HUNTER. . . . . . . . . 18.8 11.9 6.9AUSTRALIA MANAGEMENT
CONTRACTS . . . . . . . . . . . 10.8 4.7 6.1ATWOOD EAGLE . . . . . . . . . . 26.8 21.9 4.9VICKSBURG . . . . . . . . . . . . . . 11.9 8.8 3.1ATWOOD BEACON . . . . . . . . 10.4 8.5 1.9ATWOOD FALCON . . . . . . . . . 16.5 14.6 1.9RICHMOND . . . . . . . . . . . . . . 10.4 8.9 1.5SEAHAWK . . . . . . . . . . . . . . . 8.4 9.9 (1.5)OTHER. . . . . . . . . . . . . . . . . . 6.2 4.5 1.7
$144.4 $102.8 $41.6
The increase in fleetwide drilling costs wasprimarily attributable to four areas: rising person-nel costs due to wage increases, increasedrepairs and maintenance expenses and freight
costs due to the amount and timing of variousrepairs and maintenance projects and equipmentenhancements and rising insurance costs due toincreased premiums. Thus, unless otherwisenoted below, the increase in drilling costs foreach rig is primarily due to the four areas men-tioned above.
Besides the four areas discussed above, theincrease in drilling costs for the ATWOODSOUTHERN CROSS is also due to $8.6 million ofmobilization expense amortization during the fis-cal year 2006, compared to $0.8 million ofdeferred mobilization expense during fiscal year2005 as the rig relocated from Southeast Asia tothe Mediterranean during the fourth quarter offiscal year 2005. The increase in drilling costs forthe ATWOOD HUNTER also includes higheragent commissions due to increased revenueswhen compared to the prior fiscal year and dueto its relocation from Egypt to Mauritania whereoperating costs are higher. As previously men-tioned, one of our managed platform rigs in Aus-tralia commenced a new drilling program duringthe current fiscal year, and thus, service activitiesfor our AUSTRALIA MANAGEMENT CON-TRACTS for fiscal year 2006 have increasedaccordingly when compared to fiscal year 2005.The decrease in drilling costs for the SEAHAWKis due to $4.0 million of deferred mobilizationcosts for fiscal year 2006 due to the relocation ofthe rig from Southeast Asia to West Africa com-pared to no deferred mobilization costs in theprior fiscal year. Other drilling costs for fiscal year2006 have increased primarily due to the record-ing of stock option compensation expense (result-ing from adoption of Statement of FinancialAccounting Standards No. 123(R), “Share-BasedPayment”, or SFAS 123(R) on October 1, 2005) forfield personnel.
Depreciation expense for fiscal year 2006decreased 1% as compared to the prior fiscalyear. A comparative analysis of depreciation
15
%%TRANSMSG*** Transmitting Job: H41700 PCN: 010000000 ***%%PCMSG|15 |00014|Yes|No|12/18/2006 18:47|0|0|Page is valid, no graphics -- Color: D|

expense by rig for fiscal years 2006 and 2005 isas follows:
Fiscal2006
Fiscal2005 Variance
(In millions)
DEPRECIATIONEXPENSE
SEAHAWK . . . . . . . . . . . . . . . . . $ 1.6 $ 0.5 $ 1.1ATWOOD HUNTER . . . . . . . . . . 5.4 5.3 0.1VICKSBURG. . . . . . . . . . . . . . . . 2.8 2.7 0.1ATWOOD BEACON . . . . . . . . . . 5.3 5.2 0.1RICHMOND . . . . . . . . . . . . . . . . 0.9 0.9 —ATWOOD FALCON . . . . . . . . . . 2.8 2.8 —ATWOOD EAGLE . . . . . . . . . . . 4.6 4.7 (0.1)ATWOOD SOUTHERN CROSS . . 2.9 4.5 (1.6)OTHER . . . . . . . . . . . . . . . . . . . 0.1 0.1 —
$26.4 $26.7 $(0.3)
The increase in depreciation expense for theSEAHAWK was due to the completion of a$16 million life enhancing upgrade during thefourth quarter of the current fiscal year. Duringthe first quarter of the current fiscal year, theATWOOD SOUTHERN CROSS underwent a lifeenhancing upgrade whereby the useful life of therig was extended from approximately two to fiveyears. Depreciation expense for our other unitswas relatively unchanged in fiscal year 2006 ascompared to fiscal year 2005.
In October 2005, we sold our semisubmersi-ble hull, SEASCOUT, for $10 million (net aftercertain expenses) and our spare 15,000 P.S.I. BOPStack for approximately $15 million. For the 2006fiscal year period, gains on the sales of these twoassets and other excess equipment totaledapproximately $10.5 million in the aggregate. Wehad no operations or revenues associated withthese assets prior to their sale.
General and administrative expenses for fis-cal year 2006 have increased 45% compared tothe prior fiscal year due primarily to the follow-ing: $3.7 million of stock option compensationexpense (resulting from adoption of SFAS 123(R)on October 1, 2005), a $1.5 million increase inprofessional fees primarily related to higher Sar-banes-Oxley compliance costs, and a $0.6 million
increase in annual bonus compensation. Interestexpense has decreased primarily due to thereduction of our outstanding debt while interestincome has increased when compared to theprior fiscal year due to higher interest ratesearned on higher cash balances.
Virtually all of our tax provision for fiscal year2006 relates to taxes in foreign jurisdictions. As aresult of working in foreign jurisdictions, weearned a high level of operating income in certainnontaxable and deemed profit tax jurisdictionswhich significantly reduced our effective tax ratefor the current fiscal year when compared to theUnited States statutory rate. In addition, wereversed a $1.8 million tax contingent liabilitydue to the expiration of the statute of limitationsin a foreign jurisdiction. Also, we were advisedby a foreign tax authority that it had approvedacceptance of certain amended prior year taxreturns. The acceptance of these amended taxreturns, along with the fiscal year 2005 tax returnin this foreign jurisdiction, resulted in the recog-nition of a $4.6 million tax benefit in the thirdquarter. Including the two previously mentioneddiscrete items, which reduced our rate by 7%,our effective tax rate for fiscal year 2006 wasapproximately 6%.
Excluding any discrete items that may occur,we expect our effective tax rate to be approxi-mately 15-20% for fiscal year 2007 due toincreased earnings in foreign jurisdictions withhigh statutory tax rates.
Fiscal Year 2005 Versus Fiscal Year 2004
Revenues for fiscal year 2005 increased 8%compared to the fiscal year 2004. A comparative
16
%%TRANSMSG*** Transmitting Job: H41700 PCN: 011000000 ***%%PCMSG|16 |00012|Yes|No|12/18/2006 18:47|0|0|Page is valid, no graphics -- Color: D|
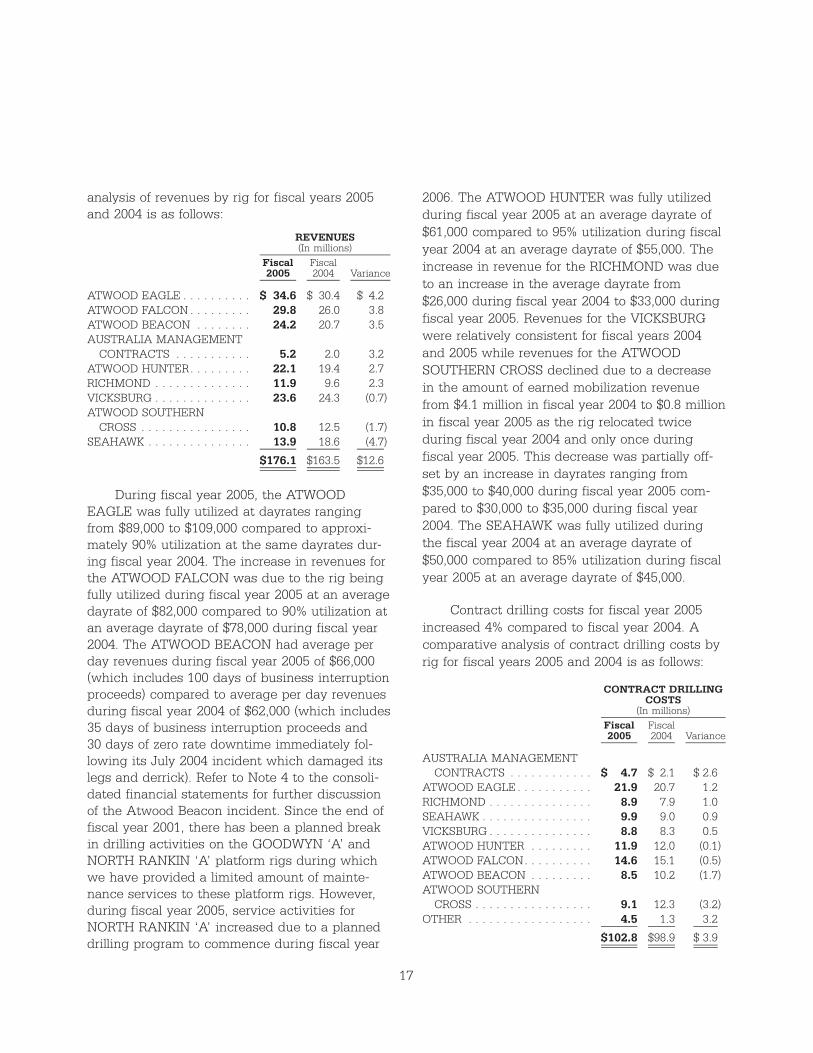
analysis of revenues by rig for fiscal years 2005and 2004 is as follows:
Fiscal2005
Fiscal2004 Variance
(In millions)REVENUES
ATWOOD EAGLE . . . . . . . . . . $ 34.6 $ 30.4 $ 4.2ATWOOD FALCON . . . . . . . . . 29.8 26.0 3.8ATWOOD BEACON . . . . . . . . 24.2 20.7 3.5AUSTRALIA MANAGEMENT
CONTRACTS . . . . . . . . . . . 5.2 2.0 3.2ATWOOD HUNTER. . . . . . . . . 22.1 19.4 2.7RICHMOND . . . . . . . . . . . . . . 11.9 9.6 2.3VICKSBURG . . . . . . . . . . . . . . 23.6 24.3 (0.7)ATWOOD SOUTHERN
CROSS . . . . . . . . . . . . . . . . 10.8 12.5 (1.7)SEAHAWK . . . . . . . . . . . . . . . 13.9 18.6 (4.7)
$176.1 $163.5 $12.6
During fiscal year 2005, the ATWOODEAGLE was fully utilized at dayrates rangingfrom $89,000 to $109,000 compared to approxi-mately 90% utilization at the same dayrates dur-ing fiscal year 2004. The increase in revenues forthe ATWOOD FALCON was due to the rig beingfully utilized during fiscal year 2005 at an averagedayrate of $82,000 compared to 90% utilization atan average dayrate of $78,000 during fiscal year2004. The ATWOOD BEACON had average perday revenues during fiscal year 2005 of $66,000(which includes 100 days of business interruptionproceeds) compared to average per day revenuesduring fiscal year 2004 of $62,000 (which includes35 days of business interruption proceeds and30 days of zero rate downtime immediately fol-lowing its July 2004 incident which damaged itslegs and derrick). Refer to Note 4 to the consoli-dated financial statements for further discussionof the Atwood Beacon incident. Since the end offiscal year 2001, there has been a planned breakin drilling activities on the GOODWYN ‘A’ andNORTH RANKIN ‘A’ platform rigs during whichwe have provided a limited amount of mainte-nance services to these platform rigs. However,during fiscal year 2005, service activities forNORTH RANKIN ‘A’ increased due to a planneddrilling program to commence during fiscal year
2006. The ATWOOD HUNTER was fully utilizedduring fiscal year 2005 at an average dayrate of$61,000 compared to 95% utilization during fiscalyear 2004 at an average dayrate of $55,000. Theincrease in revenue for the RICHMOND was dueto an increase in the average dayrate from$26,000 during fiscal year 2004 to $33,000 duringfiscal year 2005. Revenues for the VICKSBURGwere relatively consistent for fiscal years 2004and 2005 while revenues for the ATWOODSOUTHERN CROSS declined due to a decreasein the amount of earned mobilization revenuefrom $4.1 million in fiscal year 2004 to $0.8 millionin fiscal year 2005 as the rig relocated twiceduring fiscal year 2004 and only once duringfiscal year 2005. This decrease was partially off-set by an increase in dayrates ranging from$35,000 to $40,000 during fiscal year 2005 com-pared to $30,000 to $35,000 during fiscal year2004. The SEAHAWK was fully utilized duringthe fiscal year 2004 at an average dayrate of$50,000 compared to 85% utilization during fiscalyear 2005 at an average dayrate of $45,000.
Contract drilling costs for fiscal year 2005increased 4% compared to fiscal year 2004. Acomparative analysis of contract drilling costs byrig for fiscal years 2005 and 2004 is as follows:
Fiscal2005
Fiscal2004 Variance
(In millions)
CONTRACT DRILLINGCOSTS
AUSTRALIA MANAGEMENTCONTRACTS . . . . . . . . . . . . $ 4.7 $ 2.1 $ 2.6
ATWOOD EAGLE . . . . . . . . . . . 21.9 20.7 1.2RICHMOND . . . . . . . . . . . . . . . 8.9 7.9 1.0SEAHAWK . . . . . . . . . . . . . . . . 9.9 9.0 0.9VICKSBURG . . . . . . . . . . . . . . . 8.8 8.3 0.5ATWOOD HUNTER . . . . . . . . . 11.9 12.0 (0.1)ATWOOD FALCON. . . . . . . . . . 14.6 15.1 (0.5)ATWOOD BEACON . . . . . . . . . 8.5 10.2 (1.7)ATWOOD SOUTHERN
CROSS . . . . . . . . . . . . . . . . . 9.1 12.3 (3.2)OTHER . . . . . . . . . . . . . . . . . . 4.5 1.3 3.2
$102.8 $98.9 $ 3.9
17
%%TRANSMSG*** Transmitting Job: H41700 PCN: 012000000 ***%%PCMSG|17 |00008|Yes|No|12/18/2006 18:47|0|0|Page is valid, no graphics -- Color: D|

With the increase in service activities forNORTH RANKIN ‘A’ during fiscal year 2005 dueto a planned drilling program to commence dur-ing fiscal year 2006, drilling costs as well asrevenues increased from our management of thisplatform rig. The increase in drilling costs for theATWOOD EAGLE was due to higher labor costsdue to local operating requirements offshore Aus-tralia, its location for all of the fiscal year 2005.The increase in drilling costs for the RICHMONDand SEAHAWK were primarily due to higherrepair and maintenance expenses incurred on therigs during the fiscal year ended September 30,2005 compared to the fiscal year ended Septem-ber 30, 2004. Drilling costs for the VICKSBURG,ATWOOD HUNTER, and ATWOOD FALCONremained relatively consistent for fiscal year 2005compared to fiscal year 2004. The decline indrilling costs for the ATWOOD BEACON was dueto a decrease in repair and maintenanceexpenses primarily resulting from the recordingof a $1.0 million insurance deductible duringfiscal year 2004 related to damage incurred dur-ing the rig’s July 2004 incident. During most ofthe fourth quarter of fiscal year 2005, theATWOOD SOUTHERN CROSS was being mobi-lized from Southeast Asia to the Mediterranean.Virtually all costs incurred during a mobilizationperiod are deferred and amortized as an expenseover the term of the new contract. Havingdeferred mobilization costs at the end of fiscalyear 2005 compared to having no such deferredcosts at the end of fiscal year 2004 accounts forits decline in drilling costs. The increase of otherdrilling costs during fiscal year 2005 was due to a$1.0 million reduction in the amount of insurancepremium refunds received during fiscal year 2005when compared to fiscal year 2004 and also dueto fiscal year 2004 including the settlement of adispute with a client which resulted in a reduc-tion of operation costs of $0.6 million along withvarious other increases of non-drilling unit spe-cific costs.
Depreciation expense for fiscal year 2005decreased 16% as compared to fiscal year 2004.
A comparative analysis of depreciation expenseby rig for fiscal years 2005 and 2004 is as follows:
Fiscal2005
Fiscal2004 Variance
(In millions)
DEPRECIATIONEXPENSE
ATWOOD SOUTHERN CROSS . . $ 4.5 $ 4.2 $ 0.3VICKSBURG. . . . . . . . . . . . . . . . 2.7 2.6 0.1ATWOOD FALCON . . . . . . . . . . 2.8 2.7 0.1ATWOOD BEACON . . . . . . . . . . 5.2 5.2 —RICHMOND . . . . . . . . . . . . . . . . 0.9 0.9 —ATWOOD EAGLE . . . . . . . . . . . 4.7 4.8 (0.1)ATWOOD HUNTER . . . . . . . . . . 5.3 5.4 (0.1)SEAHAWK . . . . . . . . . . . . . . . . . 0.5 5.1 (4.6)OTHER . . . . . . . . . . . . . . . . . . . 0.1 0.7 (0.6)
$26.7 $31.6 $(4.9)
Effective October 1, 2004, we extended theremaining depreciable life of the SEAHAWK from2 months to 5 years. The depreciable life of thisrig was extended based upon entry into a con-tract that extended the rig’s commercial viabilityfor up to 5 years, coupled with our intent tocontinue marketing and operating the rig beyond2 months. The decrease in other depreciation isdue to certain non-rig assets becoming fullydepreciated during the last quarter of fiscal year2004 and the first quarter of fiscal year 2005.Depreciation expense for our other units wasrelatively unchanged in fiscal year 2005 as com-pared to fiscal year 2004.
General and administrative expenses for fis-cal year 2005 increased 25% compared to fiscalyear 2004 due to significantly increased profes-sional fees primarily resulting from compliancerequirements of the Sarbanes-Oxley Act and dueto $0.7 million of bonuses paid during fiscal year2005, compared with no bonus payments duringfiscal year 2004. Although the level of our out-standing debt has been reduced significantlyfrom fiscal year 2004, the reduction of interestexpense was partially offset by rising interestrates during fiscal year 2005. Interest income hasincreased when compared to fiscal year 2004 dueto higher interest rates earned on cash balances
18
%%TRANSMSG*** Transmitting Job: H41700 PCN: 013000000 ***%%PCMSG|18 |00011|Yes|No|12/18/2006 18:47|0|0|Page is valid, no graphics -- Color: D|

and interest income earned on income taxrefunds.
Virtually all of our tax provision for fiscalyears 2005 and 2004 related to taxes in foreignjurisdictions, with fiscal year 2005 also impactedby a $3.3 million United States tax benefit recog-nized. During fiscal year 2005 our provision wasalso offset by two other foreign discrete items.During the first quarter of fiscal year 2005, wereceived a $1.7 million tax refund in Malaysiarelated to a previously reserved tax receivable. Inaddition, a $1.0 million deferred tax benefit wasrecognized in June 2005 due to the filing andsubsequent acceptance by the local tax authority,of amended prior year tax returns. On Decem-ber 1, 2005, we received notification from theUnited States Department of Treasury that a pre-viously reserved United States income tax refundwe had been pursuing for over two years hadbeen approved for payment. Based upon thisapproval, we reduced our income tax provisionby the refund amount of $3.3 million for the yearended September 30, 2005. Furthermore, duringfiscal year 2005, operating income earned in cer-tain nontaxable and deemed profit tax jurisdic-tions was higher when compared to fiscal year2004, including business interruption proceedsearned by the ATWOOD BEACON in a zero taxjurisdiction for approximately three and a halfmonths, which contributed to our lower effectivetax rate. As a result of these items, our effectivetax rate for fiscal year 2005 was significantly lesswhen compared to fiscal year 2004 and theUnited States statutory rate.
LIQUIDITY AND CAPITAL RESOURCES
Since we operate in a very cyclical industry,maintaining high equipment utilization in up, aswell as down, cycles is a key factor in generatingcash to satisfy current and future obligations. Forfiscal years 2001 through 2005, net cash providedby operating activities ranged from a low ofapproximately $13.7 million in fiscal year 2003 toa high of approximately $62.3 million in fiscal
year 2001 compared to net cash provided byoperating activities of approximately $85.5 millionfor fiscal year 2006. Our operating cash flows areprimarily driven by our operating income, whichreflects dayrates and rig utilization. The low levelof net cash provided by operating activities infiscal year 2003 was due to a downturn in marketconditions during which we pursued short-termcontract opportunities in high operating costareas in order to maintain high utilization of ourfleet. Operating results in fiscal years 2004, 2005and 2006 reflected continuing improvements inmarket conditions which enabled us to havehigher cash flows and earnings in these yearscompared to fiscal year 2003. Due to the signifi-cant increase in future dayrate commitments athistorically high levels, we have pursued longer-term contract opportunities for some of our drill-ing units. We currently have approximately 95%and 80% of our available operating rig days com-mitted for fiscal years 2007 and 2008, respec-tively. With the current historically high dayratecommitments on all eight of our actively owneddrilling units, we anticipate significant improve-ment in cash flows and earnings during fiscalyears 2007 and 2008. Other than our expectedcapital expenditures of $110 million to $115 mil-lion for fiscal year 2007, the only additional cashcommitment for fiscal year 2007, outside of fund-ing current rig operations, is our required quar-terly repayments under the term portion of oursenior secured credit facility which will total$36 million for fiscal year 2007. We expect togenerate more than sufficient cash flows fromoperations to satisfy all of these obligations.
In October 2004, we sold in a public offering2,350,000 shares of our common stock at aneffective net price (before expenses) of $22.92 fornet proceeds of approximately $53.6 million. Weused these proceeds and cash on hand to repaythe $55 million outstanding under the revolvingportion of our credit facility. As of September 30,2006, we only had $54 million outstanding underthe term portion of our credit facility, with$10 million (repaid in October 2006) outstanding
19
%%TRANSMSG*** Transmitting Job: H41700 PCN: 014000000 ***%%PCMSG|19 |00006|Yes|No|12/14/2006 11:34|0|0|Page is valid, no graphics -- Color: D|

under the revolving portion of our credit facility.Our total debt to capitalization ratio (debt/(debt +equity)) is 12% as of September 30, 2006. Thisratio will continue to decline unless we identifyan acceptable growth opportunity. However, wewill continue to explore opportunities for valueenhancing growth as they arise.
We are in compliance with all financial cove-nants at September 30, 2006 and expect toremain in compliance with all financial covenantsduring fiscal year 2007. Further, at all times dur-ing fiscal year 2004, 2005 and 2006 when wewere required to determine compliance with ourfinancial covenants, we were in compliance withthose covenants. Aside from the financial cove-nants, no other provisions exist in the creditfacility that could result in acceleration of theApril 1, 2008 maturity date.
At September 30, 2006, the collateral for ourcredit facility consists primarily of preferred mort-gages on all eight of our active drilling units(with an aggregate net book value at Septem-ber 30, 2006 totaling approximately $397 million).We are not required to maintain compensatingbalances; however, we are required to pay a feeof approximately 0.60% per annum on the unusedrevolving portion of our credit facility and certainother administrative costs.
In October 2005, we sold our semisubmersi-ble hull, SEASCOUT, for $10 million (net aftercertain expenses) and our spare 15,000 P.S.I. BOPStack for approximately $15 million. For the 2006fiscal year period, gains on the sales of these twoassets and other excess equipment totaledapproximately $10.5 million in the aggregate. Theapproximate $26 million in cash received fromthe sales of excess equipment, plus borrowingsunder the revolving portion of our credit facility($10 million outstanding at September 30,2006) along with our operating cash flows, hasallowed us to expend approximately $30 milliontoward the construction of the ATWOODAURORA, approximately $16 million on upgrad-ing the SEAHAWK, approximately $5 million in
completing the ATWOOD SOUTHERN CROSSupgrade, approximately $16 million toward theATWOOD FALCON upgrade and approximately$11 million in other capital expenditures duringfiscal year 2006 and have cash and cash equiva-lents remaining on hand at September 30, 2006of approximately $32 million.
Our accounts receivable have increased by$40.4 million since September 30, 2005, primarilydue to our increased rig utilization and higherdayrates. Our portfolio of accounts receivable iscomprised of major international corporate enti-ties with stable payment experience. Historically,we have not encountered significant difficulty incollecting receivables and typically do not requirecollateral for our receivables; however, we have a$0.8 million allowance for doubtful accounts atSeptember 30, 2006. The insurance receivable of$0.6 million at September 30, 2005 and Septem-ber 30, 2006, relates to repairs to be made to theATWOOD BEACON. Final repairs on this rigwere completed in November 2006, and weexpect to collect the remaining $0.6 million insur-ance receivable associated therewith in fiscalyear 2007.
Long-term deferred credits have increasedby $22.3 million since September 30, 2005, prima-rily due to deferred fees associated with thecurrent fiscal year upgrades and mobilizations ofthe ATWOOD FALCON and SEAHAWK.
Commitments
The following table summarizes our obliga-tions and commitments (in thousands) at Sep-tember 30, 2006:
Fiscal2007
Fiscal2008
Fiscal2009
Fiscal2010
Fiscal2011 andthereafter
Long-Term Debt(1) . . . . . $36,000 $28,000 $ — $ — $ —Purchase
Commitments(2) . . . . . 61,854 28,282 — — —Operating Leases . . . . . . 1,916 1,102 978 845 3,570
$99,770 $57,384 $978 $845 $3,570
20
%%TRANSMSG*** Transmitting Job: H41700 PCN: 015000000 ***%%PCMSG|20 |00009|Yes|No|12/18/2006 18:47|0|0|Page is valid, no graphics -- Color: D|

(1) Excluded from the above table is interest associ-ated with borrowings under our credit facilitybecause the applicable interest rate is variable.The principal amount outstanding under ourcredit facility included in the above table is$64 million which currently bears interest at arate of approximately 7%.
(2) Rig construction and upgrade commitments forthe ATWOOD AURORA and the ATWOOD FAL-CON, respectively.
CRITICAL ACCOUNTING POLICIES
Significant accounting policies are includedin Note 2 to our consolidated financial statementsfor the year ended September 30, 2006. Thesepolicies, along with the underlying assumptionsand judgments made by management in theirapplication, have a significant impact on ourconsolidated financial statements. We identifyour most critical accounting policies as thosethat are the most pervasive and important to theportrayal of our financial position and results ofoperations, and that require the most difficult,subjective and/or complex judgments by manage-ment regarding estimates about matters that areinherently uncertain. Our most critical account-ing policies are those related to revenue recogni-tion, property and equipment, impairment ofassets, income taxes, and employee stock-basedcompensation.
We account for the drilling and managementcontract revenue in accordance with the terms ofthe underlying drilling or management contract.These contracts generally provide that revenue isearned and recognized on a daily rate (i.e. “day-rate”) basis and dayrates are typically earned fora particular level of service over the life of acontract. Dayrate contracts can be for a specifiedperiod of time or the time required to drill aspecified well or number of wells. Revenues fromdayrate drilling operations, which are classifiedunder contract drilling services, are recognizedon a per day basis as the work progresses. Inaddition, lump-sum fees received at
commencement of the drilling contract as com-pensation for the cost of relocating drilling rigsfrom one major operating area to another, as wellas equipment and upgrade costs reimbursed bythe customer are recognized as earned on astraight-line method over the term of the relateddrilling contract, as are the dayrates associatedwith such contract. However, lump-sum feesreceived upon termination of a drilling contractare recognized as earned during the period termi-nation occurs. In addition, we defer the mobiliza-tion costs relating to moving a drilling rig to anew area and customer requested equipmentpurchases that will revert to the customer at theend of the applicable drilling contract. We amor-tize such costs on a straight-line basis over thelife of the applicable drilling contract.
We currently operate eight active offshoredrilling units. These assets are premium equip-ment and should provide many years of qualityservice. At September 30, 2006, the carryingvalue of our property and equipment totaled$436.2 million, which represents 73% of our totalassets. This carrying value reflects the applica-tion of our property and equipment accountingpolicies, which incorporate estimates, assump-tions and judgments by management relative tothe useful lives and salvage values of our units.Once a rig is placed in service, it is depreciatedon the straight-line method over its estimateduseful life, with depreciation discontinued onlyduring the period when a drilling unit is out ofservice while undergoing a significant upgradethat extends its useful life. The estimated usefullives of our drilling units and related equipmentrange from 3 years to 25 years and our salvagevalues are generally based on 5% of capitalizedcosts. Any future increases in our estimates ofuseful lives or salvage values will have the effectof decreasing future depreciation expense infuture years and spreading the expense to lateryears. Any future decreases in our useful lives orsalvage values will have the effect of acceleratingfuture depreciation expense.
21
%%TRANSMSG*** Transmitting Job: H41700 PCN: 016000000 ***%%PCMSG|21 |00006|Yes|No|12/18/2006 18:47|0|0|Page is valid, no graphics -- Color: D|

We evaluate the carrying value of our prop-erty and equipment when events or changes incircumstances indicate that the carrying value ofsuch assets may be impaired. Asset impairmentevaluations are, by nature, highly subjective.Operations of our drilling equipment are subjectto the offshore drilling requirements of oil andgas exploration and production companies andagencies of foreign governments. These require-ments are, in turn, subject to fluctuations ingovernment policies, world demand and price forpetroleum products, proved reserves in relation tosuch demand and the extent to which suchdemand can be met from onshore sources. Thecritical estimates which result from these dynam-ics include projected utilization, dayrates, andoperating expenses, each of which impact ourestimated future cash flows. Over the last tenyears, our equipment utilization rate has aver-aged approximately 90%; however, if a drillingunit incurs significant idle time or receives day-rates below operating costs, its carrying valuecould become impaired. The estimates, assump-tions and judgments used by management in theapplication of our property and equipment andasset impairment policies reflect both historicalexperience and expectations regarding futureindustry conditions and operations. The use ofdifferent estimates, assumptions and judgments,especially those involving the useful lives of ourrigs and vessels and expectations regardingfuture industry conditions and operations, wouldlikely result in materially different carrying valuesof assets and results of operations.
We conduct operations and earn income innumerous foreign countries and are subject tothe laws of taxing jurisdictions within thosecountries, as well as United States federal andstate tax laws. At September 30, 2006, we have a$16.0 million net deferred income tax liability.This balance reflects the application of ourincome tax accounting policies in accordancewith statement of Financial Accounting Stan-dards No. 109, “Accounting for Income Taxes”.Such accounting policies incorporate estimates,
assumptions and judgments by management rel-ative to the interpretation of applicable tax laws,the application of accounting standards, andfuture levels of taxable income. The estimates,assumptions and judgments used by manage-ment in connection with accounting for incometaxes reflect both historical experience andexpectations regarding future industry conditionsand operations. Changes in these estimates,assumptions and judgments could result in mate-rially different provisions for deferred and currentincome taxes.
Effective October 1, 2005, we adopted State-ment of Financial Accounting StandardsNo. 123(R), “Share-Based Payment”, orSFAS 123(R), using the modified prospectiveapplication transition method. Under this method,stock-based compensation cost is measured atthe grant date, based on the calculated fair valueof the award, and is recognized as an expenseover the requisite service period (generally thevesting period of the equity grant). In addition,stock-based compensation cost recognizedincludes compensation cost for unvested stock-based awards as of October 1, 2005. Prior toOctober 1, 2005, we accounted for share-basedcompensation in accordance with AccountingPrinciples Board Opinion No. 25, “Accounting forStock Issued to Employees”, or APB No. 25. Noshare-based employee compensation cost hasbeen reflected in net income prior to October 1,2005. Before that date, we reported the entire taxbenefit related to the exercise of stock options asan operating cash flow. SFAS 123(R) requires usto report the tax benefit from the tax deductionthat is in excess of recognized compensationcosts (excess tax benefits) as a financing cashflow rather than as an operating cash flow. Thecumulative effect of the change in accountingprinciple from APB No. 25 to FAS 123(R) was notmaterial.
22
%%TRANSMSG*** Transmitting Job: H41700 PCN: 017000000 ***%%PCMSG|22 |00006|Yes|No|12/18/2006 18:47|0|0|Page is valid, no graphics -- Color: D|

RECENTLY ISSUED ACCOUNTINGPRONOUNCEMENTS
In June 2006, the FASB issued FIN 48,“Accounting for Uncertainty in Income Taxes —an Interpretation of FASB Statement 109.” FIN 48prescribes a comprehensive model for recogniz-ing, measuring, presenting, and disclosing uncer-tain tax positions within the financial statements.The provisions of FIN 48 are effective for fiscalyears beginning after December 15, 2006. We arecurrently evaluating the impact of the adoption ofFIN 48 on our consolidated financial position,results of operations and cash flows.
In September 2006, the FASB issuedSFAS No. 157, “Fair Value Measurements”, orSFAS No. 157, which defines fair value, estab-lishes methods used to measure fair value andexpands disclosure requirements about fair valuemeasurements. SFAS No. 157 is effective forfinancial statements issued for fiscal year begin-ning after November 15, 2007, and interim peri-ods within those fiscal periods. We are currentlyanalyzing the provisions of SFAS No. 157 anddetermining how it will affect accounting policiesand procedures, but we have not yet made adetermination of the impact the adoption willhave on our consolidated financial position,results of operations and cash flows.
In September 2006, the SEC issued StaffAccounting Bulletin No. 108, “Considering theEffects of Prior Year Misstatements when Quanti-fying Misstatements in Current Year FinancialStatements”, or SAB 108, which provides guid-ance on the consideration of the effects of prioryear misstatements in quantifying current yearmisstatements for the purpose of a materialityassessment. SAB 108 requires that the material-ity of the effect of a misstated amount be evalu-ated on each financial statement and the relatedfinancial statement disclosures, and that materi-ality evaluation be based on quantitative andqualitative factors. SAB 108 is effective for fiscal
years beginning after November 15, 2006. We donot believe this guidance will have a materialimpact on our financial position, results of opera-tions or cash flows.
DISCLOSURES ABOUT MARKET RISK
We are exposed to market risk, includingadverse changes in interest rates and foreigncurrency exchange rates as discussed below.
Interest Rate Risk
All of the $64 million of long-term debt out-standing at September 30, 2006, was floating ratedebt. As a result, our annual interest costs infiscal year 2006 will fluctuate based on interestrate changes. Because the interest rate on ourlong-term debt is a floating rate and due to ourdebt maturing in 2008, the fair value of our long-term debt approximated carrying value as of Sep-tember 30, 2006. The impact on annual cash flowof a 10% change in the floating rate (approxi-mately 70 basis points) would be approximately$0.4 million, which we believe to be immaterial.We did not have any open derivative contractsrelating to our floating rate debt at September 30,2006.
Foreign Currency Risk
Certain of our subsidiaries have monetaryassets and liabilities that are denominated in acurrency other than their functional currencies.Based on September 30, 2006 amounts, adecrease in the value of 10% in the foreigncurrencies relative to the United States dollarfrom the year-end exchange rates would result ina foreign currency transaction gain of approxi-mately $0.2 million. Thus, we consider our cur-rent risk exposure to foreign currency exchangerate movements, based on net cash flows, to beimmaterial. We did not have any open derivativecontracts relating to foreign currencies at Sep-tember 30, 2006.
23
%%TRANSMSG*** Transmitting Job: H41700 PCN: 018000000 ***%%PCMSG|23 |00008|Yes|No|12/18/2006 18:47|0|0|Page is valid, no graphics -- Color: D|

MANAGEMENT’S REPORT ON INTERNAL CONTROLOVER FINANCIAL REPORTING
Company management is responsible for establishing and maintaining adequate internal controlover financial reporting as defined in Rules 13a-15(f) and 15d-15(f) under the Securities Exchange Act of1934. Our internal control over financial reporting was designed by management, under the supervisionof the Chief Executive Officer and Chief Financial Officer, to provide reasonable assurance regarding thereliability of financial reporting and the preparation of financial statements for external purposes inaccordance with accounting principles generally accepted in the United States, and includes thosepolicies and procedures that:
(i) pertain to the maintenance of records that in reasonable detail accurately and fairly reflectthe transactions and dispositions of the assets of the Company;
(ii) provide reasonable assurance that transactions are recorded as necessary to permit prepa-ration of financial statements in accordance with accounting principles generally accepted in theUnited States, and that receipts and expenditures of the Company are being made only inaccordance with authorizations of management and directors of the Company; and
(iii) provide reasonable assurance regarding prevention or timely detection of unauthorizedacquisition, use or disposition of the Company’s assets that could have a material effect on thefinancial statements.
Because of its inherent limitations, internal control over financial reporting may not prevent ordetect misstatements. Also, projections of any evaluation of effectiveness to future periods are subjectto the risk that controls may become inadequate because of changes in conditions, or that the degree ofcompliance with the policies and procedures may deteriorate.
Management assessed the effectiveness of the Company’s internal control over financial reportingas of September 30, 2006. In making this assessment, management used the criteria set forth by theCommittee of Sponsoring Organizations of the Treadway Commission (COSO) in Internal Control-Integrated Framework.
Based on our evaluation under the framework in Internal Control — Integrated Framework, manage-ment has concluded that the Company maintained effective internal control over financial reporting asof September 30, 2006. PricewaterhouseCoopers LLP, our independent registered public accounting firm,has audited our assessment of the effectiveness of the Company’s internal control over financialreporting as of September 30, 2006, as stated in their report, which appears on the following page.
ATWOOD OCEANICS, INC.
by
John R. IrwinDirector, Presidentand Chief Executive Officer
James M. HollandSenior Vice President andChief Financial Officer
December 12, 2006
24
%%TRANSMSG*** Transmitting Job: H41700 PCN: 019000000 ***%%PCMSG|24 |00008|Yes|No|12/18/2006 18:47|0|0|Page/graphics valid 12/18/2006 18:47 -- Color: D|

REPORT OF INDEPENDENT REGISTERED PUBLIC ACCOUNTING FIRM
The Board of Directors and Shareholders of Atwood Oceanics, Inc.
We have completed integrated audits of Atwood Oceanics, Inc.’s 2006 and 2005 consolidatedfinancial statements and of its internal control over financial reporting as of September 30, 2006 and anaudit of its 2004 consolidated financial statements in accordance with the standards of the PublicCompany Accounting Oversight Board (United States). Our opinions, based on our audits, are presentedbelow.
Consolidated financial statements
In our opinion, the accompanying consolidated balance sheets and the related consolidatedstatements of operations, of cash flows and of changes in shareholders’ equity present fairly, in allmaterial respects, the financial position of the Company at September 30, 2006 and 2005, and the resultsof their operations and their cash flows for each of the three years in the period ended September 30,2006 in conformity with accounting principles generally accepted in the United States of America.These financial statements are the responsibility of the Company’s management. Our responsibility is toexpress an opinion on these financial statements based on our audits. We conducted our audits of thesestatements in accordance with the standards of the Public Company Accounting Oversight Board(United States). Those standards require that we plan and perform the audit to obtain reasonableassurance about whether the financial statements are free of material misstatement. An audit offinancial statements includes examining, on a test basis, evidence supporting the amounts anddisclosures in the financial statements, assessing the accounting principles used and significantestimates made by management, and evaluating the overall financial statement presentation. We believethat our audits provide a reasonable basis for our opinion.
As discussed in Note 3 to the consolidated financial statements, in 2006 the Company changed itsmethod of accounting for share-based compensation as a result of adopting the provisions of Statementof Financial Accounting Standards No. 123(R), “Share-Based Payment.”
Internal control over financial reporting
Also, in our opinion, management’s assessment, included in the accompanying Management’sReport on Internal Control Over Financial Reporting, which appears on the preceding page, that theCompany maintained effective internal control over financial reporting as of September 30, 2006 basedon criteria established in Internal Control — Integrated Framework issued by the Committee of Sponsor-ing Organizations of the Treadway Commission (COSO), is fairly stated, in all material respects, basedon those criteria. Furthermore, in our opinion, the Company maintained, in all material respects,effective internal control over financial reporting as of September 30, 2006, based on criteria establishedin Internal Control — Integrated Framework issued by the COSO. The Company’s management isresponsible for maintaining effective internal control over financial reporting and for its assessment ofthe effectiveness of internal control over financial reporting. Our responsibility is to express opinions onmanagement’s assessment and on the effectiveness of the Company’s internal control over financialreporting based on our audit. We conducted our audit of internal control over financial reporting inaccordance with the standards of the Public Company Accounting Oversight Board (United States).Those standards require that we plan and perform the audit to obtain reasonable assurance aboutwhether effective internal control over financial reporting was maintained in all material respects. Anaudit of internal control over financial reporting includes obtaining an understanding of internal controlover financial reporting, evaluating management’s assessment, testing and evaluating the design and
25
%%TRANSMSG*** Transmitting Job: H41700 PCN: 020000000 ***%%PCMSG|25 |00008|Yes|No|12/18/2006 18:47|0|0|Page is valid, no graphics -- Color: D|
operating effectiveness of internal control, and performing such other procedures as we considernecessary in the circumstances. We believe that our audit provides a reasonable basis for our opinions.
A company’s internal control over financial reporting is a process designed to provide reasonableassurance regarding the reliability of financial reporting and the preparation of financial statements forexternal purposes in accordance with generally accepted accounting principles. A company’s internalcontrol over financial reporting includes those policies and procedures that (i) pertain to the mainte-nance of records that, in reasonable detail, accurately and fairly reflect the transactions and dispositionsof the assets of the company; (ii) provide reasonable assurance that transactions are recorded asnecessary to permit preparation of financial statements in accordance with generally accepted account-ing principles, and that receipts and expenditures of the company are being made only in accordancewith authorizations of management and directors of the company; and (iii) provide reasonable assuranceregarding prevention or timely detection of unauthorized acquisition, use, or disposition of thecompany’s assets that could have a material effect on the financial statements.
Because of its inherent limitations, internal control over financial reporting may not prevent ordetect misstatements. Also, projections of any evaluation of effectiveness to future periods are subjectto the risk that controls may become inadequate because of changes in conditions, or that the degree ofcompliance with the policies or procedures may deteriorate.
PricewaterhouseCoopers LLP
Houston, TexasDecember 12, 2006
26
%%TRANSMSG*** Transmitting Job: H41700 PCN: 021000000 ***%%PCMSG|26 |00006|Yes|No|12/14/2006 11:34|0|0|Page/graphics valid 12/19/2006 22:40 -- Color: D|

Atwood Oceanics, Inc. and Subsidiaries
CONSOLIDATED BALANCE SHEETS
(In thousands) 2006 2005
September 30,
ASSETSCURRENT ASSETS:
Cash and cash equivalents . . . . . . . . . . . . . . . . . . . . . . . . . . . . . . . . . . . . . . . . . . $ 32,276 $ 18,982Accounts receivable, net of an allowance of $750 and $189 at September 30,
2006 and 2005, respectively . . . . . . . . . . . . . . . . . . . . . . . . . . . . . . . . . . . . . . . . 80,222 39,865Income tax receivable . . . . . . . . . . . . . . . . . . . . . . . . . . . . . . . . . . . . . . . . . . . . . . 65 3,278Insurance receivable. . . . . . . . . . . . . . . . . . . . . . . . . . . . . . . . . . . . . . . . . . . . . . . . 550 550Inventories of materials and supplies . . . . . . . . . . . . . . . . . . . . . . . . . . . . . . . . . . 22,124 15,640Deferred tax assets . . . . . . . . . . . . . . . . . . . . . . . . . . . . . . . . . . . . . . . . . . . . . . . . . 2,563 3,080Prepaid expenses and deferred costs . . . . . . . . . . . . . . . . . . . . . . . . . . . . . . . . . . 9,873 10,658
Total Current Assets . . . . . . . . . . . . . . . . . . . . . . . . . . . . . . . . . . . . . . . . . . . . . . 147,673 92,053
NET PROPERTY AND EQUIPMENT . . . . . . . . . . . . . . . . . . . . . . . . . . . . . . . . . . . . . 436,166 390,778
ASSET HELD FOR SALE . . . . . . . . . . . . . . . . . . . . . . . . . . . . . . . . . . . . . . . . . . . . . . — 9,017DEFERRED COSTS AND OTHER ASSETS . . . . . . . . . . . . . . . . . . . . . . . . . . . . . . . . 9,990 3,846
$593,829 $495,694
LIABILITIES AND SHAREHOLDERS’ EQUITYCURRENT LIABILITIES:
Current maturities of notes payable. . . . . . . . . . . . . . . . . . . . . . . . . . . . . . . . . . . . $ 36,000 $ 36,000Accounts payable . . . . . . . . . . . . . . . . . . . . . . . . . . . . . . . . . . . . . . . . . . . . . . . . . . 11,760 6,473Accrued liabilities. . . . . . . . . . . . . . . . . . . . . . . . . . . . . . . . . . . . . . . . . . . . . . . . . . 13,201 11,088Deferred credits . . . . . . . . . . . . . . . . . . . . . . . . . . . . . . . . . . . . . . . . . . . . . . . . . . . 404 2,598
Total Current Liabilities . . . . . . . . . . . . . . . . . . . . . . . . . . . . . . . . . . . . . . . . . . . 61,365 56,159
LONG-TERM DEBT, net of current maturities: . . . . . . . . . . . . . . . . . . . . . . . . . . . . . 28,000 54,000
28,000 54,000
LONG TERM LIABILITIES:Deferred income taxes . . . . . . . . . . . . . . . . . . . . . . . . . . . . . . . . . . . . . . . . . . . . . . 18,591 20,140Deferred credits . . . . . . . . . . . . . . . . . . . . . . . . . . . . . . . . . . . . . . . . . . . . . . . . . . . 23,284 994Other . . . . . . . . . . . . . . . . . . . . . . . . . . . . . . . . . . . . . . . . . . . . . . . . . . . . . . . . . . . . 3,695 2,264
45,570 23,398
COMMITMENTS AND CONTINGENCIES (SEE NOTE 11)SHAREHOLDERS’ EQUITY:
Preferred stock, no par value; 1,000 shares authorized, none outstanding . . . . . . — —Common stock, $1 par value, 50,000 shares authorized with 31,046 and 30,682
issued and outstanding at September 30, 2006 and 2005, respectively(1) . . . . 31,046 30,682Paid-in capital(1). . . . . . . . . . . . . . . . . . . . . . . . . . . . . . . . . . . . . . . . . . . . . . . . . . . 115,916 105,645Retained earnings. . . . . . . . . . . . . . . . . . . . . . . . . . . . . . . . . . . . . . . . . . . . . . . . . . 311,932 225,810
Total Shareholders’ Equity . . . . . . . . . . . . . . . . . . . . . . . . . . . . . . . . . . . . . . . . . 458,894 362,137
$593,829 $495,694
(1) Fiscal year 2005 balances have been restated to reflect a two-for-one stock split effected on March 2,2006. See Note 7 for further discussion.
The accompanying notes are an integral part of these consolidated financial statements.
27
%%TRANSMSG*** Transmitting Job: H41700 PCN: 022000000 ***%%PCMSG|27 |00011|Yes|No|12/19/2006 21:50|0|0|Page is valid, no graphics -- Color: D|

Atwood Oceanics, Inc. and Subsidiaries
CONSOLIDATED STATEMENTS OF OPERATIONS
(In thousands, except per share amounts) 2006 2005 2004
Years Ended September 30,
REVENUES:Contract drilling . . . . . . . . . . . . . . . . . . . . . . . . . . . . . . . . . . . . . . . . . . $276,625 $168,500 $161,074Business interruption proceeds . . . . . . . . . . . . . . . . . . . . . . . . . . . . . . — 7,656 2,380
276,625 176,156 163,454COSTS AND EXPENSES:
Contract drilling . . . . . . . . . . . . . . . . . . . . . . . . . . . . . . . . . . . . . . . . . . 144,366 102,849 98,936Depreciation . . . . . . . . . . . . . . . . . . . . . . . . . . . . . . . . . . . . . . . . . . . . . 26,401 26,735 31,582General and administrative . . . . . . . . . . . . . . . . . . . . . . . . . . . . . . . . . 20,630 14,245 11,389Gain on sale of equipment . . . . . . . . . . . . . . . . . . . . . . . . . . . . . . . . . . (10,548) — —
180,849 143,829 141,907
OPERATING INCOME . . . . . . . . . . . . . . . . . . . . . . . . . . . . . . . . . . . . . . . 95,776 32,327 21,547
OTHER INCOME (EXPENSE):Interest expense, net of capitalized interest . . . . . . . . . . . . . . . . . . . . (5,166) (7,352) (9,202)Interest income . . . . . . . . . . . . . . . . . . . . . . . . . . . . . . . . . . . . . . . . . . 1,226 633 57
(3,940) (6,719) (9,145)
INCOME BEFORE INCOME TAXES . . . . . . . . . . . . . . . . . . . . . . . . . . . . 91,836 25,608 12,402PROVISION (BENEFIT) FOR INCOME TAXES . . . . . . . . . . . . . . . . . . . . 5,714 (403) 4,815
NET INCOME . . . . . . . . . . . . . . . . . . . . . . . . . . . . . . . . . . . . . . . . . . . . . $ 86,122 $ 26,011 $ 7,587
EARNINGS PER COMMON SHARE(1):Basic . . . . . . . . . . . . . . . . . . . . . . . . . . . . . . . . . . . . . . . . . . . . . . . . . . . $ 2.78 $ 0.86 $ 0.27Diluted . . . . . . . . . . . . . . . . . . . . . . . . . . . . . . . . . . . . . . . . . . . . . . . . . 2.74 0.83 $ 0.27
AVERAGE COMMON SHARES OUTSTANDING(1):Basic . . . . . . . . . . . . . . . . . . . . . . . . . . . . . . . . . . . . . . . . . . . . . . . . . . . 30,936 30,412 27,718Diluted . . . . . . . . . . . . . . . . . . . . . . . . . . . . . . . . . . . . . . . . . . . . . . . . . 31,442 31,220 28,064
(1) Fiscal years 2005 and 2004 have been restated to reflect a two-for-one stock split effected on March 2,2006. See Note 7 for further discussion.
The accompanying notes are an integral part of these consolidated financial statements.
28
%%TRANSMSG*** Transmitting Job: H41700 PCN: 023000000 ***%%PCMSG|28 |00008|Yes|No|12/18/2006 18:47|0|0|Page is valid, no graphics -- Color: D|
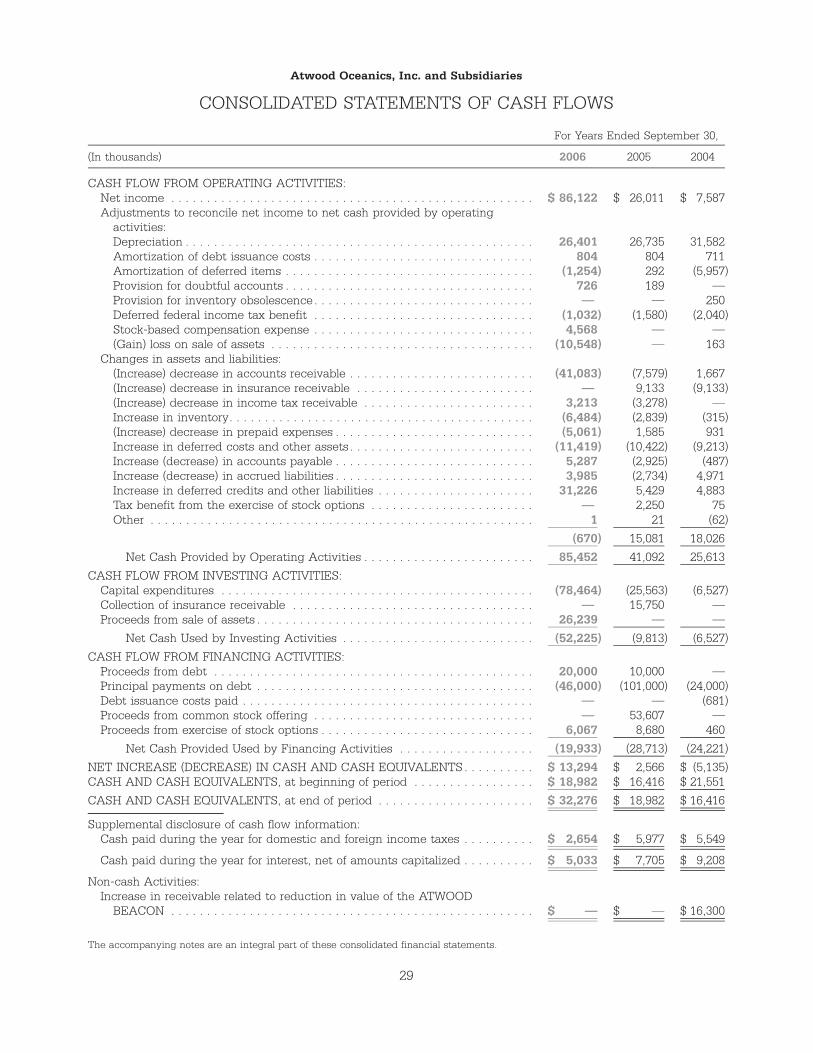
Atwood Oceanics, Inc. and Subsidiaries
CONSOLIDATED STATEMENTS OF CASH FLOWS
(In thousands) 2006 2005 2004
For Years Ended September 30,
CASH FLOW FROM OPERATING ACTIVITIES:Net income . . . . . . . . . . . . . . . . . . . . . . . . . . . . . . . . . . . . . . . . . . . . . . . . . . . $ 86,122 $ 26,011 $ 7,587Adjustments to reconcile net income to net cash provided by operating
activities:Depreciation . . . . . . . . . . . . . . . . . . . . . . . . . . . . . . . . . . . . . . . . . . . . . . . . . 26,401 26,735 31,582Amortization of debt issuance costs . . . . . . . . . . . . . . . . . . . . . . . . . . . . . . . 804 804 711Amortization of deferred items . . . . . . . . . . . . . . . . . . . . . . . . . . . . . . . . . . . (1,254) 292 (5,957)Provision for doubtful accounts . . . . . . . . . . . . . . . . . . . . . . . . . . . . . . . . . . . 726 189 —Provision for inventory obsolescence . . . . . . . . . . . . . . . . . . . . . . . . . . . . . . . — — 250Deferred federal income tax benefit . . . . . . . . . . . . . . . . . . . . . . . . . . . . . . . (1,032) (1,580) (2,040)Stock-based compensation expense . . . . . . . . . . . . . . . . . . . . . . . . . . . . . . . 4,568 — —(Gain) loss on sale of assets . . . . . . . . . . . . . . . . . . . . . . . . . . . . . . . . . . . . . (10,548) — 163
Changes in assets and liabilities:(Increase) decrease in accounts receivable . . . . . . . . . . . . . . . . . . . . . . . . . . (41,083) (7,579) 1,667(Increase) decrease in insurance receivable . . . . . . . . . . . . . . . . . . . . . . . . . — 9,133 (9,133)(Increase) decrease in income tax receivable . . . . . . . . . . . . . . . . . . . . . . . . 3,213 (3,278) —Increase in inventory. . . . . . . . . . . . . . . . . . . . . . . . . . . . . . . . . . . . . . . . . . . (6,484) (2,839) (315)(Increase) decrease in prepaid expenses . . . . . . . . . . . . . . . . . . . . . . . . . . . . (5,061) 1,585 931Increase in deferred costs and other assets . . . . . . . . . . . . . . . . . . . . . . . . . . (11,419) (10,422) (9,213)Increase (decrease) in accounts payable . . . . . . . . . . . . . . . . . . . . . . . . . . . . 5,287 (2,925) (487)Increase (decrease) in accrued liabilities . . . . . . . . . . . . . . . . . . . . . . . . . . . . 3,985 (2,734) 4,971Increase in deferred credits and other liabilities . . . . . . . . . . . . . . . . . . . . . . 31,226 5,429 4,883Tax benefit from the exercise of stock options . . . . . . . . . . . . . . . . . . . . . . . — 2,250 75Other . . . . . . . . . . . . . . . . . . . . . . . . . . . . . . . . . . . . . . . . . . . . . . . . . . . . . . 1 21 (62)
(670) 15,081 18,026
Net Cash Provided by Operating Activities . . . . . . . . . . . . . . . . . . . . . . . . 85,452 41,092 25,613
CASH FLOW FROM INVESTING ACTIVITIES:Capital expenditures . . . . . . . . . . . . . . . . . . . . . . . . . . . . . . . . . . . . . . . . . . . . (78,464) (25,563) (6,527)Collection of insurance receivable . . . . . . . . . . . . . . . . . . . . . . . . . . . . . . . . . . — 15,750 —Proceeds from sale of assets . . . . . . . . . . . . . . . . . . . . . . . . . . . . . . . . . . . . . . . 26,239 — —
Net Cash Used by Investing Activities . . . . . . . . . . . . . . . . . . . . . . . . . . . (52,225) (9,813) (6,527)
CASH FLOW FROM FINANCING ACTIVITIES:Proceeds from debt . . . . . . . . . . . . . . . . . . . . . . . . . . . . . . . . . . . . . . . . . . . . . 20,000 10,000 —Principal payments on debt . . . . . . . . . . . . . . . . . . . . . . . . . . . . . . . . . . . . . . . (46,000) (101,000) (24,000)Debt issuance costs paid . . . . . . . . . . . . . . . . . . . . . . . . . . . . . . . . . . . . . . . . . — — (681)Proceeds from common stock offering . . . . . . . . . . . . . . . . . . . . . . . . . . . . . . . — 53,607 —Proceeds from exercise of stock options . . . . . . . . . . . . . . . . . . . . . . . . . . . . . . 6,067 8,680 460
Net Cash Provided Used by Financing Activities . . . . . . . . . . . . . . . . . . . (19,933) (28,713) (24,221)
NET INCREASE (DECREASE) IN CASH AND CASH EQUIVALENTS . . . . . . . . . . $ 13,294 $ 2,566 $ (5,135)CASH AND CASH EQUIVALENTS, at beginning of period . . . . . . . . . . . . . . . . . $ 18,982 $ 16,416 $ 21,551
CASH AND CASH EQUIVALENTS, at end of period . . . . . . . . . . . . . . . . . . . . . . $ 32,276 $ 18,982 $ 16,416
Supplemental disclosure of cash flow information:Cash paid during the year for domestic and foreign income taxes . . . . . . . . . . $ 2,654 $ 5,977 $ 5,549
Cash paid during the year for interest, net of amounts capitalized . . . . . . . . . . $ 5,033 $ 7,705 $ 9,208
Non-cash Activities:Increase in receivable related to reduction in value of the ATWOOD
BEACON . . . . . . . . . . . . . . . . . . . . . . . . . . . . . . . . . . . . . . . . . . . . . . . . . . . $ — $ — $ 16,300
The accompanying notes are an integral part of these consolidated financial statements.
29
%%TRANSMSG*** Transmitting Job: H41700 PCN: 024000000 ***%%PCMSG|29 |00007|Yes|No|12/18/2006 18:47|0|0|Page is valid, no graphics -- Color: D|

Atwood Oceanics, Inc. and Subsidiaries
CONSOLIDATED STATEMENTS OF CHANGES IN SHAREHOLDERS’ EQUITY
(In thousands) Shares AmountPaid-inCapital
RetainedEarnings
TotalStockholders’
EquityCommon Stock
September 30, 2003(1) . . . . . . . . . . . . . . . . . . . . . . 27,702 $27,702 $ 43,553 $192,212 $263,467Net income . . . . . . . . . . . . . . . . . . . . . . . . . . . . . . . — — — 7,587 7,587Exercise of employee stock options . . . . . . . . . . . . 44 44 416 — 460Tax benefit from exercise of employee stock
options . . . . . . . . . . . . . . . . . . . . . . . . . . . . . . . . — — 75 — 75
September 30, 2004(1) . . . . . . . . . . . . . . . . . . . . . . 27,746 $27,746 $ 44,044 $199,799 $271,589Net income . . . . . . . . . . . . . . . . . . . . . . . . . . . . . . . — — — 26,011 26,011Exercise of employee stock options . . . . . . . . . . . . 586 586 8,094 — 8,680Common stock offering . . . . . . . . . . . . . . . . . . . . . 2,350 2,350 51,257 — 53,607Tax benefit from exercise of employee stock
options . . . . . . . . . . . . . . . . . . . . . . . . . . . . . . . . — — 2,250 — 2,250
September 30, 2005(1) . . . . . . . . . . . . . . . . . . . . . . 30,682 $30,682 $105,645 $225,810 $362,137Net income . . . . . . . . . . . . . . . . . . . . . . . . . . . . . . . — — — 86,122 86,122Restricted stock awards . . . . . . . . . . . . . . . . . . . . . 5 5 (5) — —Exercise of employee stock options . . . . . . . . . . . . 359 359 5,708 — 6,067Stock option and restricted stock award
compensation expense . . . . . . . . . . . . . . . . . . . . — — 4,568 — 4,568
September 30, 2006 . . . . . . . . . . . . . . . . . . . . . . . . 31,046 $31,046 $115,916 $311,932 $458,894
(1) Fiscal years 2005, 2004 and 2003 have been restated to reflect a two-for-one stock split effected onMarch 2, 2006. See Note 7 for further discussion.
The accompanying notes are an integral part of these consolidated financial statements.
30
%%TRANSMSG*** Transmitting Job: H41700 PCN: 025000000 ***%%PCMSG|30 |00007|Yes|No|12/18/2006 18:47|0|0|Page is valid, no graphics -- Color: D|

Atwood Oceanics, Inc. and Subsidiaries
NOTES TO CONSOLIDATED FINANCIAL STATEMENTS
NOTE 1 — NATURE OF OPERATIONS
Atwood Oceanics, Inc., together with itssubsidiaries (collectively referred to herein as“we,” “our” or the “Company”), is engaged inoffshore drilling and completion of exploratoryand developmental oil and gas wells and relatedsupport, management and consulting servicesprincipally in international locations. Presently,we own and operate a premium, modern fleet ofeight mobile offshore drilling units and managethe operations of two operator-owned platformdrilling units located in Northwest Australia. Cur-rently, we are involved in active operations in theterritorial waters of Australia, Malaysia, Thailand,India, Turkey, Mauritania, Equatorial Guinea andthe United States.
NOTE 2 — SUMMARY OF SIGNIFICANTACCOUNTING POLICIES
Consolidation
The consolidated financial statementsinclude the accounts of Atwood Oceanics, Inc.and all of its domestic and foreign subsidiaries.All significant intercompany accounts and trans-actions have been eliminated in consolidation.
Cash and cash equivalents
Cash and cash equivalents consist of cash inbanks and highly liquid debt instruments, whichmature within three months of the date ofpurchase.
Foreign exchange
The United States dollar is the functionalcurrency for all areas of our operations. Accord-ingly, monetary assets and liabilities denomi-nated in foreign currency are converted to UnitedStates dollars at the rate of exchange in effect atthe end of the fiscal year, items of income andexpense are remeasured at average monthlyrates, and property and equipment and othernonmonetary amounts are remeasured at histori-cal rates. Gains and losses on foreign currencytransactions and remeasurements are included in
contract drilling costs in our consolidated state-ments of operations. We recorded a foreignexchange loss of $0.1 million during fiscal year2006, a foreign exchange gain of $0.1 million dur-ing fiscal year 2005, and no foreign exchangegain or loss during fiscal year 2004.
Accounts Receivable
We record trade accounts receivable at theamount we invoice our customers. Theseaccounts do not bear interest. Our portfolio ofaccounts receivable is comprised of major inter-national corporate entities and government orga-nizations with stable payment experience.Historically, our uncollectible accounts receivablehave been immaterial, and typically, we do notrequire collateral for our receivables. We providean allowance for uncollectible accounts, as neces-sary, on a specific identification basis. We had anallowance for doubtful accounts of $0.8 millionand $0.2 million, as of September 30, 2006 and2005, respectively.
Insurance receivable
We had an insurance receivable of $0.6 mil-lion as of September 30, 2006 and 2005, related toa claim filed as a result of damage sustained bythe ATWOOD BEACON in July 2004 while posi-tioning for a well offshore Indonesia. We expectto collect the remaining receivable during fiscalyear 2007. See Note 4 for further discussionregarding the ATWOOD BEACON incident.
Inventories of Material and Supplies
Inventories consist of spare parts, materialand supplies held for consumption and are statedprincipally at the lower of average cost or market,net of reserves for excess and obsolete inventoryof $1.3 million and $1.8 million at September 30,2006 and 2005, respectively.
Income taxes
We account for income taxes in accordancewith Statement of Financial Accounting
31
%%TRANSMSG*** Transmitting Job: H41700 PCN: 026000000 ***%%PCMSG|31 |00008|Yes|No|12/18/2006 18:47|0|0|Page is valid, no graphics -- Color: D|

Standards (“SFAS”) No. 109 “Accounting forIncome Taxes.” Under SFAS No. 109, deferredincome taxes are recorded to reflect the tax con-sequences on future years of differences betweenthe tax basis of assets and liabilities and theirfinancial reporting amounts at each year-endgiven the provisions of enacted tax laws in eachrespective jurisdiction. Deferred tax assets arereduced by a valuation allowance when, basedupon management’s estimates, it is more likelythan not that a portion of the deferred tax assetswill not be realized in a future period.
Property and equipment
Property and equipment are recorded at cost.Interest costs related to property under construc-tion are capitalized as a component of construc-tion costs. Interest capitalized during fiscal year2006 was $1.6 million. We had no capitalizedinterest during fiscal years 2005 or 2004.
Once a rig is placed in service, it is depreci-ated on the straight-line method over its esti-mated useful life, with depreciation discontinuedonly during the period when a drilling unit is outof service while undergoing a significant upgradethat extends its useful life. Our estimated usefullives of our various classifications of assets are asfollows:
Years
Drilling vessels and related equipment . . . . . . . . . 5-25
Drill pipe . . . . . . . . . . . . . . . . . . . . . . . . . . . . . . . 3
Furniture and other . . . . . . . . . . . . . . . . . . . . . . . 3-10
Maintenance, repairs and minor replace-ments are charged against income as incurred;major replacements and upgrades are capitalizedand depreciated over the remaining useful life ofthe asset as determined upon completion of thework. The cost and related accumulated depreci-ation of assets sold, retired or otherwise disposedare removed from the accounts at the time ofdisposition, and any resulting gain or loss isreflected in the Consolidated Statements of Oper-ations for the applicable period.
Impairment of property and equipment
We periodically evaluate our property andequipment to determine that their net carryingvalue is not in excess of their net realizable value.These evaluations are performed when we havesustained significant declines in utilization anddayrates and recovery is not contemplated in thenear future. We consider a number of factorssuch as estimated future cash flows, appraisalsand current market value analysis in determiningan asset’s fair value. Assets are written down totheir fair value if the carrying amount of the assetis not recoverable and exceeds its fair value.
Deferred drydocking costs
We defer the costs of scheduled drydockingand charge such costs to expense over the periodto the next scheduled drydocking (normally30 months). At September 30, 2006 and 2005,deferred drydocking costs totaling $0.6 millionand $0.7 million, respectively, were included inDeferred Costs and Other Assets in the accompa-nying Consolidated Balance Sheets.
Revenue recognition
We account for drilling and managementcontract revenue in accordance with the term ofthe underlying drilling or management contract.These contracts generally provide that revenue isearned and recognized on a daily basis. Weprovide crewed rigs to customers on a daily rate(i.e. “dayrate”) basis. Dayrate contracts can be fora specified period of time or the time required todrill a specified well or number of wells. Reve-nues from dayrate drilling operations, which areclassified under contract drilling services, are rec-ognized on a per day basis as the workprogresses. In addition, business interruption pro-ceeds are also recognized on a per day basis. SeeNote 4 for further discussion of the ATWOODBEACON incident.
32
Atwood Oceanics, Inc. and Subsidiaries
NOTES TO CONSOLIDATED FINANCIAL STATEMENTS — (Cont.)
%%TRANSMSG*** Transmitting Job: H41700 PCN: 027000000 ***%%PCMSG|32 |00009|Yes|No|12/18/2006 18:47|0|0|Page is valid, no graphics -- Color: D|

Deferred fees and costs
Lump-sum fees received at commencementof the drilling contract as compensation for thecost of relocating drilling rigs from one majoroperating area to another, as well as equipmentand upgrade costs reimbursed by the customerare recognized as earned on a straight-linemethod over the term of the related drilling con-tract, as are the dayrates associated with suchcontract. However, lump-sum fees received upontermination of a drilling contract are recognizedas earned during the period termination occurs.In addition, we defer the mobilization costs relat-ing to moving a drilling rig to a new area andcustomer requested equipment purchases thatwill revert to the customer at the end of theapplicable drilling contract. We amortize suchcosts on a straight-line basis over the life of theapplicable drilling contract. Contract revenuesand drilling costs are reported in the Statementsof Operations at their gross amounts.
At September 30, 2006 and 2005, deferredfees associated with mobilization as well asequipment purchases and upgrades totaled$23.7 million and $3.6 million, respectively. AtSeptember 30, 2006 and 2005, deferred costsassociated with mobilization and equipment pur-chases totaled $9.0 million and $7.8 million,respectively. Deferred fees and deferred costs areclassified as current or long-term in the accompa-nying Consolidated Balance Sheets based on theexpected term of the applicable drilling contracts.
Share-based compensation
Effective October 1, 2005, we adopted State-ment of Financial Accounting StandardsNo. 123(R), “Share-Based Payment”, orSFAS 123(R), using the modified prospectiveapplication transition method. Under this method,stock-based compensation cost is measured atthe grant date, based on the calculated fair valueof the award, and is recognized as an expenseover the requisite service period (generally thevesting period of the equity grant). In addition,stock-based compensation cost recognized
includes compensation cost for unvested stock-based awards as of October 1, 2005. Prior toOctober 1, 2005, we accounted for share-basedcompensation in accordance with AccountingPrinciples Board Opinion No. 25, “Accounting forStock Issued to Employees”, or APB No. 25. Noshare-based employee compensation cost hasbeen reflected in net income prior to October 1,2005. Before that date, we reported the entire taxbenefit related to the exercise of stock options asan operating cash flow. SFAS 123(R) requires usto report the tax benefit from the tax deductionthat is in excess of recognized compensationcosts (excess tax benefits) as a financing cashflow rather than as an operating cash flow. Thecumulative effect of the change in accountingprinciple from APB No. 25 to SFAS 123(R) wasnot material. See Note 3 for additionalinformation.
Earnings per common share
Basic and diluted earnings per share havebeen computed in accordance with SFAS No. 128,“Earnings per Share” (EPS). “Basic” EPS excludesdilution and is computed by dividing net income(loss) by the weighted-average number of com-mon shares outstanding for the period. “Diluted”EPS reflects the issuance of additional shares inconnection with the assumed conversion of stockoptions. Under the modified prospective applica-tion transition method of SFAS 123(R), we haveincluded the impact of pro forma deferred taxassets in calculating the potential windfall andshortfall tax benefits to determine the amount ofdiluted shares using the treasury stock method.
33
Atwood Oceanics, Inc. and Subsidiaries
NOTES TO CONSOLIDATED FINANCIAL STATEMENTS — (Cont.)
%%TRANSMSG*** Transmitting Job: H41700 PCN: 028000000 ***%%PCMSG|33 |00007|Yes|No|12/18/2006 18:47|0|0|Page is valid, no graphics -- Color: D|
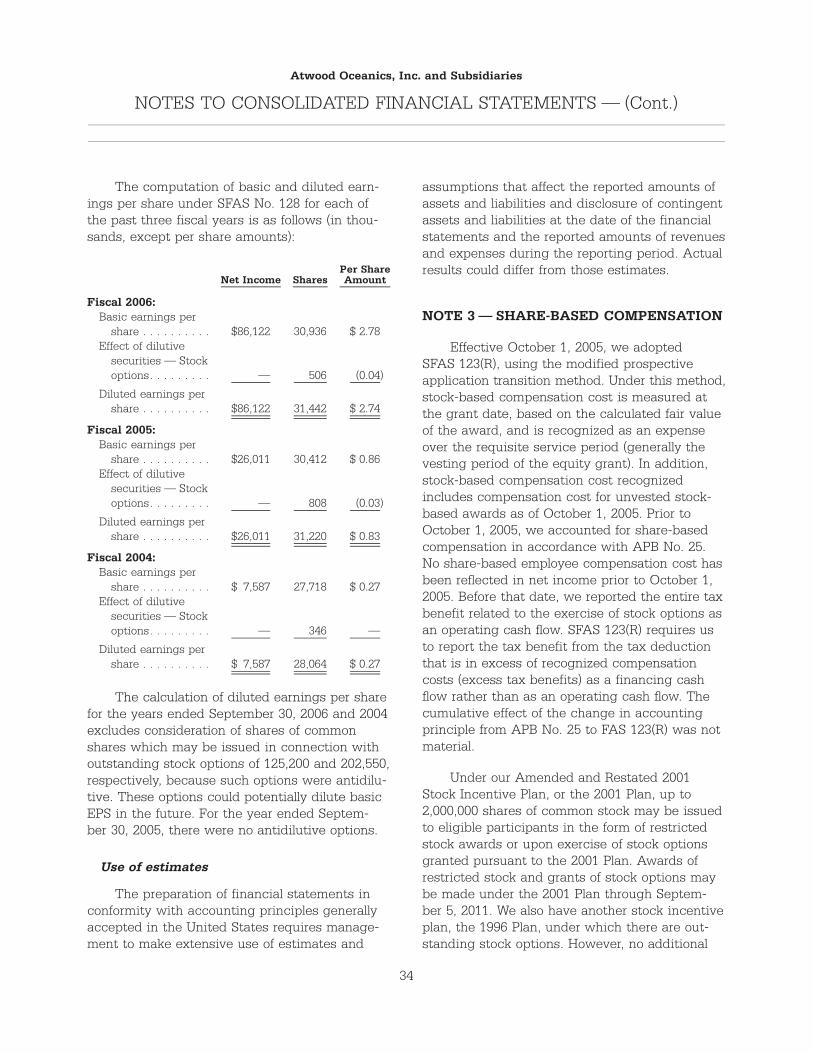
The computation of basic and diluted earn-ings per share under SFAS No. 128 for each ofthe past three fiscal years is as follows (in thou-sands, except per share amounts):
Net Income SharesPer ShareAmount
Fiscal 2006:Basic earnings per
share . . . . . . . . . . $86,122 30,936 $ 2.78Effect of dilutive
securities — Stockoptions. . . . . . . . . — 506 (0.04)
Diluted earnings pershare . . . . . . . . . . $86,122 31,442 $ 2.74
Fiscal 2005:Basic earnings per
share . . . . . . . . . . $26,011 30,412 $ 0.86Effect of dilutive
securities — Stockoptions. . . . . . . . . — 808 (0.03)
Diluted earnings pershare . . . . . . . . . . $26,011 31,220 $ 0.83
Fiscal 2004:Basic earnings per
share . . . . . . . . . . $ 7,587 27,718 $ 0.27Effect of dilutive
securities — Stockoptions. . . . . . . . . — 346 —
Diluted earnings pershare . . . . . . . . . . $ 7,587 28,064 $ 0.27
The calculation of diluted earnings per sharefor the years ended September 30, 2006 and 2004excludes consideration of shares of commonshares which may be issued in connection withoutstanding stock options of 125,200 and 202,550,respectively, because such options were antidilu-tive. These options could potentially dilute basicEPS in the future. For the year ended Septem-ber 30, 2005, there were no antidilutive options.
Use of estimates
The preparation of financial statements inconformity with accounting principles generallyaccepted in the United States requires manage-ment to make extensive use of estimates and
assumptions that affect the reported amounts ofassets and liabilities and disclosure of contingentassets and liabilities at the date of the financialstatements and the reported amounts of revenuesand expenses during the reporting period. Actualresults could differ from those estimates.
NOTE 3 — SHARE-BASED COMPENSATION
Effective October 1, 2005, we adoptedSFAS 123(R), using the modified prospectiveapplication transition method. Under this method,stock-based compensation cost is measured atthe grant date, based on the calculated fair valueof the award, and is recognized as an expenseover the requisite service period (generally thevesting period of the equity grant). In addition,stock-based compensation cost recognizedincludes compensation cost for unvested stock-based awards as of October 1, 2005. Prior toOctober 1, 2005, we accounted for share-basedcompensation in accordance with APB No. 25.No share-based employee compensation cost hasbeen reflected in net income prior to October 1,2005. Before that date, we reported the entire taxbenefit related to the exercise of stock options asan operating cash flow. SFAS 123(R) requires usto report the tax benefit from the tax deductionthat is in excess of recognized compensationcosts (excess tax benefits) as a financing cashflow rather than as an operating cash flow. Thecumulative effect of the change in accountingprinciple from APB No. 25 to FAS 123(R) was notmaterial.
Under our Amended and Restated 2001Stock Incentive Plan, or the 2001 Plan, up to2,000,000 shares of common stock may be issuedto eligible participants in the form of restrictedstock awards or upon exercise of stock optionsgranted pursuant to the 2001 Plan. Awards ofrestricted stock and grants of stock options maybe made under the 2001 Plan through Septem-ber 5, 2011. We also have another stock incentiveplan, the 1996 Plan, under which there are out-standing stock options. However, no additional
34
Atwood Oceanics, Inc. and Subsidiaries
NOTES TO CONSOLIDATED FINANCIAL STATEMENTS — (Cont.)
%%TRANSMSG*** Transmitting Job: H41700 PCN: 029000000 ***%%PCMSG|34 |00007|Yes|No|12/18/2006 18:47|0|0|Page is valid, no graphics -- Color: D|

options or restricted stock will be awarded underthe 1996 plan.
A summary of share and stock option datafor our two stock incentive plans as of Septem-ber 30, 2006 is as follows:
2001Plan
1996Plan
Shares available for future awards orgrants . . . . . . . . . . . . . . . . . . . . . . 755,049 102,000
Outstanding stock option grants . . . . 969,200 467,750Outstanding unvested restricted
stock awards . . . . . . . . . . . . . . . . 92,600 —
Awards of restricted stock and stock optionshave both been granted under our stock incen-tive plans as of September 30, 2006. We delivernewly issued shares of common stock forrestricted stock awards upon vesting and uponexercise of stock options. All stock incentiveplans currently in effect have been approved bythe shareholders of our outstanding commonstock.
For the year ended September 30, 2006, theimpact of adopting SFAS 123(R) had no effect onour cash flows, however, but did have the follow-ing effect on our consolidated statements of oper-ations (in thousands, except per share amounts):
Increase in contract drilling expenses . . . . . . . . . $ 840Increase in general and administrative
expenses . . . . . . . . . . . . . . . . . . . . . . . . . . . . 3,728Decrease in income tax provision . . . . . . . . . . . . (1,305)
Decrease in net income . . . . . . . . . . . . . . . . . . . 3,263
Decrease in earnings per share:Basic . . . . . . . . . . . . . . . . . . . . . . . . . . . . . . . $ 0.11Diluted . . . . . . . . . . . . . . . . . . . . . . . . . . . . . $ 0.10
We recognize compensation expense ongrants of share-based compensation awards on astraight-line basis over the required serviceperiod for each award. As of September 30, 2006,unrecognized compensation cost, net of esti-mated forfeitures, related to stock options andrestricted stock awards was approximately$4.6 million and $2.7 million, respectively, which
we expect to recognize over a weighted averageperiod of approximately 2.4 years.
Stock Options
Under our stock incentive plans, the exerciseprice of each stock option equals the fair marketvalue of one share of our common stock on thedate of grant, with all outstanding options havinga maximum term of 10 years. Options vest rat-ably over a period from the end of the first to thefourth year from the date of grant under the 2001Plan and from the end of the second to the fifthyear from the date of grant under the 1996 Plan.Each option is for the purchase of one share ofour common stock.
The total fair value of stock options vestedduring years ended September 30, 2006, 2005and 2004 was $3.2 million, $2.9 million and$2.2 million, respectively. The per share weightedaverage fair value of stock options granted duringyears ended September 30, 2006, 2005 and 2004was $17.87, $10.22 and $7.08, respectively. Weestimated the fair value of each stock option onthe date of grant using the Black-Scholes pricingmodel and the following assumptions:
Fiscal2006
Fiscal2005
Fiscal2004
Risk-Free Interest Rate . . . . . 4.50% 4.27% 4.38%
Expected Volatility . . . . . . . . 41.62% 35.00% 50.00%
Expected Life (Years) . . . . . . 6 6 6
Dividend Yield . . . . . . . . . . . None None None
The average risk-free interest rate is basedon the five-year United States treasury securityrate in effect as of the grant date. We determinedexpected volatility using a two to six year histor-ical volatility figure and determined the expectedterm of the stock options using 15 years of histor-ical data. The expected dividend yield is basedon the expected annual dividend as a percentageof the market value of our common stock as ofthe grant date.
35
Atwood Oceanics, Inc. and Subsidiaries
NOTES TO CONSOLIDATED FINANCIAL STATEMENTS — (Cont.)
%%TRANSMSG*** Transmitting Job: H41700 PCN: 030000000 ***%%PCMSG|35 |00007|Yes|No|12/18/2006 18:47|0|0|Page is valid, no graphics -- Color: D|
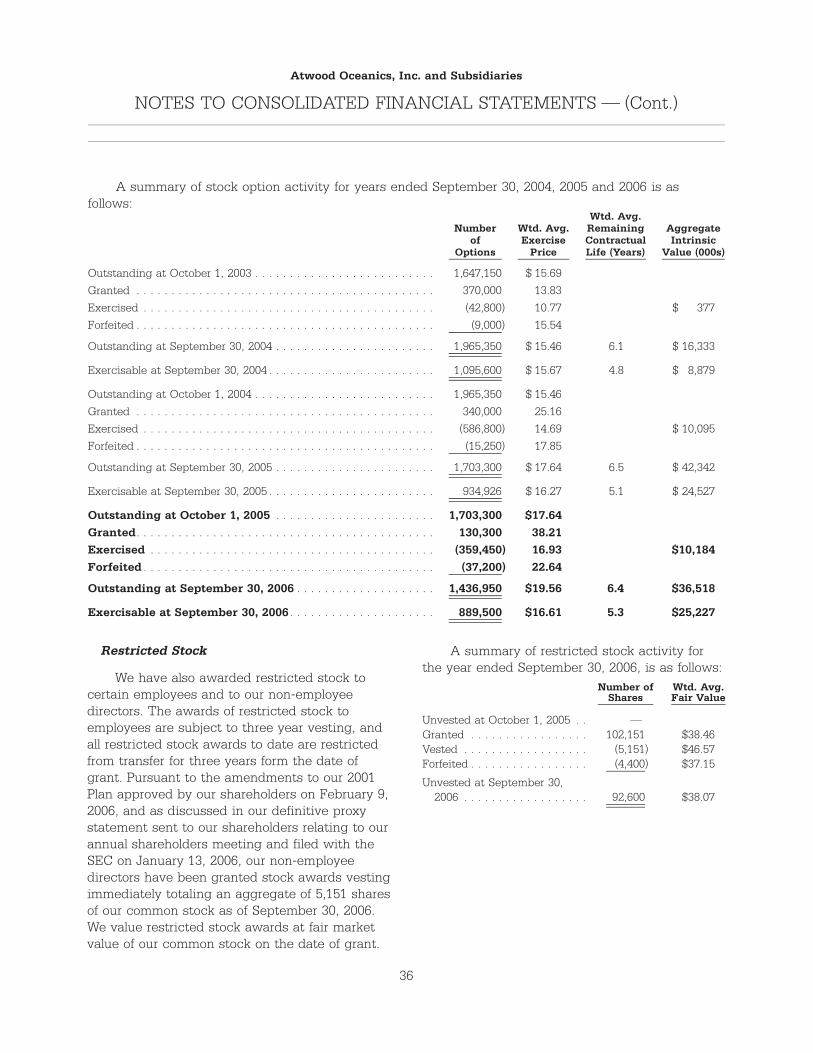
A summary of stock option activity for years ended September 30, 2004, 2005 and 2006 is asfollows:
Numberof
Options
Wtd. Avg.Exercise
Price
Wtd. Avg.RemainingContractualLife (Years)
AggregateIntrinsic
Value (000s)
Outstanding at October 1, 2003 . . . . . . . . . . . . . . . . . . . . . . . . . . 1,647,150 $ 15.69
Granted . . . . . . . . . . . . . . . . . . . . . . . . . . . . . . . . . . . . . . . . . . . 370,000 13.83
Exercised . . . . . . . . . . . . . . . . . . . . . . . . . . . . . . . . . . . . . . . . . . (42,800) 10.77 $ 377
Forfeited . . . . . . . . . . . . . . . . . . . . . . . . . . . . . . . . . . . . . . . . . . . (9,000) 15.54
Outstanding at September 30, 2004 . . . . . . . . . . . . . . . . . . . . . . . 1,965,350 $ 15.46 6.1 $ 16,333
Exercisable at September 30, 2004 . . . . . . . . . . . . . . . . . . . . . . . . 1,095,600 $ 15.67 4.8 $ 8,879
Outstanding at October 1, 2004 . . . . . . . . . . . . . . . . . . . . . . . . . . 1,965,350 $ 15.46
Granted . . . . . . . . . . . . . . . . . . . . . . . . . . . . . . . . . . . . . . . . . . . 340,000 25.16
Exercised . . . . . . . . . . . . . . . . . . . . . . . . . . . . . . . . . . . . . . . . . . (586,800) 14.69 $ 10,095
Forfeited . . . . . . . . . . . . . . . . . . . . . . . . . . . . . . . . . . . . . . . . . . . (15,250) 17.85
Outstanding at September 30, 2005 . . . . . . . . . . . . . . . . . . . . . . . 1,703,300 $ 17.64 6.5 $ 42,342
Exercisable at September 30, 2005 . . . . . . . . . . . . . . . . . . . . . . . . 934,926 $ 16.27 5.1 $ 24,527
Outstanding at October 1, 2005 . . . . . . . . . . . . . . . . . . . . . . . 1,703,300 $17.64Granted. . . . . . . . . . . . . . . . . . . . . . . . . . . . . . . . . . . . . . . . . . . 130,300 38.21Exercised . . . . . . . . . . . . . . . . . . . . . . . . . . . . . . . . . . . . . . . . . (359,450) 16.93 $10,184Forfeited . . . . . . . . . . . . . . . . . . . . . . . . . . . . . . . . . . . . . . . . . . (37,200) 22.64
Outstanding at September 30, 2006 . . . . . . . . . . . . . . . . . . . . 1,436,950 $19.56 6.4 $36,518
Exercisable at September 30, 2006 . . . . . . . . . . . . . . . . . . . . . 889,500 $16.61 5.3 $25,227
Restricted Stock
We have also awarded restricted stock tocertain employees and to our non-employeedirectors. The awards of restricted stock toemployees are subject to three year vesting, andall restricted stock awards to date are restrictedfrom transfer for three years form the date ofgrant. Pursuant to the amendments to our 2001Plan approved by our shareholders on February 9,2006, and as discussed in our definitive proxystatement sent to our shareholders relating to ourannual shareholders meeting and filed with theSEC on January 13, 2006, our non-employeedirectors have been granted stock awards vestingimmediately totaling an aggregate of 5,151 sharesof our common stock as of September 30, 2006.We value restricted stock awards at fair marketvalue of our common stock on the date of grant.
A summary of restricted stock activity forthe year ended September 30, 2006, is as follows:
Number ofShares
Wtd. Avg.Fair Value
Unvested at October 1, 2005 . . —Granted . . . . . . . . . . . . . . . . . 102,151 $38.46Vested . . . . . . . . . . . . . . . . . . (5,151) $46.57Forfeited . . . . . . . . . . . . . . . . . (4,400) $37.15
Unvested at September 30,2006 . . . . . . . . . . . . . . . . . . 92,600 $38.07
36
Atwood Oceanics, Inc. and Subsidiaries
NOTES TO CONSOLIDATED FINANCIAL STATEMENTS — (Cont.)
%%TRANSMSG*** Transmitting Job: H41700 PCN: 031000000 ***%%PCMSG|36 |00007|Yes|No|12/18/2006 18:47|0|0|Page is valid, no graphics -- Color: D|
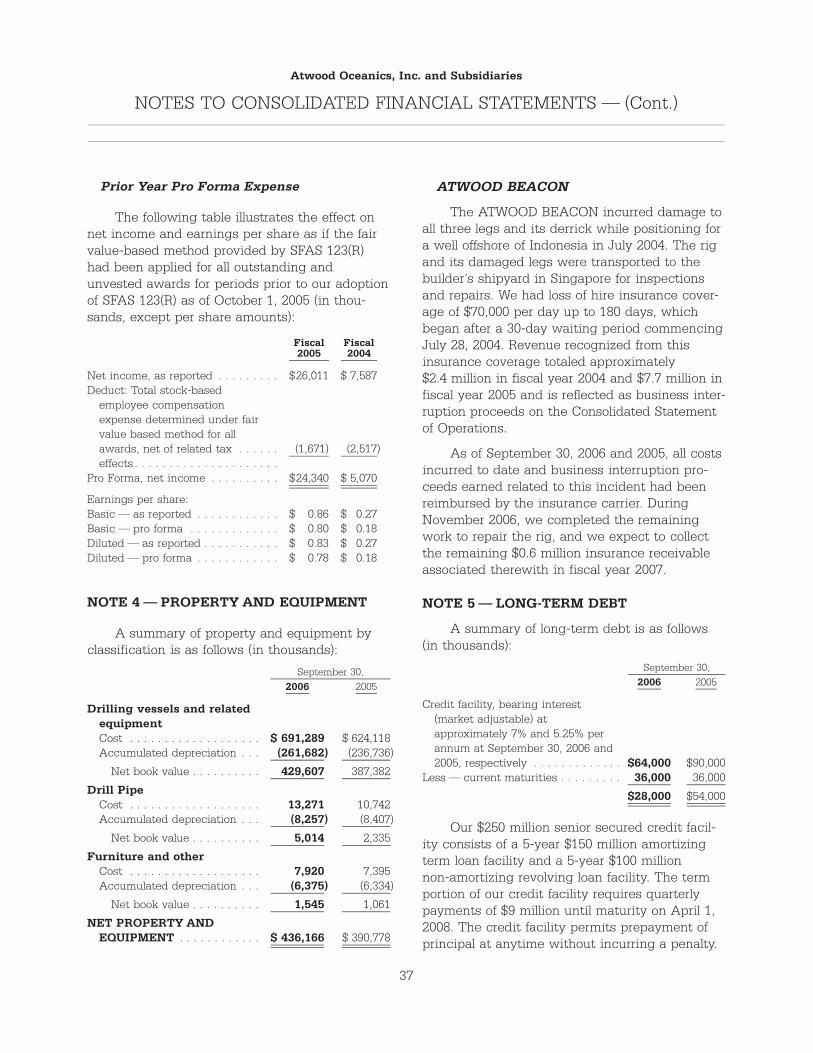
Prior Year Pro Forma Expense
The following table illustrates the effect onnet income and earnings per share as if the fairvalue-based method provided by SFAS 123(R)had been applied for all outstanding andunvested awards for periods prior to our adoptionof SFAS 123(R) as of October 1, 2005 (in thou-sands, except per share amounts):
Fiscal2005
Fiscal2004
Net income, as reported . . . . . . . . . $26,011 $ 7,587Deduct: Total stock-based
employee compensationexpense determined under fairvalue based method for allawards, net of related tax . . . . . . (1,671) (2,517)effects . . . . . . . . . . . . . . . . . . . . .
Pro Forma, net income . . . . . . . . . . $24,340 $ 5,070
Earnings per share:Basic — as reported . . . . . . . . . . . . $ 0.86 $ 0.27Basic — pro forma . . . . . . . . . . . . . $ 0.80 $ 0.18Diluted — as reported . . . . . . . . . . . $ 0.83 $ 0.27Diluted — pro forma . . . . . . . . . . . . $ 0.78 $ 0.18
NOTE 4 — PROPERTY AND EQUIPMENT
A summary of property and equipment byclassification is as follows (in thousands):
2006 2005September 30,
Drilling vessels and relatedequipmentCost . . . . . . . . . . . . . . . . . . . $ 691,289 $ 624,118Accumulated depreciation . . . (261,682) (236,736)
Net book value . . . . . . . . . . 429,607 387,382
Drill PipeCost . . . . . . . . . . . . . . . . . . . 13,271 10,742Accumulated depreciation . . . (8,257) (8,407)
Net book value . . . . . . . . . . 5,014 2,335
Furniture and otherCost . . . . . . . . . . . . . . . . . . . 7,920 7,395Accumulated depreciation . . . (6,375) (6,334)
Net book value . . . . . . . . . . 1,545 1,061
NET PROPERTY ANDEQUIPMENT . . . . . . . . . . . . $ 436,166 $ 390,778
ATWOOD BEACON
The ATWOOD BEACON incurred damage toall three legs and its derrick while positioning fora well offshore of Indonesia in July 2004. The rigand its damaged legs were transported to thebuilder’s shipyard in Singapore for inspectionsand repairs. We had loss of hire insurance cover-age of $70,000 per day up to 180 days, whichbegan after a 30-day waiting period commencingJuly 28, 2004. Revenue recognized from thisinsurance coverage totaled approximately$2.4 million in fiscal year 2004 and $7.7 million infiscal year 2005 and is reflected as business inter-ruption proceeds on the Consolidated Statementof Operations.
As of September 30, 2006 and 2005, all costsincurred to date and business interruption pro-ceeds earned related to this incident had beenreimbursed by the insurance carrier. DuringNovember 2006, we completed the remainingwork to repair the rig, and we expect to collectthe remaining $0.6 million insurance receivableassociated therewith in fiscal year 2007.
NOTE 5 — LONG-TERM DEBT
A summary of long-term debt is as follows(in thousands):
2006 2005September 30,
Credit facility, bearing interest(market adjustable) atapproximately 7% and 5.25% perannum at September 30, 2006 and2005, respectively . . . . . . . . . . . . . $64,000 $90,000
Less — current maturities . . . . . . . . . 36,000 36,000
$28,000 $54,000
Our $250 million senior secured credit facil-ity consists of a 5-year $150 million amortizingterm loan facility and a 5-year $100 millionnon-amortizing revolving loan facility. The termportion of our credit facility requires quarterlypayments of $9 million until maturity on April 1,2008. The credit facility permits prepayment ofprincipal at anytime without incurring a penalty.
37
Atwood Oceanics, Inc. and Subsidiaries
NOTES TO CONSOLIDATED FINANCIAL STATEMENTS — (Cont.)
%%TRANSMSG*** Transmitting Job: H41700 PCN: 032000000 ***%%PCMSG|37 |00008|Yes|No|12/18/2006 18:47|0|0|Page is valid, no graphics -- Color: D|

At September 30, 2005, we had $90 million out-standing under the term portion of our creditfacility and none outstanding under the revolvingportion of our credit facility while at Septem-ber 30, 2006, we had $54 million outstandingunder the term portion of our credit facility and$10 million outstanding under the revolving por-tion of our credit facility. The collateral at Sep-tember 30, 2006 for the Credit Facility consistsprimarily of preferred mortgages on all eight ofour active drilling units (with an aggregate netbook value at September 30, 2006 totalingapproximately $397 million). We are not requiredto maintain compensating balances; however, weare required to pay a fee of approximately0.60% per annum on the unused portion of therevolving portion of our credit facility and certainother administrative costs.
The Credit Facility contains financial cove-nants, including but not limited to, requirementsfor maintaining certain net worth and other finan-cial ratios, and restrictions on disposing of anymaterial assets, paying cash dividends or repur-chasing any of our outstanding common stockand incurring any additional indebtedness inexcess of $3 million. We are in compliance withall financial covenants at September 30, 2006.Further, at all times during fiscal year 2004, 2005and 2006 when we were required to determinecompliance with our financial covenants, wewere in compliance with the covenants. Asidefrom the financial covenants, no other provisionsexist in the Credit Facility that could result inacceleration of the April 1, 2008 maturity date.
The Credit Facility also supports issuance,when required, of standby letters of guarantee.At September 30, 2006, standby letters of guaran-tee in the aggregate amount of approximately$0.5 million were outstanding.
Future maturities of long-term debt are asfollows (in thousands):
Fiscal Year Amount
2007 . . . . . . . . . . . . . . . . . . . . . . . . . . . . . . . . $36,0002008 . . . . . . . . . . . . . . . . . . . . . . . . . . . . . . . . 28,000
$64,000
NOTE 6 — INCOME TAXES
Domestic and foreign income before incometaxes for the three-year period ended Septem-ber 30, 2006 is as follows (in thousands):
Fiscal2006
Fiscal2005
Fiscal2004
Domestic income (loss) . . $ 5,738 $ (45) $ 1,094Foreign income . . . . . . . . 86,098 25,653 11,308
$91,836 $25,608 $12,402
The provision (benefit) for domestic and for-eign taxes on income consists of the following (inthousands):
Fiscal2006
Fiscal2005
Fiscal2004
Current — domestic . . . . . . $ 58 $(3,278) $ 277Deferred — domestic . . . . . (392) (270) (990)Current — foreign . . . . . . . . 6,688 2,205 6,578Deferred — foreign . . . . . . . (640) 940 (1,050)
$5,714 $ (403) $ 4,815
38
Atwood Oceanics, Inc. and Subsidiaries
NOTES TO CONSOLIDATED FINANCIAL STATEMENTS — (Cont.)
%%TRANSMSG*** Transmitting Job: H41700 PCN: 033000000 ***%%PCMSG|38 |00005|Yes|No|12/18/2006 18:47|0|0|Page is valid, no graphics -- Color: D|

The components of the deferred income taxassets (liabilities) as of September 30, 2006 and2005 are as follows (in thousands):
2006 2005
September 30,
Deferred tax assets —Net operating loss
carryforwards. . . . . . . . . . . . . $ 2,550 $ 5,900Tax credit carryforwards . . . . . . 1,400 1,390Stock option compensation
expense. . . . . . . . . . . . . . . . . 1,215 —Book accruals . . . . . . . . . . . . . . — 20
5,165 7,310
Deferred tax liabilities —Difference in book and tax basis
of equipment . . . . . . . . . . . . . (20,553) (22,530)Deferred income . . . . . . . . . . . . — (1,330)
(20,553) (23,860)
Net deferred tax liabilities beforevaluation allowance . . . . . . . . . . (15,388) (16,550)
Valuation allowance . . . . . . . . . . . (640) (510)
$(16,028) $(17,060)
Net current deferred tax assets . . . $ 2,563 $ 3,080Net noncurrent deferred tax
liabilities . . . . . . . . . . . . . . . . . . (18,591) (20,140)
$(16,028) $(17,060)
The $2.6 million of net operating loss carry-forwards (“NOL’s”), relates to Australian NOL’swhich do not expire. In addition, $0.6 million ofthe $1.4 million of tax credit carryforwards do notexpire, and $0.2 million expire in 2022. Manage-ment expects that the NOL’s and tax creditcarryforwards will be utilized to offset tax obliga-tions in future periods with the exception of$0.6 million of the tax credit carryforwards thatwill begin to expire in 2012. Thus, a correspond-ing $0.6 million valuation allowance is recordedas of September 30, 2006. An analysis of thechange in the valuation allowance during thecurrent fiscal year is as follows (in thousands):
Valuation Allowance as of September 30, 2005 . . . $510Foreign tax credit carryforwards generated . . . . 130
Valuation Allowance as of September 30, 2006 . . . $640
Under SFAS 123(R), $1.5 million of UnitedStates NOL’s relates to windfall tax benefits,which will not be realized or recorded until thededuction reduces our United States incometaxes payable. At such time, the amount will berecorded as an increase to paid-in-capital. Weapply the “with-and-without” approach when uti-lizing certain tax attributes whereby windfall taxbenefits are used last to offset taxable income.
We do not record federal income taxes onthe undistributed earnings of our foreign subsid-iaries that we consider to be permanently rein-vested in foreign operations. In addition, therewas no cumulative amount of such undistributedearnings and profits at September 30, 2006.
The differences between the United Statesstatutory and our effective income tax rate are asfollows:
Fiscal2006
Fiscal2005
Fiscal2004
Statutory income tax rate. . . . . . 35% 35% 35%Resolution of prior period tax
items . . . . . . . . . . . . . . . . . . . (7) (23) (3)Increase (decrease) in tax rate
resulting from — Foreign taxrate differentials, net offoreign tax credit utilization . . (22) (14) 7
Effective income tax rate . . . . . . 6% (2)% 39%
As a result of working in foreign jurisdic-tions, we earned a high level of operating incomeearned in certain nontaxable and deemed profittax jurisdictions which significantly reduced oureffective tax rate for the current fiscal year whencompared to the United States statutory rate. Inaddition, we reversed a $1.8 million tax contin-gent liability during fiscal year 2006 due to theexpiration of the statute of limitations in a foreignjurisdiction. Also, we were advised by a foreigntax authority that it had approved acceptance ofcertain amended prior year tax returns. Theacceptance of these amended tax returns, alongwith the fiscal year 2005 tax return in this foreignjurisdiction, resulted in the recognition of a$4.6 million tax benefit in the third quarter of thecurrent fiscal year.
39
Atwood Oceanics, Inc. and Subsidiaries
NOTES TO CONSOLIDATED FINANCIAL STATEMENTS — (Cont.)
%%TRANSMSG*** Transmitting Job: H41700 PCN: 034000000 ***%%PCMSG|39 |00005|Yes|No|12/18/2006 18:47|0|0|Page is valid, no graphics -- Color: D|

During the first quarter of fiscal year 2005,we received a $1.7 million tax refund in Malaysiarelated to a previously reserved tax receivable. A$1.0 million deferred tax benefit was recognizedin June 2005 due to the filing and subsequentacceptance by the local tax authority, of amendedprior year tax returns. On December 1, 2005, wereceived notification from the United StatesDepartment of Treasury that a previouslyreserved United States income tax refund we hadbeen pursuing for over two years had beenapproved for payment. Based upon this approval,we reduced our income tax provision by therefund amount of $3.3 million for the year endedSeptember 30, 2005. Furthermore, during fiscalyear 2005, operating income earned in certainnontaxable and deemed profit tax jurisdictionswas higher when compared to the prior fiscalyear, including business interruption proceedsearned by the ATWOOD BEACON in a zero taxjurisdiction for approximately three and a halfmonths, which contributed to our lower effectivetax rate. As a result of these items, our effectivetax rate for fiscal year 2005 was significantly lesswhen compared to the prior fiscal year and theUnited States statutory rate.
NOTE 7 — CAPITAL STOCK
PREFERRED STOCK
In 1975, 1,000,000 shares of preferred stockwith no par value were authorized. In October2002, we designated Series A Junior ParticipatingPreferred Stock. No preferred shares have beenissued.
COMMON STOCK
During the current fiscal year, our sharehold-ers approved a proposal to increase the autho-rized shares of our common stock from20,000,000 shares to 50,000,000 shares.
On March 2, 2006, the Board of Directorsdeclared a two-for-one stock split of our commonstock effected in the form of a 100% commonstock dividend. All shareholders of record on
March 24, 2006 received one additional share ofcommon stock for each share held on that date.The additional shares of common stock weredistributed in the form of a stock dividend onApril 7, 2006. All share and per share amounts inthe accompanying condensed consolidated finan-cial statements and related notes have beenadjusted to reflect the stock split for all periodspresented.
In October 2004, we sold in a public offering2,350,000 shares of our common stock at aneffective net price (before expenses) of $22.92 fornet proceeds of approximately $53.6 million. Weused these proceeds and cash on hand to repaythe $55 million outstanding as of September 30,2004 under the revolving portion of our CreditFacility.
RIGHTS AGREEMENT
In September 2002, we authorized anddeclared a dividend of one Right (as defined inRights Agreement effective October 18, 2002,which governs the Rights) for each outstandingshare of common stock as of November 5, 2002,subject to lender approval and consent, whichwas obtained. One Right will also be associatedwith each share of common stock that becomesoutstanding after November 5, 2002 but beforethe earliest of the Distribution Date, the Redemp-tion Date and the Final Expiration Date (asdefined in Rights Agreement). The Rights are notexercisable until a person or group of affiliated orassociated persons begin to acquire or acquiresbeneficial ownership of 15 percent or more of ouroutstanding common stock. This provision doesnot apply to shareholders already holding 15 per-cent or more of our outstanding common stockas of November 5, 2002 until they acquire anadditional 5 percent.
In connection with the March 2006 stocksplit, discussed above, and in accordance withthe Rights Agreement, we decreased from oneone-thousandth to one two-thousandth of a sharethe number of shares of our Series A JuniorParticipating Preferred Stock, no par value,
40
Atwood Oceanics, Inc. and Subsidiaries
NOTES TO CONSOLIDATED FINANCIAL STATEMENTS — (Cont.)
%%TRANSMSG*** Transmitting Job: H41700 PCN: 035000000 ***%%PCMSG|40 |00006|Yes|No|12/18/2006 18:47|0|0|Page is valid, no graphics -- Color: D|

purchasable at a price of $150 upon the exerciseof each Right, when exercisable. The redemptionprice of the Rights was also decreased from $0.01to $0.005 in connection with the stock split. TheRights are subject to further adjustment for cer-tain future events including any future stocksplits. The Rights will expire on November 5,2012. At September 30, 2006, 500,000 preferredshares have been reserved for issuance in theevent that Rights are exercised.
NOTE 8 — RETIREMENT PLANS
We have two contributory retirement plans(the “Plans”) under which qualified participantsmay make contributions, which together with ourcontributions, can be up to 100% of their com-pensation, as defined, to a maximum of $40,000.Participants must contribute from 1 to 5 percentof their earnings as a required contribution (“thebasic contribution”). We make contributions tothe Plans equal to twice the basic contributions.After six consecutive months of service, anemployee can elect to become a participant in aPlan. Our contributions vest 100% to each partic-ipant after three years of service with us includ-ing any period of ineligibility mandated by thePlans. If a participant terminates employmentbefore becoming fully vested, the unvested por-tion is credited to our account and can be usedonly to offset our future contribution require-ments. During fiscal years 2006 and 2005, noforfeitures were utilized to reduce our cash con-tribution requirements while in fiscal year 2004,$120,000 of forfeitures were utilized to reduce ourcash contribution requirements. In fiscal years2006, 2005 and 2004, our actual cash contribu-tions totaled approximately $3.1 million, $2.7 mil-lion and $2.4 million, respectively. As ofSeptember 30, 2006, there were approximately$0.1 million of contribution forfeitures, which canbe utilized to reduce our future cash contributionrequirements.
NOTE 9 — FAIR VALUE OF FINANCIALINSTRUMENTS
The carrying values of cash and cash equiv-alents, accounts receivable, accounts payableand accrued liabilities included in the accompa-nying Consolidated Balance Sheets approximatefair value due to the short maturity of theseinstruments. Since the Credit Facility (asdescribed in Note 5) has a market adjustableinterest rate, the carrying value approximated fairvalue as of September 30, 2006 and 2005.
NOTE 10 — CONCENTRATION OF MARKETAND CREDIT RISK
All of our customers are in the oil and gasoffshore exploration and production industry. Thisindustry concentration has the potential toimpact our overall exposure to market and creditrisks, either positively or negatively, in that ourcustomers could be affected by similar changesin economic, industry or other conditions. How-ever, we believe that the credit risk posed by thisindustry concentration is offset by the creditwor-thiness of our customer base.
Revenues from significant customers fromthe prior three fiscal years are as follows (inthousands):
Fiscal2006
Fiscal2005
Fiscal2004
Woodside Energy Ltd. . . $78,442 $30,757 $ 5,825
Burullus Gas Company . . 39,053 22,118 16,734
Sarawak Shell Bhd. . . . . . 32,841 24,446 —
Hoang Long & Hoan VuJoint OperatingCompanies . . . . . . . . . 32,114 16,557 —
ExxonMobil Explorationand ProductionMalaysia, Inc. . . . . . . . 8,733 25,331 33,256
41
Atwood Oceanics, Inc. and Subsidiaries
NOTES TO CONSOLIDATED FINANCIAL STATEMENTS — (Cont.)
%%TRANSMSG*** Transmitting Job: H41700 PCN: 036000000 ***%%PCMSG|41 |00006|Yes|No|12/18/2006 18:47|0|0|Page is valid, no graphics -- Color: D|

NOTE 11 — COMMITMENTS ANDCONTINGENCIES
OPERATING LEASES
Future minimum lease payments for operat-ing leases for fiscal years ending September 30are as follows (in thousands):
2007 . . . . . . . . . . . . . . . . . . . 1,9162008 . . . . . . . . . . . . . . . . . . . 1,1022009 . . . . . . . . . . . . . . . . . . . 9782010 . . . . . . . . . . . . . . . . . . . 8452011 and thereafter . . . . . . . 3,570
Total rent expense under operating leaseswas approximately $3.5 million, $1.8 million and$0.6 million for fiscal years ended September 30,2006, 2005, and 2004 respectively.
LITIGATION
We are party to a number of lawsuits whichare ordinary, routine litigation incidental to ourbusiness, the outcome of which, individually, orin the aggregate, is not expected to have a mate-rial adverse effect on our financial position,results of operations or cash flows.
NOTE 12 — RECENTLY ISSUED ACCOUNT-ING PRONOUNCEMENTS
In June 2006, the FASB issued FIN 48,“Accounting for Uncertainty in Income Taxes —an Interpretation of FASB Statement 109.” FIN 48prescribes a comprehensive model for recogniz-ing, measuring, presenting, and disclosing uncer-tain tax positions within the financial statements.The provisions of FIN 48 are effective for fiscalyears beginning after December 15, 2006. We arecurrently evaluating the impact of the adoption ofFIN 48 on our consolidated financial position.
In September 2006, the FASB issuedSFAS No. 157, “Fair Value Measurements”, orSFAS No. 157, which defines fair value, estab-lishes methods used to measure fair value andexpands disclosure requirements about fair value
measurements. SFAS No. 157 is effective forfinancial statements issued for fiscal year begin-ning after November 15, 2007, and interim peri-ods within those fiscal periods. We are currentlyanalyzing the provisions of SFAS No. 157 anddetermining how it will affect accounting policiesand procedures, but we have not yet made adetermination of the impact the adoption willhave on our consolidated financial position,results of operations and cash flows.
In September 2006, the SEC issued StaffAccounting Bulletin No. 108, “Considering theEffects of Prior Year Misstatements when Quanti-fying Misstatements in Current Year FinancialStatements”, or SAB 108, which provides guid-ance on the consideration of the effects of prioryear misstatements in quantifying current yearmisstatements for the purpose of a materialityassessment. SAB 108 requires that the material-ity of the effect of a misstated amount be evalu-ated on each financial statement and the relatedfinancial statement disclosures, and that materi-ality evaluation be based on quantitative andqualitative factors. SAB 108 is effective for fiscalyears beginning after November 15, 2006. We donot believe this guidance will have a materialimpact on our financial position, results of opera-tions or cash flows.
NOTE 13 — OPERATIONS BY GEOGRAPHICAREAS
We are engaged in offshore contract drilling.Our contract drilling operations consist of con-tracting owned or managed offshore drillingequipment primarily to major oil and gas explora-tion companies. Operating income is contractrevenues less operating costs, general andadministrative expenses and depreciation. Incomputing operating income (expense) for eachgeographic area, other income (expense) anddomestic and foreign income taxes were not con-sidered. Total assets are those assets that we usein operations in each geographic area.
42
Atwood Oceanics, Inc. and Subsidiaries
NOTES TO CONSOLIDATED FINANCIAL STATEMENTS — (Cont.)
%%TRANSMSG*** Transmitting Job: H41700 PCN: 037000000 ***%%PCMSG|42 |00007|Yes|No|12/18/2006 18:47|0|0|Page is valid, no graphics -- Color: D|

A summary of revenues and operating margin for the fiscal years ended September 30, 2006, 2005and 2004 and identifiable assets by geographic areas as of September 30, 2006, 2005 and 2004 is asfollows (in thousands):
Fiscal2006
Fiscal2005
Fiscal2004
REVENUES:United States . . . . . . . . . . . . . . . . . . . . . . . . . . . . . . . . . . . . . . . . . . . . . . . . . . . . . $ 20,249 $ 11,869 $ 9,565Southeast Asia . . . . . . . . . . . . . . . . . . . . . . . . . . . . . . . . . . . . . . . . . . . . . . . . . . . 99,884 100,631 97,654Mediterranean Sea . . . . . . . . . . . . . . . . . . . . . . . . . . . . . . . . . . . . . . . . . . . . . . . . . 68,970 23,829 28,627Africa . . . . . . . . . . . . . . . . . . . . . . . . . . . . . . . . . . . . . . . . . . . . . . . . . . . . . . . . . . 27,676 — —Australia . . . . . . . . . . . . . . . . . . . . . . . . . . . . . . . . . . . . . . . . . . . . . . . . . . . . . . . . 59,846 39,827 27,608
$276,625 $176,156 $163,454
OPERATING INCOME (EXPENSE):United States . . . . . . . . . . . . . . . . . . . . . . . . . . . . . . . . . . . . . . . . . . . . . . . . . . . . . $ 6,778 $ (622) $ (2,197)Southeast Asia . . . . . . . . . . . . . . . . . . . . . . . . . . . . . . . . . . . . . . . . . . . . . . . . . . . 68,875 45,432 30,070Mediterranean Sea . . . . . . . . . . . . . . . . . . . . . . . . . . . . . . . . . . . . . . . . . . . . . . . . . 25,592 2,142 385Africa . . . . . . . . . . . . . . . . . . . . . . . . . . . . . . . . . . . . . . . . . . . . . . . . . . . . . . . . . . 4,768 — —Australia . . . . . . . . . . . . . . . . . . . . . . . . . . . . . . . . . . . . . . . . . . . . . . . . . . . . . . . . 10,393 (380) 4,678Corporate general and administrative expenses. . . . . . . . . . . . . . . . . . . . . . . . . . . . (20,630) (14,245) (11,389)
$ 95,776 $ 32,327 $ 21,547
TOTAL ASSETS:United States . . . . . . . . . . . . . . . . . . . . . . . . . . . . . . . . . . . . . . . . . . . . . . . . . . . . . $ 69,651 $ 32,583 $ 30,370Southeast Asia . . . . . . . . . . . . . . . . . . . . . . . . . . . . . . . . . . . . . . . . . . . . . . . . . . . 241,655 302,354 258,648Mediterranean Sea . . . . . . . . . . . . . . . . . . . . . . . . . . . . . . . . . . . . . . . . . . . . . . . . . 42,447 36,980 95,253Africa . . . . . . . . . . . . . . . . . . . . . . . . . . . . . . . . . . . . . . . . . . . . . . . . . . . . . . . . . . 117,760 980 —Australia . . . . . . . . . . . . . . . . . . . . . . . . . . . . . . . . . . . . . . . . . . . . . . . . . . . . . . . . 117,637 115,523 113,331General corporate and other . . . . . . . . . . . . . . . . . . . . . . . . . . . . . . . . . . . . . . . . . . 4,679 7,274 1,334
$593,829 $495,694 $498,936
43
Atwood Oceanics, Inc. and Subsidiaries
NOTES TO CONSOLIDATED FINANCIAL STATEMENTS — (Cont.)
%%TRANSMSG*** Transmitting Job: H41700 PCN: 038000000 ***%%PCMSG|43 |00009|Yes|No|12/18/2006 18:47|0|0|Page is valid, no graphics -- Color: D|

NOTE 14 — QUARTERLY FINANCIAL DATA (UNAUDITED)
Summarized quarterly results for fiscal years 2006 and 2005 are as follows (in thousands, except pershare amounts):
December 31, March 31, June 30, September 30,QUARTERS ENDED(1)(2)
Fiscal 2006
Revenues . . . . . . . . . . . . . . . . . . . . . . . . . . . . . . . . . . . . . . . . . $55,414 $67,529 $71,865 $81,817Income before income taxes . . . . . . . . . . . . . . . . . . . . . . . . . . . 17,027 18,318 28,606 27,885Net income . . . . . . . . . . . . . . . . . . . . . . . . . . . . . . . . . . . . . . . 14,523 15,629 32,791 23,179Earnings per common share —
Basic . . . . . . . . . . . . . . . . . . . . . . . . . . . . . . . . . . . . . . . . . . 0.47 0.51 1.06 0.75Diluted . . . . . . . . . . . . . . . . . . . . . . . . . . . . . . . . . . . . . . . . . 0.47 0.50 1.04 0.74
Fiscal 2005
Revenues . . . . . . . . . . . . . . . . . . . . . . . . . . . . . . . . . . . . . . . . . $45,426 $41,017 $43,589 $46,124Income before income taxes . . . . . . . . . . . . . . . . . . . . . . . . . . . 8,143 6,100 5,933 5,432Net income . . . . . . . . . . . . . . . . . . . . . . . . . . . . . . . . . . . . . . . 8,650 4,711 5,989 6,661Earnings per common share —
Basic . . . . . . . . . . . . . . . . . . . . . . . . . . . . . . . . . . . . . . . . . . 0.29 0.15 0.20 0.22Diluted . . . . . . . . . . . . . . . . . . . . . . . . . . . . . . . . . . . . . . . . . 0.28 0.15 0.19 0.21
(1) The sum of the individual quarterly net income per common share amounts may not agree withyear-to-date net income per common share as each quarterly computation is based on the weightedaverage number of common shares outstanding during that period.
(2) Quarter ended December 31, 2005 and all fiscal year 2005 quarters have been restated to reflect atwo-for-one stock split effected on March 2, 2006. See Note 7 for further discussion.
44
Atwood Oceanics, Inc. and Subsidiaries
NOTES TO CONSOLIDATED FINANCIAL STATEMENTS — (Cont.)
%%TRANSMSG*** Transmitting Job: H41700 PCN: 039000000 ***%%PCMSG|44 |00008|Yes|No|12/18/2006 18:47|0|0|Page is valid, no graphics -- Color: D|
DIRECTORS AND OFFICERS
DIRECTORSDEBORAH A. BECK (2,3,4)
Corporate Executive, RetiredMilwaukee, Wisconsin
ROBERT W. BURGESS (2,3,4)Financial Executive, RetiredOrleans, Massachusetts
GEORGE S. DOTSON (1,2,3,4)Corporate Executive, RetiredTulsa, Oklahoma
HANS HELMERICH (1,4)President, Chief Executive OfficerHelmerich & Payne, Inc.Tulsa, Oklahoma
JOHN R. IRWIN (1)President, Chief Executive OfficerAtwood Oceanics, Inc.Houston, Texas
JAMES R. MONTAGUE (3,4)Corporate Executive, RetiredHouston, Texas
WILLIAM J. MORRISSEY (2,4)Bank Executive, RetiredElkhorn, Wisconsin
(1) Executive Committee(2) Audit Committee(3) Compensation Committee(4) Nominating & Corporate Governance Committee
OFFICERSJOHN R. IRWIN
President, Chief Executive Officer
JAMES M. HOLLANDSenior Vice President, Chief Financial Officer andSecretary
GLEN P. KELLEYSenior Vice President — Marketing and Administration
ANNUAL MEETING
The annual meeting of stockholders will be held at10:00 A.M., Central Standard Time, on Thursday, Febru-ary 8, 2007 at our principal office: 15835 Park Ten PlaceDrive, Houston, Texas, 77084. A formal notice of themeeting together with a proxy statement and form ofproxy will be mailed to stockholders on or about January 9,2007.
TRANSFER AGENT AND REGISTRARContinental Stock Transfer & Trust Company2 BroadwayNew York, New York 10004
FORM 10-K
A copy of our Form 10-K to which this Annual Reportis an exhibit is filed with the Securities and ExchangeCommission and is available free on request by writingto:
Secretary, Atwood Oceanics, Inc.P. O. Box 218350Houston, Texas 77218
We file our annual report on Form 10-K, quarterly andcurrent reports, proxy statements, and other informationwith the SEC. Our annual report on Form 10-K for theyear ended September 30, 2006 includes as exhibits allrequired Sarbanes-Oxley Act Section 302 certifications byour CEO and CFO regarding the quality of our publicdisclosure. Our SEC filings are available to the public overthe internet at the SEC’s web site at http://www.sec.gov.Our website address is www.atwd.com. We make avail-able free of charge on or through our website our annualreport on Form 10-K, quarterly reports on Form 10-Q, andcurrent reports on Form 8-K, and amendments to thosereports filed or furnished pursuant to Section 13(a) or15(d) of the Exchange Act as soon as reasonably practica-ble after we electronically file such material with, orfurnish it to, the SEC. Information on our website is notincorporated by reference into this report or made a parthereof for any purpose. You may also read and copy anydocument we file, including our Form 10-K, at the SEC’sPublic Reference Room at 450 Fifth Street, NW, Washing-ton, DC 20549. Please call the SEC at 1-800-SEC-0330 forfurther information on the public reference rooms andcopy charges.
Each year, our CEO must certify to the NYSE that heis not aware of any violations of NYSE corporate gover-nance listing standards by us. Our CEO’s certification forfiscal year 2005 was submitted to the NYSE.
STOCK PRICE INFORMATION —
The common stock of Atwood Oceanics, Inc. istraded on the New York Stock Exchange (“NYSE”) underthe symbol “ATW”. No cash dividends on common stockwere paid in fiscal year 2005 or 2006, and none areanticipated in the foreseeable future. We have approxi-mately 3,300 beneficial owners of our common stockbased upon information provided to us by a third partyshareholder services provider dated November 27, 2006.As of December 11, 2006, the closing sale price of thecommon stock of Atwood Oceanics, Inc., as reported byNYSE, was $50.76 per share. The following table setsforth the range of high and low sales prices per share ofcommon stock as reported by the NYSE for the periodsindicated.
Quarters Ended Low High Low HighFiscal 2006 Fiscal 2005
December 31 . . . . . . $32.55 $42.75 $22.99 $26.99March 31 . . . . . . . . 39.90 51.66 23.53 35.63June 30 . . . . . . . . . . 42.29 58.44 25.07 34.95September 30 . . . . . 39.86 50.64 29.40 43.06
45
%%TRANSMSG*** Transmitting Job: H41700 PCN: 040000000 ***%%PCMSG|45 |00007|Yes|No|12/19/2006 21:50|0|0|Page is valid, no graphics -- Color: D|

Atwood Oceanics, Inc.15835 Park Ten Place DriveP.O. Box 218350Houston, Texas 77218
ANNUAL REPORT FOR 2006