ATWOOD OCEANICS, INC. - AnnualReports.com · Atwood Oceanics, Inc. and Subsidiaries. FIVE YEAR...
56
ATWOOD OCEANICS, INC. 2009 ANNUAL REPORT
Transcript of ATWOOD OCEANICS, INC. - AnnualReports.com · Atwood Oceanics, Inc. and Subsidiaries. FIVE YEAR...
ATWOOD OCEANICS, INC.
2009 ANNUAL REPORT

2009 ANNUAL REPORT TO SHAREHOLDERSTHE COMPANY
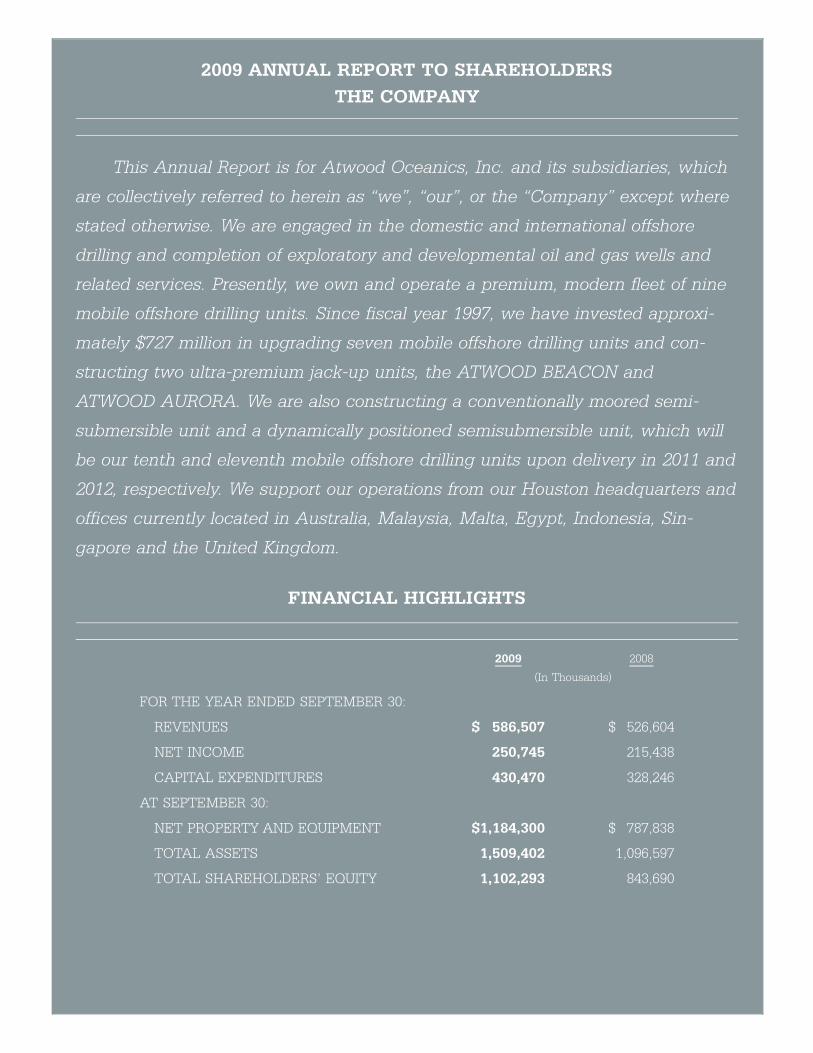
This Annual Report is for Atwood Oceanics, Inc. and its subsidiaries, which
are collectively referred to herein as “we”, “our”, or the “Company” except where
stated otherwise. We are engaged in the domestic and international offshore
drilling and completion of exploratory and developmental oil and gas wells and
related services. Presently, we own and operate a premium, modern fleet of nine
mobile offshore drilling units. Since fiscal year 1997, we have invested approxi-
mately $727 million in upgrading seven mobile offshore drilling units and con-
structing two ultra-premium jack-up units, the ATWOOD BEACON and
ATWOOD AURORA. We are also constructing a conventionally moored semi-
submersible unit and a dynamically positioned semisubmersible unit, which will
be our tenth and eleventh mobile offshore drilling units upon delivery in 2011 and
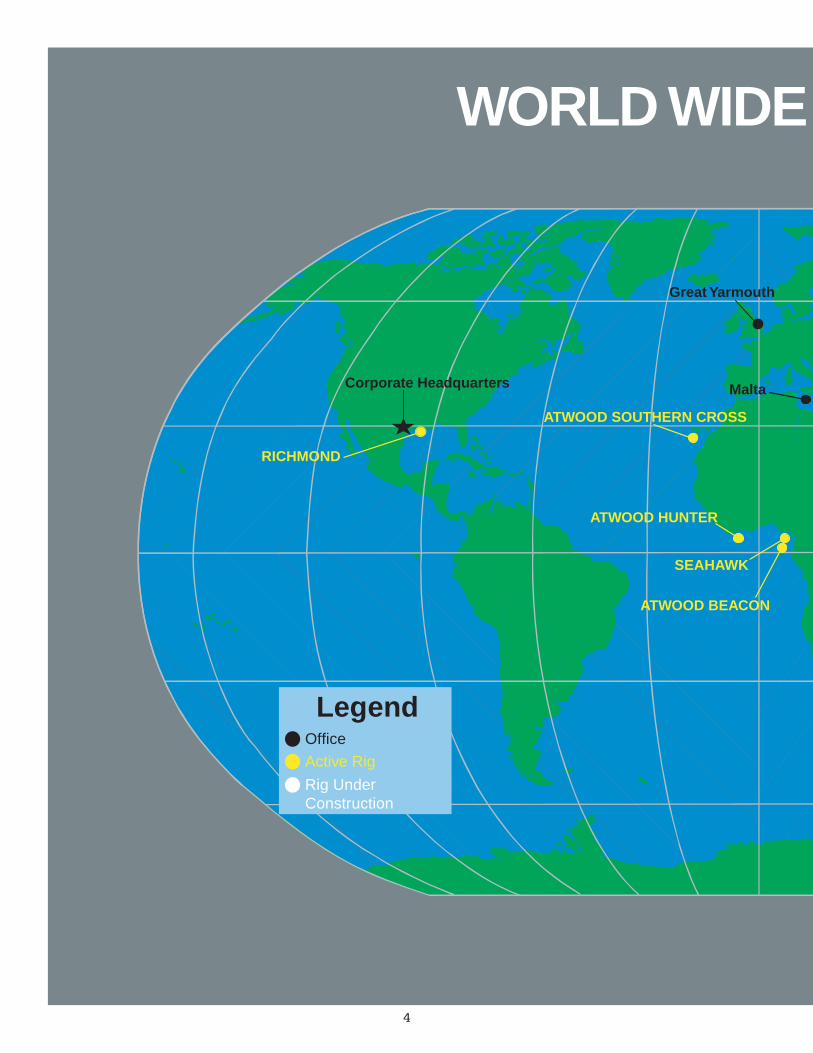
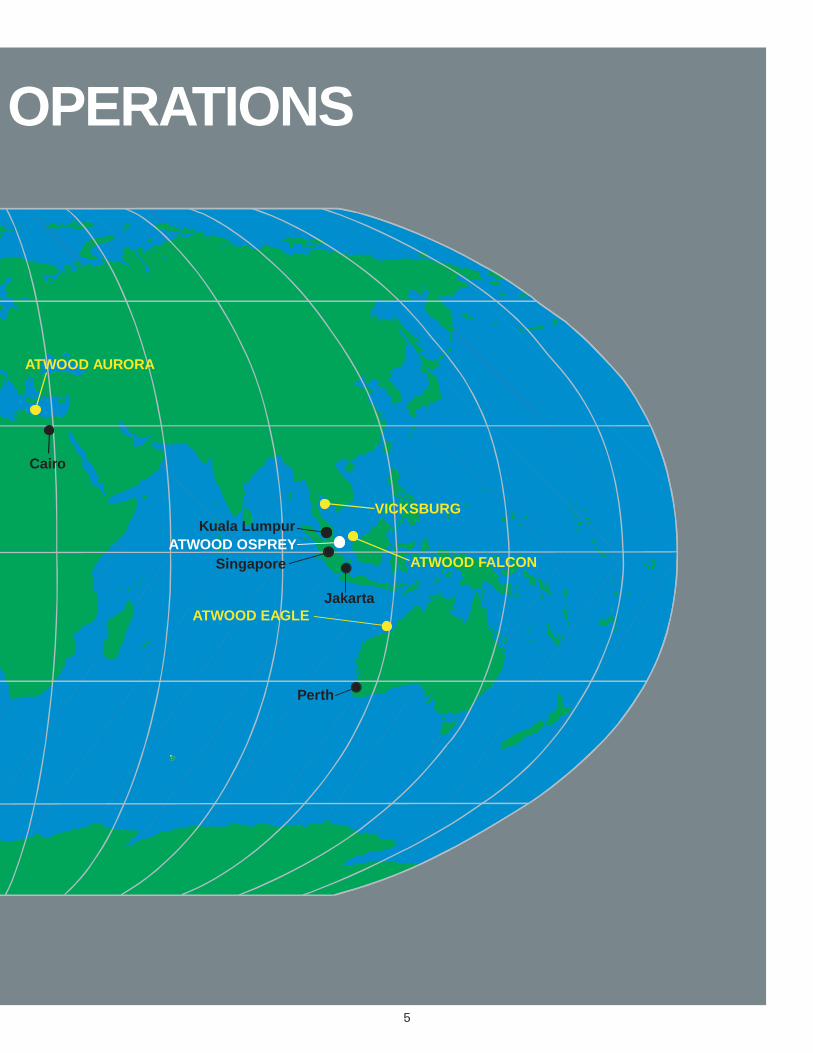
2012, respectively. We support our operations from our Houston headquarters and
offices currently located in Australia, Malaysia, Malta, Egypt, Indonesia, Sin-
gapore and the United Kingdom.
FINANCIAL HIGHLIGHTS
2009 2008
(In Thousands)
FOR THE YEAR ENDED SEPTEMBER 30:
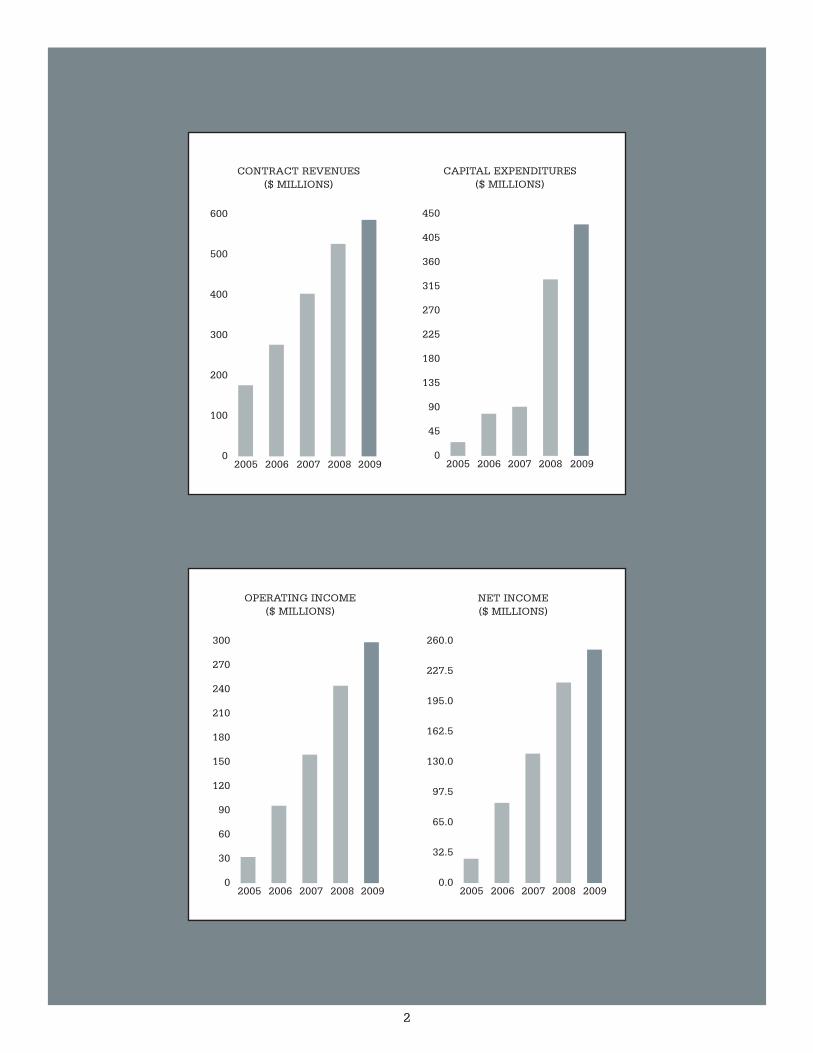
REVENUES $ 586,507 $ 526,604
NET INCOME 250,745 215,438
CAPITAL EXPENDITURES 430,470 328,246
AT SEPTEMBER 30:
NET PROPERTY AND EQUIPMENT $1,184,300 $ 787,838
TOTAL ASSETS 1,509,402 1,096,597
TOTAL SHAREHOLDERS’ EQUITY 1,102,293 843,690
%%TRANSMSG*** Transmitting Job: H68826 PCN: 001000000 ***%%PCMSG| |00010|Yes|No|12/02/2009 05:20|0|0|Page is valid, no graphics -- Color: D|
2
0
100
200
300
400
500
600
2006 2007 20082005 2009
0
30
60
90
120
150
180
210
240
270
300
2006 20072005 200920080.0
32.5
65.0
97.5
130.0
162.5
195.0
227.5
260.0
2006 20072005 20092008
0
45
90
135
180
225
270
315
360
405
450
2006 20072005 20092008
CONTRACT REVENUES($ MILLIONS)
NET INCOME ($ MILLIONS)
CAPITAL EXPENDITURES($ MILLIONS)
OPERATING INCOME($ MILLIONS)
TO OUR SHAREHOLDERS AND EMPLOYEES:
Even though fiscal year 2009 was very challenging from a drilling industry viewpoint, we recorded our fourthconsecutive year of record financial results with revenues, operating cash flows and net income again being thehighest in our history. Our net income of $251 million, or $3.89 per diluted share, for fiscal year 2009, reflected a17% improvement on our previous year’s record net income of $215 million, or $3.34 per diluted share. Othersignificant accomplishments during the fiscal year included the completion of construction and commencement ofoperations of our new ultra premium jack-up, the ATWOOD AURORA, on a two year contract in Egypt; progress, asplanned, on the construction in Singapore of our two new deepwater semisubmersibles, a 6,000 foot water depthunit, the ATWOOD OSPREY, and a to-be-named 10,000 foot water depth dynamically positioned unit; strengtheningof our balance sheet by execution of a $280 million credit facility (giving us a combined borrowing capacity of$580 million) during a very difficult period in the financial and banking markets; and securing contractcommitments for three of our four idle units in an extremely challenging market environment.
During fiscal year 2009, there was a strong focus throughout the Company on execution on all of our activities.With contracts for four of our drilling units expiring during fiscal year 2009, it was our goal to define and execute aclear strategy for these four units in terms of planning and completing critical maintenance, subsequently reducingdirect operating costs to target levels, maintaining key personnel, aggressively bidding any suitable contractopportunities and having all of these units ready to return to work at short notice. Three of these four units, theVICKSBURG, RICHMOND and ATWOOD BEACON, were contracted and have returned to work. The fourth unit,the ATWOOD SOUTHERN CROSS, is still idle. For most of 2009, there has been almost no bidding activity relatingto opportunities suitable for the ATWOOD SOUTHERN CROSS. While we continue to anticipate drilling marketchallenges in fiscal year 2010, we are currently experiencing some increases in discussions and bidding activities,including possible shorter term opportunities for the ATWOOD SOUTHERN CROSS, and remain confident in thelong-term outlook for the worldwide offshore drilling industry, especially for deepwater drilling.
Of our nine (9) owned operational drilling units, and two (2) drilling units currently under construction, five(5) have current contract commitments that extend into fiscal year 2011 or later; one (1) has a contract commitmentthrough fiscal year 2010; three (3) have current contract commitments that expire during fiscal year 2010, one (1) iscurrently idle; and one (1) under construction, scheduled for delivery in mid-2012, is currently without a contract.At September 30, 2009, we had estimated contract revenue backlog of approximately $1.8 billion compared toapproximately $1.0 billion of estimated capital commitments relating primarily to the new semisubmersibles underconstruction. Currently, we have approximately 70% of our available rig days contracted for fiscal year 2010.
While fiscal year 2009 was rewarding in terms of recording our sixth consecutive year of improving financialresults, we are focused on execution and planning for what we believe will be continuing enhancement inshareholder value. From a longer term perspective, we remain committed to our strategy of consistently meetingour clients’ needs with safe, quality operations, premium equipment and being leveraged to deepwater andinternational markets. This strategy has been successful in enabling us to create value in the past and stands us ingood stead for the future. The Company is strong and well positioned in terms of its financial position, talentedpersonnel, rig fleet and track record. We continue to actively progress efforts to develop our organization, systems,expertise, talent and capability for future growth. While it is our goal to consider further value enhancingopportunities in the future at the appropriate time, we have no immediate plans for further growth beyond ourcurrent two deepwater semisubmersible construction program.
Our performance during fiscal year 2009 and current strong position owe much to the talent, dedication andvaluable contributions of our employees and management team both in the U.S. and internationally. To them, weconvey our personal thanks and appreciation as we do to our shareholders for their continuing trust and support.To our clients, reflecting both long-standing and newer relationships, we express our appreciation for theopportunity and privilege to be of service and add value to their activities and also acknowledge the communitiesaround the world in which we have the privilege and good fortune to operate. We remain focused on the future andare dedicated to building longer term shareholder value from our current strong position.
JOHN R. IRWIN
3
%%TRANSMSG*** Transmitting Job: H68826 PCN: 002000000 ***%%PCMSG|3 |00011|Yes|No|12/02/2009 05:20|0|0|Page/graphics valid 12/02/2009 05:20 -- Color: D|
4
SEAHAWK
ATWOOD SOUTHERN CROSS
ATWOOD BEACON
Corporate Headquarters
Office
Active Rig
Rig UnderConstruction
Legend
Malta
Great Yarmouth
ATWOOD HUNTER
RICHMOND
WORLD WIDE
5
ATWOOD EAGLE
VICKSBURG
ATWOOD FALCON
Jakarta
Kuala Lumpur
Singapore
Perth
Cairo
ATWOOD AURORA
ATWOOD OSPREY
OPERATIONS
6
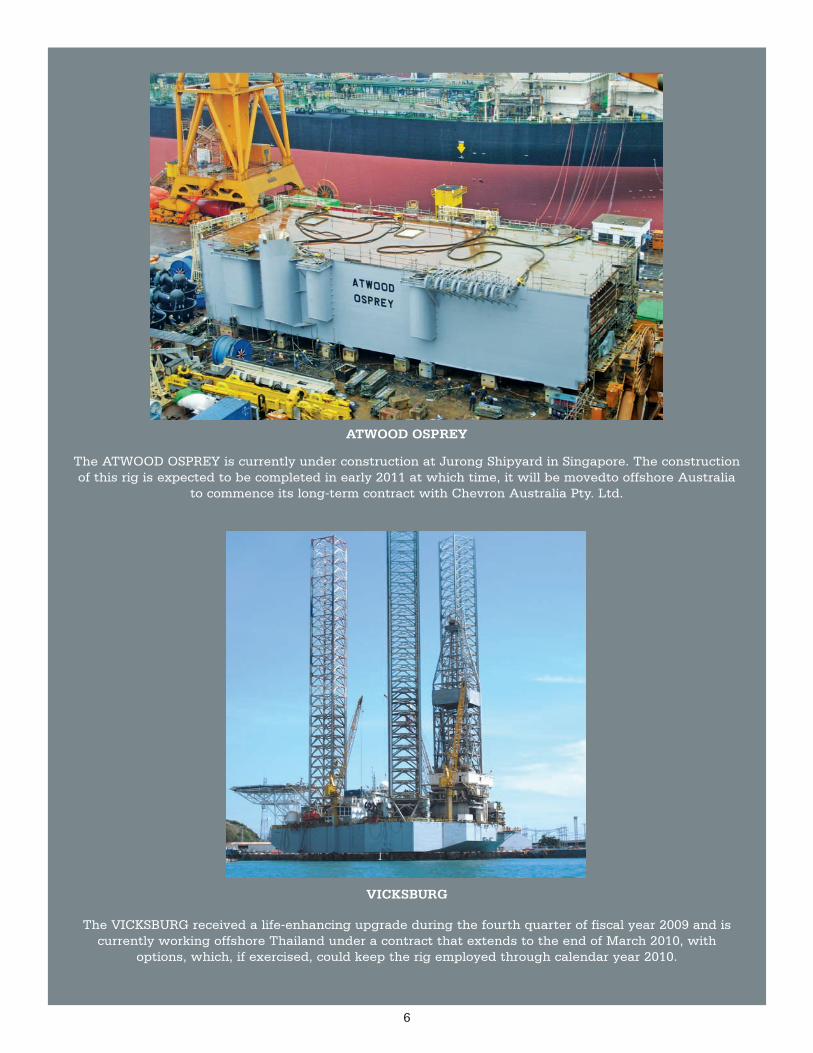
ATWOOD OSPREY
The ATWOOD OSPREY is currently under construction at Jurong Shipyard in Singapore. The constructionof this rig is expected to be completed in early 2011 at which time, it will be movedto offshore Australia
to commence its long-term contract with Chevron Australia Pty. Ltd.
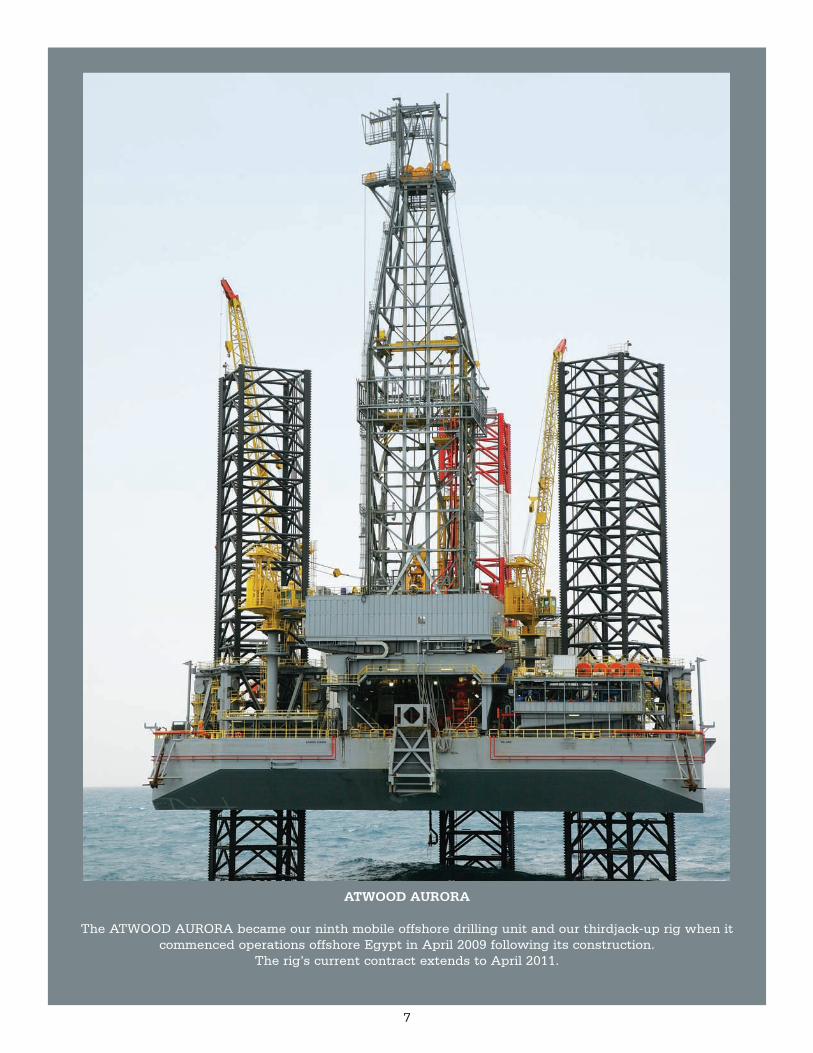
VICKSBURG
The VICKSBURG received a life-enhancing upgrade during the fourth quarter of fiscal year 2009 and iscurrently working offshore Thailand under a contract that extends to the end of March 2010, with
options, which, if exercised, could keep the rig employed through calendar year 2010.
7
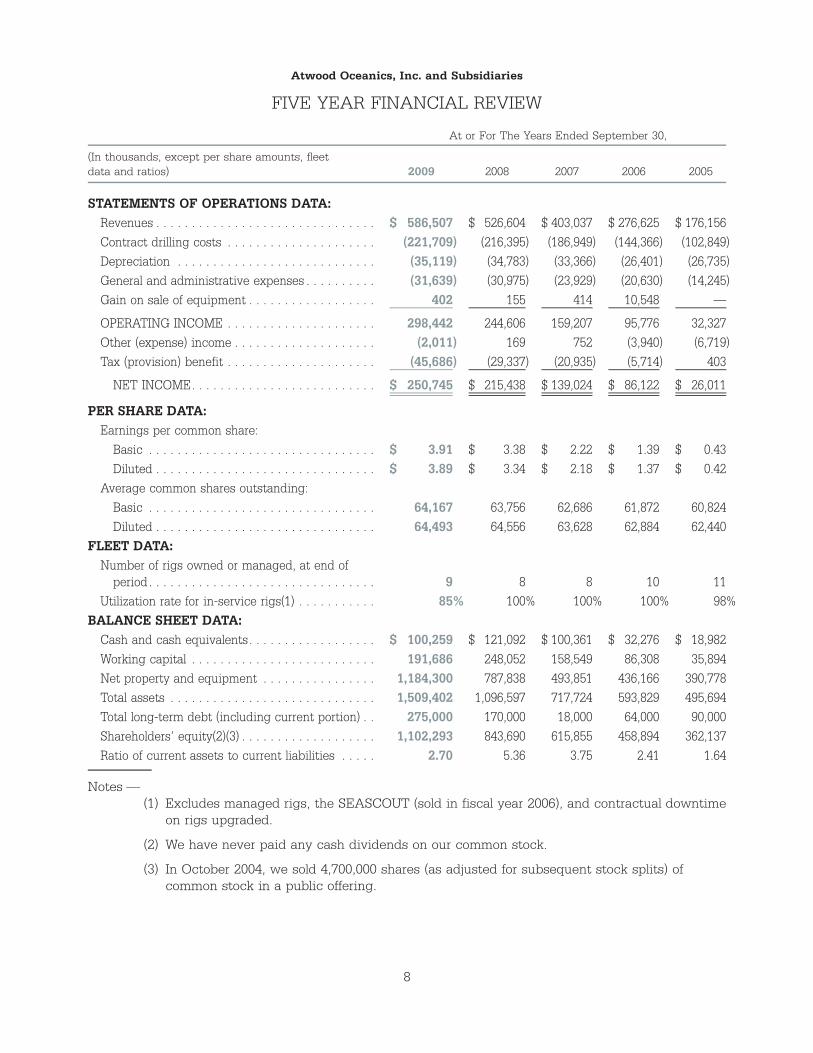
ATWOOD AURORA
The ATWOOD AURORA became our ninth mobile offshore drilling unit and our thirdjack-up rig when itcommenced operations offshore Egypt in April 2009 following its construction.
The rig’s current contract extends to April 2011.
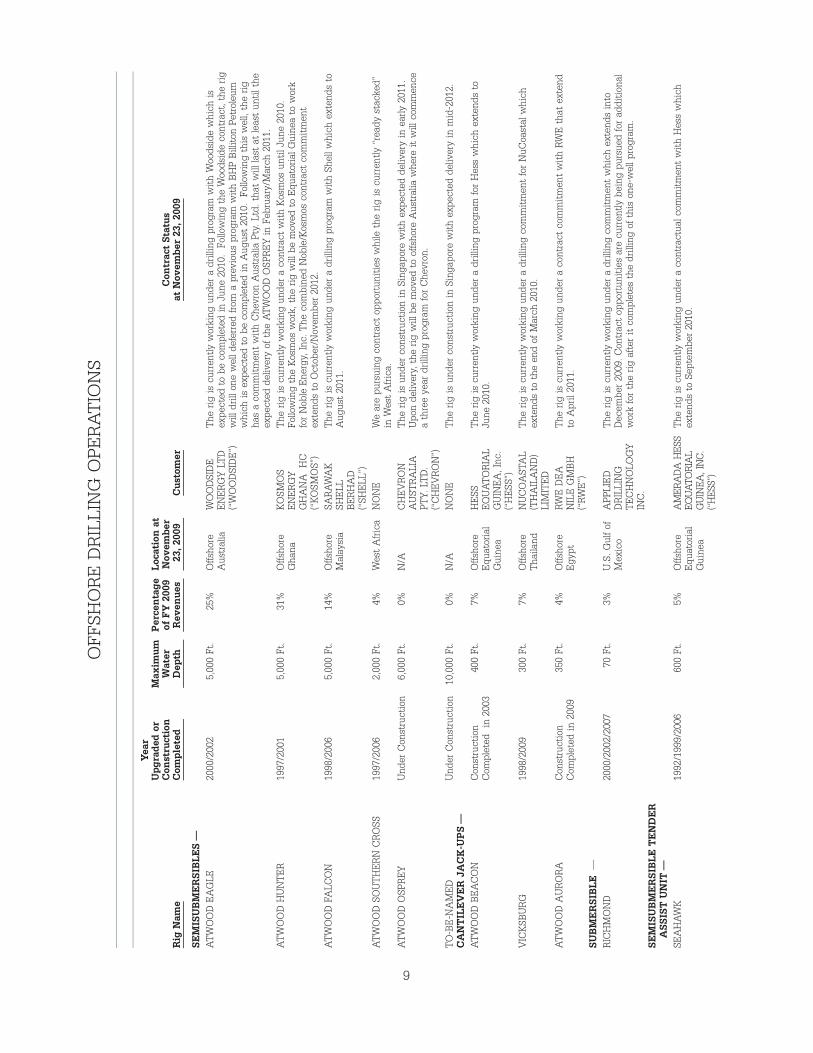
Atwood Oceanics, Inc. and Subsidiaries
FIVE YEAR FINANCIAL REVIEW
(In thousands, except per share amounts, fleetdata and ratios) 2009 2008 2007 2006 2005
At or For The Years Ended September 30,
STATEMENTS OF OPERATIONS DATA:Revenues . . . . . . . . . . . . . . . . . . . . . . . . . . . . . . . $ 586,507 $ 526,604 $ 403,037 $ 276,625 $ 176,156Contract drilling costs . . . . . . . . . . . . . . . . . . . . . (221,709) (216,395) (186,949) (144,366) (102,849)Depreciation . . . . . . . . . . . . . . . . . . . . . . . . . . . . (35,119) (34,783) (33,366) (26,401) (26,735)General and administrative expenses . . . . . . . . . . (31,639) (30,975) (23,929) (20,630) (14,245)Gain on sale of equipment . . . . . . . . . . . . . . . . . . 402 155 414 10,548 —
OPERATING INCOME . . . . . . . . . . . . . . . . . . . . . 298,442 244,606 159,207 95,776 32,327Other (expense) income . . . . . . . . . . . . . . . . . . . . (2,011) 169 752 (3,940) (6,719)Tax (provision) benefit . . . . . . . . . . . . . . . . . . . . . (45,686) (29,337) (20,935) (5,714) 403
NET INCOME. . . . . . . . . . . . . . . . . . . . . . . . . . $ 250,745 $ 215,438 $ 139,024 $ 86,122 $ 26,011
PER SHARE DATA:Earnings per common share:
Basic . . . . . . . . . . . . . . . . . . . . . . . . . . . . . . . . $ 3.91 $ 3.38 $ 2.22 $ 1.39 $ 0.43Diluted . . . . . . . . . . . . . . . . . . . . . . . . . . . . . . . $ 3.89 $ 3.34 $ 2.18 $ 1.37 $ 0.42
Average common shares outstanding:Basic . . . . . . . . . . . . . . . . . . . . . . . . . . . . . . . . 64,167 63,756 62,686 61,872 60,824Diluted . . . . . . . . . . . . . . . . . . . . . . . . . . . . . . . 64,493 64,556 63,628 62,884 62,440
FLEET DATA:Number of rigs owned or managed, at end of
period . . . . . . . . . . . . . . . . . . . . . . . . . . . . . . . . 9 8 8 10 11Utilization rate for in-service rigs(1) . . . . . . . . . . . 85% 100% 100% 100% 98%
BALANCE SHEET DATA:Cash and cash equivalents. . . . . . . . . . . . . . . . . . $ 100,259 $ 121,092 $ 100,361 $ 32,276 $ 18,982Working capital . . . . . . . . . . . . . . . . . . . . . . . . . . 191,686 248,052 158,549 86,308 35,894Net property and equipment . . . . . . . . . . . . . . . . 1,184,300 787,838 493,851 436,166 390,778Total assets . . . . . . . . . . . . . . . . . . . . . . . . . . . . . 1,509,402 1,096,597 717,724 593,829 495,694Total long-term debt (including current portion) . . 275,000 170,000 18,000 64,000 90,000Shareholders’ equity(2)(3) . . . . . . . . . . . . . . . . . . . 1,102,293 843,690 615,855 458,894 362,137Ratio of current assets to current liabilities . . . . . 2.70 5.36 3.75 2.41 1.64
Notes —(1) Excludes managed rigs, the SEASCOUT (sold in fiscal year 2006), and contractual downtime
on rigs upgraded.
(2) We have never paid any cash dividends on our common stock.
(3) In October 2004, we sold 4,700,000 shares (as adjusted for subsequent stock splits) ofcommon stock in a public offering.
8
%%TRANSMSG*** Transmitting Job: H68826 PCN: 003000000 ***%%PCMSG|8 |00011|Yes|No|12/02/2009 05:20|0|0|Page is valid, no graphics -- Color: D|
OFF
SHO
RE
DR
ILLI
NG
OPE
RA
TIO
NS
Rig
Nam
e
Yea
rU
pgra
ded
orC
onst
ruct
ion
Com
plet
ed
Max
imum
Wat
erD
epth
Per
cen
tage
ofF
Y20
09R
even
ues
Loca
tion
atN
ovem
ber
23,2
009
Cus
tom
erC
ontr
act
Stat
usat
Nov
embe
r23
,200
9
SEM
ISU
BM
ER
SIB
LES
—A
TW
OO
DE
AG
LE20
00/2
002
5,00
0Ft
.25
%O
ffsho
reA
ustr
alia
WO
OD
SID
EE
NE
RG
YLT
D(“
WO
OD
SID
E”)
The
rig
iscu
rren
tlyw
orki
ngun
der
adr
illin
gpr
ogra
mw
ith
Woo
dsid
ew
hich
isex
pect
edto
beco
mpl
eted
inJu
ne20
10.
Follo
win
gth
eW
oods
ide
cont
ract
,the
rig
will
drill
one
wel
ldef
erre
dfr
oma
prev
ious
prog
ram
wit
hB
HP
Bill
iton
Petr
oleu
mw
hich
isex
pect
edto
beco
mpl
eted
inA
ugus
t20
10.
Follo
win
gth
isw
ell,
the
rig
has
aco
mm
itm
ent
wit
hC
hevr
onA
ustr
alia
Pty.
Ltd.
that
will
last
atle
ast
unti
lthe
expe
cted
deliv
ery
ofth
eA
TW
OO
DO
SPR
EY
inFe
brua
ry/M
arch
2011
.A
TW
OO
DH
UN
TE
R19
97/2
001
5,00
0Ft
.31
%O
ffsho
reG
hana
KO
SMO
SE
NE
RG
YG
HA
NA
HC
(“K
OSM
OS”
)
The
rig
iscu
rren
tlyw
orki
ngun
der
aco
ntra
ctw
ith
Kos
mos
unti
lJun
e20
10.
Follo
win
gth
eK
osm
osw
ork,
the
rig
will
bem
oved
toE
quat
oria
lGui
nea
tow
ork
for
Nob
leE
nerg
y,In
c.T
heco
mbi
ned
Nob
le/K
osm
osco
ntra
ctco
mm
itm
ent
exte
nds
toO
ctob
er/N
ovem
ber
2012
.A
TW
OO
DFA
LCO
N19
98/2
006
5,00
0Ft
.14
%O
ffsho
reM
alay
sia
SAR
AW
AK
SHE
LLB
ER
HA
D(“
SHE
LL”)
The
rig
iscu
rren
tlyw
orki
ngun
der
adr
illin
gpr
ogra
mw
ith
Shel
lwhi
chex
tend
sto
Aug
ust
2011
.
AT
WO
OD
SOU
TH
ER
NC
RO
SS19
97/2
006
2,00
0Ft
.4%
Wes
tA
fric
aN
ON
EW
ear
epu
rsui
ngco
ntra
ctop
port
unit
ies
whi
leth
eri
gis
curr
ently
“rea
dyst
acke
d”in
Wes
tA
fric
a.A
TW
OO
DO
SPR
EY
Und
erC
onst
ruct
ion
6,00
0Ft
.0%
N/A
CH
EV
RO
NA
UST
RA
LIA
PTY.
LTD
.(“
CH
EV
RO
N”)
The
rig
isun
der
cons
truc
tion
inSi
ngap
ore
wit
hex
pect
edde
liver
yin
early
2011
.U
pon
deliv
ery,
the
rig
will
bem
oved
toof
fsho
reA
ustr
alia
whe
reit
will
com
men
cea
thre
eye
ardr
illin
gpr
ogra
mfo
rC
hevr
on.
TO
-BE
-NA
ME
DU
nder
Con
stru
ctio
n10
,000
Ft.
0%N
/AN
ON
ET
heri
gis
unde
rco
nstr
ucti
onin
Sing
apor
ew
ith
expe
cted
deliv
ery
inm
id-2
012.
CA
NT
ILE
VE
RJA
CK
-UP
S—
AT
WO
OD
BE
AC
ON
Con
stru
ctio
nC
ompl
eted
in20
0340
0Ft
.7%
Offs
hore
Equ
ator
ial
Gui
nea
HE
SSE
QU
AT
OR
IAL
GU
INE
A,I
nc.
(“H
ESS
”)
The
rig
iscu
rren
tlyw
orki
ngun
der
adr
illin
gpr
ogra
mfo
rH
ess
whi
chex
tend
sto
June
2010
.
VIC
KSB
UR
G19
98/2
009
300
Ft.
7%O
ffsho
reT
haila
ndN
UC
OA
STA
L(T
HA
ILA
ND
)LI
MIT
ED
The
rig
iscu
rren
tlyw
orki
ngun
der
adr
illin
gco
mm
itm
ent
for
NuC
oast
alw
hich
exte
nds
toth
een
dof
Mar
ch20
10.
AT
WO
OD
AU
RO
RA
Con
stru
ctio
nC
ompl
eted
in20
0935
0Ft
.4%
Offs
hore
Egy
ptRW
ED
EA
NIL
EG
MB
H(“
RWE
”)
The
rig
iscu
rren
tlyw
orki
ngun
der
aco
ntra
ctco
mm
itm
ent
wit
hRW
Eth
atex
tend
toA
pril
2011
.
SUB
ME
RSI
BLE
—R
ICH
MO
ND
2000
/200
2/20
0770
Ft.
3%U
.S.G
ulfo
fM
exic
oA
PPLI
ED
DR
ILLI
NG
TE
CH
NO
LOG
YIN
C.
The
rig
iscu
rren
tlyw
orki
ngun
der
adr
illin
gco
mm
itm
ent
whi
chex
tend
sin
toD
ecem
ber
2009
.Con
trac
top
port
unit
ies
are
curr
ently
bein
gpu
rsue
dfo
rad
diti
onal
wor
kfo
rth
eri
gaf
ter
itco
mpl
etes
the
drill
ing
ofth
ison
e-w
ellp
rogr
am.
SEM
ISU
BM
ER
SIB
LET
EN
DE
RA
SSIS
TU
NIT
—SE
AH
AW
K19
92/1
999/
2006
600
Ft.
5%O
ffsho
reE
quat
oria
lG
uine
a
AM
ERA
DA
HES
SEQ
UA
TORI
AL
GU
INEA
,IN
C.
(“H
ESS”
)
The
rig
iscu
rren
tlyw
orki
ngun
der
aco
ntra
ctua
lcom
mit
men
tw
ith
Hes
sw
hich
exte
nds
toSe
ptem
ber
2010
.
9
%%TRANSMSG*** Transmitting Job: H68826 PCN: 004000000 ***%%PCMSG|9 |00016|Yes|No|12/23/2009 12:01|0|0|Page is valid, no graphics -- Color: D|
SECURITIES LITIGATION SAFE HARBOR STATEMENT
Statements included in this report which arenot historical facts (including any statementsconcerning plans and objectives of managementfor future operations or economic performance, orassumptions related thereto) are “forward-lookingstatements” within the meaning of the PrivateSecurities Litigation Reform Act of 1995. In addi-tion, we and our representatives may from totime to time make other oral or written state-ments which are also forward-lookingstatements.
These forward-looking statements are madebased upon management’s current plans, expec-tations, estimates, assumptions and beliefs con-cerning future events impacting us and thereforeinvolve a number of risks and uncertainties. Wecaution that forward-looking statements are notguarantees and that actual results could differmaterially from those expressed or implied in theforward-looking statements.
Important factors that could cause our actualresults of operations or our actual financial condi-tions to differ include, but are not necessarilylimited to:
• our dependence on the oil and gasindustry;
• the operational risks involved in drilling foroil and gas;
• risks associated with the current globaleconomic crisis and its impact on capitalmarkets, liquidity, and financing of futuredrilling activity;
• changes in rig utilization and dayrates inresponse to the level of activity in the oiland gas industry, which is significantlyaffected by indications and expectationsregarding the level and volatility of oil andgas prices, which in turn are affected bypolitical, economic and weather conditionsaffecting or potentially affecting regionalor worldwide demand for oil and gas,actions or anticipated actions by OPEC,inventory levels, deliverability constraints,and future market activity;
• the extent to which customers and poten-tial customers continue to pursue deepwa-ter drilling;
• exploration success or lack of explorationsuccess by our customers and potentialcustomers;
• the highly competitive and volatile natureof our business, with periods of lowdemand and excess rig availability;
• the impact of possible disruption in opera-tions due to terrorism, acts of piracy,embargoes, war or other militaryoperations;
• our ability to enter into and the terms offuture drilling contracts;
• the availability of qualified personnel;
• our failure to retain the business of one ormore significant customers;
• the termination or renegotiation of con-tracts by customers;
• the availability of adequate insurance at areasonable cost;
• the occurrence of an uninsured loss;
• the risks of international operations,including possible economic, political,social or monetary instability, and compli-ance with foreign laws;
• the effect public health concerns couldhave on our international operations andfinancial results;
• compliance with or breach of environmen-tal laws;
• the incurrence of secured debt or addi-tional unsecured indebtedness or otherobligations by us or our subsidiaries;
• the adequacy of sources of liquidity forour operations and those of our customers;
• currently unknown rig repair needs and/oradditional opportunities to accelerateplanned maintenance expenditures due topresently unanticipated rig downtime;
10
%%TRANSMSG*** Transmitting Job: H68826 PCN: 005000000 ***%%PCMSG|10 |00011|Yes|No|12/23/2009 12:01|0|0|Page is valid, no graphics -- Color: D|
• higher than anticipated accruals for perfor-mance-based compensation due to betterthan anticipated performance by us,higher than anticipated severanceexpenses due to unanticipated employeeterminations, higher than anticipated legaland accounting fees due to unanticipatedfinancing or other corporate transactions,and other factors that could increase gen-eral and administrative expenses;
• the actions of our competitors in the off-shore drilling industry, which could signif-icantly influence rig dayrates andutilization;
• changes in the geographic areas in whichour customers plan to operate or the taxrate in such jurisdiction, which in turn couldchange our expected effective tax rate;
• changes in oil and gas drilling technologyor in our competitors’ drilling rig fleetsthat could make our drilling rigs less com-petitive or require major capital invest-ments to keep them competitive;
• rig availability;
• the effects and uncertainties of legal andadministrative proceedings and othercontingencies;
• the impact of governmental laws and reg-ulations and the uncertainties involved intheir administration, particularly in someforeign jurisdictions;
• changes in accepted interpretations ofaccounting guidelines and other account-ing pronouncements and tax laws;
• risks involved in the construction of adynamically positioned semisubmersibledrilling unit without a contract;
• although our current long-term contractcommitments do not provide for early termi-nation due to market deterioration, the risk
that customers could seek to amend someof these contracts due to market declinewhich could alter the timing and amount ofour current contracted cash flows;
• the risks involved in the construction,upgrade, and repair of our drilling unitsincluding project delays affecting our abil-ity to meet contractual commitments, aswell as commencement of operations ofour drilling units following delivery; and
• such other factors as may be discussed inthis report and our other reports filed withthe Securities and Exchange Commission,or SEC.
These factors are not necessarily all of theimportant factors that could cause actual resultsto differ materially from those expressed in any ofour forward-looking statements. See also “RiskFactors” in Item 1A in our Form 10-K for the yearended September 30, 2009, to which this AnnualReport is an exhibit. Other unknown or unpre-dictable factors could also have material adverseeffects on future results. The words “believe,”“impact,” “intend,” “estimate,” “anticipate,”“plan” and similar expressions identify forward-looking statements. These forward-looking state-ments are found at various places throughout theManagement’s Discussion and Analysis in thisAnnual Report to Shareholders for fiscal year2009. When considering any forward-lookingstatement, you should also keep in mind the riskfactors described in other reports or filings wemake with the SEC from time to time. Unduereliance should not be placed on these forward-looking statements, which are applicable only onthe date hereof. Neither we nor our representa-tives have a general obligation to revise orupdate these forward-looking statements toreflect events or circumstances that arise afterthe date hereof or to reflect the occurrence ofunanticipated events.
11
%%TRANSMSG*** Transmitting Job: H68826 PCN: 006000000 ***%%PCMSG|11 |00008|Yes|No|12/23/2009 12:01|0|0|Page is valid, no graphics -- Color: D|
MANAGEMENT’S DISCUSSION AND ANALYSISOF FINANCIAL CONDITION AND RESULTS OF OPERATIONS
MARKET OUTLOOK
Despite fiscal year 2009 being a very chal-lenging year from a drilling market perspectivewhereby we uncharacteristically incurred someidle time on four of our drilling units, it was still ayear marked with several significant accomplish-ments which included the following:
• Completing the construction and commis-sioning, and start-up of our ultra-premiumjack-up, the ATWOOD AURORA;
• Completing the life enhancing upgrade ofour premium jack-up, the VICKSBURG;
• Achieving the most favorable operatingresults in our history; and
• Strengthening our liquidity position byexecuting a $280 million credit facility inNovember 2008 at a time when theworld’s financial and banking markets hadexperienced a significant downturn.
Even though we continue to anticipate drill-ing market challenges in fiscal year 2010, we arecurrently experiencing increases in bidding activ-ities and remain confident in the long-term out-look for the worldwide offshore drilling industry,especially for deepwater drilling. Despite recentimprovement in bidding activities, there contin-ues to be an excess of worldwide rig fleet avail-ability, especially for jack-up rigs andsemisubmersible drilling units technically similarto the ATWOOD SOUTHERN CROSS. Dayrates,especially for jack-ups, have declined from levelsthat existed prior to the commencement of theglobal financial crisis that continue to negativelyimpact the availability of capital and liquidityfrom banks and other providers of credit. Thecontinuing delivery of newly constructed jack-uprigs is also negatively impacting the worldwidesupply related to current market demand.
During fiscal year 2009, we incurred idledays on four of our nine drilling rigs; ATWOODSOUTHERN CROSS, ATWOOD BEACON,
VICKSBURG and RICHMOND. Currently, theATWOOD SOUTHERN CROSS is our only uncon-tracted rig, with the VICKSBURG, RICHMONDand ATWOOD BEACON having short-term con-tracts that expire in March 2010, December 2009and June 2010, respectively. We are continuingto pursue additional contract commitments forthese four rigs; however, there is no guaranteethat we will not incur idle time on some or all ofthese units during fiscal year 2010.
We continue to make progress on the con-struction of two semisubmersible drilling unitsfor deepwater drilling: (1) the ATWOOD OSPREY,a conventionally moored, 6,000 foot water depthunit (scheduled for delivery in early 2011, with anestimated total cost of approximately $625 mil-lion), and (2) a to-be-named dynamically posi-tioned, 10,000 foot water depth water unit(scheduled for delivery in mid-2012, with an esti-mated total cost of approximately $750 million).Through September 30, 2009, we have investedapproximately $605 million toward the construc-tion of these two drilling units. Funding of theapproximate $770 million remaining on the con-struction of these two units will come from inter-nally generated funds and borrowings under ourtwo credit facilities, which have a combined bor-rowing capacity of $580 million. We currentlyhave $275 million borrowed under our creditfacilities and will endeavor to keep our maximumborrowing below $500 million during the con-struction of these two units.
Of our nine (9) owned operational drillingunits, and the two (2) drillings units currentlyunder construction, five (5) have current contractcommitments that extend into fiscal year 2011 orlater; one (1) has a contract commitment throughfiscal year 2010; three (3) have current contractcommitments that expire during fiscal year 2010,one (1) is currently idle; and one (1) under con-struction, scheduled for delivery in mid-2012, iscurrently without a contract. At September 30,2009, we had estimated contract revenue backlog
12
%%TRANSMSG*** Transmitting Job: H68826 PCN: 007000000 ***%%PCMSG|12 |00013|Yes|No|12/23/2009 12:01|0|0|Page is valid, no graphics -- Color: D|
of approximately $1.8 billion compared to approx-imately $1.0 billion of estimated capital expendi-tures relating primarily to the newsemisubmersibles under construction.
Currently, we have approximately 70% of ouravailable rig days contracted for fiscal year 2010.A comparison of the average per day revenuesfor fiscal years 2009, 2008 and 2007 for each ofour current nine (9) active drilling units is asfollows:
FiscalYear 2007
FiscalYear 2008
FiscalYear 2009
Average Per Day Revenues
ATWOOD HUNTER . . . . . . . $234,000 $246,000 $500,000ATWOOD EAGLE . . . . . . . . . 160,000 241,000 398,000ATWOOD FALCON. . . . . . . . 138,000 216,000 223,000VICKSBURG . . . . . . . . . . . . 110,000 155,000 118,000(1)ATWOOD BEACON . . . . . . . 109,000 128,000 105,000SEAHAWK . . . . . . . . . . . . . 84,000 88,000 85,000ATWOOD SOUTHERN
CROSS. . . . . . . . . . . . . . . 171,000 321,000 70,000(2)ATWOOD AURORA . . . . . . . — — 56,000(3)RICHMOND . . . . . . . . . . . . . 81,000 44,000(4) 52,000
(1) Rig incurred a life-enhancing upgrade duringfiscal year 2009.
(2) Rig has been idle since mid-December 2008.
(3) Rig commenced operations in April 2009.
(4) Rig incurred a life-enhancing upgrade duringfiscal year 2008.
The ATWOOD HUNTER is currently workingunder contract commitments that extend to Sep-tember 2012 at operating dayrates that rangefrom $538,000 to $545,000, subject to adjustmentfor cost escalations. The ATWOOD EAGLE iscurrently working under a contract commitmentoffshore Australia at a dayrate of $405,000, whichextends to June 2010. Following completion ofthis commitment, the rig will commence a drill-ing program that could extend for six months orlonger at a dayrate of approximately $430,000 toapproximately $450,000, subject to adjustment forcost escalations. The ATWOOD FALCON is cur-rently working under a contract until August2011 at a dayrate of $425,000, subject to adjust-ment for cost escalations.
The VICKSBURG has a current contractcommitment offshore Thailand at a dayrate of$90,000 which is currently expected to extend tothe end of March 2010. The ATWOOD BEACONis currently working offshore Equatorial Guineaunder a drilling contract that extends into June2010. This contract provides for a dayrate of$110,000; however, amortization of mobilizationexpenses will reduce daily operating income byapproximately $25,000. The SEAHAWK is work-ing offshore West Africa under a drilling contractthat currently extends into September 2010. For2007 and 2008 fiscal years, the SEAHAWK’s oper-ating costs exceeded or were relatively consis-tent with revenues; however, for fiscal year 2009,revenue exceeded operating costs. The ATWOODSOUTHERN CROSS has been idle since mid-December 2008. During this idle period, the righas been undergoing certain equipment repairsand maintenance which has kept its operatingcosts relatively high at approximately $60,000 perday during the last three quarters of fiscal year2009. As long as the rig remains idle, its currentlevel of operating costs is expected to be below$40,000 per day. The ATWOOD AURORA is cur-rently working offshore Egypt under a drillingcontract that extends to April 2011 at a dayrateof $133,000.
Our only rig in the U.S. Gulf of Mexico, theRICHMOND, currently has a one well contractcommitment that should extend into December2009. The RICHMOND’s current one-well con-tract provides for a dayrate of $32,500 which isbelow its per day operating cost of approximately$35,000. Upon delivery, the ATWOOD OSPREYhas a three-year contract that provides for adayrate of $470,000, with an option to extend thiscommitment to six years at a dayrate of$450,000. Both dayrates are subject to adjust-ments for cost escalations. We expect this drillingunit will be mobilized to Australia in early calen-dar year 2011. Upon expected delivery in mid-2012, the to-be-named semisubmersible drillingunit is currently without a contract.
13
%%TRANSMSG*** Transmitting Job: H68826 PCN: 008000000 ***%%PCMSG|13 |00013|Yes|No|12/23/2009 12:01|0|0|Page is valid, no graphics -- Color: D|
Total drilling costs for fiscal year 2009increased approximately 3% when compared toprior fiscal year; however, if the drilling costs forthe ATWOOD AURORA (which commenced oper-ations in April 2009) are removed from this com-parison, total drilling costs declined by 2%.
During fiscal year 2010, we expect to incurplanned zero rate time on the following drillingunits:
VICKSBURG Ten (10) zero rate daysduring the third orfourth quarter due torequired regulatoryinspections
RICHMOND Ten (10) zero rate daysduring the third quarterfor required regulatoryinspections
ATWOOD SOUTHERNCROSS
Ten (10) zero rate daysduring the fourth quarterfor required regulatoryinspections
We anticipate incurring capital expendituresduring fiscal years 2010, 2011 and 2012 ofapproximately $300 million, $400 million and$300 million, respectively. Even with an expectedincrease in our outstanding debt between$400 million and $450 million by the end of fiscalyear 2011, we expect that our debt to total capi-talization ratio is unlikely to exceed 25%.
RESULTS OF OPERATIONS
Fiscal Year 2009 Versus Fiscal Year 2008
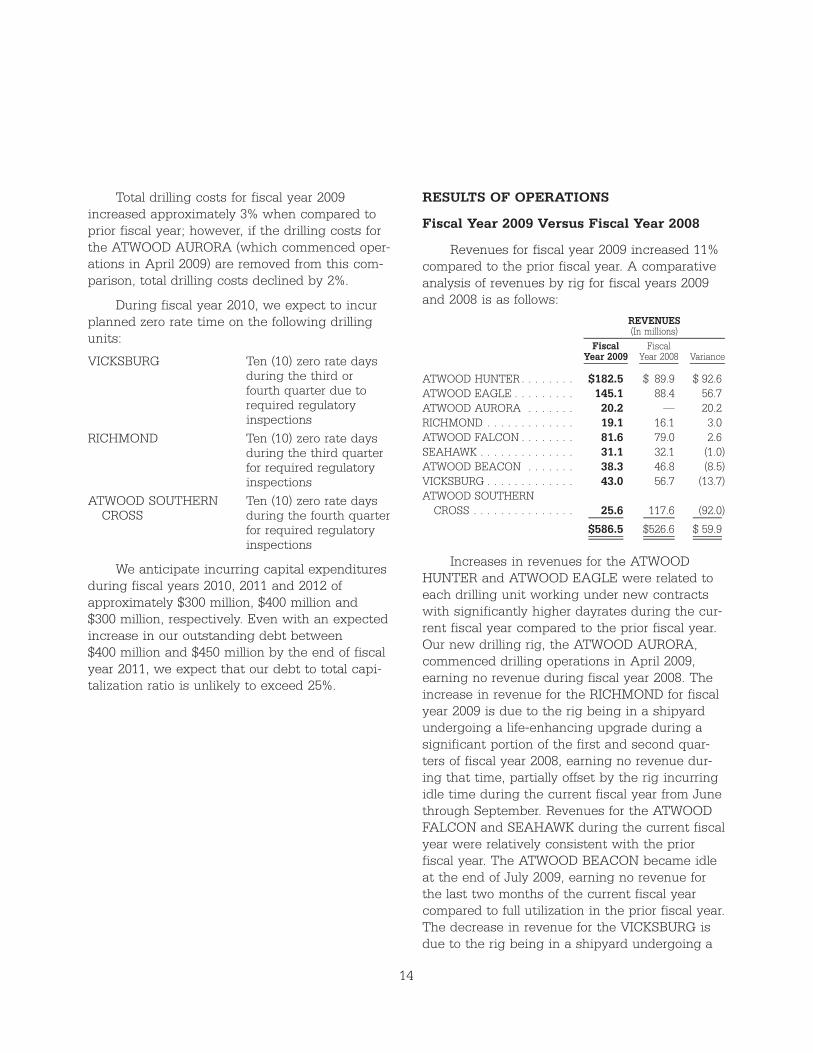
Revenues for fiscal year 2009 increased 11%compared to the prior fiscal year. A comparativeanalysis of revenues by rig for fiscal years 2009and 2008 is as follows:
FiscalYear 2009
FiscalYear 2008 Variance
REVENUES(In millions)
ATWOOD HUNTER . . . . . . . . $182.5 $ 89.9 $ 92.6ATWOOD EAGLE . . . . . . . . . 145.1 88.4 56.7ATWOOD AURORA . . . . . . . 20.2 — 20.2RICHMOND . . . . . . . . . . . . . 19.1 16.1 3.0ATWOOD FALCON . . . . . . . . 81.6 79.0 2.6SEAHAWK . . . . . . . . . . . . . . 31.1 32.1 (1.0)ATWOOD BEACON . . . . . . . 38.3 46.8 (8.5)VICKSBURG . . . . . . . . . . . . . 43.0 56.7 (13.7)ATWOOD SOUTHERN
CROSS . . . . . . . . . . . . . . . 25.6 117.6 (92.0)
$586.5 $526.6 $ 59.9
Increases in revenues for the ATWOODHUNTER and ATWOOD EAGLE were related toeach drilling unit working under new contractswith significantly higher dayrates during the cur-rent fiscal year compared to the prior fiscal year.Our new drilling rig, the ATWOOD AURORA,commenced drilling operations in April 2009,earning no revenue during fiscal year 2008. Theincrease in revenue for the RICHMOND for fiscalyear 2009 is due to the rig being in a shipyardundergoing a life-enhancing upgrade during asignificant portion of the first and second quar-ters of fiscal year 2008, earning no revenue dur-ing that time, partially offset by the rig incurringidle time during the current fiscal year from Junethrough September. Revenues for the ATWOODFALCON and SEAHAWK during the current fiscalyear were relatively consistent with the priorfiscal year. The ATWOOD BEACON became idleat the end of July 2009, earning no revenue forthe last two months of the current fiscal yearcompared to full utilization in the prior fiscal year.The decrease in revenue for the VICKSBURG isdue to the rig being in a shipyard undergoing a
14
%%TRANSMSG*** Transmitting Job: H68826 PCN: 009000000 ***%%PCMSG|14 |00013|Yes|No|12/23/2009 12:01|0|0|Page is valid, no graphics -- Color: D|
life enhancing upgrade during two months of thefourth quarter of fiscal year 2009, earning norevenue during that time compared to full utiliza-tion during the prior fiscal year. Since theATWOOD SOUTHERN CROSS has been idle andearning no revenue since mid December 2008,revenues have significantly decreased during fis-cal year 2009 when compared to fiscal year 2008.
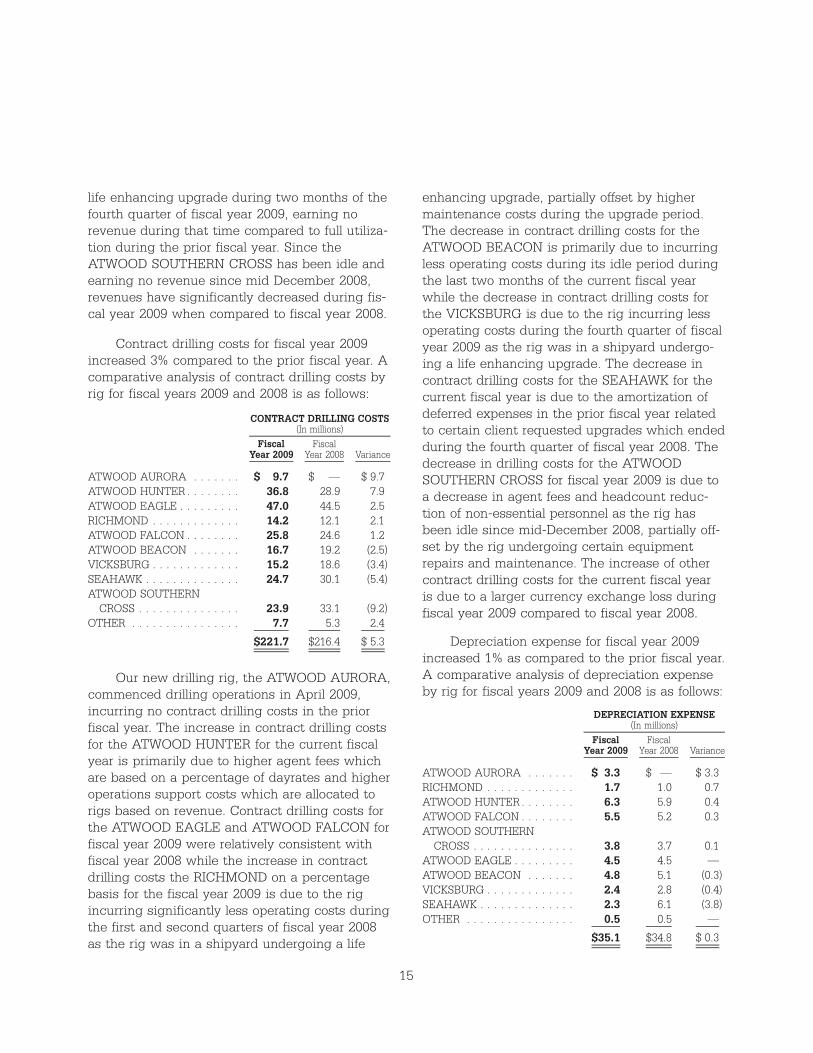
Contract drilling costs for fiscal year 2009increased 3% compared to the prior fiscal year. Acomparative analysis of contract drilling costs byrig for fiscal years 2009 and 2008 is as follows:
FiscalYear 2009
FiscalYear 2008 Variance
CONTRACT DRILLING COSTS(In millions)
ATWOOD AURORA . . . . . . . $ 9.7 $ — $ 9.7ATWOOD HUNTER . . . . . . . . 36.8 28.9 7.9ATWOOD EAGLE . . . . . . . . . 47.0 44.5 2.5RICHMOND . . . . . . . . . . . . . 14.2 12.1 2.1ATWOOD FALCON . . . . . . . . 25.8 24.6 1.2ATWOOD BEACON . . . . . . . 16.7 19.2 (2.5)VICKSBURG . . . . . . . . . . . . . 15.2 18.6 (3.4)SEAHAWK . . . . . . . . . . . . . . 24.7 30.1 (5.4)ATWOOD SOUTHERN
CROSS . . . . . . . . . . . . . . . 23.9 33.1 (9.2)OTHER . . . . . . . . . . . . . . . . 7.7 5.3 2.4
$221.7 $216.4 $ 5.3
Our new drilling rig, the ATWOOD AURORA,commenced drilling operations in April 2009,incurring no contract drilling costs in the priorfiscal year. The increase in contract drilling costsfor the ATWOOD HUNTER for the current fiscalyear is primarily due to higher agent fees whichare based on a percentage of dayrates and higheroperations support costs which are allocated torigs based on revenue. Contract drilling costs forthe ATWOOD EAGLE and ATWOOD FALCON forfiscal year 2009 were relatively consistent withfiscal year 2008 while the increase in contractdrilling costs the RICHMOND on a percentagebasis for the fiscal year 2009 is due to the rigincurring significantly less operating costs duringthe first and second quarters of fiscal year 2008as the rig was in a shipyard undergoing a life
enhancing upgrade, partially offset by highermaintenance costs during the upgrade period.The decrease in contract drilling costs for theATWOOD BEACON is primarily due to incurringless operating costs during its idle period duringthe last two months of the current fiscal yearwhile the decrease in contract drilling costs forthe VICKSBURG is due to the rig incurring lessoperating costs during the fourth quarter of fiscalyear 2009 as the rig was in a shipyard undergo-ing a life enhancing upgrade. The decrease incontract drilling costs for the SEAHAWK for thecurrent fiscal year is due to the amortization ofdeferred expenses in the prior fiscal year relatedto certain client requested upgrades which endedduring the fourth quarter of fiscal year 2008. Thedecrease in drilling costs for the ATWOODSOUTHERN CROSS for fiscal year 2009 is due toa decrease in agent fees and headcount reduc-tion of non-essential personnel as the rig hasbeen idle since mid-December 2008, partially off-set by the rig undergoing certain equipmentrepairs and maintenance. The increase of othercontract drilling costs for the current fiscal yearis due to a larger currency exchange loss duringfiscal year 2009 compared to fiscal year 2008.
Depreciation expense for fiscal year 2009increased 1% as compared to the prior fiscal year.A comparative analysis of depreciation expenseby rig for fiscal years 2009 and 2008 is as follows:
FiscalYear 2009
FiscalYear 2008 Variance
DEPRECIATION EXPENSE(In millions)
ATWOOD AURORA . . . . . . . $ 3.3 $ — $ 3.3RICHMOND . . . . . . . . . . . . . 1.7 1.0 0.7ATWOOD HUNTER . . . . . . . . 6.3 5.9 0.4ATWOOD FALCON . . . . . . . . 5.5 5.2 0.3ATWOOD SOUTHERN
CROSS . . . . . . . . . . . . . . . 3.8 3.7 0.1ATWOOD EAGLE . . . . . . . . . 4.5 4.5 —ATWOOD BEACON . . . . . . . 4.8 5.1 (0.3)VICKSBURG . . . . . . . . . . . . . 2.4 2.8 (0.4)SEAHAWK . . . . . . . . . . . . . . 2.3 6.1 (3.8)OTHER . . . . . . . . . . . . . . . . 0.5 0.5 —
$35.1 $34.8 $ 0.3
15
%%TRANSMSG*** Transmitting Job: H68826 PCN: 010000000 ***%%PCMSG|15 |00013|Yes|No|12/23/2009 12:01|0|0|Page is valid, no graphics -- Color: D|
Our new drilling rig, the ATWOOD AURORA,was placed into service during April 2009, incur-ring no depreciation expense prior to the thirdquarter of fiscal year 2009. In accordance withour company policy, no depreciation expensewas recorded for a significant portion of the firstand second quarters of fiscal year 2008 for theRICHMOND, as the rig was undergoing a lifeenhancing upgrade to extend its remainingdepreciable life from one to ten years. In addition,no depreciation expense was recorded for twomonths of the fourth quarter of fiscal year 2009for the VICKSBURG, as the rig was undergoing alife enhancing upgrade to extend its remainingdepreciable life from four to ten years. EffectiveOctober 1, 2008, we extended the remainingdepreciable life of the SEAHAWK from one yearto five years based upon the length of its currentcontract commitment, coupled with our intent tocontinue marketing and operating the rig beyondone year as the rig is technically capable ofworking over this revised five-year period. Depre-ciation expense for all other rigs remained rela-tively consistent with the prior fiscal year.
General and administrative expenses for thecurrent fiscal year have remained relatively com-parable with the prior fiscal year as the generaland administrative costs related to payroll costs,travel expenses, professional fees, and rentalexpenses incurred during fiscal year 2009 areconsistent with fiscal year 2008. Interest expensehas increased by 63% for the current fiscal yeardue to higher debt balances when compared tothe prior fiscal year, while interest income hasdecreased as interest rates have decreased sig-nificantly when compared to the prior fiscal year.
Virtually all of our tax provision for fiscal year2009 relates to taxes in foreign jurisdictions.Accordingly, due to the high level of operatingincome earned in certain nontaxable and deemedprofit tax jurisdictions during fiscal year 2009, oureffective tax rate was significantly less than theUnited States federal statutory rate. Our effectiverate for fiscal year 2009 of 15% is higher than the
12% effective rate in fiscal year 2008 primarilydue to a significantly lower level of operatingincome earned in certain nontaxable and deemedprofit tax jurisdictions during the current fiscalyear. Excluding any discrete items that may beincurred, we expect our effective tax rate to beapproximately 16%-18% for fiscal year 2010.
During July 2007, we were notified by theMalaysian tax authorities regarding a potentialproposed adjustment relating to fiscal years 2000to 2003. Although we believe we are in compli-ance with applicable rules and regulations, wehave evaluated the merit of the assertions by theMalaysian tax authorities and are currently vigor-ously contesting these assertions. While we can-not predict or provide assurance as to the finaloutcome of these allegations, we do not expectthem to have a material adverse effect on ourconsolidated financial position, results of opera-tions or cash flows. As of September 30, 2009,there has not been any change in the status ofthis claim.
The ATWOOD BEACON operated in Indiafrom early December 2006 to the end of July2009. A service tax was enacted in 2004 onrevenues derived from seismic and explorationactivities. This service tax law was subsequentlyamended in June 2007, and again in May 2008 tostate that revenues derived from mining servicesand drilling services were specifically subject tothis service tax. The ATWOOD BEACON contractterms with our customer in India provided thatany liability incurred by us related to any taxespursuant to laws not in effect at the time thecontract was executed in 2005 was to be reim-bursed by our customer. In our opinion, which issupported by our legal and tax advisors, any suchservice taxes assessed by the Indian tax authori-ties under either provision of the 2007 or 2008amendments would be the obligation of our cus-tomer. Our customer is disputing this obligationon the basis, in their opinion, that revenuesderived from drilling services were taxable underthe initial 2004 law, which, based on our contract
16
%%TRANSMSG*** Transmitting Job: H68826 PCN: 011000000 ***%%PCMSG|16 |00013|Yes|No|12/23/2009 12:01|0|0|Page is valid, no graphics -- Color: D|
terms, would provide that the service tax is ourobligation. For more information, see Note 11 toour Consolidated Financial Statements for theyear ended September 30, 2009.
Fiscal Year 2008 Versus Fiscal Year 2007
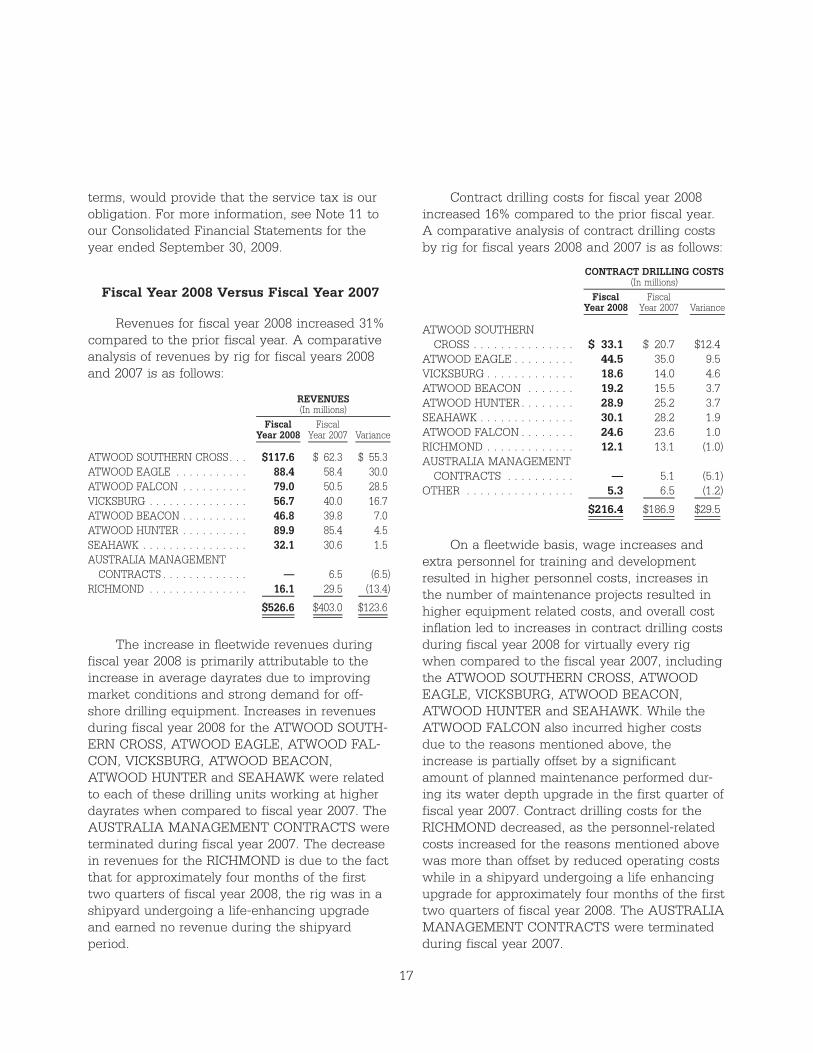
Revenues for fiscal year 2008 increased 31%compared to the prior fiscal year. A comparativeanalysis of revenues by rig for fiscal years 2008and 2007 is as follows:
FiscalYear 2008
FiscalYear 2007 Variance
REVENUES(In millions)
ATWOOD SOUTHERN CROSS. . . $117.6 $ 62.3 $ 55.3ATWOOD EAGLE . . . . . . . . . . . 88.4 58.4 30.0ATWOOD FALCON . . . . . . . . . . 79.0 50.5 28.5VICKSBURG . . . . . . . . . . . . . . . 56.7 40.0 16.7ATWOOD BEACON . . . . . . . . . . 46.8 39.8 7.0ATWOOD HUNTER . . . . . . . . . . 89.9 85.4 4.5SEAHAWK . . . . . . . . . . . . . . . . 32.1 30.6 1.5AUSTRALIA MANAGEMENT
CONTRACTS . . . . . . . . . . . . . — 6.5 (6.5)RICHMOND . . . . . . . . . . . . . . . 16.1 29.5 (13.4)
$526.6 $403.0 $123.6
The increase in fleetwide revenues duringfiscal year 2008 is primarily attributable to theincrease in average dayrates due to improvingmarket conditions and strong demand for off-shore drilling equipment. Increases in revenuesduring fiscal year 2008 for the ATWOOD SOUTH-ERN CROSS, ATWOOD EAGLE, ATWOOD FAL-CON, VICKSBURG, ATWOOD BEACON,ATWOOD HUNTER and SEAHAWK were relatedto each of these drilling units working at higherdayrates when compared to fiscal year 2007. TheAUSTRALIA MANAGEMENT CONTRACTS wereterminated during fiscal year 2007. The decreasein revenues for the RICHMOND is due to the factthat for approximately four months of the firsttwo quarters of fiscal year 2008, the rig was in ashipyard undergoing a life-enhancing upgradeand earned no revenue during the shipyardperiod.
Contract drilling costs for fiscal year 2008increased 16% compared to the prior fiscal year.A comparative analysis of contract drilling costsby rig for fiscal years 2008 and 2007 is as follows:
FiscalYear 2008
FiscalYear 2007 Variance
CONTRACT DRILLING COSTS(In millions)
ATWOOD SOUTHERNCROSS . . . . . . . . . . . . . . . $ 33.1 $ 20.7 $12.4
ATWOOD EAGLE . . . . . . . . . 44.5 35.0 9.5VICKSBURG . . . . . . . . . . . . . 18.6 14.0 4.6ATWOOD BEACON . . . . . . . 19.2 15.5 3.7ATWOOD HUNTER . . . . . . . . 28.9 25.2 3.7SEAHAWK . . . . . . . . . . . . . . 30.1 28.2 1.9ATWOOD FALCON . . . . . . . . 24.6 23.6 1.0RICHMOND . . . . . . . . . . . . . 12.1 13.1 (1.0)AUSTRALIA MANAGEMENT
CONTRACTS . . . . . . . . . . — 5.1 (5.1)OTHER . . . . . . . . . . . . . . . . 5.3 6.5 (1.2)
$216.4 $186.9 $29.5
On a fleetwide basis, wage increases andextra personnel for training and developmentresulted in higher personnel costs, increases inthe number of maintenance projects resulted inhigher equipment related costs, and overall costinflation led to increases in contract drilling costsduring fiscal year 2008 for virtually every rigwhen compared to the fiscal year 2007, includingthe ATWOOD SOUTHERN CROSS, ATWOODEAGLE, VICKSBURG, ATWOOD BEACON,ATWOOD HUNTER and SEAHAWK. While theATWOOD FALCON also incurred higher costsdue to the reasons mentioned above, theincrease is partially offset by a significantamount of planned maintenance performed dur-ing its water depth upgrade in the first quarter offiscal year 2007. Contract drilling costs for theRICHMOND decreased, as the personnel-relatedcosts increased for the reasons mentioned abovewas more than offset by reduced operating costswhile in a shipyard undergoing a life enhancingupgrade for approximately four months of the firsttwo quarters of fiscal year 2008. The AUSTRALIAMANAGEMENT CONTRACTS were terminatedduring fiscal year 2007.
17
%%TRANSMSG*** Transmitting Job: H68826 PCN: 012000000 ***%%PCMSG|17 |00013|Yes|No|12/23/2009 12:01|0|0|Page is valid, no graphics -- Color: D|
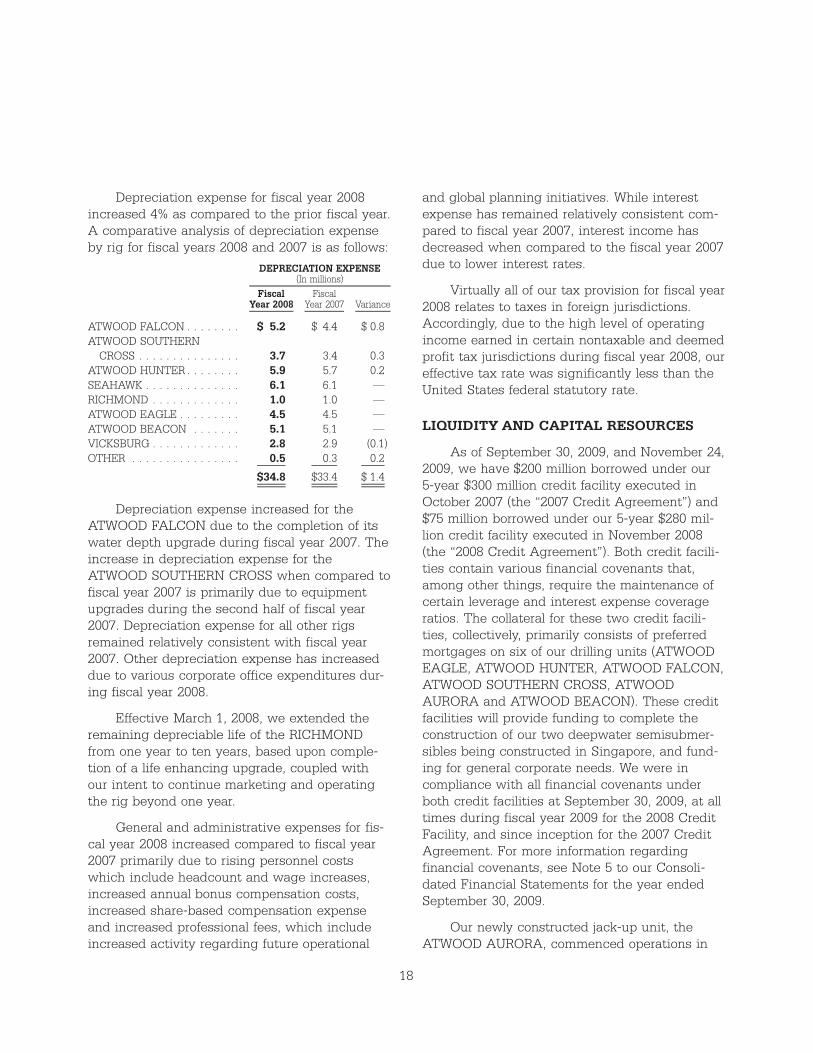
Depreciation expense for fiscal year 2008increased 4% as compared to the prior fiscal year.A comparative analysis of depreciation expenseby rig for fiscal years 2008 and 2007 is as follows:
FiscalYear 2008
FiscalYear 2007 Variance
DEPRECIATION EXPENSE(In millions)
ATWOOD FALCON . . . . . . . . $ 5.2 $ 4.4 $ 0.8ATWOOD SOUTHERN
CROSS . . . . . . . . . . . . . . . 3.7 3.4 0.3ATWOOD HUNTER . . . . . . . . 5.9 5.7 0.2SEAHAWK . . . . . . . . . . . . . . 6.1 6.1 —RICHMOND . . . . . . . . . . . . . 1.0 1.0 —ATWOOD EAGLE . . . . . . . . . 4.5 4.5 —ATWOOD BEACON . . . . . . . 5.1 5.1 —VICKSBURG . . . . . . . . . . . . . 2.8 2.9 (0.1)OTHER . . . . . . . . . . . . . . . . 0.5 0.3 0.2
$34.8 $33.4 $ 1.4
Depreciation expense increased for theATWOOD FALCON due to the completion of itswater depth upgrade during fiscal year 2007. Theincrease in depreciation expense for theATWOOD SOUTHERN CROSS when compared tofiscal year 2007 is primarily due to equipmentupgrades during the second half of fiscal year2007. Depreciation expense for all other rigsremained relatively consistent with fiscal year2007. Other depreciation expense has increaseddue to various corporate office expenditures dur-ing fiscal year 2008.
Effective March 1, 2008, we extended theremaining depreciable life of the RICHMONDfrom one year to ten years, based upon comple-tion of a life enhancing upgrade, coupled withour intent to continue marketing and operatingthe rig beyond one year.
General and administrative expenses for fis-cal year 2008 increased compared to fiscal year2007 primarily due to rising personnel costswhich include headcount and wage increases,increased annual bonus compensation costs,increased share-based compensation expenseand increased professional fees, which includeincreased activity regarding future operational
and global planning initiatives. While interestexpense has remained relatively consistent com-pared to fiscal year 2007, interest income hasdecreased when compared to the fiscal year 2007due to lower interest rates.
Virtually all of our tax provision for fiscal year2008 relates to taxes in foreign jurisdictions.Accordingly, due to the high level of operatingincome earned in certain nontaxable and deemedprofit tax jurisdictions during fiscal year 2008, oureffective tax rate was significantly less than theUnited States federal statutory rate.
LIQUIDITY AND CAPITAL RESOURCES
As of September 30, 2009, and November 24,2009, we have $200 million borrowed under our5-year $300 million credit facility executed inOctober 2007 (the “2007 Credit Agreement”) and$75 million borrowed under our 5-year $280 mil-lion credit facility executed in November 2008(the “2008 Credit Agreement”). Both credit facili-ties contain various financial covenants that,among other things, require the maintenance ofcertain leverage and interest expense coverageratios. The collateral for these two credit facili-ties, collectively, primarily consists of preferredmortgages on six of our drilling units (ATWOODEAGLE, ATWOOD HUNTER, ATWOOD FALCON,ATWOOD SOUTHERN CROSS, ATWOODAURORA and ATWOOD BEACON). These creditfacilities will provide funding to complete theconstruction of our two deepwater semisubmer-sibles being constructed in Singapore, and fund-ing for general corporate needs. We were incompliance with all financial covenants underboth credit facilities at September 30, 2009, at alltimes during fiscal year 2009 for the 2008 CreditFacility, and since inception for the 2007 CreditAgreement. For more information regardingfinancial covenants, see Note 5 to our Consoli-dated Financial Statements for the year endedSeptember 30, 2009.
Our newly constructed jack-up unit, theATWOOD AURORA, commenced operations in
18
%%TRANSMSG*** Transmitting Job: H68826 PCN: 013000000 ***%%PCMSG|18 |00013|Yes|No|12/23/2009 12:01|0|0|Page is valid, no graphics -- Color: D|
April 2009 with a total capitalized cost (afterbeing relocated from its construction site in theUnited States to its first drilling location offshoreEgypt) of approximately $197 million, with$45 million being incurred in fiscal year 2009. Asof September 30, 2009, we had expended approx-imately $325 million towards the construction ofthe ATWOOD OSPREY and $280 million towardsthe construction of our to-be-named dynamicallypositioned semisubmersible, with expected totalconstruction costs of approximately $625 millionand approximately $750 million, respectively, ofwhich $365 million was expended in fiscal year2009. In addition to these construction projects,we expended approximately $7 million on theupgrade of VICKSBURG.
Since we operate in a very volatile industry,maintaining high equipment utilization in up, aswell as down, cycles is a key factor in generatingcash to satisfy current and future obligations. Forfiscal years 2002 through 2008, net cash providedby operating activities ranged from a low ofapproximately $14 million in fiscal year 2003 to ahigh of approximately $192 million in fiscal year2008. For fiscal year 2009, net cash provided byoperating activities totaled approximately $305 mil-lion, which was the highest in our history. Ouroperating cash flows are primarily driven by ouroperating income, which reflects dayrates and rigutilization.
We estimate that our total capital expendi-tures for the fiscal year 2010 will be approxi-mately $300 million, and expect to end fiscal year2010 with outstanding long-term debt of approxi-mately $300 million. With our current contractcommitments providing for approximately $1.8 bil-lion of future revenues, coupled with our currentadditional borrowing capacity of approximately$300 million under our credit facilities, we believethat we will be able to fund the remaining con-struction costs of our two deepwater semisub-mersibles and maintain a strong balance sheetwithout the need for any additional sources ofcapital.
Our portfolio of accounts receivable is prima-rily comprised of large independent or multina-tional corporate entities with stable paymentexperience. Historically, we have not encounteredsignificant difficulty in collecting receivables andtypically do not require collateral for our receiv-ables. As discussed in Note 11 to our Consoli-dated Financial Statements for the year endedSeptember 30, 2009, under “Other Matters”, atSeptember 30, 2009, we have approximately$14 million in outstanding receivables due from acustomer in India; as this receivable is currentlyin dispute, we expect that this collection effortwill extend beyond one year and have, therefore,reclassified this receivable as a long-term asset.
Income tax receivable has increased byapproximately $5.0 million when compared toSeptember 30, 2008, due to having a higher num-ber of tax jurisdictions whereby we have madeestimated income tax payments over and aboveour estimated income tax liability, usually as aresult of local regulations requiring the high esti-mated tax payments.
Inventories of materials and supplies haveincreased by approximately $12.2 million at Sep-tember 30, 2009, compared to September 30,2008, due to the addition of inventory for theATWOOD AURORA, which commenced opera-tions in April 2009, and due to increased pur-chasing of high dollar value critical spare partsfor our fleet.
Prepaid expenses and deferred costs haveincreased by approximately $9.1 million at Sep-tember 30, 2009, compared to September 30,2008, primarily due to the deferred mobilizationcosts related to the relocation of the ATWOODBEACON to Equatorial Guinea.
Income tax payable has increased byapproximately $13.0 million at September 30,2009, compared to September 30, 2008, due toincreased income tax accruals resulting fromhigher earnings and the timing of tax payments
19
%%TRANSMSG*** Transmitting Job: H68826 PCN: 014000000 ***%%PCMSG|19 |00013|Yes|No|12/23/2009 12:01|0|0|Page is valid, no graphics -- Color: D|
associated with these accruals in certain taxjurisdictions.
Short-term deferred credits have increasedby approximately $35.5 million at September 30,2009, compared to September 30, 2008, due toprepayments of revenue by a customer duringthe quarter ended September 30, 2009, which willbe recognized as revenue when services are per-formed during the quarter ended December 31,2009 related to these prepayments. No such pre-payments were received during the quarterended September 30, 2008.
Long-term deferred credits have decreasedby approximately $5.0 million at September 30,2009, compared to September 30, 2008, due tothe amortization of deferred fees associated withthe prior upgrade of the ATWOOD FALCON.Lump sum fees received for upgrade costs reim-bursed by our customers are reported as deferredcredits in the accompanying Consolidated Bal-ance Sheets and are recognized as earned on astraight-line method over the term of the relateddrilling contracts.
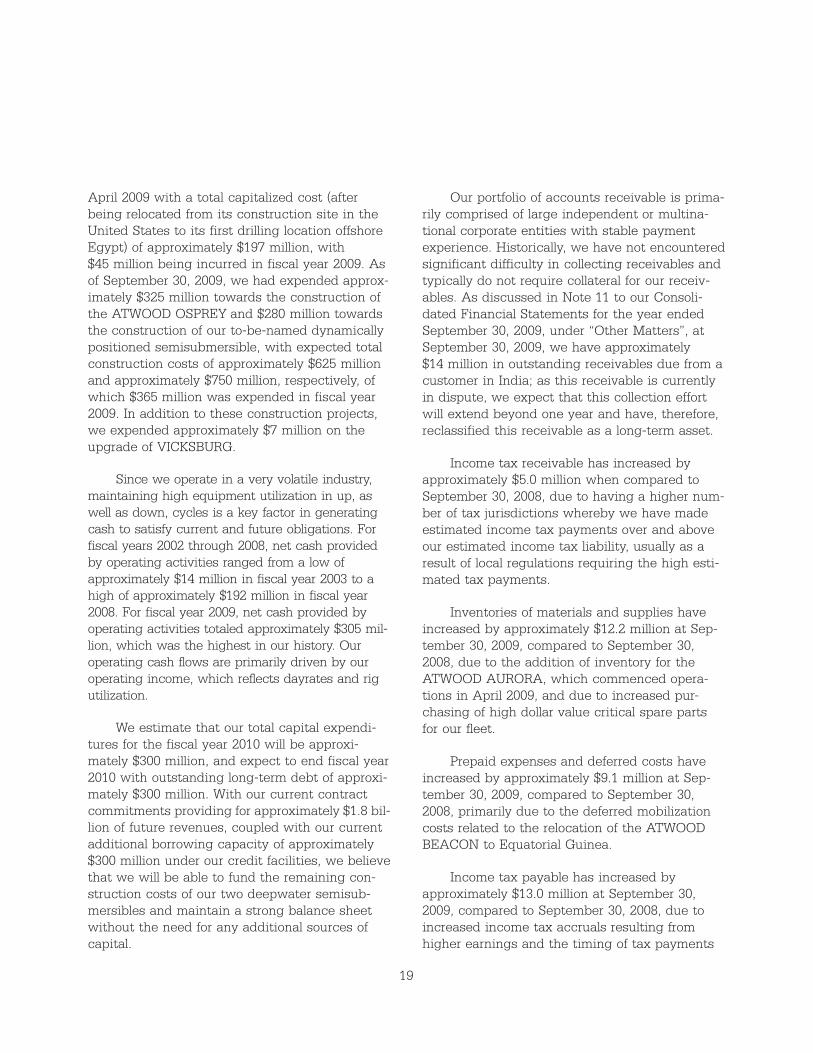
Commitments and Contractual Obligations
The following table summarizes our obliga-tions and commitments (in thousands) at Sep-tember 30, 2009:
Fiscal2010
Fiscal2011
Fiscal2012
Fiscal2013
Fiscal2014 andthereafter
Credit Facility(1) . . . . . . . $ — $ — $ — $200,000 $75,000Purchase
Commitments(2) . . . . . 250,000 305,000 250,000 — —Operating Leases . . . . . . 1,271 1,098 1,022 1,019 1,019
$251,271 $306,098 $251,022 $201,019 $76,019
(1) Amounts exclude interest on our $300 millionand $280 million credit facilities as interest ratesare variable.
(2) Rig construction commitments for the two newdeepwater semisubmersibles.
CRITICAL ACCOUNTING POLICIES
In June 2009, the Financial Accounting Stan-dards Board, or FASB, issued “FASB AccountingStandards Codification,” or FASB ASC, as thesource of authoritative GAAP recognized by theFASB for non-governmental entities. All existingaccounting standards have been superseded andaccounting literature not included in the FASBASC is considered non-authoritative. Subsequentissuances of new standards will be in the form ofAccounting Standards Updates, or ASU, that willbe included in the FASB ASC. Generally, theFASB ASC is not expected to change GAAP.Pursuant to the adoption this guidance, we haveadjusted references to authoritative accountingliterature in our financial statements. Adoptionhad no effect on our financial position, operatingresults or cash flows.
Significant accounting policies are includedin Note 2 to our Consolidated Financial State-ments for the year ended September 30, 2009.These policies, along with the underlyingassumptions and judgments made by manage-ment in their application, have a significantimpact on our consolidated financial statements.We identify our most critical accounting policiesas those that are the most pervasive and impor-tant to the portrayal of our financial position andresults of operations, and that require the mostdifficult, subjective and/or complex judgments bymanagement regarding estimates about mattersthat are inherently uncertain. Our most criticalaccounting policies are those related to revenuerecognition, property and equipment, impairmentof assets, income taxes, and employee stock-based compensation.
We account for contract drilling revenue inaccordance with the terms of the underlying drill-ing contract. These contracts generally providethat revenue is earned and recognized on a dailyrate (i.e. “dayrate”) basis, and dayrates are typi-cally earned for a particular level of service overthe life of a contract. Dayrate contracts can befor a specified period of time or the time required
20
%%TRANSMSG*** Transmitting Job: H68826 PCN: 015000000 ***%%PCMSG|20 |00013|Yes|No|12/23/2009 12:01|0|0|Page is valid, no graphics -- Color: D|
to drill a specified well or number of wells. Reve-nues from dayrate drilling operations, which areclassified under contract drilling services, arerecognized on a per day basis as the workprogresses. In addition, lump-sum fees receivedat commencement of the drilling contract ascompensation for the cost of relocating drillingrigs from one major operating area to another,equipment and upgrade costs reimbursed by thecustomer, as well as receipt of advance billings ofdayrates are recognized as earned on a straight-line method over the term of the related drillingcontract, as are the dayrates associated withsuch contracts. However, lump-sum fees receivedupon termination of a drilling contract are recog-nized as earned during the period terminationoccurs. In addition, we defer the mobilizationcosts relating to moving a drilling rig to a newarea and customer requested equipment pur-chases that will revert to the customer at the endof the applicable drilling contract. We amortizesuch costs on a straight-line basis over the life ofthe applicable drilling contract.
We currently operate nine active offshoredrilling units. These assets are premium equip-ment and should provide many years of qualityservice. At September 30, 2009, the carryingvalue of our property and equipment totaled$1,184.3 million, which represents 78% of ourtotal assets. This carrying value reflects the appli-cation of our property and equipment accountingpolicies, which incorporate estimates, assump-tions and judgments by management relative tothe useful lives and salvage values of our units.Once rigs and related equipment are placed inservice, they are depreciated on the straight-linemethod over their estimated useful lives, withdepreciation discontinued only during the periodwhen a drilling unit is out of service while under-going a significant upgrade that extends its use-ful life. The estimated useful lives of our drillingunits and related equipment range from 3 yearsto 35 years and our salvage values are generallybased on 5% of capitalized costs. Any futureincreases in our estimates of useful lives or
salvage values will have the effect of decreasingfuture depreciation expense in future years andspreading the expense to later years. Any futuredecreases in our useful lives or salvage valueswill have the effect of accelerating future depre-ciation expense.
We evaluate the carrying value of our prop-erty and equipment when events or changes incircumstances indicate that the carrying value ofsuch assets may be impaired. Asset impairmentevaluations are, by nature, highly subjective.Operations of our drilling equipment are subjectto the offshore drilling requirements of oil andgas exploration and production companies andagencies of foreign governments. These require-ments are, in turn, subject to fluctuations ingovernment policies, world demand and price forpetroleum products, proved reserves in relation tosuch demand and the extent to which suchdemand can be met from onshore sources. Thecritical estimates which result from these dynam-ics include projected utilization, dayrates, andoperating expenses, each of which impact ourestimated future cash flows. Over the last tenyears, our equipment utilization rate has aver-aged approximately 91%; however, if a drillingunit incurs significant idle time or receives day-rates below operating costs, its carrying valuecould become impaired. The estimates, assump-tions and judgments used by management in theapplication of our property and equipment andasset impairment policies reflect both historicalexperience and expectations regarding futureindustry conditions and operations. The use ofdifferent estimates, assumptions and judgments,especially those involving the useful lives of ourrigs and vessels and expectations regardingfuture industry conditions and operations, wouldlikely result in materially different carrying valuesof assets and results of operations.
We conduct operations and earn income innumerous foreign countries and are subject tothe laws of taxing jurisdictions within thosecountries, as well as United States federal and
21
%%TRANSMSG*** Transmitting Job: H68826 PCN: 016000000 ***%%PCMSG|21 |00013|Yes|No|12/23/2009 12:01|0|0|Page is valid, no graphics -- Color: D|
state tax laws. At September 30, 2009, we have a$6.0 million net deferred income tax liability. Thisbalance reflects the application of our income taxaccounting policies in accordance with ASC 740“Income Taxes”, formerly Statement of FinancialAccounting Standards (“SFAS”) No. 109,“Accounting for Income Taxes”. Such accountingpolicies incorporate estimates, assumptions andjudgments by management relative to the inter-pretation of applicable tax laws, the applicationof accounting standards, and future levels of tax-able income. The estimates, assumptions andjudgments used by management in connectionwith accounting for income taxes reflect bothhistorical experience and expectations regardingfuture industry conditions and operations.Changes in these estimates, assumptions andjudgments could result in materially different pro-visions for deferred and current income taxes.
We began accounting for uncertain tax posi-tions in accordance with ASC 740 at October 1,2007. ASC 740 prescribes a comprehensive modelfor how companies should recognize, measure,present and disclose in their financial statementsuncertain tax positions taken or to be taken on atax return. The income tax laws and regulationsare voluminous and are often ambiguous. Assuch, we are required to make many subjectiveassumptions and judgments regarding our taxpositions that can materially affect amounts rec-ognized in our consolidated balance sheets andstatements of income.
We account for share-based compensation inaccordance with ASC 718 “Compensation —Stock Compensation”, formerly SFAS No. 123(R),“Share-Based Payment. Under ASC 718, share-based compensation cost is measured at thegrant date, based on the calculated fair value ofthe award, and is recognized as an expense overthe requisite service period (generally the vestingperiod of the equity grant). In addition, share-based compensation cost recognized includescompensation cost for unvested share-basedawards as of October 1, 2005.
RECENTLY ISSUED ACCOUNTINGPRONOUNCEMENTS
In June 2009, the FASB issued guidancewhich revises how an entity evaluates variableinterest entities. The guidance is effective forannual and interim reporting periods beginningafter November 15, 2009, with earlier applicationprohibited. We do not expect our adoption of thisnew accounting pronouncement will have amaterial impact on our financial condition orresults of operations.
In May 2009, the FASB issued ASC 855,“Subsequent Events”, formerly SFAS No. 165,“Subsequent Events”. ASC 855 establishes gen-eral standards of accounting for, and disclosure ofevents that occur, after the balance sheet datebut before financial statements are issued or areavailable to be issued. ASC 855 is effective forinterim or annual periods ending after June 15,2009. We adopted ASC 855 during the quarterended June 30, 2009, with no significant changesto subsequent events that we are required torecognize or disclose in our financial statements.We have performed an evaluation of subsequentevents through November 25, 2009, which is thedate the financial statements were issued.
In April 2009, the FASB issued ASC820-10-65-4, “Determining Fair Value When theVolume and Level of Activity for the Asset orLiability Have Significantly Decreased and Identi-fying Transactions That Are Not Orderly”, for-merly Staff Position FAS 157-4, “Determining FairValue When the Volume and Level of Activity forthe Asset or Liability Have SignificantlyDecreased and Identifying Transactions That AreNot Orderly”. ASC 820-10-65-4 provides addi-tional guidance for estimating fair value whenthe volume and level of activity for the asset orliability have significantly decreased. ASC820-10-65-4 also includes guidance on identifyingcircumstances that indicate a transaction is notorderly. ASC 820-10-65-4 is effective for interimand annual periods ending after June 15, 2009,and shall be applied prospectively. We adopted
22
%%TRANSMSG*** Transmitting Job: H68826 PCN: 017000000 ***%%PCMSG|22 |00014|Yes|No|12/23/2009 12:01|0|0|Page is valid, no graphics -- Color: D|
ASC 820-10-65-4 during the quarter endedJune 30, 2009, with no material impact to ourfinancial position, operating results or cash flows.
Also in April 2009, the FASB issued ASC825-10-50-28, “Required Disclosures as of EachDate for Which an Interim or Annual Statementof Financial Position Is Presented”, formerly StaffPosition FAS 107-1 and APB 28-1 “Interim Disclo-sures about Fair Value of Financial Instruments”.ASC 825-10-50-28 requires disclosures about thefair value of financial instruments for interimreporting periods of publicly traded companies inaddition to annual financial statements. ASC825-10-50-28 is effective for interim periods end-ing after June 15, 2009. We adopted ASC 825-10-50-28 during the quarter ended June 30, 2009,with no significant changes to the disclosures inour financial statements.
In December 2007, the FASB issued ASC805, “Business Combinations”, formerlySFAS No. 141(R), “Business Combinations(revised 2007)”. ASC 805 retains the fundamentalrequirement that the acquisition method be usedfor all business combinations and expands thesame method of accounting to all transactionsand other events in which one entity obtainscontrol over one of more other businesses orassets at the acquisition date and in subsequentperiods. ASC 805 requires measurement at theacquisition date of the fair value of assetsacquired, liabilities assumed and noncontrollinginterest. Additionally, ASC 805 requires thatacquisition-related costs, including restructuringcosts, be recognized separately from the acquisi-tion. ASC 805 applies prospectively to businesscombinations for fiscal years beginning afterDecember 15, 2008. The future impact of ASC805 on us will depend on the nature and extentof any future acquisitions.
Also in December 2007, the FASB issuedASC 810-10-65, “Transition Related to FASBStatement No. 160, Noncontrolling Interests inConsolidated Financial Statements — an amend-ment of ARB No. 51”, formerly SFAS No. 160,
“Noncontrolling Interests in Consolidated Finan-cial Statements — an amendment of ARBNo. 51”. ASC 810-10-65 establishes the account-ing and reporting standards for a noncontrollinginterest in a subsidiary and for the deconsolida-tion of a subsidiary. ASC 810-10-65 clarifies thata noncontrolling interest in a subsidiary is anownership interest in the consolidated entity thatshould be reported as equity in the consolidatedfinancial statements. ASC 810-10-65 requires ret-roactive adoption of the presentation and disclo-sure requirements for existing minority interestsand applies prospectively to business combina-tions for fiscal years beginning after December 15,2008. We are currently analyzing the provisionsof ASC 810-10-65 to determine how it will affectaccounting policies and procedures, but we havenot yet made a determination of the impact theadoption will have on our consolidated financialposition, results of operations and cash flows.
In February 2007, the FASB issued ASC825-10-25, “The Fair Value Option”, formerlySFAS No. 159, “The Fair Value Option for Finan-cial Assets and Financial Liabilities”. ASC825-10-25 provides companies with an option toreport selected financial assets and liabilities atfair value and establishes presentation and dis-closure requirements to facilitate comparisonsbetween companies that choose different mea-surement attributes for similar types of assetsand liabilities. GAAP has required different mea-surement attributes for different assets and liabil-ities that can create artificial volatility inearnings. The objective of ASC 825-10-25 is tohelp mitigate this type of volatility in the earn-ings by enabling companies to report relatedassets and liabilities at fair value, which wouldlikely reduce the need for companies to complywith complex hedge accounting provisions. ASC825-10-25 is effective for fiscal years beginningafter November 15, 2007. ASC 825-10-25 has nothad a material impact on our consolidated finan-cial position, results of operations and cash flows.
23
%%TRANSMSG*** Transmitting Job: H68826 PCN: 018000000 ***%%PCMSG|23 |00013|Yes|No|12/23/2009 12:01|0|0|Page is valid, no graphics -- Color: D|
In September 2005, the FASB issued ASC820, “Fair Value Measurements and Disclosure”,formerly SFAS No. 157, “Fair Value Measure-ments”. ASC 820 defines fair value, establishesmethods used to measure fair value and expandsdisclosure requirements about fair value mea-surements. ASC 820 is effective for financialstatements issued for fiscal years beginning afterNovember 15, 2007, and interim periods withinthose fiscal periods. In February 2008, the FASBissued ASC 820-10-65, “Transition and OpenEffective Date Information”, formerly FASB StaffPosition No. FAS 157-2, “Effective Date of FASBStatement No. 157”. ASC 820-10-65 delays theeffective date of ASC 820 by one year for allnonfinancial assets and nonfinancial liabilities,except those that are recognized or disclosed atfair value in the financial statements on a recur-ring basis (at least annually). In October 2008, theFASB issued ASC 820-10-35-51A through 35-51B,formerly FSP FAS 157-3, “Determining the FairValue of a Financial Asset When the Market forThat Asset Is Not Active”. ASC 820-10-35-51Athrough 35-51B clarifies the application of ASC820 in a market that is not active and providesan example to illustrate key considerations indetermining the fair value of a financial assetwhen the market for that financial asset is notactive. ASC 820-10-35-51A through 35-51B waseffective upon issuance. We adopted ASC 820,ASC 820-10-65 and ASC 820-10-35-51A through35-51B, during fiscal year 2009 with no materialimpact to our financial position, operating resultsor cash flows.
DISCLOSURES ABOUT MARKET RISK
We are exposed to market risk, includingadverse changes in interest rates and foreigncurrency exchange rates as discussed below.
Interest Rate Risk
All of our $275 million of long-term debtoutstanding at September 30, 2009, was floatingrate debt. As a result, our annual interest costs infiscal year 2010 will fluctuate based on interestrate changes. Because the interest rate on ourlong-term debt is a floating rate, the fair value ofour long-term debt approximated carrying valueas of September 30, 2009. The impact on annualcash flow of a 10% change in the floating rate(approximately 20 basis points) would be approx-imately $0.6 million, which we believe to beimmaterial. We did not have any open derivativecontracts relating to our floating rate debt atSeptember 30, 2009.
Foreign Currency Risk
Certain of our subsidiaries have monetaryassets and liabilities that are denominated in acurrency other than their functional currencies.Based on September 30, 2009, amounts, adecrease in the value of 10% in the foreigncurrencies relative to the U.S. Dollar from thefiscal year-end exchange rates would result in aforeign currency transaction gain of approxi-mately $2.9 million. We consider our current riskexposure to foreign currency exchange ratemovements, based on net cash flows, to beimmaterial. We did not have any open derivativecontracts relating to foreign currencies at Sep-tember 30, 2009.
24
%%TRANSMSG*** Transmitting Job: H68826 PCN: 019000000 ***%%PCMSG|24 |00013|Yes|No|12/23/2009 12:01|0|0|Page is valid, no graphics -- Color: D|
MANAGEMENT’S REPORT ON INTERNAL CONTROLOVER FINANCIAL REPORTING
Management of Atwood Oceanics, Inc. (which together with its subsidiaries is identified as the“Company,” “we” or “our,” unless the context requires otherwise) is responsible for establishing andmaintaining adequate internal control over financial reporting as defined in Rules 13a-15(f) and 15d-15(f)under the Securities Exchange Act of 1934. Our internal control over financial reporting was designedby management, under the supervision of the Chief Executive Officer and Chief Financial Officer, toprovide reasonable assurance regarding the reliability of financial reporting and the preparation offinancial statements for external purposes in accordance with accounting principles generally acceptedin the United States of America, and includes those policies and procedures that:
(i) pertain to the maintenance of records that, in reasonable detail, accurately and fairly reflectthe transactions and dispositions of the assets of the Company;
(ii) provide reasonable assurance that transactions are recorded as necessary to permit prepa-ration of financial statements in accordance with accounting principles generally accepted in theUnited States of America, and that receipts and expenditures of the Company are being made onlyin accordance with authorizations of management and directors of the Company; and
(iii) provide reasonable assurance regarding prevention or timely detection of unauthorizedacquisition, use or disposition of the Company’s assets that could have a material effect on thefinancial statements.
Because of its inherent limitations, internal control over financial reporting may not prevent ordetect misstatements. Also, projections of any evaluation of effectiveness to future periods are subjectto the risk that controls may become inadequate because of changes in conditions, or that the degree ofcompliance with the policies and procedures may deteriorate.
Management assessed the effectiveness of the Company’s internal control over financial reporting as ofSeptember 30, 2009. In making this assessment, management used the criteria set forth by the Committeeof Sponsoring Organizations of the Treadway Commission in Internal Control-Integrated Framework.
Based on our evaluation under the criteria in Internal Control-Integrated Framework, managementhas concluded that the Company maintained effective internal control over financial reporting as ofSeptember 30, 2009. PricewaterhouseCoopers LLP, our independent registered public accounting firm,has issued an attestation report on the effectiveness of the Company’s internal control over financialreporting as of September 30, 2009, which appears on the following page.
ATWOOD OCEANICS, INC.
by
John R. IrwinDirector, Presidentand Chief Executive Officer
James M. HollandSenior Vice President, ChiefFinancial Officer and Secretary
November 25, 2009
25
%%TRANSMSG*** Transmitting Job: H68826 PCN: 020000000 ***%%PCMSG|25 |00011|Yes|No|12/23/2009 12:01|0|0|Page/graphics valid 12/23/2009 12:03 -- Color: D|
REPORT OF INDEPENDENT REGISTERED PUBLIC ACCOUNTING FIRM
To the Board of Directors and Shareholders of Atwood Oceanics, Inc.
In our opinion, the accompanying consolidated balance sheets and the related consolidatedstatements of operations, of cash flows and of changes in shareholders’ equity present fairly, in allmaterial respects, the financial position of Atwood Oceanics, Inc. and its subsidiaries at September 30,2009 and 2008, and the results of their operations and their cash flows for each of the three years in theperiod ended September 30, 2009 in conformity with accounting principles generally accepted in theUnited States of America. Also in our opinion, the Company maintained, in all material respects,effective internal control over financial reporting as of September 30, 2009, based on criteria establishedin Internal Control — Integrated Framework issued by the Committee of Sponsoring Organizations of theTreadway Commission. The Company’s management is responsible for these financial statements, formaintaining effective internal control over financial reporting and for its assessment of the effectivenessof internal control over financial reporting, included in the accompanying Management’s Report onInternal Control Over Financial Reporting, which appears on the preceding page. Our responsibility is toexpress opinions on these financial statements and on the Company’s internal control over financialreporting based on our integrated audits. We conducted our audits in accordance with the standards ofthe Public Company Accounting Oversight Board (United States). Those standards require that we planand perform the audits to obtain reasonable assurance about whether the financial statements are freeof material misstatement and whether effective internal control over financial reporting was maintainedin all material respects. Our audits of the financial statements included examining, on a test basis,evidence supporting the amounts and disclosures in the financial statements, assessing the accountingprinciples used and significant estimates made by management, and evaluating the overall financialstatement presentation. Our audit of internal control over financial reporting included obtaining anunderstanding of internal control over financial reporting, assessing the risk that a material weaknessexists, and testing and evaluating the design and operating effectiveness of internal control based onthe assessed risk. Our audits also included performing such other procedures as we considerednecessary in the circumstances. We believe that our audits provide a reasonable basis for our opinions.
A company’s internal control over financial reporting is a process designed to provide reasonableassurance regarding the reliability of financial reporting and the preparation of financial statements forexternal purposes in accordance with generally accepted accounting principles. A company’s internalcontrol over financial reporting includes those policies and procedures that (i) pertain to the mainte-nance of records that, in reasonable detail, accurately and fairly reflect the transactions and dispositionsof the assets of the company; (ii) provide reasonable assurance that transactions are recorded asnecessary to permit preparation of financial statements in accordance with generally accepted account-ing principles, and that receipts and expenditures of the company are being made only in accordancewith authorizations of management and directors of the company; and (iii) provide reasonable assuranceregarding prevention or timely detection of unauthorized acquisition, use, or disposition of thecompany’s assets that could have a material effect on the financial statements.
26
%%TRANSMSG*** Transmitting Job: H68826 PCN: 021000000 ***%%PCMSG|26 |00011|Yes|No|12/23/2009 12:01|0|0|Page is valid, no graphics -- Color: D|
Because of its inherent limitations, internal control over financial reporting may not prevent ordetect misstatements. Also, projections of any evaluation of effectiveness to future periods are subjectto the risk that controls may become inadequate because of changes in conditions, or that the degree ofcompliance with the policies or procedures may deteriorate.
Houston, TexasNovember 25, 2009
27
%%TRANSMSG*** Transmitting Job: H68826 PCN: 022000000 ***%%PCMSG|27 |00013|Yes|No|12/23/2009 12:01|0|0|Page/graphics valid 12/23/2009 12:03 -- Color: D|
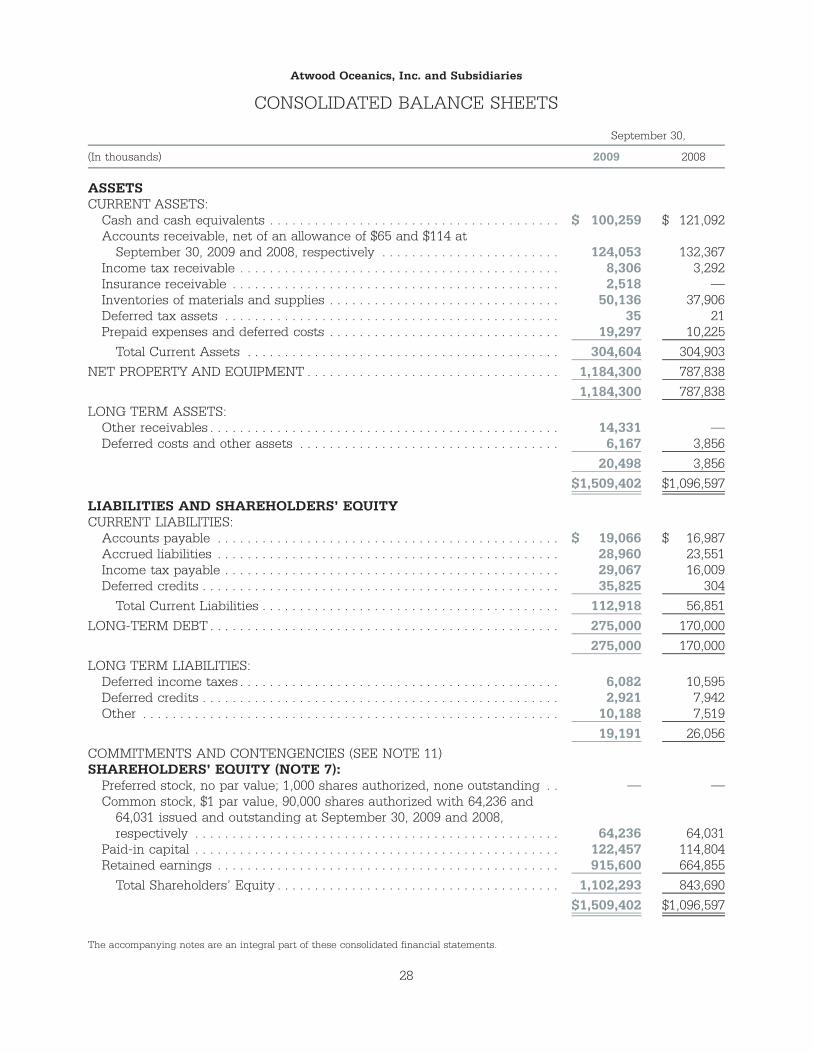
Atwood Oceanics, Inc. and Subsidiaries
CONSOLIDATED BALANCE SHEETS
(In thousands) 2009 2008
September 30,
ASSETSCURRENT ASSETS:
Cash and cash equivalents . . . . . . . . . . . . . . . . . . . . . . . . . . . . . . . . . . . . . . . $ 100,259 $ 121,092Accounts receivable, net of an allowance of $65 and $114 at
September 30, 2009 and 2008, respectively . . . . . . . . . . . . . . . . . . . . . . . . 124,053 132,367Income tax receivable . . . . . . . . . . . . . . . . . . . . . . . . . . . . . . . . . . . . . . . . . . . 8,306 3,292Insurance receivable . . . . . . . . . . . . . . . . . . . . . . . . . . . . . . . . . . . . . . . . . . . . 2,518 —Inventories of materials and supplies . . . . . . . . . . . . . . . . . . . . . . . . . . . . . . . 50,136 37,906Deferred tax assets . . . . . . . . . . . . . . . . . . . . . . . . . . . . . . . . . . . . . . . . . . . . . 35 21Prepaid expenses and deferred costs . . . . . . . . . . . . . . . . . . . . . . . . . . . . . . . 19,297 10,225
Total Current Assets . . . . . . . . . . . . . . . . . . . . . . . . . . . . . . . . . . . . . . . . . . 304,604 304,903
NET PROPERTY AND EQUIPMENT . . . . . . . . . . . . . . . . . . . . . . . . . . . . . . . . . . 1,184,300 787,838
1,184,300 787,838
LONG TERM ASSETS:Other receivables . . . . . . . . . . . . . . . . . . . . . . . . . . . . . . . . . . . . . . . . . . . . . . . 14,331 —Deferred costs and other assets . . . . . . . . . . . . . . . . . . . . . . . . . . . . . . . . . . . 6,167 3,856
20,498 3,856
$1,509,402 $1,096,597
LIABILITIES AND SHAREHOLDERS’ EQUITYCURRENT LIABILITIES:
Accounts payable . . . . . . . . . . . . . . . . . . . . . . . . . . . . . . . . . . . . . . . . . . . . . . $ 19,066 $ 16,987Accrued liabilities . . . . . . . . . . . . . . . . . . . . . . . . . . . . . . . . . . . . . . . . . . . . . . 28,960 23,551Income tax payable . . . . . . . . . . . . . . . . . . . . . . . . . . . . . . . . . . . . . . . . . . . . . 29,067 16,009Deferred credits . . . . . . . . . . . . . . . . . . . . . . . . . . . . . . . . . . . . . . . . . . . . . . . . 35,825 304
Total Current Liabilities . . . . . . . . . . . . . . . . . . . . . . . . . . . . . . . . . . . . . . . . 112,918 56,851
LONG-TERM DEBT . . . . . . . . . . . . . . . . . . . . . . . . . . . . . . . . . . . . . . . . . . . . . . . 275,000 170,000
275,000 170,000
LONG TERM LIABILITIES:Deferred income taxes . . . . . . . . . . . . . . . . . . . . . . . . . . . . . . . . . . . . . . . . . . . 6,082 10,595Deferred credits . . . . . . . . . . . . . . . . . . . . . . . . . . . . . . . . . . . . . . . . . . . . . . . . 2,921 7,942Other . . . . . . . . . . . . . . . . . . . . . . . . . . . . . . . . . . . . . . . . . . . . . . . . . . . . . . . . 10,188 7,519
19,191 26,056
COMMITMENTS AND CONTENGENCIES (SEE NOTE 11)SHAREHOLDERS’ EQUITY (NOTE 7):
Preferred stock, no par value; 1,000 shares authorized, none outstanding . . — —Common stock, $1 par value, 90,000 shares authorized with 64,236 and
64,031 issued and outstanding at September 30, 2009 and 2008,respectively . . . . . . . . . . . . . . . . . . . . . . . . . . . . . . . . . . . . . . . . . . . . . . . . . 64,236 64,031
Paid-in capital . . . . . . . . . . . . . . . . . . . . . . . . . . . . . . . . . . . . . . . . . . . . . . . . . 122,457 114,804Retained earnings . . . . . . . . . . . . . . . . . . . . . . . . . . . . . . . . . . . . . . . . . . . . . . 915,600 664,855
Total Shareholders’ Equity . . . . . . . . . . . . . . . . . . . . . . . . . . . . . . . . . . . . . . 1,102,293 843,690
$1,509,402 $1,096,597
The accompanying notes are an integral part of these consolidated financial statements.
28
%%TRANSMSG*** Transmitting Job: H68826 PCN: 023000000 ***%%PCMSG|28 |00012|Yes|No|12/23/2009 12:01|0|0|Page is valid, no graphics -- Color: D|
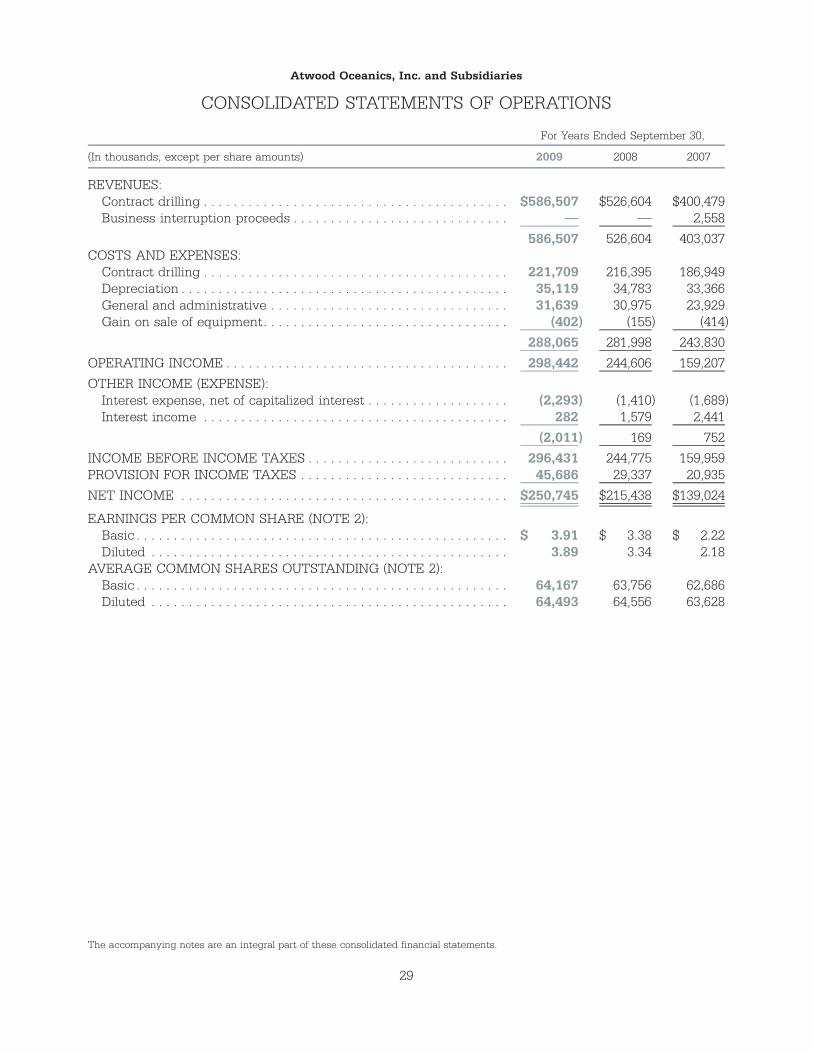
Atwood Oceanics, Inc. and Subsidiaries
CONSOLIDATED STATEMENTS OF OPERATIONS
(In thousands, except per share amounts) 2009 2008 2007
For Years Ended September 30,
REVENUES:Contract drilling . . . . . . . . . . . . . . . . . . . . . . . . . . . . . . . . . . . . . . . . . $586,507 $526,604 $400,479Business interruption proceeds . . . . . . . . . . . . . . . . . . . . . . . . . . . . . — — 2,558
586,507 526,604 403,037COSTS AND EXPENSES:
Contract drilling . . . . . . . . . . . . . . . . . . . . . . . . . . . . . . . . . . . . . . . . . 221,709 216,395 186,949Depreciation . . . . . . . . . . . . . . . . . . . . . . . . . . . . . . . . . . . . . . . . . . . . 35,119 34,783 33,366General and administrative . . . . . . . . . . . . . . . . . . . . . . . . . . . . . . . . 31,639 30,975 23,929Gain on sale of equipment. . . . . . . . . . . . . . . . . . . . . . . . . . . . . . . . . (402) (155) (414)
288,065 281,998 243,830
OPERATING INCOME . . . . . . . . . . . . . . . . . . . . . . . . . . . . . . . . . . . . . . 298,442 244,606 159,207
OTHER INCOME (EXPENSE):Interest expense, net of capitalized interest . . . . . . . . . . . . . . . . . . . (2,293) (1,410) (1,689)Interest income . . . . . . . . . . . . . . . . . . . . . . . . . . . . . . . . . . . . . . . . . 282 1,579 2,441
(2,011) 169 752
INCOME BEFORE INCOME TAXES . . . . . . . . . . . . . . . . . . . . . . . . . . . 296,431 244,775 159,959PROVISION FOR INCOME TAXES . . . . . . . . . . . . . . . . . . . . . . . . . . . . 45,686 29,337 20,935
NET INCOME . . . . . . . . . . . . . . . . . . . . . . . . . . . . . . . . . . . . . . . . . . . . $250,745 $215,438 $139,024
EARNINGS PER COMMON SHARE (NOTE 2):Basic . . . . . . . . . . . . . . . . . . . . . . . . . . . . . . . . . . . . . . . . . . . . . . . . . . $ 3.91 $ 3.38 $ 2.22Diluted . . . . . . . . . . . . . . . . . . . . . . . . . . . . . . . . . . . . . . . . . . . . . . . . 3.89 3.34 2.18
AVERAGE COMMON SHARES OUTSTANDING (NOTE 2):Basic . . . . . . . . . . . . . . . . . . . . . . . . . . . . . . . . . . . . . . . . . . . . . . . . . . 64,167 63,756 62,686Diluted . . . . . . . . . . . . . . . . . . . . . . . . . . . . . . . . . . . . . . . . . . . . . . . . 64,493 64,556 63,628
The accompanying notes are an integral part of these consolidated financial statements.
29
%%TRANSMSG*** Transmitting Job: H68826 PCN: 024000000 ***%%PCMSG|29 |00011|Yes|No|12/23/2009 12:01|0|0|Page is valid, no graphics -- Color: D|
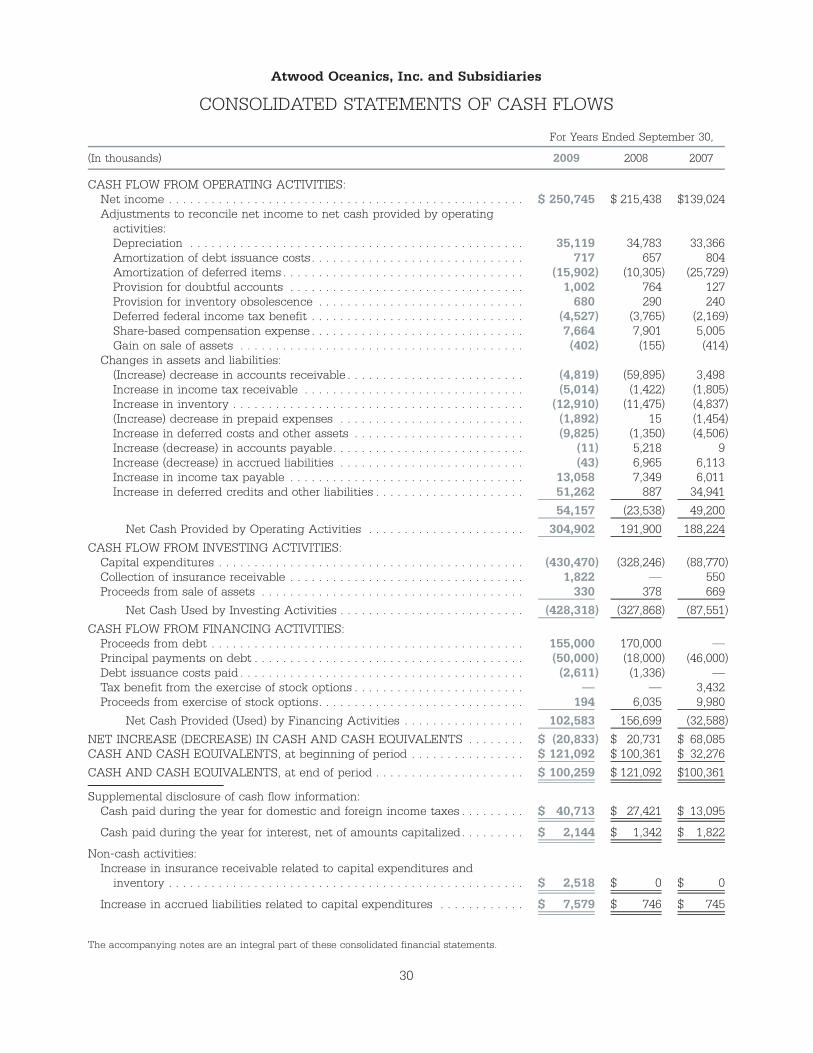
Atwood Oceanics, Inc. and Subsidiaries
CONSOLIDATED STATEMENTS OF CASH FLOWS
(In thousands) 2009 2008 2007
For Years Ended September 30,
CASH FLOW FROM OPERATING ACTIVITIES:Net income . . . . . . . . . . . . . . . . . . . . . . . . . . . . . . . . . . . . . . . . . . . . . . . . . . $ 250,745 $ 215,438 $139,024Adjustments to reconcile net income to net cash provided by operating
activities:Depreciation . . . . . . . . . . . . . . . . . . . . . . . . . . . . . . . . . . . . . . . . . . . . . . . 35,119 34,783 33,366Amortization of debt issuance costs. . . . . . . . . . . . . . . . . . . . . . . . . . . . . . 717 657 804Amortization of deferred items . . . . . . . . . . . . . . . . . . . . . . . . . . . . . . . . . . (15,902) (10,305) (25,729)Provision for doubtful accounts . . . . . . . . . . . . . . . . . . . . . . . . . . . . . . . . . 1,002 764 127Provision for inventory obsolescence . . . . . . . . . . . . . . . . . . . . . . . . . . . . . 680 290 240Deferred federal income tax benefit . . . . . . . . . . . . . . . . . . . . . . . . . . . . . . (4,527) (3,765) (2,169)Share-based compensation expense . . . . . . . . . . . . . . . . . . . . . . . . . . . . . . 7,664 7,901 5,005Gain on sale of assets . . . . . . . . . . . . . . . . . . . . . . . . . . . . . . . . . . . . . . . . (402) (155) (414)
Changes in assets and liabilities:(Increase) decrease in accounts receivable . . . . . . . . . . . . . . . . . . . . . . . . . (4,819) (59,895) 3,498Increase in income tax receivable . . . . . . . . . . . . . . . . . . . . . . . . . . . . . . . (5,014) (1,422) (1,805)Increase in inventory . . . . . . . . . . . . . . . . . . . . . . . . . . . . . . . . . . . . . . . . . (12,910) (11,475) (4,837)(Increase) decrease in prepaid expenses . . . . . . . . . . . . . . . . . . . . . . . . . . (1,892) 15 (1,454)Increase in deferred costs and other assets . . . . . . . . . . . . . . . . . . . . . . . . (9,825) (1,350) (4,506)Increase (decrease) in accounts payable. . . . . . . . . . . . . . . . . . . . . . . . . . . (11) 5,218 9Increase (decrease) in accrued liabilities . . . . . . . . . . . . . . . . . . . . . . . . . . (43) 6,965 6,113Increase in income tax payable . . . . . . . . . . . . . . . . . . . . . . . . . . . . . . . . . 13,058 7,349 6,011Increase in deferred credits and other liabilities . . . . . . . . . . . . . . . . . . . . . 51,262 887 34,941
54,157 (23,538) 49,200
Net Cash Provided by Operating Activities . . . . . . . . . . . . . . . . . . . . . . 304,902 191,900 188,224
CASH FLOW FROM INVESTING ACTIVITIES:Capital expenditures . . . . . . . . . . . . . . . . . . . . . . . . . . . . . . . . . . . . . . . . . . . (430,470) (328,246) (88,770)Collection of insurance receivable . . . . . . . . . . . . . . . . . . . . . . . . . . . . . . . . . 1,822 — 550Proceeds from sale of assets . . . . . . . . . . . . . . . . . . . . . . . . . . . . . . . . . . . . . 330 378 669
Net Cash Used by Investing Activities . . . . . . . . . . . . . . . . . . . . . . . . . . (428,318) (327,868) (87,551)
CASH FLOW FROM FINANCING ACTIVITIES:Proceeds from debt . . . . . . . . . . . . . . . . . . . . . . . . . . . . . . . . . . . . . . . . . . . . 155,000 170,000 —Principal payments on debt . . . . . . . . . . . . . . . . . . . . . . . . . . . . . . . . . . . . . . (50,000) (18,000) (46,000)Debt issuance costs paid . . . . . . . . . . . . . . . . . . . . . . . . . . . . . . . . . . . . . . . . (2,611) (1,336) —Tax benefit from the exercise of stock options . . . . . . . . . . . . . . . . . . . . . . . . — — 3,432Proceeds from exercise of stock options. . . . . . . . . . . . . . . . . . . . . . . . . . . . . 194 6,035 9,980
Net Cash Provided (Used) by Financing Activities . . . . . . . . . . . . . . . . . 102,583 156,699 (32,588)
NET INCREASE (DECREASE) IN CASH AND CASH EQUIVALENTS . . . . . . . . $ (20,833) $ 20,731 $ 68,085CASH AND CASH EQUIVALENTS, at beginning of period . . . . . . . . . . . . . . . . $ 121,092 $ 100,361 $ 32,276
CASH AND CASH EQUIVALENTS, at end of period . . . . . . . . . . . . . . . . . . . . . $ 100,259 $ 121,092 $100,361
Supplemental disclosure of cash flow information:Cash paid during the year for domestic and foreign income taxes . . . . . . . . . $ 40,713 $ 27,421 $ 13,095
Cash paid during the year for interest, net of amounts capitalized. . . . . . . . . $ 2,144 $ 1,342 $ 1,822
Non-cash activities:Increase in insurance receivable related to capital expenditures and
inventory . . . . . . . . . . . . . . . . . . . . . . . . . . . . . . . . . . . . . . . . . . . . . . . . . . $ 2,518 $ 0 $ 0
Increase in accrued liabilities related to capital expenditures . . . . . . . . . . . . $ 7,579 $ 746 $ 745
The accompanying notes are an integral part of these consolidated financial statements.
30
%%TRANSMSG*** Transmitting Job: H68826 PCN: 025000000 ***%%PCMSG|30 |00011|Yes|No|12/23/2009 12:01|0|0|Page is valid, no graphics -- Color: D|
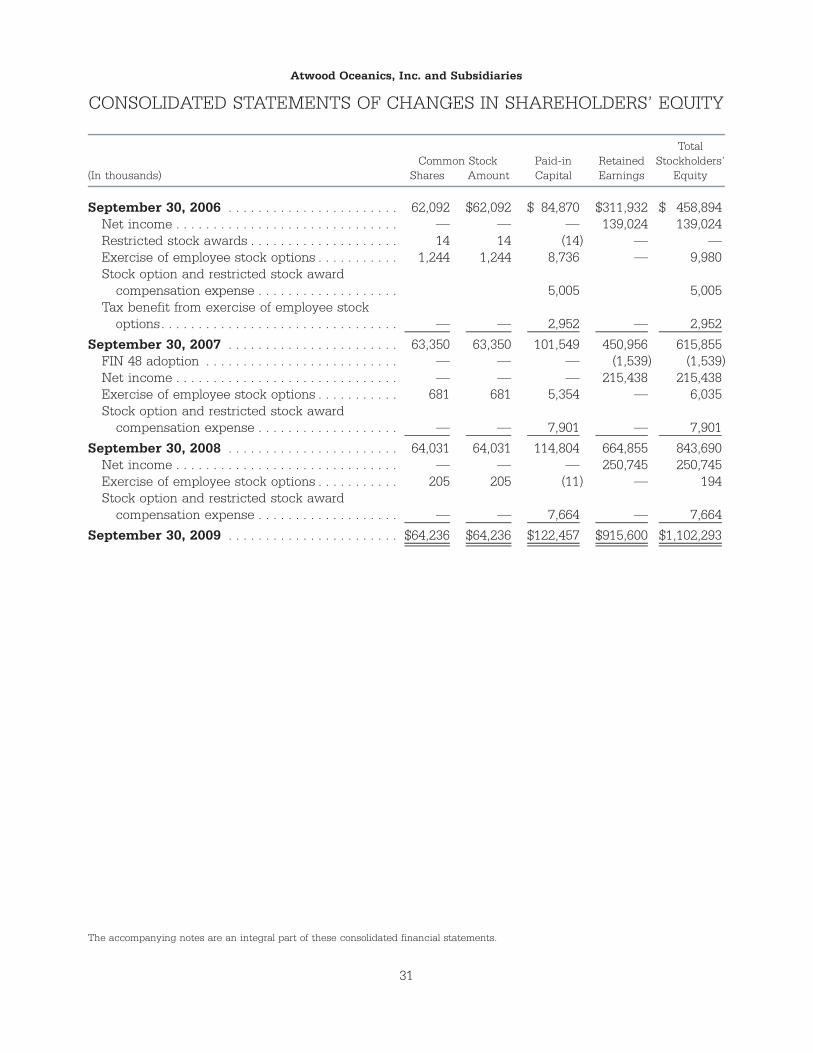
Atwood Oceanics, Inc. and Subsidiaries
CONSOLIDATED STATEMENTS OF CHANGES IN SHAREHOLDERS’ EQUITY
(In thousands) Shares AmountPaid-inCapital
RetainedEarnings
TotalStockholders’
EquityCommon Stock
September 30, 2006 . . . . . . . . . . . . . . . . . . . . . . . 62,092 $62,092 $ 84,870 $311,932 $ 458,894Net income . . . . . . . . . . . . . . . . . . . . . . . . . . . . . . — — — 139,024 139,024Restricted stock awards . . . . . . . . . . . . . . . . . . . . 14 14 (14) — —Exercise of employee stock options . . . . . . . . . . . 1,244 1,244 8,736 — 9,980Stock option and restricted stock award
compensation expense . . . . . . . . . . . . . . . . . . . 5,005 5,005Tax benefit from exercise of employee stock
options. . . . . . . . . . . . . . . . . . . . . . . . . . . . . . . . — — 2,952 — 2,952
September 30, 2007 . . . . . . . . . . . . . . . . . . . . . . . 63,350 63,350 101,549 450,956 615,855FIN 48 adoption . . . . . . . . . . . . . . . . . . . . . . . . . . — — — (1,539) (1,539)Net income . . . . . . . . . . . . . . . . . . . . . . . . . . . . . . — — — 215,438 215,438Exercise of employee stock options . . . . . . . . . . . 681 681 5,354 — 6,035Stock option and restricted stock award
compensation expense . . . . . . . . . . . . . . . . . . . — — 7,901 — 7,901
September 30, 2008 . . . . . . . . . . . . . . . . . . . . . . . 64,031 64,031 114,804 664,855 843,690Net income . . . . . . . . . . . . . . . . . . . . . . . . . . . . . . — — — 250,745 250,745Exercise of employee stock options . . . . . . . . . . . 205 205 (11) — 194Stock option and restricted stock award
compensation expense . . . . . . . . . . . . . . . . . . . — — 7,664 — 7,664
September 30, 2009 . . . . . . . . . . . . . . . . . . . . . . . $64,236 $64,236 $122,457 $915,600 $1,102,293
The accompanying notes are an integral part of these consolidated financial statements.
31
%%TRANSMSG*** Transmitting Job: H68826 PCN: 026000000 ***%%PCMSG|31 |00011|Yes|No|12/23/2009 12:01|0|0|Page is valid, no graphics -- Color: D|
Atwood Oceanics, Inc. and Subsidiaries
NOTES TO CONSOLIDATED FINANCIAL STATEMENTS
NOTE 1 — NATURE OF OPERATIONS
Atwood Oceanics, Inc., together with itssubsidiaries (collectively referred to herein as“we,” “our” or the “Company”), is engaged inoffshore drilling and completion of exploratoryand developmental oil and gas wells and relatedsupport, management and consulting servicesprincipally in international locations. Presently,we own and operate a premium, modern fleet ofnine mobile offshore drilling units. We are alsoconstructing two deepwater units scheduled fordelivery in 2011 and 2012, respectively. Our cur-rent worldwide operations are located in fiveregions of the world — offshore Southeast Asia,offshore Africa, offshore Australia, the Mediterra-nean Sea and the U.S. Gulf of Mexico.
NOTE 2 — SUMMARY OF SIGNIFICANTACCOUNTING POLICIES
Accounting Standards Codification
In June 2009, the Financial Accounting Stan-dards Board (“FASB”) established the “FASBAccounting Standards Codification” (“FASBASC”) as the source of authoritative GAAP recog-nized by the FASB for non-governmental entities.All existing accounting standards have beensuperseded and accounting literature notincluded in the FASB ASC is considered non-authoritative. Subsequent issuances of new stan-dards will be in the form of Accounting Stan-dards Updates (“ASU”) that will be included inthe FASB ASC. Generally, the FASB ASC is notexpected to change GAAP.
Consolidation
The consolidated financial statementsinclude the accounts of Atwood Oceanics, Inc.and all of its domestic and foreign subsidiaries.All significant intercompany accounts and trans-actions have been eliminated in consolidation.
Cash and cash equivalents
Cash and cash equivalents consist of cash inbanks and highly liquid debt instruments, whichmature within three months of the date ofpurchase.
Foreign exchange
The U.S. Dollar is the functional currency forall areas of our operations. Accordingly, monetaryassets and liabilities denominated in foreign cur-rency are converted to U.S. Dollars at the rate ofexchange in effect at the end of the fiscal year,items of income and expense are re-measured ataverage monthly rates, and property and equip-ment and other nonmonetary amounts are re-measured at historical rates. Gains and losses onforeign currency transactions and re-measure-ments are included in contract drilling costs inour consolidated statements of operations. Werecorded foreign exchange losses of $0.5 millionand $0.1 million, during fiscal years 2009 and2008, respectively. We did not record a foreignexchange gain or loss during fiscal year 2007.
Accounts receivable
We record trade accounts receivable at theamount we invoice our customers. Our portfolioof accounts receivable is comprised of majorinternational corporate entities and governmentorganizations with stable payment experience.Included within our accounts receivable atSeptember 30, 2009, and 2008 are unbilled receiv-able balances totaling $4.6 million and $13.3 mil-lion, respectively, that represent amounts forwhich contract drilling services have been per-formed, revenue has been earned based on con-tractual dayrate provisions and for whichcollection is deemed probable. Such unbilledamounts were billed subsequent to their respec-tive fiscal year end. Historically, our uncollectibleaccounts receivable have been immaterial, andtypically, we do not require collateral for ourreceivables. We provide an allowance for uncol-lectible accounts, as necessary, on a specificidentification basis. We had an allowance fordoubtful accounts of $0.1 million, as of bothSeptember 30, 2009, and 2008.
Inventories of material and supplies
Inventories consist of spare parts, materialand supplies held for consumption and are statedprincipally at the lower of average cost or market,
32
%%TRANSMSG*** Transmitting Job: H68826 PCN: 027000000 ***%%PCMSG|32 |00012|Yes|No|12/23/2009 12:01|0|0|Page is valid, no graphics -- Color: D|
net of reserves for excess and obsolete inventoryof $1.6 million and $1.3 million at September 30,2009, and 2008, respectively.
Income taxes
We account for income taxes in accordancewith ASC 740. Under ASC 740, deferred incometaxes are recorded to reflect the tax conse-quences on future years of differences betweenthe tax basis of assets and liabilities and theirfinancial reporting amounts at each year-endgiven the provisions of enacted tax laws in eachrespective jurisdiction. Deferred tax assets arereduced by a valuation allowance when, basedupon management’s estimates, it is more likelythan not that a portion of the deferred tax assetswill not be realized in a future period.
Property and equipment
Property and equipment are recorded at cost.Interest costs related to property under construc-tion are capitalized as a component of construc-tion costs. Interest capitalized during fiscal years2009, 2008 and 2007 was $8.8 million, $2.6 millionand $2.6 million, respectively.
Once rigs and related equipment are placedin service, they are depreciated on the straight-line method over their estimated useful lives,with depreciation discontinued only during theperiod when a drilling unit is out of service whileundergoing a significant upgrade that extends itsuseful life. Our estimated useful lives of our vari-ous classifications of assets are as follows:
Years
Drilling vessels and related equipment. . . . . . . . . . 5-35
Drill pipe . . . . . . . . . . . . . . . . . . . . . . . . . . . . . . . 3
Furniture and other . . . . . . . . . . . . . . . . . . . . . . . . 3-10
Effective March 1, 2008, we extended theremaining depreciable life of the RICHMONDfrom one year to ten years, based upon comple-tion of a life enhancing upgrade, coupled withour intent to continue marketing and operatingthe rig beyond one year as the rig is technicallycapable of working over this revised period.
Effective October 1, 2008, we extended theremaining depreciable life of the SEAHAWK fromone year to five years based upon the length ofits current contract commitment coupled withour intent to continue marketing and operatingthe rig beyond one year as the rig is technicallycapable of working over this revised period.
Maintenance, repairs and minor replace-ments are charged against income as incurred;major replacements and upgrades are capitalizedand depreciated over the remaining useful life ofthe asset as determined upon completion of thework. The cost and related accumulated depreci-ation of assets sold, retired or otherwise disposedare removed from the accounts at the time ofdisposition, and any resulting gain or loss isreflected in the Consolidated Statements of Oper-ations for the applicable period.
Impairment of property and equipment
We periodically evaluate our property andequipment to determine that their net carryingvalue is not in excess of their net realizable value.These evaluations are performed when we havesustained significant declines in utilization anddayrates and recovery is not contemplated in thenear future. We consider a number of factorssuch as estimated future cash flows, appraisalsand current market value analysis in determiningan asset’s fair value. Assets are written down totheir fair value if the carrying amount of the assetis not recoverable and exceeds its fair value.There were no impairments during fiscal yearsended September 30, 2009, 2008 or 2007.
Deferred drydocking costs
We defer the costs of scheduled drydockingand charge such costs to contract drilling expenseover the period to the next scheduled drydocking(normally 30 months). At September 30, 2009, and2008, deferred drydocking costs totaling $1.8 mil-lion and $1.8 million, respectively, were includedin Deferred Costs and Other Assets in the accom-panying Consolidated Balance Sheets.
33
Atwood Oceanics, Inc. and Subsidiaries
NOTES TO CONSOLIDATED FINANCIAL STATEMENTS — (Cont.)
%%TRANSMSG*** Transmitting Job: H68826 PCN: 028000000 ***%%PCMSG|33 |00012|Yes|No|12/23/2009 12:01|0|0|Page is valid, no graphics -- Color: D|
Revenue recognition
We account for drilling and managementcontract revenue in accordance with the term ofthe underlying drilling or management contract.These contracts generally provide that revenue isearned and recognized on a daily basis. Weprovide crewed rigs to customers on a daily rate(i.e. “dayrate”) basis. Dayrate contracts can be fora specified period of time or the time required todrill a specified well or number of wells. Reve-nues from dayrate drilling operations, which areclassified under contract drilling services, are rec-ognized on a per day basis as the workprogresses. In addition, business interruption pro-ceeds are also recognized on a per day basis. SeeNote 4 for discussion of the ATWOOD BEACONincident.
Deferred fees and costs
Lump-sum fees received at commencementof the drilling contract as compensation for thecost of relocating drilling rigs from one majoroperating area to another, equipment andupgrade costs reimbursed by the customer, aswell as receipt of advance billings of dayrates arerecognized as earned on a straight-line methodover the term of the related drilling contract, asare the dayrates associated with such contracts.However, lump-sum fees received upon termina-tion of a drilling contract are recognized asearned during the period termination occurs. Inaddition, we defer the mobilization costs relatingto moving a drilling rig to a new area and cus-tomer requested equipment purchases that willrevert to the customer at the end of the applica-ble drilling contract. We amortize such costs on astraight-line basis over the life of the applicabledrilling contract. Contract revenues and drillingcosts are reported in the Consolidated State-ments of Operations at their gross amounts.
At September 30, 2009, and 2008, deferredfees associated with mobilization, related equip-ment purchases and upgrades, and receipt ofadvance billings of dayrates totaled $39.1 millionand $8.2 million, respectively. At September 30,2009, and 2008, deferred costs associated with
mobilization and related equipment purchasesand upgrades totaled $5.6 million and $0.3 million,respectively. Deferred fees and deferred costs areclassified as current or long-term deferred creditsand deferred costs, respectively, in the accompa-nying Consolidated Balance Sheets based on theexpected term of the applicable drilling contracts.
Share-based compensation
We account for share-based compensation inaccordance with ASC 718. Under ASC 718,share-based compensation cost is measured atthe grant date, based on the calculated fair valueof the award, and is recognized as an expenseover the requisite service period (generally thevesting period of the equity grant). See Note 3 foradditional information regarding share-basedcompensation.
Earnings per common share
Basic and diluted earnings per share havebeen computed in accordance with ASC 260“Earnings per Share”, formerly SFAS No. 128,“Earnings per Share” (EPS). Basic EPS excludesdilution and is computed by dividing net income(loss) by the weighted-average number of com-mon shares outstanding for the period. DilutedEPS reflects the issuance of additional shares inconnection with the assumed conversion of stockoptions. In accordance with ASC 718, we havealso included the impact of pro forma deferredtax assets in calculating the potential windfalland shortfall tax benefits to determine theamount of diluted shares using the treasury stockmethod.
34
Atwood Oceanics, Inc. and Subsidiaries
NOTES TO CONSOLIDATED FINANCIAL STATEMENTS — (Cont.)
%%TRANSMSG*** Transmitting Job: H68826 PCN: 029000000 ***%%PCMSG|34 |00011|Yes|No|12/23/2009 12:01|0|0|Page is valid, no graphics -- Color: D|
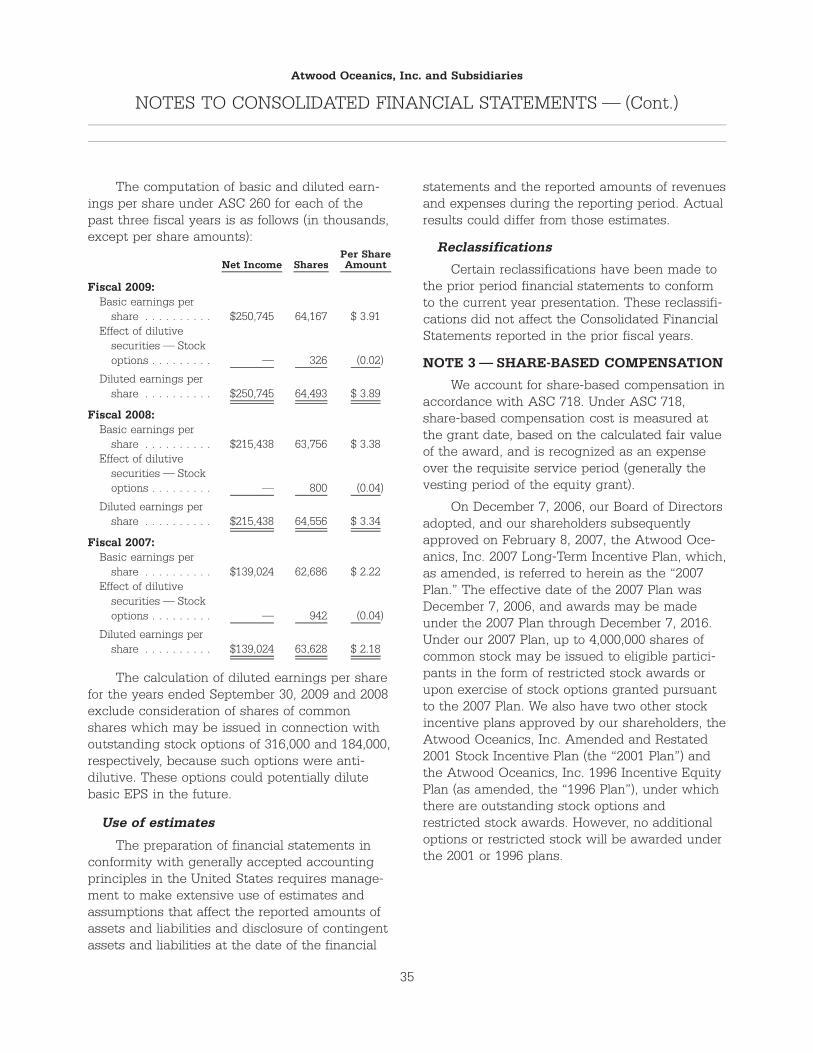
The computation of basic and diluted earn-ings per share under ASC 260 for each of thepast three fiscal years is as follows (in thousands,except per share amounts):
Net Income SharesPer ShareAmount
Fiscal 2009:Basic earnings per
share . . . . . . . . . . $250,745 64,167 $ 3.91Effect of dilutive
securities — Stockoptions . . . . . . . . . — 326 (0.02)
Diluted earnings pershare . . . . . . . . . . $250,745 64,493 $ 3.89
Fiscal 2008:Basic earnings per
share . . . . . . . . . . $215,438 63,756 $ 3.38Effect of dilutive
securities — Stockoptions . . . . . . . . . — 800 (0.04)
Diluted earnings pershare . . . . . . . . . . $215,438 64,556 $ 3.34
Fiscal 2007:Basic earnings per
share . . . . . . . . . . $139,024 62,686 $ 2.22Effect of dilutive
securities — Stockoptions . . . . . . . . . — 942 (0.04)
Diluted earnings pershare . . . . . . . . . . $139,024 63,628 $ 2.18
The calculation of diluted earnings per sharefor the years ended September 30, 2009 and 2008exclude consideration of shares of commonshares which may be issued in connection withoutstanding stock options of 316,000 and 184,000,respectively, because such options were anti-dilutive. These options could potentially dilutebasic EPS in the future.
Use of estimates
The preparation of financial statements inconformity with generally accepted accountingprinciples in the United States requires manage-ment to make extensive use of estimates andassumptions that affect the reported amounts ofassets and liabilities and disclosure of contingentassets and liabilities at the date of the financial
statements and the reported amounts of revenuesand expenses during the reporting period. Actualresults could differ from those estimates.
Reclassifications
Certain reclassifications have been made tothe prior period financial statements to conformto the current year presentation. These reclassifi-cations did not affect the Consolidated FinancialStatements reported in the prior fiscal years.
NOTE 3 — SHARE-BASED COMPENSATION
We account for share-based compensation inaccordance with ASC 718. Under ASC 718,share-based compensation cost is measured atthe grant date, based on the calculated fair valueof the award, and is recognized as an expenseover the requisite service period (generally thevesting period of the equity grant).
On December 7, 2006, our Board of Directorsadopted, and our shareholders subsequentlyapproved on February 8, 2007, the Atwood Oce-anics, Inc. 2007 Long-Term Incentive Plan, which,as amended, is referred to herein as the “2007Plan.” The effective date of the 2007 Plan wasDecember 7, 2006, and awards may be madeunder the 2007 Plan through December 7, 2016.Under our 2007 Plan, up to 4,000,000 shares ofcommon stock may be issued to eligible partici-pants in the form of restricted stock awards orupon exercise of stock options granted pursuantto the 2007 Plan. We also have two other stockincentive plans approved by our shareholders, theAtwood Oceanics, Inc. Amended and Restated2001 Stock Incentive Plan (the “2001 Plan”) andthe Atwood Oceanics, Inc. 1996 Incentive EquityPlan (as amended, the “1996 Plan”), under whichthere are outstanding stock options andrestricted stock awards. However, no additionaloptions or restricted stock will be awarded underthe 2001 or 1996 plans.
35
Atwood Oceanics, Inc. and Subsidiaries
NOTES TO CONSOLIDATED FINANCIAL STATEMENTS — (Cont.)
%%TRANSMSG*** Transmitting Job: H68826 PCN: 030000000 ***%%PCMSG|35 |00011|Yes|No|12/23/2009 12:01|0|0|Page is valid, no graphics -- Color: D|
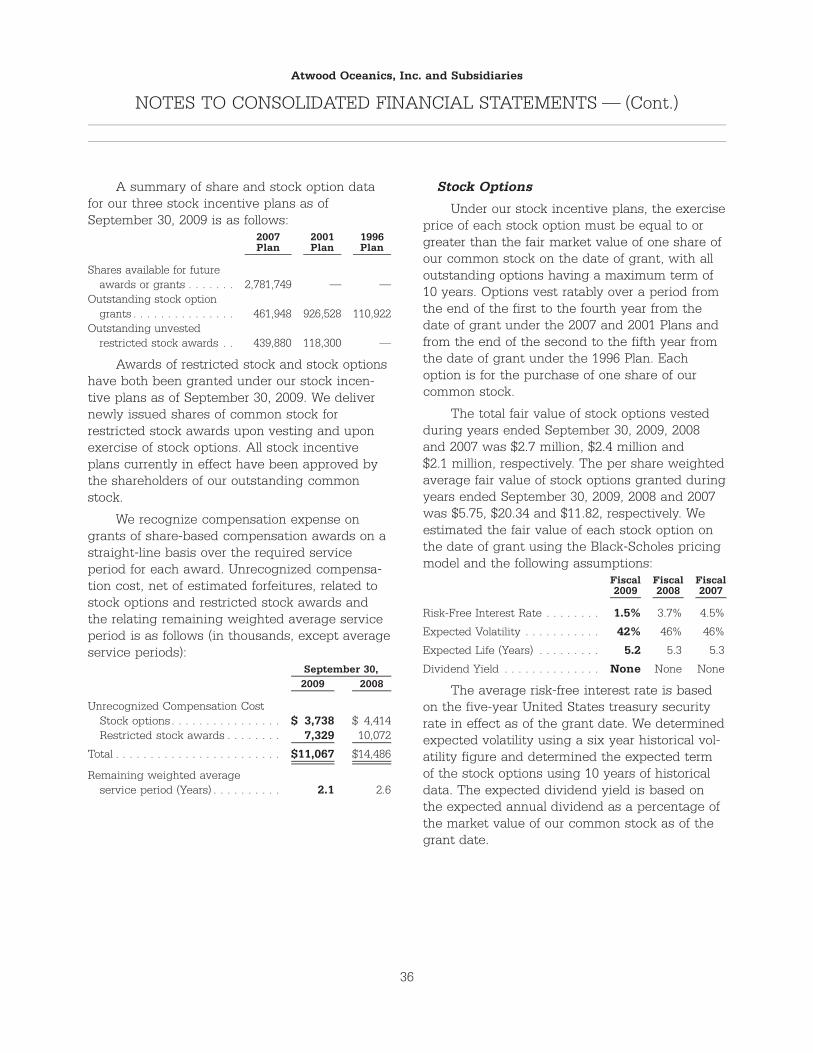
A summary of share and stock option datafor our three stock incentive plans as ofSeptember 30, 2009 is as follows:
2007Plan
2001Plan
1996Plan
Shares available for futureawards or grants . . . . . . . 2,781,749 — —
Outstanding stock optiongrants . . . . . . . . . . . . . . . 461,948 926,528 110,922
Outstanding unvestedrestricted stock awards . . 439,880 118,300 —
Awards of restricted stock and stock optionshave both been granted under our stock incen-tive plans as of September 30, 2009. We delivernewly issued shares of common stock forrestricted stock awards upon vesting and uponexercise of stock options. All stock incentiveplans currently in effect have been approved bythe shareholders of our outstanding commonstock.
We recognize compensation expense ongrants of share-based compensation awards on astraight-line basis over the required serviceperiod for each award. Unrecognized compensa-tion cost, net of estimated forfeitures, related tostock options and restricted stock awards andthe relating remaining weighted average serviceperiod is as follows (in thousands, except averageservice periods):
2009 2008September 30,
Unrecognized Compensation CostStock options . . . . . . . . . . . . . . . . $ 3,738 $ 4,414Restricted stock awards . . . . . . . . 7,329 10,072
Total . . . . . . . . . . . . . . . . . . . . . . . . $11,067 $14,486
Remaining weighted averageservice period (Years) . . . . . . . . . . 2.1 2.6
Stock Options
Under our stock incentive plans, the exerciseprice of each stock option must be equal to orgreater than the fair market value of one share ofour common stock on the date of grant, with alloutstanding options having a maximum term of10 years. Options vest ratably over a period fromthe end of the first to the fourth year from thedate of grant under the 2007 and 2001 Plans andfrom the end of the second to the fifth year fromthe date of grant under the 1996 Plan. Eachoption is for the purchase of one share of ourcommon stock.
The total fair value of stock options vestedduring years ended September 30, 2009, 2008and 2007 was $2.7 million, $2.4 million and$2.1 million, respectively. The per share weightedaverage fair value of stock options granted duringyears ended September 30, 2009, 2008 and 2007was $5.75, $20.34 and $11.82, respectively. Weestimated the fair value of each stock option onthe date of grant using the Black-Scholes pricingmodel and the following assumptions:
Fiscal2009
Fiscal2008
Fiscal2007
Risk-Free Interest Rate . . . . . . . . 1.5% 3.7% 4.5%
Expected Volatility . . . . . . . . . . . 42% 46% 46%
Expected Life (Years) . . . . . . . . . 5.2 5.3 5.3
Dividend Yield . . . . . . . . . . . . . . None None None
The average risk-free interest rate is basedon the five-year United States treasury securityrate in effect as of the grant date. We determinedexpected volatility using a six year historical vol-atility figure and determined the expected termof the stock options using 10 years of historicaldata. The expected dividend yield is based onthe expected annual dividend as a percentage ofthe market value of our common stock as of thegrant date.
36
Atwood Oceanics, Inc. and Subsidiaries
NOTES TO CONSOLIDATED FINANCIAL STATEMENTS — (Cont.)
%%TRANSMSG*** Transmitting Job: H68826 PCN: 031000000 ***%%PCMSG|36 |00011|Yes|No|12/23/2009 12:01|0|0|Page is valid, no graphics -- Color: D|
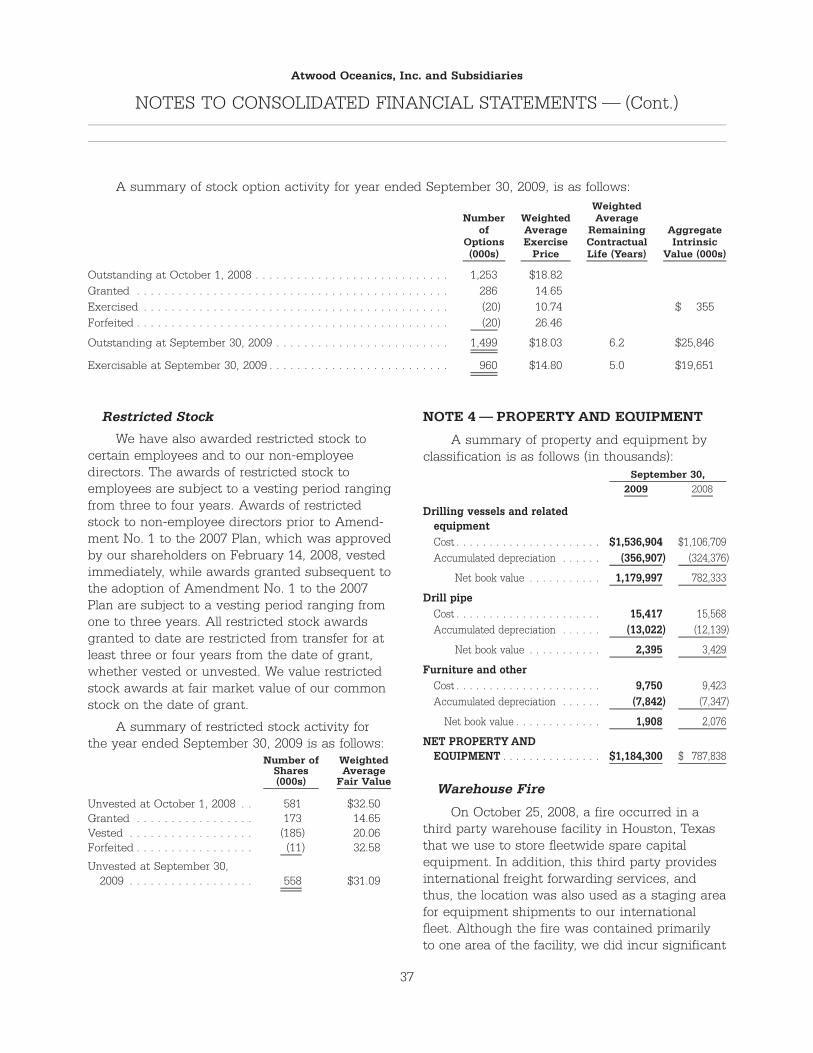
A summary of stock option activity for year ended September 30, 2009, is as follows:
Numberof
Options(000s)
WeightedAverageExercise
Price
WeightedAverage
RemainingContractualLife (Years)
AggregateIntrinsic
Value (000s)
Outstanding at October 1, 2008 . . . . . . . . . . . . . . . . . . . . . . . . . . . . 1,253 $18.82Granted . . . . . . . . . . . . . . . . . . . . . . . . . . . . . . . . . . . . . . . . . . . . . 286 14.65Exercised . . . . . . . . . . . . . . . . . . . . . . . . . . . . . . . . . . . . . . . . . . . . (20) 10.74 $ 355Forfeited . . . . . . . . . . . . . . . . . . . . . . . . . . . . . . . . . . . . . . . . . . . . . (20) 26.46
Outstanding at September 30, 2009 . . . . . . . . . . . . . . . . . . . . . . . . . 1,499 $18.03 6.2 $25,846
Exercisable at September 30, 2009 . . . . . . . . . . . . . . . . . . . . . . . . . . 960 $14.80 5.0 $19,651
Restricted Stock
We have also awarded restricted stock tocertain employees and to our non-employeedirectors. The awards of restricted stock toemployees are subject to a vesting period rangingfrom three to four years. Awards of restrictedstock to non-employee directors prior to Amend-ment No. 1 to the 2007 Plan, which was approvedby our shareholders on February 14, 2008, vestedimmediately, while awards granted subsequent tothe adoption of Amendment No. 1 to the 2007Plan are subject to a vesting period ranging fromone to three years. All restricted stock awardsgranted to date are restricted from transfer for atleast three or four years from the date of grant,whether vested or unvested. We value restrictedstock awards at fair market value of our commonstock on the date of grant.
A summary of restricted stock activity forthe year ended September 30, 2009 is as follows:
Number ofShares(000s)
WeightedAverage
Fair Value
Unvested at October 1, 2008 . . 581 $32.50Granted . . . . . . . . . . . . . . . . . 173 14.65Vested . . . . . . . . . . . . . . . . . . (185) 20.06Forfeited . . . . . . . . . . . . . . . . . (11) 32.58
Unvested at September 30,2009 . . . . . . . . . . . . . . . . . . 558 $31.09
NOTE 4 — PROPERTY AND EQUIPMENT
A summary of property and equipment byclassification is as follows (in thousands):
2009 2008September 30,
Drilling vessels and relatedequipmentCost . . . . . . . . . . . . . . . . . . . . . . $1,536,904 $1,106,709Accumulated depreciation . . . . . . (356,907) (324,376)
Net book value . . . . . . . . . . . 1,179,997 782,333
Drill pipeCost . . . . . . . . . . . . . . . . . . . . . . 15,417 15,568Accumulated depreciation . . . . . . (13,022) (12,139)
Net book value . . . . . . . . . . . 2,395 3,429
Furniture and otherCost . . . . . . . . . . . . . . . . . . . . . . 9,750 9,423Accumulated depreciation . . . . . . (7,842) (7,347)
Net book value . . . . . . . . . . . . . 1,908 2,076
NET PROPERTY ANDEQUIPMENT . . . . . . . . . . . . . . . $1,184,300 $ 787,838
Warehouse Fire
On October 25, 2008, a fire occurred in athird party warehouse facility in Houston, Texasthat we use to store fleetwide spare capitalequipment. In addition, this third party providesinternational freight forwarding services, andthus, the location was also used as a staging areafor equipment shipments to our internationalfleet. Although the fire was contained primarilyto one area of the facility, we did incur significant
37
Atwood Oceanics, Inc. and Subsidiaries
NOTES TO CONSOLIDATED FINANCIAL STATEMENTS — (Cont.)
%%TRANSMSG*** Transmitting Job: H68826 PCN: 032000000 ***%%PCMSG|37 |00016|Yes|No|12/23/2009 12:01|0|0|Page is valid, no graphics -- Color: D|
damage to our fleet spares and other equipmentin-transit. We have insurance to cover the cost ofreplacing and repairing damaged equipment inexcess of a $1,000 deductible.
We continue work with our insurance com-pany to evaluate the fire damage to determine ifequipment can be repaired or must be replacedto ultimately determine a final claim amount. Theprocess is anticipated to last into calendar year2010. However, based on the work to date, esti-mated property losses plus actual costs incurredto inspect and evaluate damaged equipment areapproximately $5.1 million. Thus, as ofSeptember 30, 2009, an insurance receivable hasbeen recorded for our estimated insurance recov-eries in an amount equal to the estimated lossesand actual costs, less $2.6 million of insuranceproceeds already collected.
New Semisubmersible ConstructionProjects
As of September 30, 2009, we had approxi-mately $325 million and $280 million of construc-tion in progress related to the construction of theATWOOD OSPREY, our new conventionallymoored semisubmersible, and our new to-be-named dynamically positioned semisubmersible,respectively.
ATWOOD BEACON
The ATWOOD BEACON incurred damage toall three legs and its derrick while positioning fora well offshore Indonesia in July 2004. The rigand its damaged legs were transported to thebuilder’s shipyard in Singapore for inspectionsand repairs. The rig subsequently went back towork and continued to work through the begin-ning of fiscal year 2007, when we completed theremaining work to repair the rig, and recognizedloss of hire revenue of $2.6 million, which isreflected as business interruption proceeds onthe Consolidated Statement of Operations. As ofSeptember 30, 2007, all reimbursable costsincurred to date and business interruption pro-ceeds earned related to this incident had beenreimbursed by the insurance carrier.
NOTE 5 — LONG-TERM DEBT
A summary of long-term debt is as follows(in thousands):
2009 2008September 30,
2007 credit facility, bearing interest(market adjustable) atapproximately 1.9% and 3.5% perannum at September 30, 2009and September 30, 2008,respectively . . . . . . . . . . . . . . . . $200,000 $170,000
2008 credit facility, bearing interest(market adjustable) atapproximately 2.2% per annumat September 30, 2009 . . . . . . . . 75,000 —
$275,000 $170,000
During October 2007, we entered into acredit agreement with several banks, with Nor-dea Bank Finland plc, New York Branch, asAdministrative Agent for the lenders, as well asLead Arranger and Book Runner (the “2007 CreditAgreement”). The 2007 Credit Agreement pro-vides for a secured 5-year $300 million revolvingloan facility with maturity in October 2012, sub-ject to acceleration upon certain specified eventsof default, including but not limited to: delinquentpayments, bankruptcy filings, breaches of repre-sentation or covenants, material adverse judg-ments, guarantees or security documents not infull effect, non-compliance with the EmployeeRetirement Income Security Act of 1974, defaultsunder other agreements including existing creditagreements, and a change in control. In addition,the 2007 Credit Agreement contains a number oflimitations on our ability to: incur liens; merge,consolidate or sell assets; pay dividends; incuradditional indebtedness; make advances, invest-ments or loans; and transact with affiliates.
Loans under this facility will bear interest atvarying rates ranging from 0.70% to 1.25% overthe Eurodollar Rate, depending upon the ratio ofoutstanding debt to earnings before interest,taxes and depreciation. The credit agreementsupports the issuance, when required, of standbyletters of credit. The collateral for the 2007 Credit
38
Atwood Oceanics, Inc. and Subsidiaries
NOTES TO CONSOLIDATED FINANCIAL STATEMENTS — (Cont.)
%%TRANSMSG*** Transmitting Job: H68826 PCN: 033000000 ***%%PCMSG|38 |00012|Yes|No|12/23/2009 12:01|0|0|Page is valid, no graphics -- Color: D|
Agreement consists primarily of preferred mort-gages on three of our active drilling units (theATWOOD EAGLE, the ATWOOD HUNTER andthe ATWOOD BEACON). Under the 2007 CreditAgreement, we are required to pay a fee rangingfrom 0.225% - 0.375% per annum on the unusedportion of the credit facility and certain otheradministrative costs. As of September 30, 2009,we have $100 million of funds available to borrowunder this credit facility, with standby letters ofcredit in the aggregate amount of approximately$5.0 million outstanding.
During November 2008, we entered into anew credit agreement with several banks withNordea Bank Finland plc, New York Branch asAdministrative Agent for the lenders, as well asLead Arranger and Book Runner (“the 2008 CreditAgreement”). The 2008 Credit Agreement pro-vides for a secured 5-year $280 million reducingrevolving loan facility with maturity in November2013, subject to acceleration upon certain speci-fied events of default, including but not limitedto: delinquent payments, bankruptcy filings,breaches of representation or covenants, materialadverse judgments, guarantees or security docu-ments not in full effect, non-compliance with theEmployee Retirement Income Security Act of1974, defaults under other agreements includingexisting credit agreements, such as our 2007Credit Agreement, and a change in control. Inaddition, the 2008 Credit Agreement contains anumber of limitations on our ability to: incurliens; merge, consolidate or sell assets; pay divi-dends; incur additional indebtedness; makeadvances, investments or loans; and transactwith affiliates.
The 2008 Credit Agreement requires a man-datory quarterly commitment reduction of $7 mil-lion beginning at the earlier of three months afterdelivery of either semisubmersible drilling unitcurrently under construction or December 31,2011. The commitment under this facility may beincreased up to $20 million for a total commit-ment of $300 million. Loans under the 2008 CreditAgreement will bear interest at 1.50% over the
Eurodollar Rate. The collateral for the 2008 CreditAgreement consists primarily of preferred mort-gages on three of our drilling units (the ATWOODFALCON, the ATWOOD SOUTHERN CROSS, andthe ATWOOD AURORA). Under the 2008 CreditAgreement, we are required to pay a fee of 0.75%per annum on the unused portion of the creditfacility and certain other administrative costs. Asof September 30, 2009, we have $205 million offunds available to borrow under this credit facil-ity, with standby letters of credit in the aggregateamount of approximately $0.7 millionoutstanding.
The 2008 Credit Agreement and the 2007Credit Agreement contain various financial cove-nants that, among other things, require the main-tenance of a leverage ratio, not to exceed 5.0 to1.0, an interest expense coverage ratio not to beless than 2.5 to 1.0 and a required level of collat-eral maintenance whereby the aggregateappraised collateral value shall not be less than150% of the total credit facility commitment. Asof September 30, 2009, our leverage ratio was 0.5,our interest expense coverage ratio was 41.0 andour collateral maintenance percentage was inexcess of 150%. We were in compliance with allfinancial covenants under the 2008 Credit Agree-ment and the 2007 Credit Agreement atSeptember 30, 2009 and at all times during theyear ended September 30, 2009. As of Novem-ber 24, 2009, no additional funds have beenborrowed under either the 2007 Credit Agree-ment or the 2008 Credit Agreement subsequentto September 30, 2009.
NOTE 6 — INCOME TAXES
Domestic and foreign income before incometaxes for the three-year period endedSeptember 30, 2009, is as follows (in thousands):
Fiscal2009
Fiscal2008
Fiscal2007
Domestic income (loss) . . . . $ (9,492) $ (6,480) $ 8,788
Foreign income . . . . . . . . . 305,923 251,255 151,171
$296,431 $244,775 $159,959
39
Atwood Oceanics, Inc. and Subsidiaries
NOTES TO CONSOLIDATED FINANCIAL STATEMENTS — (Cont.)
%%TRANSMSG*** Transmitting Job: H68826 PCN: 034000000 ***%%PCMSG|39 |00012|Yes|No|12/23/2009 12:01|0|0|Page is valid, no graphics -- Color: D|
The provision (benefit) for domestic and for-eign taxes on income consists of the following (inthousands):
Fiscal2009
Fiscal2008
Fiscal2007
Current — domestic . . . . $ 160 $ 209 $ 3,432
Deferred — domestic . . . . (4,335) (3,555) (1,921)
Current — foreign . . . . . . 50,052 32,893 19,672
Deferred — foreign . . . . . (191) (210) (248)
$45,686 $29,337 $20,935
The components of the deferred income taxassets (liabilities) as of September 30, 2009 and2008 are as follows (in thousands):
2009 2008September 30,
Deferred tax assets —Net operating loss
carryforwards . . . . . . . . . . . . . . $ 3,197 $ 618Tax credit carryforwards . . . . . . . 730 730Stock option compensation
expense . . . . . . . . . . . . . . . . . . 4,498 3,575Book accruals . . . . . . . . . . . . . . . 2,341 1,412
10,766 6,335
Deferred tax liabilities —Difference in book and tax basis
of equipment . . . . . . . . . . . . . . (16,083) (16,179)
(16,083) (16,179)
Net deferred tax liabilities beforevaluation allowance . . . . . . . . . . . (5,317) (9,844)
Valuation allowance . . . . . . . . . . . . (730) (730)
$ (6,047) $(10,574)
Net current deferred tax assets . . . . $ 35 $ 21Net noncurrent deferred tax
liabilities . . . . . . . . . . . . . . . . . . . (6,082) (10,595)
$ (6,047) $(10,574)
The $3.2 million of net operating loss carry-forward (“NOL’s”) as of September 30, 2009,relates to United States NOL’s which begin toexpire in 2028. Management does not expect thatthe tax credit carryforward of $0.7 million will beutilized to offset future tax obligations before thecredits begin to expire in 2012. Thus, a corre-sponding $0.7 million valuation allowance isrecorded as of September 30, 2009. There has
been no change in the valuation allowance dur-ing the current fiscal year.
Under ASC 718, $16.5 million of UnitedStates NOL’s relates to windfall tax benefits,which will not be realized or recorded until thededuction reduces our United States incometaxes payable. At such time, the amount will berecorded as an increase to paid-in-capital. Weapply the “with-and-without” approach when uti-lizing certain tax attributes whereby windfall taxbenefits are used last to offset taxable income.
We do not record federal income taxes onthe undistributed earnings of our foreign subsid-iaries that we consider to be permanently rein-vested in foreign operations. The cumulativeamount of such undistributed earnings wasapproximately $537 million at September 30,2009. It is not practicable to estimate the amountof any deferred tax liability associated with theundistributed earnings. If these earnings were tobe remitted to us, any United States incometaxes payable would be substantially reduced byforeign tax credits generated by the repatriationof the earnings. Such foreign tax credits totaledapproximately $137 million at September 30,2009.
The differences between the United Statesstatutory and our effective income tax rate are asfollows:
Fiscal2009
Fiscal2008
Fiscal2007
Statutory income tax rate. . . . . . 35% 35% 35%
Resolution of prior period taxitems . . . . . . . . . . . . . . . . . . . (1) — (1)
Decrease in tax rate resultingfrom - Foreign tax ratedifferentials, net of foreign taxcredit utilization . . . . . . . . . . . (19) (23) (21)
Effective income tax rate . . . . . . 15% 12% 13%
We adopted the provision of ASC 740-10-05-5 on October 1, 2007. As a result of the imple-mentation of ASC 740-10-05-5, we recognized anapproximate $1.5 million increase in the long-term liability for uncertain tax positions which
40
Atwood Oceanics, Inc. and Subsidiaries
NOTES TO CONSOLIDATED FINANCIAL STATEMENTS — (Cont.)
%%TRANSMSG*** Transmitting Job: H68826 PCN: 035000000 ***%%PCMSG|40 |00013|Yes|No|12/23/2009 12:01|0|0|Page is valid, no graphics -- Color: D|
was accounted for as a reduction to theOctober 1, 2007, balance of retained earnings.After the adoption of ASC 740-10-05-5, we had$3.7 million of reserves for uncertain tax posi-tions, including estimated accrued interest andpenalties of $1.7 million as of October 1, 2007,which are included as Other Long Term Liabili-ties in the Consolidated Balance Sheet.
We record estimated accrued interest andpenalties related to uncertain tax positions inincome tax expense. At September 30, 2009, wehad $4.9 million of reserves for uncertain taxpositions, including estimated accrued interestand penalties of $0.9 million which are includedin Other Long Term Liabilities in the Consoli-dated Balance Sheet. All $4.9 million of the netuncertain tax liabilities would affect the effectivetax rate if recognized. A summary of activityrelated to the net uncertain tax positions includ-ing penalties and interest for fiscal year 2009 isas follows (in thousands):
Liability for UncertainTax Positions
Balance at October 1, 2008 . . . . . $3,492
Increases based on taxpositions related to priorfiscal years . . . . . . . . . . . . . 1,811
Decreases based on taxpositions related to priorfiscal years . . . . . . . . . . . . . (95)
Increases based on taxpositions related to currentfiscal year . . . . . . . . . . . . . . 671
Decreases based on lapses ofapplicable statues oflimitation. . . . . . . . . . . . . . . (932)
Balance at September 30, 2009 . . $4,947
Our United States tax returns for fiscal year2006 and subsequent years remain subject toexamination by tax authorities. As we conductbusiness globally, we have various tax yearsremaining open to examination in our interna-tional tax jurisdictions. We do not anticipate thatany tax contingencies resolved during the next12 months will have a material impact on our
consolidated financial position, results of opera-tions or cash flows.
As a result of working in foreign jurisdic-tions, we earned a high level of operating incomein certain nontaxable and deemed profit tax juris-dictions, which significantly reduced our effec-tive tax rate for fiscal years 2009, 2008 and 2007when compared to the United States statutoryrate. There were no significant transactions thatmaterially impacted our effective tax for fiscalyears 2009, 2008 or 2007.
During July 2007, we were notified by theMalaysian tax authorities regarding a potentialproposed adjustment relating to fiscal years 2000to 2003. Although we believe we are in compli-ance with applicable rules and regulations, wehave evaluated the merit of the assertions by theMalaysian tax authorities and are currently vigor-ously contesting these assertions. While we can-not predict or provide assurance as to the finaloutcome of these allegations, we do not expectthem to have a material adverse effect on ourconsolidated financial position, results of opera-tions or cash flows. As of September 30, 2009,there has not been any change in the status ofthis claim.
NOTE 7 — CAPITAL STOCK
Preferred Stock
In 1975, 1,000,000 shares of preferred stockwith no par value were authorized. In October2002, we designated Series A Junior ParticipatingPreferred Stock. No preferred shares have beenissued.
Common Stock
On June 11, 2008, our board of directorsdeclared a two-for-one stock split of our commonstock effected in the form of a 100% commonstock dividend. All shareholders of record at theclose of business on June 27, 2008 (the “RecordDate”), were entitled to receive on the distribu-tion date, July 11, 2008 (the “Distribution Date”),one additional share of common stock for eachshare held on the Record Date. The additional
41
Atwood Oceanics, Inc. and Subsidiaries
NOTES TO CONSOLIDATED FINANCIAL STATEMENTS — (Cont.)
%%TRANSMSG*** Transmitting Job: H68826 PCN: 036000000 ***%%PCMSG|41 |00010|Yes|No|12/23/2009 12:01|0|0|Page is valid, no graphics -- Color: D|
shares of common stock were distributed in theform of a 100% common stock dividend on theDistribution Date. All share and per shareamounts in the accompanying consolidatedfinancial statements and related notes have beenadjusted to reflect the stock split for all periodspresented.
Rights Agreement
In September 2002, we authorized anddeclared a dividend of one Right (as defined inRights Agreement effective October 18, 2002,which governs the Rights) for each outstandingshare of common stock as of November 5, 2002,subject to lender approval and consent, whichwas obtained. One Right will also be associatedwith each share of common stock that becomesoutstanding after November 5, 2002, but beforethe earliest of the Distribution Date, the Redemp-tion Date and the Final Expiration Date (each asdefined in Rights Agreement). The Rights are notexercisable until a person or group of affiliated orassociated persons begin to acquire or acquiresbeneficial ownership of 15 percent or more of ouroutstanding common stock. This provision doesnot apply to shareholders already holding 15 per-cent or more of our outstanding common stockas of November 5, 2002, until they acquire anadditional 5 percent.
In connection with our 2008 stock split, andin accordance with the Rights Agreement, wedecreased from one two-thousandth to one four-thousandth of a share the number of shares ofour Series A Junior Participating Preferred Stock,no par value, purchasable at a price of $150 uponthe exercise of each Right, when exercisable.The redemption price of the Rights was alsodecreased from $0.005 to $0.0025 in connectionwith the stock split. The Rights are subject tofurther adjustment for certain future eventsincluding any future stock splits. The Rights willexpire on November 5, 2012. At September 30,2009, 500,000 preferred shares have beenreserved for issuance in the event that Rights areexercised.
NOTE 8 — RETIREMENT PLANS
We have two contributory retirement plans(the “Plans”) under which qualified participantsmay make contributions, which together with ourcontributions, can be up to 100% of their com-pensation, as defined, to a maximum of $49,000.After one month of service, an employee canelect to become a participant in a Plan. Partici-pants must contribute from 1 to 5 percent of theirearnings as a required contribution (“the basiccontribution”). We make contributions to thePlans equal to twice the basic contributions. Ourcontributions vest 100% to each participant afterthree years of service with us including anyperiod of ineligibility mandated by the Plans. If aparticipant terminates employment beforebecoming fully vested, the unvested portion iscredited to our account and can be used only tooffset our future contribution requirements. Dur-ing fiscal years 2009, 2008 and 2007, no forfei-tures were utilized to reduce our cashcontribution requirements. In fiscal years 2009,2008 and 2007, our actual cash contributionstotaled approximately $4.9 million, $4.3 millionand $3.5 million, respectively. As of September 30,2009, there were approximately $0.3 million ofcontribution forfeitures, which can be utilized toreduce our future cash contributionrequirements.
NOTE 9 — FAIR VALUE OF FINANCIALINSTRUMENTS
On October 1, 2008, we adopted, withoutany impact to our financial position, operatingresults or cash flows, the provisions of ASC 820,for our financial assets and liabilities with respectto which we have recognized or disclosed at fairvalue on a recurring basis. At September 30,2009, the carrying amounts of our cash and cashequivalents, receivables and payables approxi-mated their fair values due to the short maturityof such financial instruments. The carryingamount of our floating-rate debt approximated itsfair value at September 30, 2009, as such instru-ments bear short-term, market-based interestrates.
42
Atwood Oceanics, Inc. and Subsidiaries
NOTES TO CONSOLIDATED FINANCIAL STATEMENTS — (Cont.)
%%TRANSMSG*** Transmitting Job: H68826 PCN: 037000000 ***%%PCMSG|42 |00012|Yes|No|12/23/2009 12:01|0|0|Page is valid, no graphics -- Color: D|
NOTE 10 — CONCENTRATION OF MARKETAND CREDIT RISK
All of our customers are in the oil and gasoffshore exploration and production industry. Thisindustry concentration has the potential toimpact our overall exposure to market and creditrisks, either positively or negatively, in that ourcustomers could be affected by similar changesin economic, industry or other conditions. How-ever, we believe that the credit risk posed by thisindustry concentration is offset by the creditwor-thiness of our customer base.
Despite the recent decline in the price of oiland natural gas and the global financial crisis, webelieve long-term outlook for the worldwide off-shore drilling industry remains positive, espe-cially for deepwater drilling. Although we do notanticipate any issues in the near-term resultingfrom the current crisis, further financial marketdeterioration may have a negative impact on ourbusiness and financial condition. The crisis hascreated significant reductions in available capitaland liquidity from banks and other providers ofcredit, which may adversely affect our customers’and lenders’ ability to fulfill their obligations tous. In addition, continued deterioration in theglobal economy could result in reduced demandfor crude oil and natural gas, exploration andproduction activity and demand for offshore drill-ing services which could lead to declining day-rates and a decrease of new contract activity.
Revenues from significant customers fromthe prior three fiscal years are as follows (inthousands):
Fiscal2009
Fiscal2008
Fiscal2007
Noble Energy Mediterranean, Ltd. . . . . $149,603 $ — $ —
Woodside Energy Ltd. . . . . . . . . . . . . 114,637 37,542 68,032
Sarawak Shell Bhd. . . . . . . . . . . . . . . 81,538 78,988 50,502
Chevron Overseas Petroleum . . . . . . . . 39,720 56,712 38,272
ENI Spa AGIP Exploration & ProductionDivision . . . . . . . . . . . . . . . . . . . . — 83,308 445
Petronas Carigali Sdn Bhd . . . . . . . . . . — 60,182 1,713
BHP Billiton Petoleum PTY . . . . . . . . . — 34,431 53,410
NOTE 11 — COMMITMENTS ANDCONTINGENCIES
Operating Leases
Future minimum lease payments for operat-ing leases for fiscal years ending September 30are as follows (in thousands):
2010 . . . . . . . . . . . . . . . . . . . 1,2712011 . . . . . . . . . . . . . . . . . . . 1,0982012 . . . . . . . . . . . . . . . . . . . 1,0222013 . . . . . . . . . . . . . . . . . . . 1,0192014 . . . . . . . . . . . . . . . . . . . 1,019
Total rent expense under operating leaseswas approximately $4.1 million, $4.8 million and$3.6 million for fiscal years ended September 30,2009, 2008, and 2007, respectively.
Litigation
We are party to a number of lawsuits whichare ordinary, routine litigation incidental to ourbusiness, the outcome of which, individually, orin the aggregate, is not expected to have a mate-rial adverse effect on our financial position,results of operations or cash flows.
Other Matters
The ATWOOD BEACON operated in Indiafrom early December 2006 to the end of July2009. A service tax was enacted in 2004 onrevenues derived from seismic and explorationactivities. This service tax law was subsequentlyamended in June 2007 and again in May 2008 tostate that revenues derived from mining servicesand drilling services were specifically subject tothis service tax. The ATWOOD BEACON contractterms with our customer in India provided thatany liability incurred by us related to any taxespursuant to laws not in effect at the time thecontract was executed in 2005 was to be reim-bursed by our customer. In our opinion, which issupported by our legal and tax advisors, any suchservice taxes assessed by the Indian tax authori-ties under either provision of the 2007 or 2008amendments would be the obligation of our cus-tomer. Our customer is disputing this obligationon the basis, in their opinion, that revenues
43
Atwood Oceanics, Inc. and Subsidiaries
NOTES TO CONSOLIDATED FINANCIAL STATEMENTS — (Cont.)
%%TRANSMSG*** Transmitting Job: H68826 PCN: 038000000 ***%%PCMSG|43 |00012|Yes|No|12/23/2009 12:01|0|0|Page is valid, no graphics -- Color: D|
derived from drilling services were taxable underthe initial 2004 law, which, based on our contractterms, would provide that the service tax is ourobligation.
After reviewing the status of the drillingservice we provided to our customer, the Indiantax authorities assessed service tax obligationson revenues derived from the ATWOOD BEACONcommencing on June 1, 2007. The relevant Indiantax authority issued an extensive written rulingon this matter setting forth the proper applicationof the June 1, 2007 service tax regulation, con-firming, in our opinion, our position on this mat-ter that the drilling services were not covered bythe original 2004 service tax law. Therefore, asthe Indian tax authority’s service tax assessmentswere made under the provision of the 2007amendment to the service tax law and not pursu-ant to a law in effect at the time we executedthe ATWOOD BEACON contract, we believe ourcustomer is obligated under the terms of ourcontract to reimburse us for all service taxpayments.
As of September 30, 2009, we have paid tothe Indian government $9.3 million in servicetaxes and have accrued $2.5 million of additionalservice tax obligations in accrued liabilities. Wehave recorded a corresponding $14.3 million long-term other receivable due from our customer forsuch service taxes which also includes anapproximate $2.5 million anticipated withholdingof accounts receivable by our customer due totheir opinion that they will be assessed additionalservice taxes based on the 2004 law. We plan topursue all options available to us to collect thisother receivable from our customer for such ser-vice taxes, including amounts of accounts receiv-able withheld.
NOTE 12 — RECENTLY ISSUED ACCOUNTINGPRONOUNCEMENTS
In June 2009, the FASB issued guidancewhich revises how an entity evaluates variableinterest entities. This guidance is effective forannual and interim reporting periods beginningafter November 15, 2009, with earlier application
prohibited. We do not expect our adoption of thisnew accounting pronouncement will have amaterial impact on our financial condition orresults of operations.
In May 2009, the FASB issued ASC 855,“Subsequent Events”, formerly SFAS No. 165,“Subsequent Events”. ASC 855 establishes gen-eral standards of accounting for, and disclosure ofevents that occur, after the balance sheet datebut before financial statements are issued or areavailable to be issued. ASC 855 is effective forinterim or annual periods ending after June 15,2009. We adopted ASC 855 during the quarterended June 30, 2009, with no significant changesto subsequent events that we are required torecognize or disclose in our financial statements.We have performed an evaluation of subsequentevents through November 25, 2009, which is thedate the financial statements were issued.
In April 2009, the FASB issued ASC 820-10-65-4, “Determining Fair Value When the Volumeand Level of Activity for the Asset or LiabilityHave Significantly Decreased and IdentifyingTransactions That Are Not Orderly”, formerly StaffPosition FAS 157-4, “Determining Fair ValueWhen the Volume and Level of Activity for theAsset or Liability Have Significantly Decreasedand Identifying Transactions That Are NotOrderly”. ASC 820-10-65-4 provides additionalguidance for estimating fair value when the vol-ume and level of activity for the asset or liabilityhave significantly decreased. ASC 820-10-65-4also includes guidance on identifying circum-stances that indicate a transaction is not orderly.ASC 820-10-65-4 is effective for interim andannual periods ending after June 15, 2009, andshall be applied prospectively. We adopted ASC820-10-65-4 during the quarter ended June 30,2009, with no material impact to our financialposition, operating results or cash flows.
Also in April 2009, the FASB issued ASC825-10-50-28, “Required Disclosures as of EachDate for Which an Interim or Annual Statementof Financial Position Is Presented”, formerly StaffPosition FAS 107-1 and APB 28-1 “Interim
44
Atwood Oceanics, Inc. and Subsidiaries
NOTES TO CONSOLIDATED FINANCIAL STATEMENTS — (Cont.)
%%TRANSMSG*** Transmitting Job: H68826 PCN: 039000000 ***%%PCMSG|44 |00012|Yes|No|12/23/2009 12:01|0|0|Page is valid, no graphics -- Color: D|
Disclosures about Fair Value of Financial Instru-ments”. ASC 825-10-50-28 requires disclosuresabout the fair value of financial instruments forinterim reporting periods of publicly traded com-panies in addition to annual financial statements.ASC 825-10-50-28 is effective for interim periodsending after June 15, 2009. We adopted ASC825-10-50-28 during the quarter ended June 30,2009, with no significant changes to the disclo-sures in our financial statements.
In December 2007, the FASB issued ASC805, “Business Combinations”, formerlySFAS No. 141(R), “Business Combinations(revised 2007)”. ASC 805 retains the fundamentalrequirement that the acquisition method be usedfor all business combinations and expands thesame method of accounting to all transactionsand other events in which one entity obtainscontrol over one of more other businesses orassets at the acquisition date and in subsequentperiods. ASC 805 requires measurement at theacquisition date of the fair value of assetsacquired, liabilities assumed and noncontrollinginterest. Additionally, ASC 805 requires thatacquisition-related costs, including restructuringcosts, be recognized separately from the acquisi-tion. ASC 805 applies prospectively to businesscombinations for fiscal years beginning afterDecember 15, 2008. ASC 805 has not had animpact on our consolidated financial position,results of operations and cash flows. The futureimpact of ASC 805 on us will depend on thenature and extent of any future acquisitions.
Also in December 2007, the FASB issuedASC 810-10-65, “Transition Related to FASBStatement No. 160, Noncontrolling Interests inConsolidated Financial Statements — an amend-ment of ARB No. 51”, formerly SFAS No. 160,“Noncontrolling Interests in Consolidated Finan-cial Statements — an amendment of ARBNo. 51”. ASC 810-10-65 establishes the account-ing and reporting standards for a noncontrollinginterest in a subsidiary and for the deconsolida-tion of a subsidiary. ASC 810-10-65 clarifies thata noncontrolling interest in a subsidiary is an
ownership interest in the consolidated entity thatshould be reported as equity in the consolidatedfinancial statements. ASC 810-10-65 requires ret-roactive adoption of the presentation and disclo-sure requirements for existing minority interestsand applies prospectively to business combina-tions for fiscal years beginning after December 15,2008. We are currently analyzing the provisions ofASC 810-10-65 to determine how it will affectaccounting policies and procedures, but we havenot yet made a determination of the impact theadoption will have on our consolidated financialposition, results of operations and cash flows.
In February 2007, the FASB issued ASC825-10-25, “The Fair Value Option”, formerlySFAS No. 159, “The Fair Value Option for Finan-cial Assets and Financial Liabilities”. ASC825-10-25 provides companies with an option toreport selected financial assets and liabilities atfair value and establishes presentation and dis-closure requirements to facilitate comparisonsbetween companies that choose different mea-surement attributes for similar types of assetsand liabilities. GAAP has required different mea-surement attributes for different assets and liabil-ities that can create artificial volatility inearnings. The objective of ASC 825-10-25 is tohelp mitigate this type of volatility in the earn-ings by enabling companies to report relatedassets and liabilities at fair value, which wouldlikely reduce the need for companies to complywith complex hedge accounting provisions. ASC825-10-25 is effective for fiscal years beginningafter November 15, 2007. ASC 825-10-25 has nothad a material impact on our consolidated finan-cial position, results of operations and cash flows.
In September 2005, the FASB issued ASC820, “Fair Value Measurements and Disclosure”,formerly SFAS No. 157, “Fair Value Measure-ments”. ASC 820 defines fair value, establishesmethods used to measure fair value and expandsdisclosure requirements about fair value measure-ments. ASC 820 is effective for financial state-ments issued for fiscal years beginning afterNovember 15, 2007, and interim periods within
45
Atwood Oceanics, Inc. and Subsidiaries
NOTES TO CONSOLIDATED FINANCIAL STATEMENTS — (Cont.)
%%TRANSMSG*** Transmitting Job: H68826 PCN: 040000000 ***%%PCMSG|45 |00012|Yes|No|12/23/2009 12:01|0|0|Page is valid, no graphics -- Color: D|
those fiscal periods. In February 2008, the FASBissued ASC 820-10-65, “Transition and OpenEffective Date Information”, formerly FASB StaffPosition No. FAS 157-2, “Effective Date of FASBStatement No. 157”. ASC 820-10-65 delays theeffective date of ASC 820 by one year for allnonfinancial assets and nonfinancial liabilities,except those that are recognized or disclosed atfair value in the financial statements on a recur-ring basis (at least annually). In October 2008, theFASB issued ASC 820-10-35-51A through 35-51B,formerly FSP FAS 157-3, “Determining the FairValue of a Financial Asset When the Market forThat Asset Is Not Active”. ASC 820-10-35-51Athrough 35-51B clarifies the application of ASC820 in a market that is not active and providesan example to illustrate key considerations indetermining the fair value of a financial assetwhen the market for that financial asset is notactive. ASC 820-10-35-51A through 35-51B waseffective upon issuance. We adopted ASC 820,ASC 820-10-65 and ASC 820-10-35-51A through35-51B, during fiscal year 2009 with no material
impact to our financial position, operating resultsor cash flows.
NOTE 13 — OPERATIONS BY GEOGRAPHICAREAS
We report our offshore contract drilling oper-ation as a single reportable segment: OffshoreContract Drilling Services. The consolidation ofour offshore contract drilling operations into onereportable segment is attributable to how wemanage our business, and the fact that all of ourdrilling fleet is dependent upon the worldwide oilindustry. The mobile offshore drilling units andrelated equipment comprising our offshore rigfleet operate in a single, global market for con-tract drilling services and are often redeployedglobally due to changing demands of our custom-ers, which consist largely of major non-U.S. oiland gas exploration companies throughout theworld. Our offshore contract drilling services seg-ment conducts offshore contract drilling opera-tions in Africa, Australia, Southeast Asia andIndia, the Mediterranean and Black Sea and theU.S. Gulf of Mexico.
46
Atwood Oceanics, Inc. and Subsidiaries
NOTES TO CONSOLIDATED FINANCIAL STATEMENTS — (Cont.)
%%TRANSMSG*** Transmitting Job: H68826 PCN: 041000000 ***%%PCMSG|46 |00011|Yes|No|12/23/2009 12:01|0|0|Page is valid, no graphics -- Color: D|
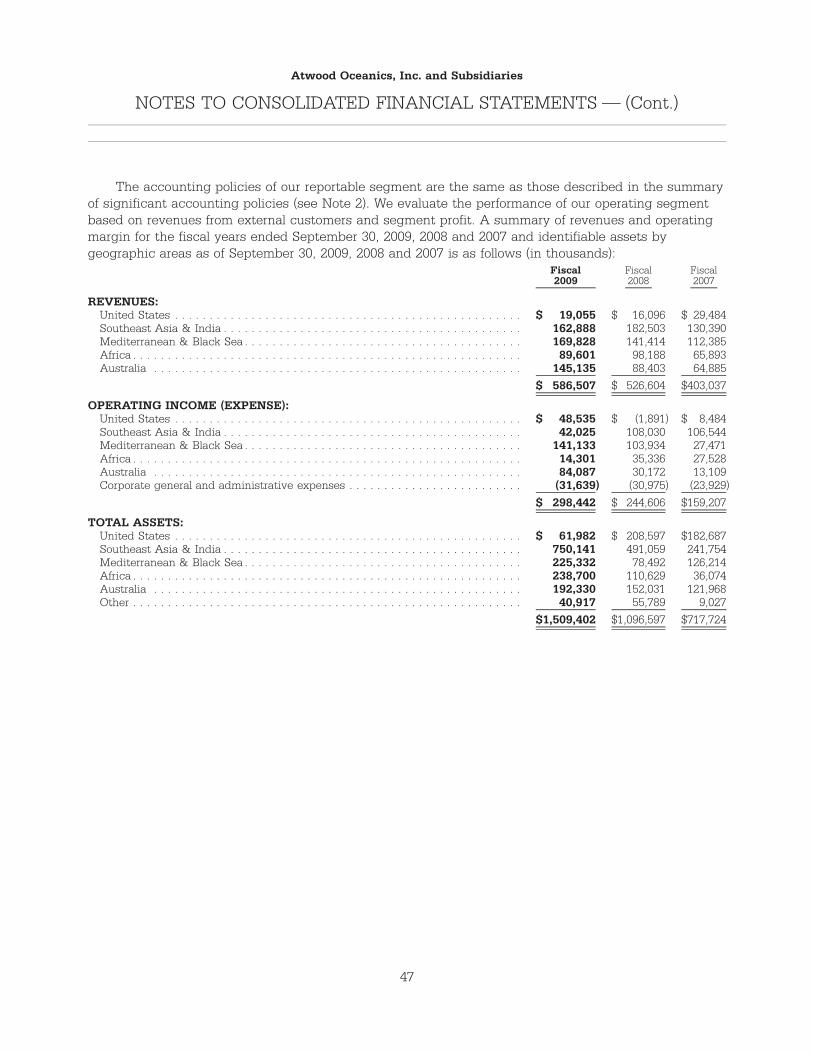
The accounting policies of our reportable segment are the same as those described in the summaryof significant accounting policies (see Note 2). We evaluate the performance of our operating segmentbased on revenues from external customers and segment profit. A summary of revenues and operatingmargin for the fiscal years ended September 30, 2009, 2008 and 2007 and identifiable assets bygeographic areas as of September 30, 2009, 2008 and 2007 is as follows (in thousands):
Fiscal2009
Fiscal2008
Fiscal2007
REVENUES:United States . . . . . . . . . . . . . . . . . . . . . . . . . . . . . . . . . . . . . . . . . . . . . . . . . . $ 19,055 $ 16,096 $ 29,484Southeast Asia & India . . . . . . . . . . . . . . . . . . . . . . . . . . . . . . . . . . . . . . . . . . . 162,888 182,503 130,390Mediterranean & Black Sea . . . . . . . . . . . . . . . . . . . . . . . . . . . . . . . . . . . . . . . . 169,828 141,414 112,385Africa . . . . . . . . . . . . . . . . . . . . . . . . . . . . . . . . . . . . . . . . . . . . . . . . . . . . . . . . 89,601 98,188 65,893Australia . . . . . . . . . . . . . . . . . . . . . . . . . . . . . . . . . . . . . . . . . . . . . . . . . . . . . 145,135 88,403 64,885
$ 586,507 $ 526,604 $403,037
OPERATING INCOME (EXPENSE):United States . . . . . . . . . . . . . . . . . . . . . . . . . . . . . . . . . . . . . . . . . . . . . . . . . . $ 48,535 $ (1,891) $ 8,484Southeast Asia & India . . . . . . . . . . . . . . . . . . . . . . . . . . . . . . . . . . . . . . . . . . . 42,025 108,030 106,544Mediterranean & Black Sea . . . . . . . . . . . . . . . . . . . . . . . . . . . . . . . . . . . . . . . . 141,133 103,934 27,471Africa . . . . . . . . . . . . . . . . . . . . . . . . . . . . . . . . . . . . . . . . . . . . . . . . . . . . . . . . 14,301 35,336 27,528Australia . . . . . . . . . . . . . . . . . . . . . . . . . . . . . . . . . . . . . . . . . . . . . . . . . . . . . 84,087 30,172 13,109Corporate general and administrative expenses . . . . . . . . . . . . . . . . . . . . . . . . . (31,639) (30,975) (23,929)
$ 298,442 $ 244,606 $159,207
TOTAL ASSETS:United States . . . . . . . . . . . . . . . . . . . . . . . . . . . . . . . . . . . . . . . . . . . . . . . . . . $ 61,982 $ 208,597 $182,687Southeast Asia & India . . . . . . . . . . . . . . . . . . . . . . . . . . . . . . . . . . . . . . . . . . . 750,141 491,059 241,754Mediterranean & Black Sea . . . . . . . . . . . . . . . . . . . . . . . . . . . . . . . . . . . . . . . . 225,332 78,492 126,214Africa . . . . . . . . . . . . . . . . . . . . . . . . . . . . . . . . . . . . . . . . . . . . . . . . . . . . . . . . 238,700 110,629 36,074Australia . . . . . . . . . . . . . . . . . . . . . . . . . . . . . . . . . . . . . . . . . . . . . . . . . . . . . 192,330 152,031 121,968Other . . . . . . . . . . . . . . . . . . . . . . . . . . . . . . . . . . . . . . . . . . . . . . . . . . . . . . . . 40,917 55,789 9,027
$1,509,402 $1,096,597 $717,724
47
Atwood Oceanics, Inc. and Subsidiaries
NOTES TO CONSOLIDATED FINANCIAL STATEMENTS — (Cont.)
%%TRANSMSG*** Transmitting Job: H68826 PCN: 042000000 ***%%PCMSG|47 |00011|Yes|No|12/23/2009 12:01|0|0|Page is valid, no graphics -- Color: D|
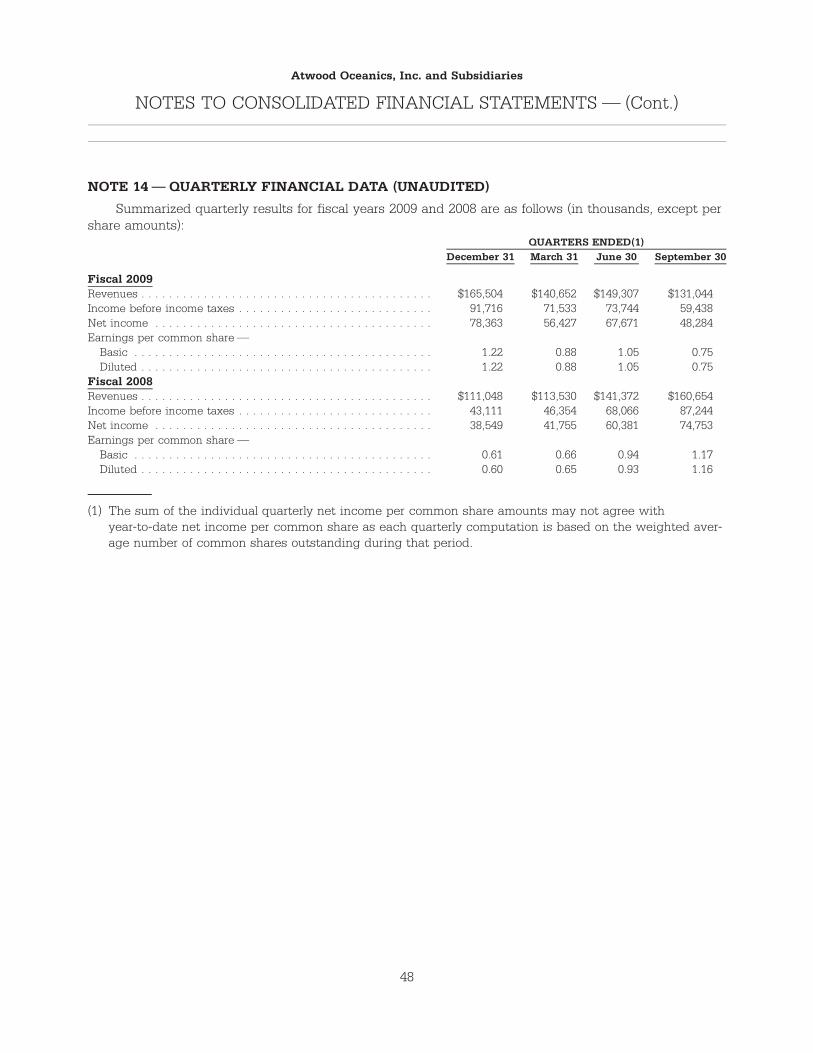
NOTE 14 — QUARTERLY FINANCIAL DATA (UNAUDITED)
Summarized quarterly results for fiscal years 2009 and 2008 are as follows (in thousands, except pershare amounts):
December 31 March 31 June 30 September 30QUARTERS ENDED(1)
Fiscal 2009Revenues . . . . . . . . . . . . . . . . . . . . . . . . . . . . . . . . . . . . . . . . . . $165,504 $140,652 $149,307 $131,044Income before income taxes . . . . . . . . . . . . . . . . . . . . . . . . . . . . 91,716 71,533 73,744 59,438Net income . . . . . . . . . . . . . . . . . . . . . . . . . . . . . . . . . . . . . . . . 78,363 56,427 67,671 48,284Earnings per common share —
Basic . . . . . . . . . . . . . . . . . . . . . . . . . . . . . . . . . . . . . . . . . . . 1.22 0.88 1.05 0.75Diluted . . . . . . . . . . . . . . . . . . . . . . . . . . . . . . . . . . . . . . . . . . 1.22 0.88 1.05 0.75
Fiscal 2008Revenues . . . . . . . . . . . . . . . . . . . . . . . . . . . . . . . . . . . . . . . . . . $111,048 $113,530 $141,372 $160,654Income before income taxes . . . . . . . . . . . . . . . . . . . . . . . . . . . . 43,111 46,354 68,066 87,244Net income . . . . . . . . . . . . . . . . . . . . . . . . . . . . . . . . . . . . . . . . 38,549 41,755 60,381 74,753Earnings per common share —
Basic . . . . . . . . . . . . . . . . . . . . . . . . . . . . . . . . . . . . . . . . . . . 0.61 0.66 0.94 1.17Diluted . . . . . . . . . . . . . . . . . . . . . . . . . . . . . . . . . . . . . . . . . . 0.60 0.65 0.93 1.16
(1) The sum of the individual quarterly net income per common share amounts may not agree withyear-to-date net income per common share as each quarterly computation is based on the weighted aver-age number of common shares outstanding during that period.
48
Atwood Oceanics, Inc. and Subsidiaries
NOTES TO CONSOLIDATED FINANCIAL STATEMENTS — (Cont.)
%%TRANSMSG*** Transmitting Job: H68826 PCN: 043000000 ***%%PCMSG|48 |00011|Yes|No|12/23/2009 12:01|0|0|Page is valid, no graphics -- Color: D|
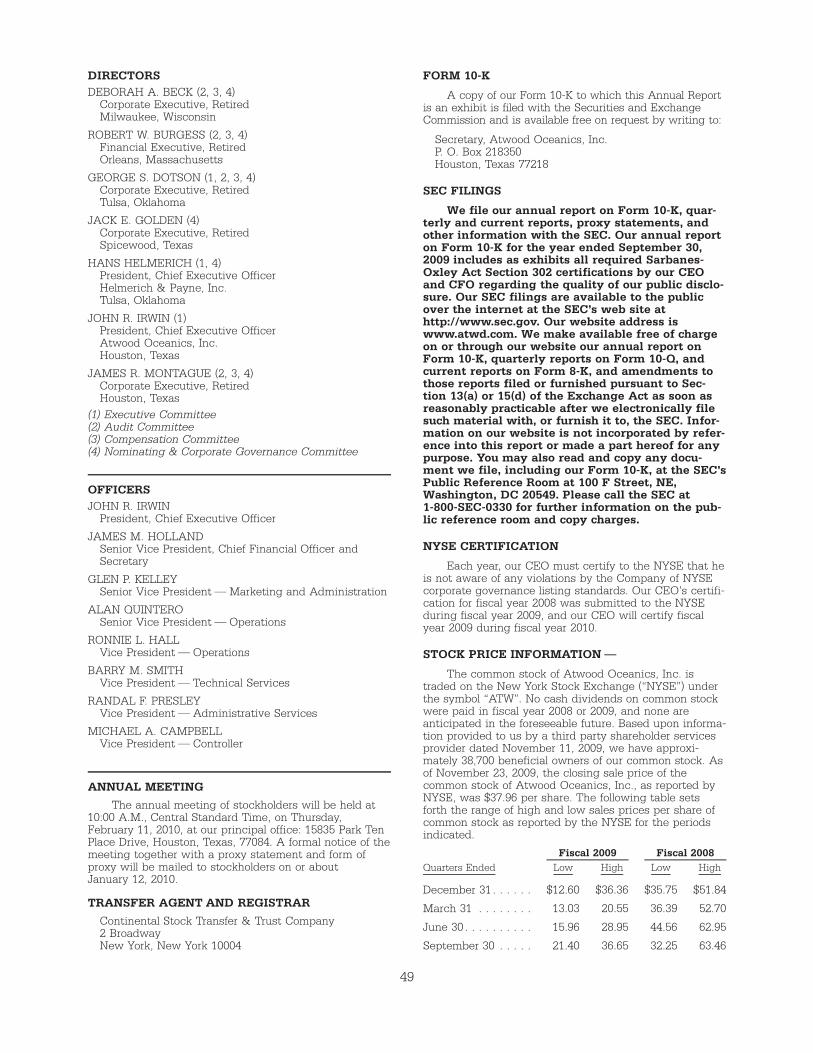
DIRECTORSDEBORAH A. BECK (2, 3, 4)
Corporate Executive, RetiredMilwaukee, Wisconsin
ROBERT W. BURGESS (2, 3, 4)Financial Executive, RetiredOrleans, Massachusetts
GEORGE S. DOTSON (1, 2, 3, 4)Corporate Executive, RetiredTulsa, Oklahoma
JACK E. GOLDEN (4)Corporate Executive, RetiredSpicewood, Texas
HANS HELMERICH (1, 4)President, Chief Executive OfficerHelmerich & Payne, Inc.Tulsa, Oklahoma
JOHN R. IRWIN (1)President, Chief Executive OfficerAtwood Oceanics, Inc.Houston, Texas
JAMES R. MONTAGUE (2, 3, 4)Corporate Executive, RetiredHouston, Texas
(1) Executive Committee(2) Audit Committee(3) Compensation Committee(4) Nominating & Corporate Governance Committee
OFFICERSJOHN R. IRWIN
President, Chief Executive Officer
JAMES M. HOLLANDSenior Vice President, Chief Financial Officer andSecretary
GLEN P. KELLEYSenior Vice President — Marketing and Administration
ALAN QUINTEROSenior Vice President — Operations
RONNIE L. HALLVice President — Operations
BARRY M. SMITHVice President — Technical Services
RANDAL F. PRESLEYVice President — Administrative Services
MICHAEL A. CAMPBELLVice President — Controller
ANNUAL MEETING
The annual meeting of stockholders will be held at10:00 A.M., Central Standard Time, on Thursday,February 11, 2010, at our principal office: 15835 Park TenPlace Drive, Houston, Texas, 77084. A formal notice of themeeting together with a proxy statement and form ofproxy will be mailed to stockholders on or aboutJanuary 12, 2010.
TRANSFER AGENT AND REGISTRAR
Continental Stock Transfer & Trust Company2 BroadwayNew York, New York 10004
FORM 10-K
A copy of our Form 10-K to which this Annual Reportis an exhibit is filed with the Securities and ExchangeCommission and is available free on request by writing to:
Secretary, Atwood Oceanics, Inc.P. O. Box 218350Houston, Texas 77218
SEC FILINGS
We file our annual report on Form 10-K, quar-terly and current reports, proxy statements, andother information with the SEC. Our annual reporton Form 10-K for the year ended September 30,2009 includes as exhibits all required Sarbanes-Oxley Act Section 302 certifications by our CEOand CFO regarding the quality of our public disclo-sure. Our SEC filings are available to the publicover the internet at the SEC’s web site athttp://www.sec.gov. Our website address iswww.atwd.com. We make available free of chargeon or through our website our annual report onForm 10-K, quarterly reports on Form 10-Q, andcurrent reports on Form 8-K, and amendments tothose reports filed or furnished pursuant to Sec-tion 13(a) or 15(d) of the Exchange Act as soon asreasonably practicable after we electronically filesuch material with, or furnish it to, the SEC. Infor-mation on our website is not incorporated by refer-ence into this report or made a part hereof for anypurpose. You may also read and copy any docu-ment we file, including our Form 10-K, at the SEC’sPublic Reference Room at 100 F Street, NE,Washington, DC 20549. Please call the SEC at1-800-SEC-0330 for further information on the pub-lic reference room and copy charges.
NYSE CERTIFICATION
Each year, our CEO must certify to the NYSE that heis not aware of any violations by the Company of NYSEcorporate governance listing standards. Our CEO’s certifi-cation for fiscal year 2008 was submitted to the NYSEduring fiscal year 2009, and our CEO will certify fiscalyear 2009 during fiscal year 2010.
STOCK PRICE INFORMATION —
The common stock of Atwood Oceanics, Inc. istraded on the New York Stock Exchange (“NYSE”) underthe symbol “ATW”. No cash dividends on common stockwere paid in fiscal year 2008 or 2009, and none areanticipated in the foreseeable future. Based upon informa-tion provided to us by a third party shareholder servicesprovider dated November 11, 2009, we have approxi-mately 38,700 beneficial owners of our common stock. Asof November 23, 2009, the closing sale price of thecommon stock of Atwood Oceanics, Inc., as reported byNYSE, was $37.96 per share. The following table setsforth the range of high and low sales prices per share ofcommon stock as reported by the NYSE for the periodsindicated.
Quarters Ended Low High Low HighFiscal 2009 Fiscal 2008
December 31 . . . . . . $12.60 $36.36 $35.75 $51.84
March 31 . . . . . . . . 13.03 20.55 36.39 52.70
June 30 . . . . . . . . . . 15.96 28.95 44.56 62.95
September 30 . . . . . 21.40 36.65 32.25 63.46
49
%%TRANSMSG*** Transmitting Job: H68826 PCN: 044000000 ***%%PCMSG|49 |00011|Yes|No|12/23/2009 12:01|0|0|Page is valid, no graphics -- Color: D|
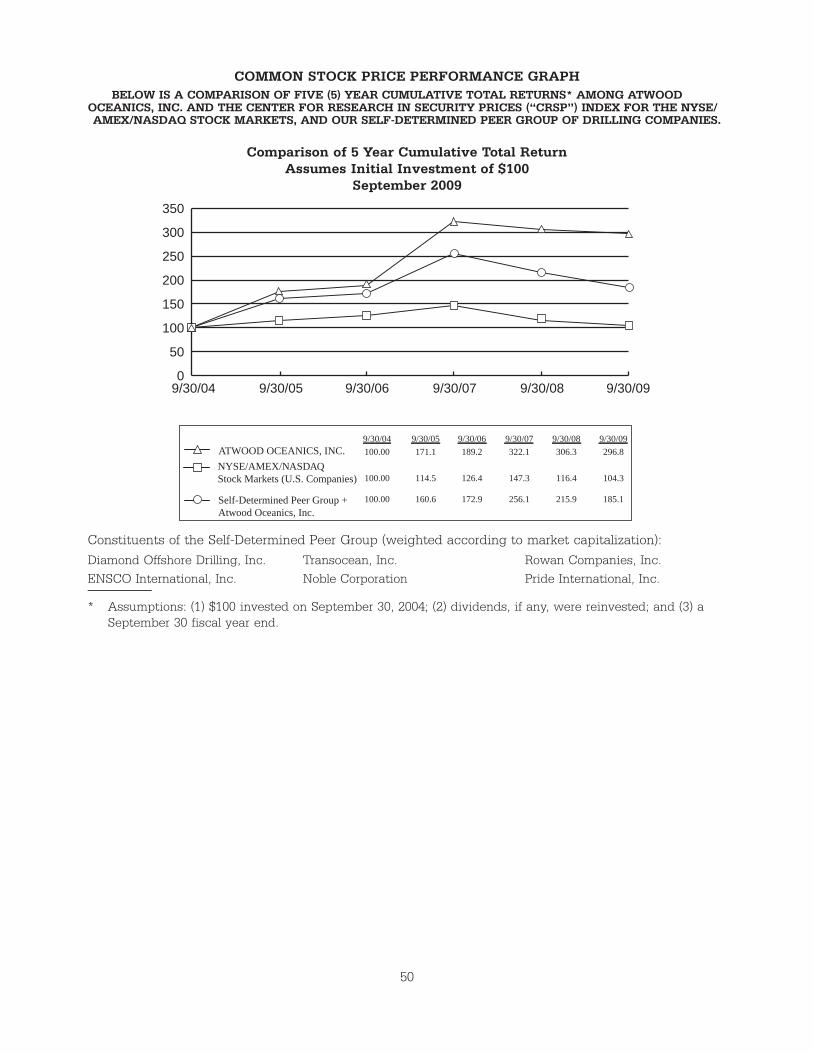
COMMON STOCK PRICE PERFORMANCE GRAPHBELOW IS A COMPARISON OF FIVE (5) YEAR CUMULATIVE TOTAL RETURNS* AMONG ATWOOD
OCEANICS, INC. AND THE CENTER FOR RESEARCH IN SECURITY PRICES (“CRSP”) INDEX FOR THE NYSE/AMEX/NASDAQ STOCK MARKETS, AND OUR SELF-DETERMINED PEER GROUP OF DRILLING COMPANIES.
Comparison of 5 Year Cumulative Total ReturnAssumes Initial Investment of $100
September 2009
0
50
100
150
200
350
300
250
9/30/099/30/089/30/079/30/069/30/059/30/04
Self-Determined Peer Group +Atwood Oceanics, Inc.
NYSE/AMEX/NASDAQStock Markets (U.S. Companies)
ATWOOD OCEANICS, INC. 171.1
114.5
160.6
100.00
100.00
100.00
189.2
126.4
172.9
322.1
147.3
256.1
306.3
116.4
215.9
296.8
104.3
185.1
9/30/04 9/30/099/30/089/30/079/30/069/30/05
Constituents of the Self-Determined Peer Group (weighted according to market capitalization):
Diamond Offshore Drilling, Inc. Transocean, Inc. Rowan Companies, Inc.ENSCO International, Inc. Noble Corporation Pride International, Inc.
* Assumptions: (1) $100 invested on September 30, 2004; (2) dividends, if any, were reinvested; and (3) aSeptember 30 fiscal year end.
50
%%TRANSMSG*** Transmitting Job: H68826 PCN: 045000000 ***%%PCMSG|50 |00012|Yes|No|12/23/2009 12:01|0|0|Page/graphics valid 12/23/2009 12:03 -- Color: D|


Atwood Oceanics, Inc.15835 Park Ten Place DriveP.O. Box 218350Houston, Texas 77218
ANNUAL REPORT FOR 2009