AttrActiveness of BrAzil As An internAtionAl investment And Business...
152
ATTRACTIVENESS OF BRAZIL AS AN INTERNATIONAL INVESTMENT AND BUSINESS HUB 2012 /# 2
-
Upload
duongkhanh -
Category
Documents
-
view
216 -
download
2
Transcript of AttrActiveness of BrAzil As An internAtionAl investment And Business...

AttrActiveness of BrAzil As An internAtionAl investment And Business huB 2012 /# 2


AttrActiveness of BrAzil As An internAtionAl investment And Business huB 2012 /# 2

4 AttrActiveness of BrAzil As An internAtionAl investment And Business huB

Brazil’s rise as a global economic power is undeniable. in recent decades the country finally left behind the old promise of “country of the future”; however, complete ful-fillment requires capturing international recognition of Brazil’s transformation into an investment and business hub.
this document is the second edition of our report entitled Attractiveness of Brazil as an international investment and business hub, published by BrAin for the first time in 2011. this report attempts to shed new light on the attractiveness of an investment and business hub, identifying initiatives that will make the country even more at-tractive to investors and business executives, as well as to all other players involved. this version brings an updated view of Brazil’s performance compared to a number of selected nations along a set of seven pillars, considered to be essential for the at-tractiveness of an investment and business hub.
in preparing this material BrAin conducted extensive research and analysis, with the support of the Boston consulting Group. this document is a result of this effort and describes in detail the attractiveness of Brazil as a latin American investment and business hub. it also defines a number of indicators that can be used to dynamically track the position of the country, and lists next steps and initiatives that will further this position.
Created in 2010, BRAiN’s mission is to ensure the creation of a multi-sector vision of Latin America as a strongly interconnected regional business hub, within which Brazil should be one of the preeminent hubs.
Additional information about BRAiN and its vision is available at www.brainbrasil.org.
PrefAce
6 AttrActiveness of BrAzil As An internAtionAl investment And Business huB
01
02
03
04
05
06
07
executive summary 08
dashboard of Brazil’s attractiveness 16
macroeconomic environment 26
institutional environment 40
talent and human capital 54
Physical infrastructure 70
financial infrastructure 86
connectivity 102
image of the country 124
Appendix: details of the indicators used 140
contents

AttrActiveness of BrAzil As An internAtionAl investment And Business huB 7
8 AttrActiveness of BrAzil As An internAtionAl investment And Business huB
the attractiveness of Brazil as an investment and business destination is a recurring and very important theme. As part of its activities to articulate and catalyze the crea-tion of an international hub in Brazil, BrAin - Brasil investimentos & negócios (Brazil investments & Business) is issuing this second edition of its Attractiveness of Brazil as an international investment and business hub report, first published in 2011. this new study, supported by extensive research and data analysis, re-examines the seven pillars that constitute BrAin’s vision of the fundamental prerequisites for the creation and excellence of an attractive investment and business hub: macroeconomic envi-ronment, institutional environment, talent and human capital, physical infrastructure, financial infrastructure, connectivity and image of the country.
Brazil has numerous characteristics that make it suitable for the international invest-ment and business hub status, such as the strength of the economy and its importance within its region, its financial infrastructure as well as political and institutional stability.
however, its prominence in the international scenario still faces numerous challenges that the country must address, such as the quality of the education, an irrational tax system and poor transport infrastructure. these challenges represent ultimately ad-ditional costs for investing and doing business in the country. however, given the advances of the past decade, including the country’s resilience to recent crises, the outlook is far more positive for Brazil.
Below are the main elements of each of the pillars analyzed:
1) Macroeconomic environment: Brazil is currently a strong economy with global relevance. in 2011 it became the world’s sixth largest economy in terms of nominal GdP. it is also a stable economy, having kept inflation in single digits since 2002, with an average consumer price index (iPcA1) of 5.8% a year between 2003 and 2011. in addition, exchange volatility has been low over the past five years. the nation also proved quite resilient to the effects of the global economic crisis, growing at an annual rate of 4.4% between 2006 and 2010. however, growth slowed to 2.7% in 2011, a clear indication that there are challenges ahead if Brazil is to keep growing with no increase in inflation. in particular, a new model for growth should be pursued, one that is not so much dependent on consumer spending as it has been recently.
executive summAry
1 Ample consumer Price index (iPcA), the official index the Brazilian Govern-ment has used to measure inflation since 1999

AttrActiveness of BrAzil As An internAtionAl investment And Business huB 9
in order to keep on this positive path for growth, it is essential that Brazil increases its investment capacity. Between 2002 and 2011, investment in Brazil averaged 17.3% of the GdP, well below countries such as china and india, and even other latin Ameri-can countries such as chile and mexico. investment as a percentage of GdP in these countries was 41.5%, 29.9%, 21.5% and 20.6% respectively over this same period. increasing the rate of investment is particularly critical in light of the low average rate of internal savings in Brazil, which was only 19% from 2008 to 2011. this means that attracting foreign investment is key for future growth.
continued reduction in the nominal public deficit, which decreased from 4.5% of the GdP in 2002 to 2.6% in 2011 as well as continued fiscal discipline are the basis for continued economic stability and thus attracting foreign capital, and essential for increasing the investment rate and consequently the country’s growth over the coming years.
2) Institutional environment: Brazil has reached important milestones in its political and institutional systems. it has consolidated its position as a democracy, with regular, direct and multi-party elections, and there is no sign of any internal or external conflict.
however, it faces important challenges in institutional aspects related to the economy, in particular those related to its complex tax system and bureaucracy. regarding the former, it must be mentioned how difficult and complex it is for companies to calculate and pay taxes such as icms, iss, Pis and cofins. regarding the latter, bureaucracy is a clear hurdle for business activities, and according to an imd survey2, Brazil is more bureaucratic than china or mexico, and very far from the main international invest-ment and business hubs such as the united Kingdom and the united states of America. merely as an example, one could mention the process of opening a business, which is complex and decentralized, with numerous steps at the municipal, state and federal levels, taking an average of 119 days in são Paulo, Brazil’s main business city.
2 the 2012 World competitiveness year-book, an annual global survey of middle
and senior managers in 59 countries

10 AttrActiveness of BrAzil As An internAtionAl investment And Business huB
however, progress has been made and further progress is expected in the future, such as the government of minas Gerais’ initiative to optimize the process to open a busi-ness, which has already proven a successful model and may be implemented in other eight states in 2012. in addition to rationalizing bureaucracy, the Brazilian state took an additional step in institutional matters, making government data more transparent with the signing of the law # 12,527 in november 2011 that requires the disclosure of public information, including civil servants’ salaries.
3) Talent and human capital: Brazil has a solid and positive demographic base, and it is the world’s largest economy with an economically active base growing fast enough to supply the expected increase in the demand for labor in the coming years.
however, if it is to leverage this advantage and become more attractive, Brazil must improve significantly the training and qualification of its workforce. net enrollment rates of 87% in primary school (grades 1 - 5) and 69% in secondary school (grade 6 to the end of secondary school) are close to world averages. however, this does not mean that the quality of the education is good. to illustrate the problem, in 2009 the average score for Brazilian students in the international PisA3 test was 401, well below the average of 497 for the oecd countries and 468 for all countries evaluated. the performance of secondary school students is also unsatisfactory, scoring below the expected in the 2011 Prova Brasil, with essentially no change compared to 2009.
in terms of higher education, net enrollment in Brazil is 27%, below the world aver-age of 40%, and has the same quality problems as primary and secondary education. regarding the alignment between higher education and market needs, an imd survey4 reveals that Brazil is the worst of the 13 nations compared. in addition to this, only 9% of the programs analyzed were rated as good in the 2010 General course index, Brazil’s ministry of education’s assessment of the quality of higher education5.
changes are underway and the Brazilian Government is making an effort to grant scholarships and invest in technical education, with programs such as Prouni, which granted 195 thousand scholarships for higher education in the first half of 2012, and PronAtec, created in late 2011 to promote technical education. Additionally, the pri-vate sector has numerous initiatives to give people the training and knowledge nec-essary for their activities. however, taking benefit from the country’s demographic advantage requires a continuous effort in training the population in order to meet market needs, with long-term impacts.
3 Programme for international student Assessment: a test ap-plied from time to time by the oecd to 15-year- old students (equivalent to the 9th grade) in 65 countries
4 the 2012 World competitiveness yearbook, an annual global survey of middle and senior managers in 59 countries
5 schools scoring 4 or 5 on a scale of 1 to 5, with the higher scores being better

AttrActiveness of BrAzil As An internAtionAl investment And Business huB 11

12 AttrActiveness of BrAzil As An internAtionAl investment And Business huB
4) Physical infrastructure: the availability of basic services within Brazil’s urban cent-ers is adequate, with 99% and 85% of the urban population having access to clean water and basic sanitation, respectively. in this regard, Brazil performs better than other Brics, and it is close to the level of developed nations.
however, its performance along other dimensions is still quite poor. in transportation there are clear infrastructure bottlenecks, resulting from a slowdown in investments in this sector dating back to more than three decades - in the seventies the country invested 5.4% of its GdP in infrastructure, but by the two thousands was investing only 2.1%. this puts Brazil at a disadvantage compared to developed nations with established infrastructure and emerging nations such as china, which in 2010 spent 11% of its GdP on infrastructure, and india, which invested 5.1% between 2004 and 2008. And the latter plans to invest 7.6% of its GdP a year between 2008 and 2012.
Addressing this challenge is part of the Brazilian Government’s current agenda, which includes greater involvement of the private sector. concessions for the private opera-tion of three airports - cumbica (sP), viracopos (sP) and Juscelino Kubitschek (df), awarded in the first half of 2012, are illustrations of the Government’s greater willing-ness to allow private participation in physical infrastructure investments. Additional concessions and PPPs (public-private partnerships) are planned for the coming years. the investment in logistics Program announced in August 2012 points to clear oppor-tunities in the road, railway, port and airport sectors. in addition to attracting invest-ments and creating jobs, these works will also make the country more competitive as an investment and business hub.
5) Financial infrastructure: Brazil has solid financial regulations, for which it is recog-nized worldwide. its rules of prudence, for example, make fraudulent market schemes, such as the madoff affair, more difficult to happen in the country. this is probably the pillar in which Brazil stands out the most compared to other investment and business hubs. it was largely due to the solidity of its banking infrastructure that Brazil weath-ered the 2008 financial crisis so well.
In transportatIon there are clear Infrastructure bottlenecks, resultIng from a
slowdown In Investments In thIs sector datIng back to more than three decades

AttrActiveness of BrAzil As An internAtionAl investment And Business huB 13
in terms of funding for businesses, in recent years the number of bank loans has in-creased, and companies have diversified their sources of funds, in particular using the stock market. nevertheless, there remain opportunities for greater diversification of the instruments used.
it is hoped that falling real interest rates will foster the debentures market, for in-stance. the use of this financing instrument in Brazil is rather limited in comparison to other countries: it represents less than 1% of the GdP, compared to 36% in south Ko-rea. Also, its growth in real terms in Brazil, about 4% a year between 2004 and 2011, was quite low compared to the 15% annual increase in bank credit during the same period. When it sought to replicate the success of the novo mercado6 self-regulation initiative to private-debt issues, the market organized and created added incentives for businesses to use this type of financing.
6) Connectivity: Brazil captures a major share of latin America’s inward foreign direct investment (fdi). in 2011, 41.1% of the total fdi in latin America went to Brazil, and it is the major destination of large north American, european and Asian companies.
however, there’s room for growth, as Brazil attracts proportionally less fdi than its share of regional GdP – the country has an fdi to GdP ratio of 0.957, while chile has 3.13.
exports of goods and services increased 12.4% and 12.5% a year respectively be-tween 2007 and 20118, a rate that is larger than those experienced by the rest of latin America and the world at large. however, Brazil’s share of global trade is small, something around 1% of the total.
in order to bolster both the flows of capital and goods and services, Brazil could pro-mote further integration with other countries in the form of international trade agree-ments as a means to soften still-existing protectionist policies.
6 Bm&fBovesPA rules for listing that de-mand corporate governance standards
above those required by law
7 Average between 2009 and 2011
8 imports of goods and services in-creased 16.7% and 19.7% respectively
over the same period

14 AttrActiveness of BrAzil As An internAtionAl investment And Business huB
7) Image of the country: Brazil has a positive image as a tourist destination, accord-ing to the Anholt-GfK roper nation Brands index, and cities such as são Paulo and rio de Janeiro are recognized as some of the best places to do business in latin America, as shown in the ranking published by the Américaeconomía magazine.
in terms of image as a place to do business, Brazil could increase its efforts to promote itself within a broader context, which are still quite limited. here one could mention the Best BrAzil initiative, which presents Brazil’s financial and capital markets to for-eign investors, and APex, whose goal is to promote the country’s foreign trade.
Brazil has a unique opportunity to promote itself abroad over the next few years, given the exposure it will get for hosting the 2014 fifA World cup and the 2016 olympic Games, which should attract some 600 thousand visitors in 2014, and 380 thousand in 2016. if Brazil successfully exports its image during these sports events, the current flow of tourists, which in 2011 was 5.4 million, could reach a higher level and offer the country an opportunity to improve its image abroad as a destination for tourism and, more importantly, for business.
in the next section, we present a dashboard of indicators with a comparative analysis of Brazil. the country is compared to 13 selected countries in each of the 57 dimensions of the 7 pillars of attractiveness. in the sections ahead, we discuss Brazil’s position as an investment and business hub in each of these dimensions and pillars in greater depth.
brazIl has a unIque opportunIty to promote
Itself abroad over the next few years, gIven the
exposure It wIll get for hostIng the fIfa world cup
and the olympIc games

AttrActiveness of BrAzil As An internAtionAl investment And Business huB 15
16 AttrActiveness of BrAzil As An internAtionAl investment And Business huB
A dAshBoArd of BrAzil's AttrActiveness
to analyze the attractiveness of a hub we considered two main streams: the country’s intrinsic characteristics and its connectivity. intrinsic characteristics are those that defi-ne a country as attractive in itself: a strong economy, its physical, financial, legal and regulatory infrastructure, and a trained and qualified population. connectivity, meaning flows, defines the attractiveness of the network to which the country belongs, reflec-tion of the number and quality of its intra-regional connections, and its connections to other relevant hubs around the world. these streams make up a country’s attractive-ness as a hub and allow a nation to compete with other global hubs for resources for itself and for its region of influence.
these characteristics are detailed in seven pillars that constitute BrAin’s vision of the fundamental prerequisites for the creation and excellence of an attractive investment and business hub: macroeconomic environment, institutional environment, talent and human capital, physical infrastructure, financial infrastructure, connectivity and image of the country (see Exhibit 1).
from this starting point, separate dashboards were created for each pillar to enable easy comparison of how Brazil is doing in relation to a list of 13 countries. these dash-boards contain 57 dimensions, representing the main elements analyzed in this report. the objective is to track Brazil’s progress over the years so as to enable mapping the next steps required to enhance Brazil’s attractiveness as an investment and business hub. these metrics take into consideration the quality of the source, the availability of data for different countries, and the possibility of continuous monitoring over time.

AttrActiveness of BrAzil As An internAtionAl investment And Business huB 17
exhiBit 1the seven pillars that underlie the fundamental requirements for creating and excelling as an investment and business hub
MACRoeCoNoMIC eNvIRoNMeNT
TALeNT AND HUMAN CAPITAL
FINANCIAL INFRAsTRUCTURe
INsTITUTIoNAL eNvIRoNMeNT
PHysICAL INFRAsTRUCTURe
CoNNeCTIvITy
IMAge oF THe CoUNTRy
steady economic growth and little uncertainty regarding interest and the exchange rate are examples of the underlying conditions required for creating an international investment and business hub in any country
An adequate supply of talents, not only in terms of numbers but also in terms of their qualification and training, which must be aligned with what the job market is looking for, along with possibility of attracting and bringing in experts from outside the country are also requirements that any location that aspires to be an international hub must fulfill
the existence of capable financial intermediaries, continuous access to several sources of funding and tools to mitigate risk all directly support the development of an investment and business hub
A solid state of law, enabling economic agents to fully meet their obligations and transparent and efficient administrative processes are key elements when it comes to qualifying a country as a hub, in particular compared to other potential hubs
multimodal shipping options that enable flows into, out of and within the hub, along with access to a communications network that is competitive in terms of both cost and performance are clearly some of the factors of success for any business hub
intense trade in goods and services, capital and people flows are vital to continuously nurture an investment and business hub
A positive perception of what a country as a whole has to offer is an important asset to consolidate the position of any hub, and in particular for attracting companies and talents

18 AttrActiveness of BrAzil As An internAtionAl investment And Business huB
P: INDICAToR BAseD oN PRojeCTeD DATA
MAIN INTeRNATIoNAL HUBs oTHeR DeveLoPeD NATIoNseMeRgINg NATIoNs
mAcroeconomic environment
critical needs improvement good excellent
jPN
DeU
FRA HKg
sgPgBR UsA RUs
MeX
CHNCHLKoR
INDeCoNoMIC gRowTHP1.
BRA
eCoNoMIC voLATILITy5.jPNDeU KoRHKg UsA sgPgBR CHNRUsCHL MeX IND
FRA
BRA
FIsCAL soLIDITyP3.jPN
gBR
FRA DeU KoRUsA sgP HKgMeX CHN
CHL
RUsBRA
IND
INCoMe DIsTRIBUTIoN7.
BRAHKgCHL MeX
sgP
UsARUs
CHN
jPN
IND FRA
DeUgBR KoR
jPNHKg FRAUsA
sgPgBR
RUsIND MeX
DeUCHLCHN
KoRMoNeTARy sTABILITyP2.
BRA
HUMAN DeveLoPMeNT6.DeUFRA
KoR
HKg
UsA
sgP
gBR
IND CHN RUs MeX CHL
jPN
BRA
eXTeRNAL vULNeRABILITy4.KoR sgPHKg CHNCHL MeX RUsIND
BRA
the basket of countries for comparison was made up by looking for examples of coun-tries that are recognized as investment and business hubs: the united states, the uni-ted Kingdom, hong Kong and singapore; developed nations: france, Germany, Japan and south Korea; and countries that, like Brazil, are considered emerging: russia, india, china, chile and mexico.
in order to assign countries to positions along each indicator scale, and to classify them as “excellent”, “good”, “needs improvement” and “critical”, one of two rationales was used: (1) where available, a publicly established social, political or economic consen-sus, (2) where no such consensus exists, a statistical rationale where the population average is the divider between the “good” and “needs development” levers, and a standard deviation added to or subtracted from the average and used as the divider between the “excellent” and “critical” levels respectively.
details regarding indicator sources and the criteria for allocating countries along each scale are available in the Appendix of this report.

AttrActiveness of BrAzil As An internAtionAl investment And Business huB 19
1. DATA CANNoT Be UPDATeD FRoM THe 2011 ATTRACTIveNess RePoRT
MAIN INTeRNATIoNAL HUBs oTHeR DeveLoPeD NATIoNseMeRgINg NATIoNs
institutionAl environmentcritical needs improvement good excellent
jPN UsA HKggBR
sgP
RUs CHN
CHL
MeX FRA DeU
IND KoRQUALITy oF RegULATIoNs
BRA
2.
LegAL seCURITyjPN
KoR
HKg
sgP
gBR
CHLMeX INDRUs FRA
DeU
UsACHN
BRA
3.
LABoR MARKeT FLeXIBILITy1FRA KoR jPNDeU UsA sgPgBRCHLCHN
MeX HKgINDRUs
BRA
4.
jPN sgPgBR
HKgUsA
FRA
RUs
KoR
IND CHL
MeX
CHNPoLITICAL sTABILITy
DeUBRA
1.
eAse oF oPeNINg A BUsINess1
jPNKoR
UsA
sgP gBR
MeX
CHN INDRUs
CHL FRA
BRA
5.
How eAsy IT Is FoR BUsINesses To PAy TAXes DeU FRA
HKgUsAKoR gBR
sgPCHN CHL
RUsjPNMeX INDBRA
6.

20 AttrActiveness of BrAzil As An internAtionAl investment And Business huB
tAlent And humAn cAPitAlcritical needs improvement good excellent
FRA DeUgBRHKg sgPRUsCHL CHNINTeNsITy oF ReseARCH AND DeveLoPMeNT8.
BRAIND
KoR
jPN
DeU CHL RUsgBRDIAsPoRA MANAgeMeNT11.
BRA
sgP HKg IND
FRA
sgP HKg
RUs
CHLCHNAvAILABILITy oF QUALIFIeD MANAgeRs AND eNgINeeRs7.
BRA
UsA
KoR INDDeU gBRjPN
KoR
jPN
gBRDeU FRA
RUs
IND MeXCHNDeMogRAPHIC CoNTINgeNTP1.
BRAUsA
DeU
gBR jPNRUs
IND
MeX
CHLCHNQUANTITy oF PRIMARy AND seCoNDARy eDUCATIoN2.
BRAHKg UsA sgP FRA
KoR
FRA DeU HKgKoRjPNRUsMeX CHL CHNQUALITy oF PRIMARy AND seCoNDARy eDUCATIoN13.
BRA
sgPUsA gBR
FRADeU HKg
gBR
KoRjPN RUsIND MeXCHN
CHLQUANTITy oF HIgHeR eDUCATIoN4.
BRAsgP UsA
FRA DeUUsA sgPKoR
RUs
IND
MeX
CHN CHLALIgNMeNT BeTweeN HIgHeR eDUCATIoN AND THe MARKeT5.
BRAgBR HKgjPN
FRA DeUgBR HKgsgPjPN KoR
RUs
INDCHLCHNINTeRNATIoNALIzATIoN oF THe CoUNTRy’s eDUCATIoN (FoReIgN LANgUAges AND eXPeRIeNCe)
6.
BRAUsA
MeX
KoR DeUFRA
gBR sgP
RUs
IND
CHN CHLCoUNTRy ATTRACTIveNess To INTeRNATIoNAL TALeNT9.
BRAMeXjPN
HKg
UsA
KoR FRA
HKg
CHLjPN CHN MeXRUs sgPTALeNT IMMIgRATIoN CoMPLeXITy10.
BRA
UsA
gBRINDDeU
P: INDICAToR BAseD oN PRojeCTeD DATA 1. DATA CANNoT Be UPDATeD FRoM THe 2011 ATTRACTIveNess RePoRT
MAIN INTeRNATIoNAL HUBs oTHeR DeveLoPeD NATIoNseMeRgINg NATIoNs

AttrActiveness of BrAzil As An internAtionAl investment And Business huB 21
PhysicAl infrAstructurecritical needs improvement good excellent
PoweR AvAILABILITyKoR jPN DeU FRAgBR
HKg
sgPCHNMeX CHL UsAIND
RUs
BRA
4.
BAsIC seRvICes AvAILABLe To THe URBAN PoPULATIoN1
CHN gBRsgP
FRAjPN
KoRUsA
DeU
MeXIND RUs CHLBRA
5.
FRA DeU gBRRUsIND
MeX
CHNURBAN MoBILITy1
BRAUsA
1.
jPN KoR FRA DeU
gBRUsA HKg
RUs CHN
IND
CHLMeXQUALITy oF AIR TRANsPoRT
sgPBRA
2.
QUALITy AND CosT oF TeLeCoMMUNICATIoNs
jPN DeUFRA KoRsgPgBRCHNMeX INDRUs
HKg
UsACHL
BRA
3.
1. DATA CANNoT Be UPDATeD FRoM THe 2011 ATTRACTIveNess RePoRT
MAIN INTeRNATIoNAL HUBs oTHeR DeveLoPeD NATIoNseMeRgINg NATIoNs

22 AttrActiveness of BrAzil As An internAtionAl investment And Business huB
finAnciAl infrAstructurecritical needs improvement good excellent
Use
oF
FIN
AN
CIA
L Re
soUR
Ces
sHARe oF RegIoNAL AND INTeRNATIoNAL CoMPANIes IN THe sToCK eXCHANge
jPN UsA gBR
CHN
INDRUs CHL MeX
BRAKoR sgP HKgFRA
5.
AvAILABILITy oF FINANCIAL seRvICes
KoR jPN FRA
DeU
gBRRUs
CHN
IND CHLMeXBRA
sgP
HKgUsA6.
PRojeCTIoN As AN IFCKoR DeUjPN HKg gBRFRAIND RUs MeX CHN
BRA
sgP UsA8.
KoR
FRA
jPN
gBRRUs IND CHLMeXCHN DeUeFFeCTIveNess oF FINANCIAL RegULATIoNs
BRAUsA
HKg
sgP1.
DeBeNTUResjPN
DeU
FRA KoRsgP
gBR
HKg UsACHN CHLIND MeX
BRA
3.
jPNIND
FRA
UsA gBR sgP HKg
RUs
CHN CHL
MeXsToCK eXCHANge
DeU KoRBRA
2.
CoRPoRATe CReDIT
KoR FRA
gBR
UsA CHNsgP
IND
DeUBRA
4.
sToCK eXCHANge LIQUIDITy
FRA jPN HKggBR
DeU
KoRINDCHL RUs
CHN
MeX
BRA
sgP
UsA7.
MAIN INTeRNATIoNAL HUBs oTHeR DeveLoPeD NATIoNseMeRgINg NATIoNs

AttrActiveness of BrAzil As An internAtionAl investment And Business huB 23
connectivity
critical needs improvement good excellent
TRA
De
CAPI
TAL
BUsI
Nes
ses
Peo
PLe
jPN KoR sgPDeUgBRUsA RUs CHNIND MeXTRADe IN gooDs
FRA
HKgCHL2.
BRA
KoR jPN DeU UsARUs CHN CHLINDMeX
sgP FRAgBR
INTeRNATIoNAL oPeNNess FoR TRADe IN gooDs1
1.
BRAHKg
PeoPLe MoBILITyCHL IND CHN RUsMeX HKg
gBRjPN
FRA11.
BRAUsAsgP
KoRDeU
CHN
IND RUsUsA
MeX
CHLjPN
KoR
HKgsgPgBRDeU FRA5.
BRA
CAPITAL FLows
INTeRNATIoNAL oPeNNess FoR TRADe IN seRvICes1
3.jPNDeU
FRAKoRsgP CHNIND MeX gBR
HKg
CHL
BRAUsA
TRADe IN seRvICesFRA KoR
sgP
gBRCHN CHL INDMeX jPN
RUs
UsA DeU HKg4.
BRA
CHNCHLMeX FRAjPN
gBR
sgP DeUKoR6.
BRA
HKg
INTeRNATIoNAL AgRe-eMeNTs ALLowINg CAPITAL FLows1 INDRUs
UsA
CHN RUs CHL
IND
MeX gBR HKgUsA jPNKoR7.
BRA
DeU
sgPFRANATIoNAL RegULA-TIoNs sUPPoRTINg INTeRNATIoNAL CAPITAL FLows1
eXPANsIoN oF THe CoUNTRy’s MULTINATIoNALs IND
RUs MeX CHNCHL HKg gBR UsAjPN DeU FRA
KoR8.
BRAsgP
eAse oF eNTRy FoR FoReIgN MULTINATIoNALs1
IND
CHL
MeX RUsCHN UsAKoR FRA9.
gBR
sgP jPN
oPeNNess To IMMIgRANTs1
IND RUsCHN MeX CHL gBR HKgKoR jPN DeU10.
BRA
UsA sgPFRA
BRA
1. DATA CANNoT Be UPDATeD FRoM THe 2011 ATTRACTIveNess RePoRT
MAIN INTeRNATIoNAL HUBs oTHeR DeveLoPeD NATIoNseMeRgINg NATIoNs

24 AttrActiveness of BrAzil As An internAtionAl investment And Business huB
imAGe of the country
critical needs improvement good excellent
FRA DeU CHLgBR
UsA
sgP HKgjPN KoRRUs IND
MeX
CHNCULTURAL oPeNNess6.
BRA
HKg sgP
UsA
DeU
RUs
CHL
FRA
KoR INDFoReIgN INTeResT IN THe CoUNTRy’s INvesTMeNT AND BUsINess
2.
BRA
jPN
MeX CHN gBR
KoR
CHN FRAHKg
MeX
RUsCHLQUANTITy oF vIsIToRs9.
BRAIND jPN
DeU gBR UsA
sgP
CHL sgP
RUs
UsAgBRCHN
MeX
IMAge As A PLACe To Do BUsINess1.
BRA
IND FRA jPN
KoR
DeU
gBR
DeUHKg sgP
KoR CHN
RUs IND MeXCHL jPNATTRACTIveNess FoR INTeRNATIoNAL eveNTs3.
BRAUsAFRA
FRA
DeU gBRKoR jPNCHLMeXIND RUsCHNsUsTAINABILITy4.
BRAsgP
UsA
KoR gBR
FRA
UsA sgPIND DeU
RUs
CHN CHL jPNQUALITy oF LIFe5.
BRAHKg
MeX
CHLKoR
jPN
gBR sgP
HKg
UsARUs
CHN
INDPeRsoNAL sAFeTy AND AsseT seCURITy7.
BRAMeX FRA DeU
jPN DeU
FRA
sgP RUsCHL CHNIMAge FoR ToURIsM AND LeIsURe8.
BRA
INDKoR
MeX UsA
gBR
MAIN INTeRNATIoNAL HUBs oTHeR DeveLoPeD NATIoNseMeRgINg NATIoNs

AttrActiveness of BrAzil As An internAtionAl investment And Business huB 25

26 AttrActiveness of BrAzil As An internAtionAl investment And Business huB
01MacroeconoMic environMent
to assess the attractiveness of an investment and business hub it is essential to look at the country’s macroeconomic scenario. stable economies that are growing sustainably and that offer suitable financing terms are able to leverage the strength of their local businesses and create a virtuous economic circle.
in this chapter we analyze the performance of Brazil’s macroeconomic environment along three dimensions - growth, predictability and financing terms.
growthBrazil continues to stand out in the global context, following a trend that has consoli-dated over recent years. Brazil passed the uK in nominal GdP in 2011, thus becoming the world’s sixth largest economy. Although its growth in 2011 was only 2.7%, below the 4.4% average for the period between 2006 and 2010, the outlook remains good for Brazil, and by 2020 the country should go up one more point in the ranking of the world’s largest economies (see Exhibit 2).
main aspects of the macroeconomic environment pillar
growth: the size of a country’s economy and conditions to ensure long term growth are essential for business expansion and to improve the quality of life of the popula-tion as a whole.
Predictability: Predictability is critical to generate trust and facilitate business opera-tions, in this way increasing the likelihood that economic agents invest in the country.
Financing terms: the financial capability of a nation is extremely important for main-taining a healthy macroeconomic environment.

AttrActiveness of BrAzil As An internAtionAl investment And Business huB 27
9 this index ranges from 0 to 1. higher scores indicate greater social inequality
10 source: de volta ao país do futuro: crise europeia, projeções e a nova
classe média (Back to the country of the future: european crisis, projections and
the new middle class), 2012, fundação Getúlio vargas center for social Policies
With the increase in GdP, income distribution as measured by the Gini index9 also improved. in 2002 the Gini index for Brazil was 0.59, and in 2012 should reach 0.5210. nevertheless, social inequality is still large compared to developed nations such as Germany or france, or even some emerging nations such as india and china, with much lower scores: 0.28, 0.33, 0.37 and 0.42 respectively.
1.
2.
3.
4.
5.
6.
7.
8.
9.
10.
11.
12.
1980 1990 2000 2010 2011 2020 2030
exhiBit 2a solid macroeconomic environment is key for a favorable business environment
World ranking of countries by GDP (US$)1Selected country growths 1996-2011
1. Based on the nominal GDP of the countries in US dollars using the average US$ exchange rate for the yearNote: According to the most recent data from EIU in May 2012 / Source: EIU Country Data; BCG analysis
In 2011, brazil overtook the uk to become the world’s 6th largest economy
furthermore, it continues grows at satisfactory rates, despite a recent slowdown
cAGr by period (%)15
10
5
0
1996-2000
BRA BRABRA BRACHN CHNCHN CHNUSA USAUSA USA2001-2005
Brazil’s growth is stable: variation between
2006 and 2010Brazil: 0.71 china: 0.19
usA: 3.73
2006-2010 2010-2011
2.02
2.78
9.76
2.39
4.45
11.20
0.73
2.74
9.20
1.74
8.63
4.30

28 AttrActiveness of BrAzil As An internAtionAl investment And Business huB

AttrActiveness of BrAzil As An internAtionAl investment And Business huB 29
income distribution is also reflected in the growth of the middle class11, which in 2011 made up 55% of Brazil’s population, compared to 38.6% in 200212. According to the international labor organization13, a favorable economy, formal jobs14 and a real in-crease in the minimum wage15 all contributed to better income distribution.
despite better income distribution, Brazil still has a lot of room to improve in terms of its human development index. calculated based on criteria such as income, education and life expectancy, this index is measured on a scale of 0 to 1, with higher scores being better. Brazil has made progress, going from 0.665 in 2000 to 0.718 in 2011, but is still only 84th out of the 187 nations surveyed16.
the last decade has provided clear evidence of a positive cycle of growth for Bra-zil. however, the 2.7% growth the country recorded in 2011 shows that challenges remain, in particular in terms of its investment capacity, translated into Gross fixed capital formation. estimates show that Brazil would need an investment rate of around 22% of its GdP to sustain 4% annual growth. Between 2002 and 2011 Brazil averaged a rate of 17.4%, while in china the investment rate was 41.5% and in india 29.9%. even compared to other latin American countries Brazil fares poorly, as in chile the investment rate is 21.4% of the GdP, and in mexico 20.6%. thus it is critical that Brazil adjust its investment rate to ensure higher and sustained growth in future.
furthermore, one of Brazil’s greatest macroeconomic challenges in the coming years will be how to solve the paradigm of growth based on consumption. While it is undeni-able that consumer spending helped the country go through the 2008 crisis, continued use of this model could have undesirable results. unemployment at an all-time low rate - under 6% - should serve as a warning to the continued policy of economic ex-pansion based on consumer spending. the low productivity17 of the workers that are being hired is in stark contrast with the high wages offered by a heated economy. the result are products that are expensive and non competitive, but that find a market within the country because they are protected by import tariffs. continued use of a model that stimulates demand will require more expensive resources and, at the limit, could drive up inflation.
the solution for this situation could encompass three actions: the first is to adjust credit expansion and consumption, with more restrictive fiscal policies designed not to overly accelerate demand and pressure inflation; the second is improving pro-ductivity of the Brazilian workforce, investing in education and making it easier for workers who are qualified in sectors where there is a labor shortage to enter the country (this is further discussed in the talent and human capital chapter); the third action, which we will also further address along this report, are policies to increase savings and investments in the country.
11 families making be-tween r$ 1,200.00 and
r$ 5,174.00 a month, 2011 prices
12 source: A nova classe média: o lado brilhante
da base da pirâmide (the new middle class:
the bright side of the base of the pyramid),
2011, fundação Getúlio vargas center for social
Policies
13 source: Perfil do tra-balho decente no Brasil:
um olhar sobre as unidades da federação (Profile of decent work in Brazil: a look at the different states), 2012
14 Between 2003 and 2010 the number of
people holding formal jobs increased 53.6%
15 Between April 2003 and January 2010 the accumulated real in-
crease in the minimum wage was 53.7%
16 in 2000 Brazil was 71st out of 153. source:
united nations develop-ment Program - human
development report
17 Within latin America Brazil is ranked 15th in productivity, and 75th
worldwide. source: the conference Board

30 AttrActiveness of BrAzil As An internAtionAl investment And Business huB
Predictability
inflation is one of the main factors that influence the predictability of an economy. following the hyperinflation Brazil experienced in the 1980s, important reforms in the nineties were able to contain an inertial inflation process. in addition, the formal implementation of inflation targets in 1999, which increased predictability and aligned the expectations of economic agents, was a major institutional milestone and remains a fundamental pillar of the country’s macroeconomic policy. As a result, between 2002 and 2011 the iPcA18 averaged 5.8%. Between 2012 and 2016, inflation is expected to reach 5.0% annually, which although high compared to developed nations, puts Brazil in advantage compared to india and russia. these two countries expect inflation rates of 7.7% and 5.3%, respectively.
Another important element for economic predictability is the exchange rate, as it re-duces market asymmetries and gives businesses the stability required to assess inter-national trade. even with the floating exchange system, the exchange rate fluctuation diminished over the past five years, with the us dollar remaining at between r$ 1.50 and r$ 2.40. in the early 2000s, the dollar had reached levels close to r$ 4.00.
Financing terms
the state of a country’s public finance has a major influence on its financing terms. net public sector debt as a percentage of GdP is dropping in Brazil, going from 60.4% in 2002 to 36.4% in 2011. regarding its foreign debt, in 2006 Brazil went from debtor to creditor. furthermore, the public deficit has been dropping in recent years, reaching 2.6% of the GdP in 2011 (see Exhibit 3).
the nation’s gross public debt also dropped, from a high in 2002, when it reached 70.9% of the GdP, to 66.2% in 2011. over the coming years Brazil is expected to re-main on this positive path, and by 2016 gross public debt is expected to be only 58% of the GdP19. therefore, Brazil is moving in the opposite direction of developed coun-tries such as the uK, france and singapore, whose debts are expected to keep growing and be around 90% of the GdP, and the us, with a projected debt of 113% of the GdP.
the formal ImplementatIon of InflatIon targets In 1999 was a major InstItutIonal
mIlestone and remaIns a fundamental pIllar of the country's macroeconomIc polIcy
18 Ample consumer Price index (iPcA), the official index the Government has used to measure inflation since 1999
19 source: international monetary fund (imf)

AttrActiveness of BrAzil As An internAtionAl investment And Business huB 31
over the course of the past years the public debt has dropped to a new level...
…the same is true for the deficit
exhiBit 3financing terms in Brazil have evolved positively
Public Deficit
4.5
3.0
0
5.5% GdP
external/total (%)
26 20 16 7 -2 -16 -28 -21 -24 -36
1. Position at year end. Equivalent to the net balance of the non financial public sector and the Central Bank debt with the financial system (public and private), the non financial private sector and the other countries / Source: Brazilian Central Bank
Net Public Sector Debt
47.3
-10
0
10
20
50
40
30
60
% GdP1
2002 2003 2004 2005 2006 2007 2008 2009 2010 2011
36.4
internal external total
60.4
2.9
5.2
3.6
2.0
3.3
2.6
2002 2003 2004 2005 2006 2007 2008 2009 2010 2011

32 AttrActiveness of BrAzil As An internAtionAl investment And Business huB
in that sense, an important institutional step that contributed to this was the signing in 2000 of the complementary law #101, also known as the fiscal responsibility law, which rationalized and set limits for public spending (see Box A).
Another critical factor for a country’s financing terms is the interest rate. interest rates have been dropping in Brazil since 2006, and dropping faster in 2012, when the central Bank set its target base interest rate to the lowest level since 1986, the first year such records were kept. the Brazilian Government expects the real base interest rate to be around 2% a year by 2014 - in 2006 it was 11.7%. All of this stimulates economic activity and reduces the spread to be paid by the Government. changes in legislation governing how savings accounts are remunerated, formerly set at 6.2% a year + the tr (the Brazilian central Bank reference rate), posing a barrier to any further drop in interest rates, and the Government’s policy to cut interest rates have paved the way for cheaper financing terms, aligning Brazil with countries such as china and russia (see Exhibit 4).
Box Acontributions of the fiscal responsibility law to Brazil’s financial health
the fiscal responsibility law, enacted on may 4th, 2002, sets limits on state and municipal public spending, forcing them to stay within their budget (literally their ability to collect taxes). supported on four principles (planning, transparency, con-trol and accountability), the frl defined the parameters for fiscal organization in Brazil. the law was designed to make public finance more transparent, and make it impossible for public managers to run up large debts at the end of their mandates, that their successors then had to tackle.
Brazil was the world’s first emerging nation to approve a fiscal responsibility law, and significantly increased this nation’s maturity regarding this theme. continuing along this path requires taking a number of additional steps, such as creating the fiscal management Board and setting limits on the federal public debt.
in addition, the law could be perfected so as to provide sufficient incentives to keep the short-term fiscal balance and not compromising the long-term investments Brazil needs, such as spending on infrastructure.
source: fiscal responsibility law; Brazilian federal revenue; fGv Projetos

AttrActiveness of BrAzil As An internAtionAl investment And Business huB 33
interest rates have dropped steadily over the years
Brazil reaches the same level as countries such as russia and china3
exhiBit 4the trend is for lower interest rates going forward
1. Average rate over the period and actual rate deflated using the IPCA 2. Estimate based on an IPCA of 5.2% and interest rate of 8% 3. Estimates for 2012 based on the median on the data collected from Bloomberg in June, 2012 / Source: Tendências Consultoria, Brazilian Central Bank, Bloomberg
12.4
10.1 9.8
11.7
interest rate1 (%) Actual interest rate %
8.0
Actual rate nominal rate
15.3
11.7
7.2
6.15.5
3.7
4.8
2.7 BRAz
il
2.7
CHiN
A
2.6
RUSS
iA
2.5
CHil
E
1.6
mEx
iCo
0.7
USA
-1.9
UNit
Ed k
iNgd
om
-2.3
emerging nations
developed nations
Brazil
in looking at financing mechanisms, it is clear that the domestic savings rate in Brazil is lower than in other countries (see Exhibit 5). Between 2008 and 2010 domestic savings in Brazil was 19%, while in china, india, chile and mexico it was 52%, 31%, 28% and 23% respectively. the low savings rate limits the country’s ability to fund any increase in investment and demands that it attract foreign sources.
Brazil is now in a more favorable position to attract foreign investment than it was in the past. in 2008 the rating agencies upped it to “investment grade”, and the country risk measured by the emBi+20 has been around 200 points since 2011, compared to more than 2,000 in 2002.
in short, financing terms in Brazil have been on a positive path in recent years, both in terms of the performance of its public accounts, and the drop in interest rates. nev-ertheless, the country must increase the domestic savings rates if it is to ensure good financing terms in future.
20 emerging markets Bond index Plus
12.0

34 AttrActiveness of BrAzil As An internAtionAl investment And Business huB
the savings rate in Brazil is low compared to selected countries
Indicators
the dimensions selected for continuous tracking of the macroeconomic environment pillar are:
• Economic growth: the faster a country’s economy is expected to grow, the more attractive it will be for international agents. it is extremely difficult for a hub to attract investments and business if it does not rank better than other hubs competing with it for capital;
• Monetary stability: monetary stability contributes to predictable economics of a hub’s investments and business. countries where there is the expectation of high inflation are less attractive, as international agents are concerned lest the value of their investments and companies erode together with the value of the local currency;
• Fiscal solidity: if a country’s fiscal policies are inadequate, the cost of funding in gen-eral will go up, thus increasing operating costs in the economy as a whole. therefore, the more fiscally solid a country, the more attractive it will be;
12%
exhiBit 5the savings rate in Brazil is among the lowest in the world
CHiN
A
SiNg
APoR
E
iNdi
A
RUSS
iA
SoUt
H ko
REA
HoNg
koN
g
CHil
E
mEx
iCo
gERm
ANY
JAPA
N
BRAz
il
FRAN
CE
UNit
Ed k
iNgd
om USA
52% 51%
31% 31%28%
21%
18%
13%
Gross domestic savings/GDP (%)1
1. Average for 2008-2009 / Note: 2010 is the last year data is available for all of the countries in the com-parison. In 2011, gross domestic savings in Brazil amounted to 19% of the GDP / Source: World Bank
31%30%
23% 23%
19%
emerging nations
developed nations
Brazil

AttrActiveness of BrAzil As An internAtionAl investment And Business huB 35

36 AttrActiveness of BrAzil As An internAtionAl investment And Business huB

AttrActiveness of BrAzil As An internAtionAl investment And Business huB 37
P: INDICAToR BAseD oN PRojeCTeD DATA
MAIN INTeRNATIoNAL HUBs oTHeR DeveLoPeD NATIoNseMeRgINg NATIoNs
mAcroeconomic environment
critical needs improvement good excellent
jPN
DeU
FRA HKg
sgPgBR UsA RUs
MeX
CHNCHLKoR
INDeCoNoMIC gRowTHP1.
BRA
eCoNoMIC voLATILITy5.jPNDeU KoRHKg UsA sgPgBR CHNRUsCHL MeX IND
FRA
BRA
FIsCAL soLIDITyP3.jPN
gBR
FRA DeU KoRUsA sgP HKgMeX CHN
CHL
RUsBRA
IND
INCoMe DIsTRIBUTIoN7.
BRAHKgCHL MeX
sgP
UsARUs
CHN
jPN
IND FRA
DeUgBR KoR
jPNHKg FRAUsA
sgPgBR
RUsIND MeX
DeUCHLCHN
KoRMoNeTARy sTABILITyP2.
BRA
HUMAN DeveLoPMeNT6.DeUFRA
KoR
HKg
UsA
sgP
gBR
IND CHN RUs MeX CHL
jPN
BRA
eXTeRNAL vULNeRABILITy4.KoR sgPHKg CHNCHL MeX RUsIND
BRA
• External vulnerability: the availability of reserves to honor its foreign commitments is a measure of a country’s autonomy to ensure its global financial credibility and of its dependence on foreign funds;
• Economic volatility: short term interest rates on government bonds are a good indicator of the volatility of a country’s economy and the frequency with which it must make adjustments. less volatile economies offer a more secure planning horizon for both companies and families, fostering high levels of investment and growth;
• Human development: the higher the human development index the more attrac-tive a country will be as a hub, since greater development means more talents, a larger domestic consumer market and better quality of life for its citizens;
• Income distribution: income distribution influences factors that are key for devel-oping a hub, such as the availability of talents, the size and profile of the consumer market, the country’s level of innovation and its quality of life. if the income is better distributed, these aspects will be more positive for the business hub.
the following exhibit shows how Brazil compares to other countries along the dimen-sions of the macroeconomic environment pillar:

38 AttrActiveness of BrAzil As An internAtionAl investment And Business huB
In the fIscal solIdIty IndIcator the country proved better, but stIll requIres Improvement, especIally In lIght of hIgh levels of publIc spendIng that could be revIewed and balanced
in general Brazil is well positioned in this pillar, in particular in the future economic growth dimension. in the fiscal solidity indicator the country proved better, but still requires improvement, especially in light of high levels of public spending that could be reviewed and balanced.
it comes as no surprise that in the human development and income distribution indica-tors Brazil is at a disadvantage compared to other countries, despite the advances of the last decade.
Conclusion
Brazil clearly stands out in the world, combining growth with income distribution and economic stability. in addition, in 2011 it had the world’s sixth largest nominal GdP, and in 2012 the real interest rate reached the lowest level ever, reducing the interest on the public debt and driving a more vibrant economy.
even so, it is important to make sure the current macroeconomic policy is followed, in particular when it comes to fiscal issues and the public deficit, and that the model for growth that is primarily based on consumer spending be reviewed. in addition, the in-terest and savings rates must be addressed to ensure sustained growth at rates similar to the previous decade and continued advances in income distribution.

AttrActiveness of BrAzil As An internAtionAl investment And Business huB 39
40 AttrActiveness of BrAzil As An internAtionAl investment And Business huB
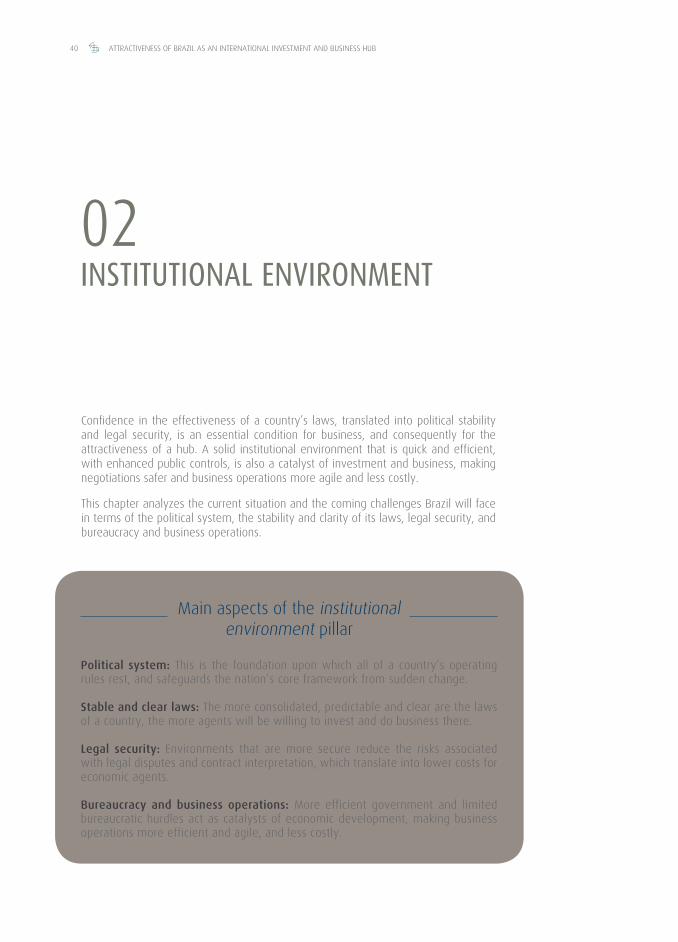
confidence in the effectiveness of a country’s laws, translated into political stability and legal security, is an essential condition for business, and consequently for the attractiveness of a hub. A solid institutional environment that is quick and efficient, with enhanced public controls, is also a catalyst of investment and business, making negotiations safer and business operations more agile and less costly.
this chapter analyzes the current situation and the coming challenges Brazil will face in terms of the political system, the stability and clarity of its laws, legal security, and bureaucracy and business operations.
02 institutional environMent
main aspects of the institutional environment pillar
Political system: this is the foundation upon which all of a country’s operating rules rest, and safeguards the nation’s core framework from sudden change.
stable and clear laws: the more consolidated, predictable and clear are the laws of a country, the more agents will be willing to invest and do business there.
Legal security: environments that are more secure reduce the risks associated with legal disputes and contract interpretation, which translate into lower costs for economic agents.
Bureaucracy and business operations: more efficient government and limited bureaucratic hurdles act as catalysts of economic development, making business operations more efficient and agile, and less costly.

AttrActiveness of BrAzil As An internAtionAl investment And Business huB 41
Political system
Brazil has had a stable, democratic, multi-party regime for over two entire decades. elec-tions are direct, regular and cast via electronic ballot, a safe, modern and quick system that has become a global reference. in addition, there are no signs of existing or potential conflicts between Brazil and its neighbors, ensuring an environment of international peace and political and economic collaboration. As a consequence, the perception of po-litical stability in Brazil, as published by the World Bank, is equivalent to that of the united states and Great Britain21, both with longstanding traditions of democracy.
the system can and should continue to improve. As an example of an important step, in november 2011 Brazil signed a law ensuring the right to access government data (freedom of information)22, in line with common practices in countries such as sweden, the us and france, as well as latin American countries such as colombia, Peru, chile and mexico23. this law requires that all spheres of government actively disclose information such as financial records, bid and tender procedures, and data on monitoring govern-ment agencies. in addition, any interested party may ask to see information produced by government bodies that is of public interest, with deadlines and penalties for non fulfill-ment of such requests. this measure opens the way to a more transparent public sector.
this positive agenda must continue to advance, especially the separation between mat-ters of state and the political interests of governments. examples of improvement might include topics such as the financial independence of regulatory agencies and the inde-pendence of mandates of the President of the Brazilian central Bank. regarding the for-mer, although there are legal provisions for this24, in practice budgets are determined by the respective ministry. the development of formal funding mechanisms would benefit regulatory activities, making regulators more independent of politics and their resources more stable and predictable25. regarding the latter, formalized fixed mandates that do not coincide to those of the nation’s president, as is the case in the us and the uK, would strengthen the central Bank’s autonomy to conduct monetary policy.
21 indicator: Political stability and absence of [political] violence, from 0 to 100. score: Brazil: 51; Great Britain:
58; united states: 56. source: World Governance indicators – World Bank
22 law 12,527/11
23 source: freedom of information - unesco
24 law that created each of the ten regulatory agencies in the country
25 source: Judgement #2,261/2011 of the Brazilian Audit court, in response to
a request of the Brazilian senate

42 AttrActiveness of BrAzil As An internAtionAl investment And Business huB
stable and clear laws
Brazil still faces challenges in the area of stable and clear laws. for instance, be-tween the time the federal constitution was issued in 1988, and 2011, an average of 19 federal laws26 has been issued each day. in 2011 alone, 1,781 new federal laws were signed27. this clearly makes it hard to keep up with applicable laws and standards, thus increasing the level of legal insecurity and the cost of investing and going business in the country.
there are other impediments related to the clarity of laws in Brazil. the technical quality of the wording of laws and standards must be improved, as well as enhanced control of their legality. for instance a 2009 study by fGv28 shows that 194 of the 218 articles of the Brazilian tax code - the main federal law governing the tax system - have been challenged in the superior court of Justice.
in addition to the legislative instability mentioned above, the frequent use of Provi-sional measures by the Brazilian executive Power as a legislative tool, and of so-called terminative decisions (a decision taken by a commission that counts as if voted in the senate Plenary) that result in some laws being approved without being submitted to the plenary, confer an undesired element of legislative uncertainty.
• Legal Security
the higher the degree of legal security, the fewer the uncertainties arising from court cases and contract interpretation, and consequently the lower the investment and business risk. it is important that Brazil stresses as a fundamental right29 the protec-tion of acquired rights, meaning that such rights persist even if the law granting them is no longer in effect. Another principle that is being included in the Brazilian legal framework that also has a positive influence on legal safety is the non retroactivity of a law, meaning that a law cannot influence situations that preceded it, unless it will benefit society.
the new Bankruptcy law, signed in 200530, is a good example of how legislative changes can improve legal security and benefit the investment and business environ-ment. the new law introduced the concept of judicial recovery in place of concordata (creditor protection), reducing the uncertainty regarding the assets at risk of liquida-tion, and the treatment of guarantees. consequently, the number of actual bankrupt-cies in Brazil dropped significantly. in 2005, before the new law was passed, 9.5 thou-sand bankruptcy requests were filed in Brazil, after the new law the annual average went down to 2.5 thousand (see Exhibit 6), and in 2011 was only 1.7 thousand, the smallest number in the past 12 years.
26 number of constitutional amendments, supplemental and ordinary laws, provisional measures, decrees and normative acts such as, for example, directives, opinions and instructions. source: instituto Brasileiro de Planejamento tributário (Brazilian tax Planning institute)
27 laws signed between october 2010 and october 2011 source: instituto Brasileiro de Planejamento tributário (Brazilian tax Planning institute)
28 source: valor econômico
29 fundamental guarantees described in the Brazilian constitution are considered “cláusulas pétreas” (in english, fixed clauses), meaning that they cannot be subsequently changed
30 law 11,101

AttrActiveness of BrAzil As An internAtionAl investment And Business huB 43
even with this good example, it remains important to reduce the long time it takes to resolve disputes and enforce court rulings. to invest and conduct business in a country it is not enough to have a legal framework that has legal security as a principle, it is also necessary that the defense of one’s rights not be a slow, lengthy process as this in itself penalizes the party whose rights have been violated.
A 2012 study by the World Bank ranks Brazil among the worst countries in the world when it comes to the time it takes to resolve a business dispute: 731 days, while in singapore an equivalent dispute would be resolved in 150 days (see Exhibit 7). the main reasons for this have to do with the different systems adopted by each country. in Brazil, the delay is primarily the result of the rules that govern the civil and penal process codes, which allow a large number of appeals, and the overly detailed consti-tution, which enables many cases to be submitted to the supreme court.
in recent years there have been important reforms, in attempts to resolve this prob-lem, both to reduce the volume of lawsuits as well as to facilitate the operation of the Judiciary system. regarding the first initiative, one could mention the introduction of binding precedents31 and the principle of general repercussion32 in 2006, and the limits imposed on repetitive special appeals33 in 2008. the creation of so-called special courts34 and Arbitration chambers35 has contributed to the reform of the Judiciary sys-tem. Another important step was the implementation in 2011 of goals for the Judiciary system, such as judging a larger number of cases in a year than were filed in order to reduce the backlog.
exhiBit 6ultimately, institutional reforms impact the population in a positive manner
1. Law 11,101/2005 / Source: Serasa Experian, BCG analysis
More coMpanies operating could Mean More jobs and increased value creation for society as a whole
2000 2001 2002 2003 2004 2005 2006 2007 2008 2009 2010 20110
5
2,5
10
15
20
25
with the new law created in 2005, the average number of bankruptcies each year dropped to 2.5 thousand
Average = 2.5 thousand (2006-2011)
13.9
11.6
19.920.7
13.9
9.5
4.2
2.7 2.2 2.4 1.9 1.7
Number of bankruptcy filings per year (thousand)
the new Bankruptcy law1 helped reduce the number of companies closing their doors in Brazil
-5.4
31 law 11,417
32 law 11,418
33 law 11,672
34 law 9,099 signed in 1995
35 law 9,307 signed in 1996

44 AttrActiveness of BrAzil As An internAtionAl investment And Business huB
exhiBit 7the time it takes to for rulings adds uncertainty to the operation of the Justice system
ruling: 480 dayssentence enforcement: 210 days
other: 41 days
SgP Hkg USA FRA JPN dEU AUS Uk CHN mEx CHl CAN BRA iNd
150
280 300 331 360 394 395 399 406 415480
570
731
1,420Number of days to resolve a commercial dispute
Note: The standard dispute used for this study is a transaction between two companies (the buyer and the seller) in which the buyer fails to pay for some of the goods claiming that the quality of the goods did not meet the agreed quality standards. The seller then files a lawsuit to collect the amount owed for the goods it sold / Source: Doing Business Report – World Bank – 2012
Brazil has one of the longest conflict resolution terms of any international center
the enforcement of guarantees is another important element of legal security. loans at lower interest rates are possible if there are no rules making it difficult for the credi-tor to recover an asset, as the associated risk is smaller. in Brazil, there are a number of hurdles for creating and enforcing guarantees, typically related to the rigidity of traditional guarantees, difficulty constituting guarantees and a slow judiciary. regard-ing the first point, the effectiveness of guarantees is diminished since in the judicial recovery of companies and bankruptcies both labor and tax creditors have preference over creditors with real guarantee rights such as mortgages and pledges, reducing the effectiveness of these instruments. furthermore, formally registering secured credi-tor agreements is a complex and costly process. As there is no standardization of the documents required for such agreements, the procedure is subject to the specificities and demands of each notary office.
to eliminate the existing hurdles, efforts are being made to make processes more flexible and diversify the instruments available, such as the expansion of the concept of fiduciary property, where goods and rights do not become a part of the borrower’s assets until they have been paid for in full. thus, the guarantee posted is not part of the judicial recovery process and, unless otherwise determined, there is no competi-tion with the other types of creditors. there are also advantages in enforcement, which no longer requires that the case go through ordinary proceedings, which reduces the steps in the procedure and thus the time it takes for creditors to recover their assets.
AttrActiveness of BrAzil As An internAtionAl investment And Business huB 45
Another theme that embodies legal security is respect for property, including intel-lectual property rights. A survey conducted by the World economic forum in 2012 puts Brazil in 51st place out of a list of 144 countries36. the reasons for this poor placing have to do both with the lengthy and costly patent application process, as well as the widespread practice of purchasing counterfeit (pirate) goods. in these two points there has been improvement. in 2011, Brazil was removed from the us list of “notorious piracy and contraband markets”37, and in fact is the only Bric not on that list, and the time it takes to get a patent has dropped to five years in 2011, compared to eight just one year previously38.
Bureaucracy and business operations
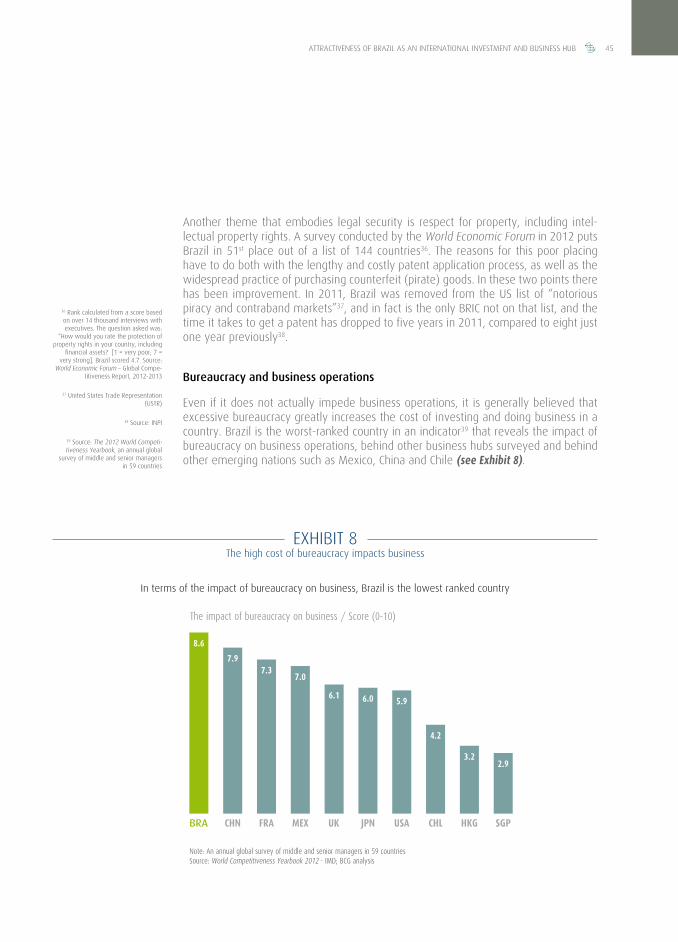
even if it does not actually impede business operations, it is generally believed that excessive bureaucracy greatly increases the cost of investing and doing business in a country. Brazil is the worst-ranked country in an indicator39 that reveals the impact of bureaucracy on business operations, behind other business hubs surveyed and behind other emerging nations such as mexico, china and chile (see Exhibit 8).
36 rank calculated from a score based on over 14 thousand interviews with executives. the question asked was:
“how would you rate the protection of property rights in your country, including
financial assets? [1 = very poor; 7 = very strong]. Brazil scored 4.7. source:
World economic forum – Global compe-titiveness report, 2012-2013
37 united states trade representation (ustr)
38 source: inPi
39 source: the 2012 World competi-tiveness yearbook, an annual global
survey of middle and senior managers in 59 countries
exhiBit 8the high cost of bureaucracy impacts business
in terms of the impact of bureaucracy on business, Brazil is the lowest ranked country
BRA CHN FRA mEx Uk JPN USA CHl Hkg SgP
8.6
7.97.3
7.0
6.1 6.0 5.9
4.2
3.22.9
The impact of bureaucracy on business / Score (0-10)
Note: An annual global survey of middle and senior managers in 59 countriesSource: World Competitiveness Yearbook 2012 - IMD; BCG analysis

46 AttrActiveness of BrAzil As An internAtionAl investment And Business huB
one consequence of excessive bureaucracy is that it creates opportunities for corrup-tion, as lengthier, more complex and costlier transactions create more room for the payment of favors for speedier resolution. reducing corruption is thus an additional advantage of reducing excessive bureaucracy in an investment and business hub.
one example of a long, slow process is the time it takes to open a business, which in several of Brazil’s state capitals requires a large number of steps and a very long time. the average time it takes in são Paulo, for instance, is around 119 days40. decentral-izing procedures is one of the issues most often mentioned to justify this situation, and the number of entities involved confirms this perception (see Exhibit 9).
in addition, according to the 2012 doing Business report, it takes an average of 469 days to get approval for a real estate development41 in the city of são Paulo, com-pared to an average of 221 days in other latin American and caribbean nations. in são Paulo there is currently a proposal to create a Balcão Único law, something akin to a “one-stop-shop” to centralize the analysis and instruction of applications made to the different municipal bodies. this would pave the way to reduce bureaucracy and thus enable investments and business to proceed more swiftly.
Although this is a problem in most Brazilian cities, numerous initiatives have dem-onstrated there is room for improvement and the entire process of opening a new business can be made more agile. in the state of minas Gerais, a joint effort by the state government and the boards of trade, known as the minas fácil program, has made great strides in simplifying the process to open a new business, which cur-rently takes eight days42. in addition, the integrar project is an initiative that seeks to
40 Based on the time it takes to open a 50 employee company with share capital equal to ten times the per capita GdP, constituted as a limited company. source: World economic forum’s 2012 doing Business report
41 the construction of an industrial warehouse was used as the basis for the study
42 source: minas fácil
exhiBit 9opening a business involves numerous agencies
decentralized proceedings is one of the problems most often mentioned as the reason for this
1. Foreign capital only 2. Applies only to businesses whose activities might impact the environment / Source: Doing Business 2012 - World Bank; RFOR Advogados; BCG analysis
Entities involved in opening a new business in Brazil
city
Applies to All
depending on the type of
business
state federal other
municipal Bureau of the treasury
municipal Government
Bureau of the state treasury BureauBoard of trade
caixa econômica federalfederal revenueministry of labor and employment
inss (social security)
industry Associations employee unions
Bureau of the environmentWorks inspector
fire Bureau
Bureau of the environment
central Bank1
iBAmA2 funAi2
AnvisA
industry Associations
AttrActiveness of BrAzil As An internAtionAl investment And Business huB 47
replicate the successful minas fácil model in the states of sergipe, Paraná, rondônia, roraima, tocantins, ceará, Pará and Paraíba, paving the way for rolling it out to the entire country in the future.
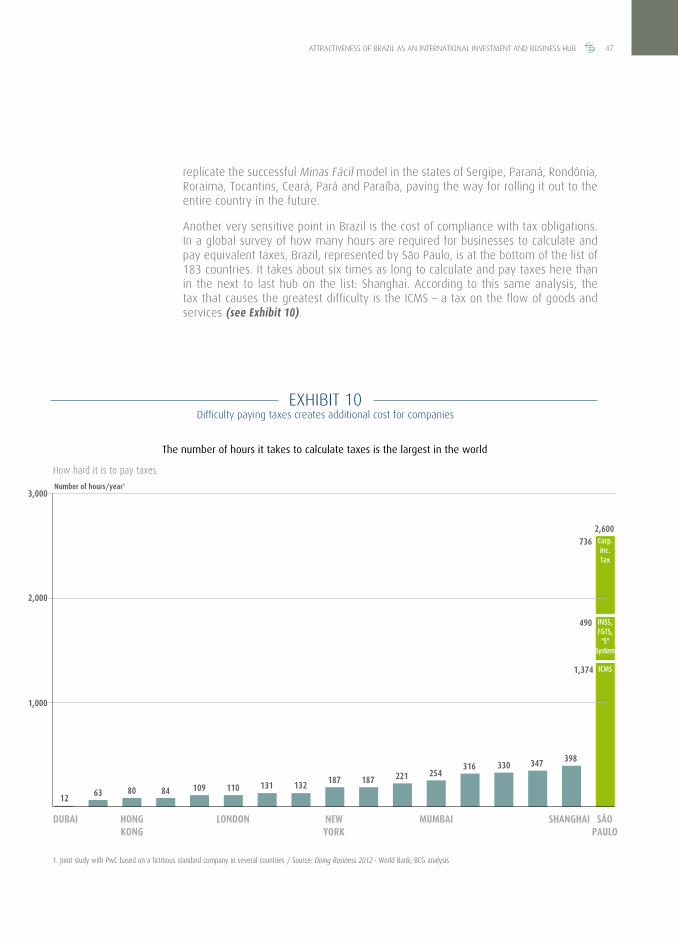
Another very sensitive point in Brazil is the cost of compliance with tax obligations. in a global survey of how many hours are required for businesses to calculate and pay equivalent taxes, Brazil, represented by são Paulo, is at the bottom of the list of 183 countries. it takes about six times as long to calculate and pay taxes here than in the next to last hub on the list: shanghai. According to this same analysis, the tax that causes the greatest difficulty is the icms – a tax on the flow of goods and services (see Exhibit 10).
SÃo PAUlo
mUmBAi SHANgHAiNEW YoRk
dUBAi HoNg koNg
loNdoN
the number of hours it takes to calculate taxes is the largest in the world
1. Joint study with PwC based on a fictitious standard company in several countries / Source: Doing Business 2012 - World Bank; BCG analysis
exhiBit 10difficulty paying taxes creates additional cost for companies
2,600
1,000
2,000
3,000Number of hours/year1
1263 80 84 109 110 131 132
187 187 221 254316 330 347 398
icMs
inss, fgts, "s"
system
corp. inc. tax
1,374
490
736
How hard it is to pay taxes

48 AttrActiveness of BrAzil As An internAtionAl investment And Business huB
the main factors influencing this poor position are the excessive number of taxes, changing laws and complexity in complying with the ancillary obligations required to pay taxes. According to the World Bank doing Business report, businesses in Brazil must pay a total of nine taxes, where as in other business hubs such as singapore and hong Kong this number is five and three43 respectively.
the issue of the large number of laws passed also applies to the tax system. As mentioned, this makes it hard to keep track of which federal laws are applicable, making it more likely for there to be gray areas that not only increase bureaucracy, but also contribute to greater uncertainty in the payment of taxes. in the case of non financial service providers, the requirements for calculating taxes such as the icms are even more complex. for financial institutions, the hardest taxes to calculate are iss, Pis and cofins.
it is worth mentioning that in the case of investments in funds, debentures or fixed yield instruments, the financial institution managing the investment is responsible for paying the tax, and the investor receives its investment net of taxes.
finally, another very important element to doing business in a country is the flexibility of its labor market. When it comes to matters specific to hiring employees, Brazil is among the least flexible nations, behind chile and the united states, for example. on the other hand, when it comes to dismissal process, Brazil does not do badly (see Ex-hibit 11). care should be taken, however, lest this position be weakened (for example the possibility that ilo convention 15844 may be adopted), so as to continue to be able to efficiently allocate people and pursue business.
even though Brazil faces a challenging situation in terms of bureaucracy, it is important to understand that efforts have and are being made, such as the creation of enAP, the national school of Public management, whose purpose is to develop competences in civil servants and improve the quality of government services, PnAfe, the national Program to support fiscal Administration in Brazilian states, which focuses on improv-ing tax issues, and mBc, the competitive Brazil movement, an entity that, among other responsibilities, has programs to modernize government administration. in addition to these initiatives, increased use of digital technologies has contributed to speedier interaction between the government and the private sector. An example of it would be the sPed – the Government system of digital Bookkeeping.
43 doing Business database, completed in december 2010
44 international labor organization convention 158 makes the termination process far more rigid and bureaucratic. if adopted its requirements include writ-ten justification as to why the employee is being let go submitted to the relevant authorities, the right to appeal against the decision, the inclusion of unions in individual termination decisions and lawsuits in the event of disagreements. only 35 of the 183 ilo member states have ratified the convention and only six of them are developed nations (Aus-tralia, finland, luxembourg, Portugal and spain). source: ilo
when It comes to matters specIfIc to hIrIng
employees, brazIl Is among the least flexIble natIons

AttrActiveness of BrAzil As An internAtionAl investment And Business huB 49
furthermore, models used in other countries could serve as an inspiration and be adapted to the situation in Brazil, such as the uK’s Better regulation executive, which improves the distribution of information to public agencies, reduces the number of registrations required and engages civil servants in understanding public services and processes to disseminate best practices.
exhiBit 11Brazil is not well positioned when it comes to flexibility of its labor market
Labor market flexibility (% countries in each situation)1
Termination notice (months) 2: 25% 1: 63% 0: 13%
Termination costs (weeks of work)3 0: 19%1 to 6: 25%8 to 11: 31%20 or more: 25%
Existence of reemployment rules yes: 31% no: 69%
Obligation to retrain or place before termination yes: 38% no: 63%
Need for third party approval yes: 13% no: 88%
Annual paid vacation (days) 21 to 30: 31% 11 to 20: 44% 10 or fewer: 25%
Overtime cost to the company (% over standard
cost per hour)100: 13% 02: 13%50: 56% 25 to 40: 19%
Maximum allowed duration of temporary
contracts (months)up to 24: 31%
60 or fewerunlimited: 63%6%
Temporary contracts are allowed for per-
manent activitiesno: 25% yes: 75%
1. Countries included in the assessment: BRA, MEX, CHL, USA, GBR, FRA, GER, SGP, HGK, CHN, JPN, IND, RUS, KOR, AUS, CAN 2. Not defined by law 3. Average based on employees with 5 years tenure in the different countries analyzed / Source: Doing Business 2012 – World Bank; BCG analysis
HiRi
NgEm
PloY
mEN
ttE
RmiN
Atio
N
degree of flexibility
- +

50 AttrActiveness of BrAzil As An internAtionAl investment And Business huB
Indicators
the dimensions selected for continuous tracking of the institutional environment pillar are:
• Political stability: normally the political situation has a major impact on the at-tractiveness of a country. thus a country that is more stable and democratic, free of political violence, will be more attractive;
• Quality of regulations: this indicator measures how clear a country’s regulations are and if there are clearly defined and understood roles for the regulators, with delega-tion of powers as necessary;
• Legal Security: this attempts to measure the certainty that the country’s laws will be enforced; in other words, it measure the effectiveness of the nation’s laws and rules. there is a direct relationship between legal insecurity and the cost to do business resulting from judicial disputes, dubious contract interpretation and the duration of lawsuits;
• Labor market flexibility: hubs located in countries with flexible labor markets tend to be more dynamic, as labor supply and demand are able to quickly adjust and come into balance. for this to happen it is important that companies may quickly hire and fire at relatively low cost. in addition, flexible models, such as the possibility of hiring hourly employees, make a business hub more attractive;
• Ease of opening a business: this illustrates part of the bureaucracy of doing busi-ness in a country, and takes into consideration not only the bureaucratic complexity of opening a business, but also the time required;
• How easy it is for businesses to pay taxes: this indicator calculates the hours required to pay value added taxes, taxes on industrial profit and income taxes for a model company operating in different countries. clearly, the easier it is to pay taxes the less time is involved and the lower the cost to the business, thus reducing the level of exposure to involuntary non compliance.
the following exhibit shows how Brazil compares to other countries along the dimen-sions of the institutional environment pillar:

AttrActiveness of BrAzil As An internAtionAl investment And Business huB 51
Although Brazil is ranked in the middle in the dimensions that reflect the institutional maturity of a nation: political stability, quality of regulations and legal security, it is more advanced than any other Bric, and in principle has the platform required to pro-vide an environment that favors international investment and business.
however, looking at the conditions that directly impact the proper development of its economy the country is lacking, as shown in the limited flexibility of its labor market and the difficulty to open a business and pay taxes.
1. DATA CANNoT Be UPDATeD FRoM THe 2011 ATTRACTIveNess RePoRT
MAIN INTeRNATIoNAL HUBs oTHeR DeveLoPeD NATIoNseMeRgINg NATIoNs
institutionAl environmentcritical needs improvement good excellent
jPN UsA HKggBR
sgP
RUs CHN
CHL
MeX FRA DeU
IND KoRQUALITy oF RegULATIoNs
BRA
2.
LegAL seCURITyjPN
KoR
HKg
sgP
gBR
CHLMeX INDRUs FRA
DeU
UsACHN
BRA
3.
LABoR MARKeT FLeXIBILITy1FRA KoR jPNDeU UsA sgPgBRCHLCHN
MeX HKgINDRUs
BRA
4.
jPN sgPgBR
HKgUsA
FRA
RUs
KoR
IND CHL
MeX
CHNPoLITICAL sTABILITy
DeUBRA
1.
eAse oF oPeNINg A BUsINess1
jPNKoR
UsA
sgP gBR
MeX
CHN INDRUs
CHL FRA
BRA
5.
How eAsy IT Is FoR BUsINesses To PAy TAXes DeU FRA
HKgUsAKoR gBR
sgPCHN CHL
RUsjPNMeX INDBRA
6.

52 AttrActiveness of BrAzil As An internAtionAl investment And Business huB
Conclusion
Brazil has consolidated itself as a strong, stable democracy, and should continue to progress towards improving its political system and the efficiency of the three federal spheres of power. in particular, the issues related to the instability of its laws and the slowness of its Judiciary are not new, and although there have been recent efforts to minimize these problems, the legislative process must evolve.
finally, it is essential to address the matter of excessive bureaucracy in Brazil, an area where the country is ranked poorly compared to other hubs, and that results in ad-ditional costs and wear and tear when doing business. in addition to leading to unde-sired sluggishness in business operations, bureaucracy also opens a dangerous door to corruption. legislative change is important and essential, but one must also change the mindset of the state, making it more dynamic and vigorous in its role as a provider of quality services. Businesses and citizens need quality services that fulfill their needs, in the same way as clients of the private sector. thus, if the existing ties are lifted, there is a great potential to improve the pace of doing business in the country, projecting Brazil even more as an attractive investment and business hub.
It Is essentIal to address the matter of excessIve bureaucracy In brazIl,
an area where the country Is ranked poorly compared to other hubs, and that results In addItIonal costs and wear and tear when doIng busIness

AttrActiveness of BrAzil As An internAtionAl investment And Business huB 53

54 AttrActiveness of BrAzil As An internAtionAl investment And Business huB
creating an investment and business hub necessarily requires human capital that can provide the manpower it needs to conduct and expand its activities, with both suffi-cient numbers and adequate quality.
Brazil departs from a solid and positive demographic platform, but when one looks at other characteristics such as quality of education and talent mobility, it is at a disad-vantage compared to other countries. According to the projected Global talent index for 2015, Brazil is only the 38th out of a list of 60 countries surveyed45 (see Exhibit 12). Because of these gaps, on a global basis businesses headquartered in Brazil have the third largest difficulty hiring people46.
03talent and huMan capital
45 not only are the demograph-ics of Brazil favorable, it also as an environment that fosters talent. source: heidrick & struggles Global talent index, published in 2011
46 survey of 39 countries. source: manpower 2011 talent shortage report
exhiBit 12in terms of its talent group, Brazil is ranked 38th out of 60 countries
brazil is ranked 38th out of 60 countries in the global talent Index projections for 2015
usAdenmark finlandsweden norway singaporeAustraliacanadaswitzerlandhong KongGermany israelnetherlands united Kingdomnew zealand
1.2.3.4.5.6.7.8.9.
10.11.12.13.14.15.
franceireland BelgiumtaiwanAustriasouth Koreaspain italy Japanczech republicchilePortugalPolandslovakiahungary
chinaArgentina GreecerussiaindiamexicorumaniaBrazil malaysiasaudi Arabiacolombia ukraine turkey Philippinesthailand
south Africa Peru egyptBulgariaecuadorvenezuelaKazakhstanvietnamPakistaniranindonesia sri lankaAlgerianigeriaAzerbaijan
16.17.18.19.20.21.22.23.24.25.26.27.28.29.30.
31.32.33.34.35.36.37.38.39.40.41.42.43.44.45.
46.47.48.49.50.51.52.53.54.55.56.57.58.59.60.
the main gaps in brazil are talent training/education and mobility
Quality of compulsory education
Quality of teaching in universities and business schools
Quality of the workforce
mobility and openness of the local job market
Ability to attract talent fromother countries
32nd
44th
39th
55th
22nd
talent training/
education
talent mobility
Source: Global Talent Index Heidrick & Struggles, published in 2011
AttrActiveness of BrAzil As An internAtionAl investment And Business huB 55
Demographics
from a demographics standpoint, Brazil is at a significant advantage as it is experiencing what is known as the demographic bonus47, meaning that the workforce is relatively larger than the dependent population48. Because of this larger supply of workers, there is a window of opportunity that fosters the development of the nation’s economy.
furthermore, Brazil is the world’s largest economy with an economically Active Population (eAP) growing fast enough to supply the expected demand for labor49. numbers updated for 2011 through 2023 from a study originally published by the Boston consulting Group and the World economic forum50, show that in all countries with economies that are currently larger than Brazil’s, meaning the united states, china, Japan, Germany and france, the increase in the demand for labor will outpa-ce supply (see Exhibit 13).
47 source: Growing old in an older Brazil, 2011 - World Bank
48 A period of demographic transition where the ratio of dependent people, meaning those younger than 15 and older than 60, per person of working
age (15 to 59) reaches a minimum. this ratio has declined since 1965, and will
reach a minimum in 2020, at which point it will start to climb up
49 the supply and demand analyzed under demographics are purely
quantitative; in other words, manpower qualification and training not considered.
model excludes those currently unemployed
50 source: stimulating economies through fostering talent mobility,
published in 2010
main aspects of the talent and human capital pillar
Demographics: the availability of an economically Active Population (eAP) deter-mines the raw material for educating and training a country’s labor force.
education and training: in order for a country to become an investment and busi-ness hub there must be a set of talents that is qualified and aligned with the needs of the labor market.
Talent mobility: countries that are more open to the inflow of foreign workers are more readily able to meet fluctuations in the demand for professionals, leveraging the supply of qualified human capital in other countries for sectors where there may be a shortage of qualified local labor.
this analysis explores the three main elements that go into creating a set of talents: demographics, education and training, and mobility.

56 AttrActiveness of BrAzil As An internAtionAl investment And Business huB
Given a global scenario anticipating a shortage of labor, it is expected that in the near future businesses will make efforts to be less dependent on local talent and take mea-sures to attract global workers, which may even include a change of location for access to qualified workers (see Exhibit 14).
thus, an initiative capable of ensuring an environment that fosters the permanence of talents in Brazil must be developed to avoid depleting this nation’s economy because of widespread global competition.
education and training
education and training in Brazil are further challenges to businesses in search of ta-lents. this translates into additional expenses to train staff, and is closely linked to the quantity and quality of education. While the quantity of workers in the country is a competitive advantage, the quality of their education and training is a challenge that must be addressed.
1. The values presented here represent the annual increase in the demand for labor minus the annual growth of the economically active population. Refers to an average of economic scenarios during and outside crisis periods. Annual growth figures for 2011 through 2023 are calculated / Note: the data submitted is based on a quantitative vision and do not reflect qualitative factors (e.g.: qualification) / Source: Based on Stimulating Economies through Fostering Talent Mobility, BCG and the World Economic Forum, published in 2010, using more up-to-date data
exhiBit 13Brazil is the world’s largest economy where the balance between the supply and demand for labor is positive
BRA2.2%
mEx1.3%
SPN-2.2%
FRA-0.9%
CHN-2.4%
tUR -0.1%
idN0.6%
CAN-0.3%
JPN-1.5%koR
-1.6%
USA -0.7%
dEU -1.3%gBR
-0.5%
AUS -0.4%
zAF 1.1%
iNd 0.7%
EgY1.6%
itA -1.6%
Labor shortage1 Limited deficit or surplus1 Increase in labor1average difference the increase in demand and supply of economically active people
difference in the rate of growth of the supply and demand for labor1 - 2011-2023
RUS -0.9%

AttrActiveness of BrAzil As An internAtionAl investment And Business huB 57
6
in 2009, net enrollment51 in primary school52 in Brazil was 87%, which is close to the world average. the net enrollment in secondary school53 was 69%, also quite close to the world average but far from universal. net enrollment in higher education drops to 27%, which is below the global average of 40%54 (see Exhibit 15).
the picture painted here shows that the country must still evolve in terms of the quan-tity of secondary and higher education, even though quite a bit of progress has been made over the past decades. Alphabetization in Brazil went from 30% in 1930 to 90% in 200955, and the number of students enrolled in primary and secondary school went from 1 million to 39 million over this same period56.
51 the enrollment or matriculation rate is calculated as the number of school age
children enrolled in school divided by the total population in that age bracket
52 According to the international standard classification of education this
refers to the number of 6 to 10 year olds enrolled in the 1st to 5th grade of
primary school
53 source: unesco – 2009 data
54 According to the international standard classification of education this
refers to the number of 11 to 17 year olds enrolled in the 6th to 9th grade of
primary school and in secondary school
55 source: 2010 census, iBGe
56 source: 2011 Primary education school census, ineP
Increase in labor1
exhiBit 14Businesses will shape their strategies around the search for talent
2007 2010 - 2015
companies are expected to reduce their local recruiting ...
north aMerica1
latin aMerica2
europe3
africa4
eMerging asia5
developed asia6
pacific region7
81
44
52
39
82
59
70
52
72
41
78
62
% companies pointing tolocal recruiting as key
...increase international recruiting...
22
48
27
57
33
60
22
64
25
52
23
56
20
60
% companies pointing tointernational recruiting as key
...and relocate in search of talents
7
18
11
25
16
38
9
19
3
14
% companies that would considerrelocating to find talents
1. USA and Canada 2. Brazil, Argentina and Chile 3. Germany, France, Russia, UK, Italy, Czech Republic, Denmark, Spain, Ireland, Netherlands, Switzerland, Belgium 4. South Africa 5. China and India 6. Singapore, Japan and South Korea 7. AustraliaSource: BCG People Advantage Report – 2008 and 2010
81
52
22
32
8

58 AttrActiveness of BrAzil As An internAtionAl investment And Business huB
regarding the quality of the education and training available in Brazil, the scenario is far less favorable. the average score of Brazilian students in the 2009 PisA57 test was 401 out of 600 in reading, mathematics and science, lower than the average for all countries included in the test, which was 497 for the oecd countries and 468 for all countries evaluated. in addition, the average Prova Brasil/saeb58 score of students in the public school system is at the lower end of the expected range in the basic education years, and below the expected range in the secondary school years (see Exhibit 16).
Another indicator of the quality of teaching in Brazil is the ideb (Índice de desenvol-vimento da educação Básica or Basic education development index) created by ineP (instituto nacional de estudos e Pesquisas educacionais Anísio teixeira) in 2007, and measured every two years. the ideb complements the results of Prova Brasil/saeb with data on academic performance (passing, failing and abandonment) in primary and secondary school. results are measured on a scale of 0 to 10, with 10 being the best score. Although the proposed goals for secondary school have been met, and those for primary school surpassed, ideb scores remain low and uneven. in 2011 the average score for students in the first five years of primary school was 5.0, while the target was 4.6, the same as in 2009. the average score for students at the end of primary school (9th grade), was 4.1 in 2011. the goal was 3.9, also the same score as in 2009. secondary school students did not perform as well, scoring an average of 3.7, even though they did meet the target. Primary school performance has progressed only modestly, with scores climbing only 0.1 percentage point every two years.
57 source: Programme for international student Assessment: a test applied every three years by the oecd to 15 year old students (equivalent to the 9th grade) in 65 countries. the results of the 2012 PisA exam had not been disclosed at the time this report was written
58 Average scores in math and Portu-guese in the tests applied to public school students in Brazil - saeb (Basic education Assessment system) up to 2005, and the Prova Brasil between 2005 and 2011. data refers to the last year in each school cycle
exhiBit 15the country is close to the world average in primary education, but must still evolve, in particular at the secondary and higher levels
primary education secondary education higher education
Net matriculation1 amongschool aged children - % in 2009
Net matriculation1 amongschool aged children - % in 2009
Total matriculation rate2 amongschool aged children - % in 2009
1. Excludes matriculated students no longer of school age 2. Includes individuals not of school age / Note: Average for countries in the study. For Brazil IBGE and Ministry of Education data was used rather than the UNESCO numbers, which are currently being reviewed / Source: PNAD 2009 micro-data – IBGE, Ministry of Education, World Bank, BCG analysis
99
80
60
40
20
JPN CHl BRAmEx
83
69
top 10: 95
70
125
100
75
50
25
JPNCHl BRAmEx
top 10: 77%
5959
2727
100
80
60
40
20
JPN CHl BRAmEx
10098
94
87top 10: 99
global average: 89
100
global average: 71
global average: 40

AttrActiveness of BrAzil As An internAtionAl investment And Business huB 59
exhiBit 16the quality of primary education in Brazil is critical
brazil’s performance in primary and secondary education is poor
Average scores2 for primary school children in Brazil
0
220
1995 1997 1999 2001 2003 2005 2007 2009 2011
1995 1997 1999 2001 2003 2005 2007 2009 2011
240
260
280
300
320
340
average1
average1
expected average: 201 - 325Primary education is performing at the lower edge of the expected range
255
235247
Average scores2 for secondary school children in Brazil
0
300
400
500expected average: 326 - 500
secondary school students are performing below expectations
286
264 271
CHiN
A4
577
HoNg
koN
g
546
SiNg
APoR
E
SoUt
H ko
REA
543
JAPA
N
541
CANA
dA
529
AUSt
RAli
A
519527
gERm
ANY
510
UNit
Ed k
iNgd
om
500
FRAN
CE
497
USA
496
RUSS
iA
468
CHil
E
439
mEx
iCo
420
BRAz
il
ARgE
NtiN
A
brazil performs poorly in the international pIsa test
Average PISA3 score - 2009
despite its poor performance, Brazil had the third best improvement
among the 65 participating countries
oECd average: 497
1. Average scores in Math and Portuguese 2.Saeb (Basic Education Assessment System) up to 2005 and the Prova Brasil applied to children enrolled in public school between 2005 and 2009. Data refers to the last year in each teaching cycle 3. Programme for International Student Assessment – OECD applied to 65 countries in 2009 – OECD + invited nations 4. Shanghai participants / Source: Ministry of Education; OECD; IMD; BCG analysis
396401

60 AttrActiveness of BrAzil As An internAtionAl investment And Business huB
Also of interest is the difference between the scores of public and private school stu-dents, although one must remember that in this case the indicator is sample based only. Average scores for students in the first five years of education enrolled in private schools were 6.5, compared to 4.7 for public school children. the difference among students in grades 6 through 9 was 6.0 vs. 3.4, and among secondary schools scores were 5.7 for private schools and 3.4 for public schools, revealing the need to invest even more in public education.
looking at the gap in primary and secondary education, it should not come as a sur-prise that this has an impact on higher education. one example is the outcome of the General course index, an index used by the Brazilian ministry of education to measure the quality of the country’s institutes of higher learning: 91%59 of the colleges and universities analyzed were rated between 1 and 3 on a scale where 1 is the worst score and 5 the best. it is not only the quality of higher education in general that is lacking, but also its alignment with what the market needs, as shown in a survey of executives conducted by the imd60, where Brazil is fifth from the bottom of a list of 59 countries. Also contributing to this mismatch are the teaching of foreign languages, also not aligned with market needs, and the international flow of students, which is below international averages (see Exhibit 17).
however, the outlook going forward is more favorable. there are numerous public and private initiatives designed to improve the quality of labor in Brazil. An important milestone was defined in 2009, when the state’s obligation to provide free education to children aged 4 to 1761 was included in the federal constitution, to be implemented gradually through 2016. however, implementation details in the form of the national education Plan are still being discussed by the legislative.
the Brazilian Government has also taken steps to increase the number of openings in public technical schools and universities, with programs such as reuni (Program to support the restructuring and expansion of federal universities), and scholarship programs such as PronAtec (national Program to foster Access to technical schools) and Prouni (university for All). PronAtec is a federal government initiative created in 2011 - it offers financially disadvantaged secondary school students, the unemployed and others receiving any type of social assistance from the Government scholarships and funding for technical education. Prouni was designed for students from househol-ds with per capita incomes of less than three minimum wages, and offers full or partial scholarships to private colleges or universities. the program was responsible for more than 195 thousand scholarships in the first half of 2012. student loans are another ally in the search to expand access to higher education, for instance through fies, the fund to finance higher education students.
some industry sectors have taken the initiative and created specific programs. one exam-ple is the oil & Gas industry, which created ProminP62, which by 2011 had already trained over 81.5 thousand persons, and should train another 200 thousand workers by 2013.
59 data for 2010. Percentage calculated based on the institutions scored. source: ministry of education
60 the 2012 World competitiveness yearbook, an annual global survey of middle and senior managers in 59 countries
61 the constitution also ensures access to education to all those who were deprived of it at the appropriate age
62 the Program to mobilize the domestic oil and natural Gas market, created by decree 4,925 of 2003

AttrActiveness of BrAzil As An internAtionAl investment And Business huB 61
exhiBit 17internationalization of talent education and training in Brazil is low and does not meet market needs
the market considers that language education in brazil is inadequate
education in brazil has very limited international scope
BRAzil
JAPAN
BRAzil
iNdiA1
mExiCo1
CHiNA
CHilE
JAPAN
USA
gERmANY
CANAdA
FRANCE
HoNg koNg
UNitEd kiNgdom
AUStRAliA
RUSSiA
UNitEd kiNgdom
CHiNA
mExiCo
SoUtH koREA
iNdiA
CHilE
FRANCE
USA
HoNg koNg
gERmANY
CANAdA
SiNgAPoRE
3.7 0.2
0.2
0.2
0.4
1.2
1.4
2.3
3.5
4.1
4.8
6.1
6.3
12.1
3.9
3.9
4.4
4.4
4.6
4.6
5.6
5.6
5.8
6.3
7.1
7.6
7.8
8.4
group average: 3.2group average: 5.6
Alignment between foreign language education and market requirements - score of 0 (lowest) to 10 (highest)
International student flows - incoming and outward per thousand inhabitants
1. Data on inbound students not available for India, Mexico and Singapore 2. Data for 2009Note: An annual global survey of middle and senior managers in 59 countriesSource: World Competitive-ness Yearbook - IMD; BCG analysis
Inbound2 Outward2
RUSSiA 1.3
SoUtH koREA 3.6
SiNgAPoRE 3.9

62 AttrActiveness of BrAzil As An internAtionAl investment And Business huB
At the state level, one should highlight an education network launched in são Paulo in 2011, a joint effort with the federal institute for education, science and technology in são Paulo, and centro Paula souza, combines secondary and technical education and by 2014 should have benefited 450 thousand students63. centro Paula souza focuses on higher and professional education and has over 226 thousand students enrolled in technical courses. it has become a reference for talent education and training that is aligned with industry needs.
on the side of private enterprise numerous nongovernmental organizations whose mission is to promote better education and training in Brazil should be mentioned, such as movimento todos Pela educação (everybody for education movement), the Ayrton senna and unibanco institutes, the Bradesco foundation, the ciee – centro de integração empresa-escola (center for integration Between Businesses and schools) and the Amigos da escola (friends of the school) project. At the higher education level, non profits such as fundação estudar (study foundation) and instituto ling award scholarships64 that help accelerate the training of the qualified people a Bra-zilian investment and business hub needs. lastly, some companies such as totvs e infosys act as a bridge with academia and train people with the knowledge they need to perform their jobs.
to insert Brazil’s professionals into a global context, universities in Brazil are signing international exchange agreements. the eu’s erasmus program is an example of the type of initiative that could further the international integration of Brazilian students, especially within latin America.
Talent mobility
Brazil has become more attractive to international talents, which is positive for any investment and business hub, and particularly useful for Brazil at this time, as it has immediate problems training and qualifying the manpower it needs. this increased attractiveness was revealed in the 2012 imd65 survey, in which Brazil now ranks num-ber 12, up 15 positions from the 2010 survey, when it was ranked 27th (see Exhibit 18).
most of the workers entering the country are highly educated and come primarily from europe, the usA and Japan. this movement is the result of the positive outlook in Brazil and the global crisis that is driving companies to invest in countries such as Brazil, shifting their talents to take advantage of existing opportunities.
63 source: state of são Paulo education Bureau
64 the program recom-mends that those who receive scholarships donate the amount they received to ensure the sustainability of the initiative
65 the 2012 World competitiveness yearbook, an annual global survey of middle and senior managers in 59 countries
AttrActiveness of BrAzil As An internAtionAl investment And Business huB 63

64 AttrActiveness of BrAzil As An internAtionAl investment And Business huB
however, one should point out that there is still no Government initiative to attract these talents, and that there are bureaucratic hurdles that must be overcome to enter the country, and the visa granting process is complex, slow and costly. Because of this, many companies in Brazil are forced to keep positions open for a long period of time, as they are unable to find qualified people within the country and cannot easily bring in workers from abroad.
current legislation reflects the perception that foreign workers take positions that could be filled by Brazilians. however, if we look from another perspective, welcoming fo-reign professionals could contribute to knowledge sharing, improving the country’s productivity and slowing down a possible wage inflation process due to a shortage of workers, in a positive process known as the brain gain.
exhiBit 18the increase in the country’s attractiveness to international talent and the number
of visas granted reflect Brazil’s improved position in talent mobility
1. Brazil’s position relative to the other countries assessed regarding the following statement: “Highly specialized professionals are attractive by the country’s business environment”, initially on a scale of 1 to 6 subsequently transformed to a scale of 0 to 10 to enable country ranking. 57 countries were selected in 2008 and 2009. 58 in 2010 and 59 in 2011 and 2012 2. Temporary visas for work onboard seagoing vessels and other authorizations such as specifically for events or professional training were not included. These numbers do not include humanitarian visas granted by the National Immigration Board, and visas for foreign spouses (legal or common law) of Brazilian nationals. / Source: World Competitiveness Yearbook - IMD; Ministry of Labor and Employment
Permanent temporary visas with a 2-year work contract in Brazil
technical service or technology transfer
the survey shows that in 2011-2012 brazil became more attractive to international talent1
the number of long and medium term work visas granted increased at an annual rate of 15% between 2008 and 2011
Number of work visas issued2 (thousand)
total number of visas
(thousand)
BRAzil
2009 2011 20122008 2010
26th 26th 27th
18th
12th
3.7%
32.0%
14.0%
CAgR ‘08-’11
+15%
15.4
44.02008
2.4
2.0
11.0
42.9
13.7
2009
2.2
2.5
9.0
56.0
2010
18.0
2.2
3.5
12.3
70.5
2011
23.6
2.7
4.6
16.3

AttrActiveness of BrAzil As An internAtionAl investment And Business huB 65
the Government also makes no effort to manage the other end of the spectrum, kno-wn as the brain drain, or domestic talents who have left the country. there is no orga-nized network to stay in touch with the over three million Brazilian expatriates, unlike countries such as india and chile. Well managed, such a network could convince ta-lents to return to Brazil, bringing with them financial resources and intellectual capital.
the Australian program is an example of a successful strategy to attract talent. the country continuously discloses the list of professionals for which there is a shortage, and facilitates the entry of such talents into the country. canada and the united King-dom have similar systems, adopting a system of points for work visas, which balances the expertise of immigrants with what the country requires.
Given the challenges foreign professionals willing to work in Brazil currently face, the Presidential Bureau of strategic Affairs (secretaria de Assuntos estratégicos) is designing a fast-track project to facilitate and accelerate the process to grant visas to qualified workers. one possible path Brazil might pursue to take advantage of increa-sed talent mobility is to map its short term manpower shortages and simplify the im-migration procedures for such professionals, and at the same time develop initiatives to proactively attract the type of manpower it needs.
Indicators
the dimensions selected for continuous tracking of the talent and human capital pillar are:
• Demographic contingent: this is an estimate of the economically active population (eAP) compared to the estimated demand for labor in each country. this indicator will reveal if there are enough people (human raw material) to build a talent pool – the larger the surplus increase in the eAP compared to the expected demand for profes-sionals, the better it will be for a hub;
• Quantity of primary and secondary education: this measures the initial level of qualification a country’s talent pool or, in other words, if everyone gets basic education;
• Quality of primary and secondary education: An education has no value if it is not a quality education. therefore this indicator tries to measure the quality of the basic education offered;
• Quantity of higher education: this measures the next level in the qualification of the country’s talent pool in the form of the enrollment rate in colleges and universities;
• Alignment between higher education and the market: this measures the extent to which the content of higher education, both technical and university, is aligned with what the market demands of its professionals. the greater the degree of alignment, the more attractive the country;

66 AttrActiveness of BrAzil As An internAtionAl investment And Business huB
• Internationalization of the country’s education (foreign languages and expe-rience): this indicator measures two components that go into making an education international – exchange between nations, and the alignment between the teaching of foreign languages and the needs of the market. A more international education and training will result in a talent pool that is better prepared and qualified to serve the needs of an international hub;
• Availability of qualified managers and engineers: this indictor measures if there are enough qualified managers and engineers, the two types of professionals that businesses thinking of establishing themselves in the country will demand;
• Intensity of research and development: this measures how much research and development is done in the country, and how much of it is associated with the creation of intellectual capital, which in itself helps make a hub attractive. this is measured by the number of people working in research and development as a percentage of the total population;
• Country attractiveness to international talent: this indicator reveals the percep-tion of executives in each country and is based on the results of a survey of how attractive the country is to international professionals;
• Talent immigration complexity: this measures how easy or difficult it is for foreign professionals to enter the country, bringing international knowledge and experience to the country, and also filling temporary gaps in specific qualifications within the domestic talent pool;
• Diaspora management: this shows if there are measures in place to manage the country’s citizens dispersed throughout the world. for a hub, managing the diaspora is key, as expatriates are potential talents who could return to the country or promote their country of origin in the markets in which they are working.
the following exhibit shows how Brazil compares to other countries along the dimen-sions of the talent and human capital pillar:
the country has an urgent need to address the educatIon and traInIng of Its populatIon

AttrActiveness of BrAzil As An internAtionAl investment And Business huB 67
tAlent And humAn cAPitAlcritical needs improvement good excellent
FRA DeUgBRHKg sgPRUsCHL CHNINTeNsITy oF ReseARCH AND DeveLoPMeNT8.
BRAIND
KoR
jPN
DeU CHL RUsgBRDIAsPoRA MANAgeMeNT11.
BRA
sgP HKg IND
FRA
sgP HKg
RUs
CHLCHNAvAILABILITy oF QUALIFIeD MANAgeRs AND eNgINeeRs7.
BRA
UsA
KoR INDDeU gBRjPN
KoR
jPN
gBRDeU FRA
RUs
IND MeXCHNDeMogRAPHIC CoNTINgeNTP1.
BRAUsA
DeU
gBR jPNRUs
IND
MeX
CHLCHNQUANTITy oF PRIMARy AND seCoNDARy eDUCATIoN2.
BRAHKg UsA sgP FRA
KoR
FRA DeU HKgKoRjPNRUsMeX CHL CHNQUALITy oF PRIMARy AND seCoNDARy eDUCATIoN13.
BRA
sgPUsA gBR
FRADeU HKg
gBR
KoRjPN RUsIND MeXCHN
CHLQUANTITy oF HIgHeR eDUCATIoN4.
BRAsgP UsA
FRA DeUUsA sgPKoR
RUs
IND
MeX
CHN CHLALIgNMeNT BeTweeN HIgHeR eDUCATIoN AND THe MARKeT5.
BRAgBR HKgjPN
FRA DeUgBR HKgsgPjPN KoR
RUs
INDCHLCHNINTeRNATIoNALIzATIoN oF THe CoUNTRy’s eDUCATIoN (FoReIgN LANgUAges AND eXPeRIeNCe)
6.
BRAUsA
MeX
KoR DeUFRA
gBR sgP
RUs
IND
CHN CHLCoUNTRy ATTRACTIveNess To INTeRNATIoNAL TALeNT9.
BRAMeXjPN
HKg
UsA
KoR FRA
HKg
CHLjPN CHN MeXRUs sgPTALeNT IMMIgRATIoN CoMPLeXITy10.
BRA
UsA
gBRINDDeU
P: INDICAToR BAseD oN PRojeCTeD DATA 1. DATA CANNoT Be UPDATeD FRoM THe 2011 ATTRACTIveNess RePoRT
MAIN INTeRNATIoNAL HUBs oTHeR DeveLoPeD NATIoNseMeRgINg NATIoNs
in this pillar, Brazil stands out primarily for its demographic contingent and because it is increasingly able to attract international talent, as the nation offers favorable condi-tions in a world economic scenario that is still uncertain.
however, in other dimensions Brazil is in positions that are either “critical” or “need development”, with a gap between the country and other investment and business hubs. this poor position in some dimensions highlights the country’s urgent need to address the education and training of its population, with particular emphasis on the quality of the education offered and its alignment with the demands of the market and of an investment and business hub.

68 AttrActiveness of BrAzil As An internAtionAl investment And Business huB
Conclusion
Brazil’s demographics is potentially a key element to consolidate the country’s posi-tion as an investment and business hub. however, capturing this advantage requires long-term-strategic planning that must be implemented almost immediately, with initiatives focused on training the labor force and, most importantly, providing quality education and training to the population.
While clearly the nation is willing to address this matter, the delay in approving the national education Plan (submitted in 2010) and quality goals that are quite timid may keep Brazil from evolving as it aspires to, holding it back at a level that is lower than what it needs to ensure growth.
regarding talent mobility, Brazil is capturing more attention from foreign professionals. this could be an opportunity to close gaps in the immediate demand for professionals, help train local manpower and halt the disproportional increase in wages resulting from the shortage of qualified labor force. the Brazilian Government’s agenda has been considering how to take advantage of foreign and qualified labor force. reforms are necessary to attract immigrants and not waste this window of opportunity.
the delay In approvIng the natIonal educatIon plan (submItted In 2010) and qualIty goals that are quIte tImId may keep brazIl from evolvIng as It aspIres to, holdIng It back at a level that Is lower than what It needs to ensure growth

AttrActiveness of BrAzil As An internAtionAl investment And Business huB 69

70 AttrActiveness of BrAzil As An internAtionAl investment And Business huB
04physical infrastructure
A physical infrastructure able to capture the advantages of a country and not im-pose additional costs to those investing and doing business in it is essential for creating a vibrant hub.
this pillar provides an overall analysis of the level of investment in physical infrastruc-ture in Brazil, and is segmented into the following elements: urban mobility, logistics connectivity, telecommunications and basic services.
main aspects of the physical infrastructure pillar
Urban mobility: An investment and business hub requires that people are able to easily travel between the main cities, reducing time and cost.
Logistics connectivity: the larger the number of connections, the more dynamic and vibrant an economy is, and more easily it will be able to provide for the flow of goods and people.
Telecommunications: currently a good telecommunications network is essential to make a country more attractive. it is virtually impossible to build a solid service based economy, and thus an investment and business hub, without a structure that can handle increasingly large information flows quickly at cost effectively.
Basic services: these are the availability of power, water and basic sanitation, and constitute the minimum standards required for people and businesses to establish themselves in a country.

AttrActiveness of BrAzil As An internAtionAl investment And Business huB 71
relatively speaking, Brazil needs even more investment, as it is behind other hubs and developed nations. furthermore, such investments would be an important contribution to increasing the Gross domestic Product (see Exhibit 19).
exhiBit 19infrastructure investments increase the potential for growth of the Brazilian economy
Infrastructure has a measurable impact on brazil’s economic growth
Projected growth scenarios for Brazil’s economy between 2011 and 20201 vary based on how much is invested in this country’s infrastructure
1
1
2
3
4
5
6
7
0 2 3 4 5 6 7
optimistic scenario used for the study1
Base case scenarioused for the study1
scenario at the current level of investment
gRoWtH oF tHE BRAziliAN ECoNomY BEtWEEN 2011 ANd 2020 – % PER YEAR
totAl iNvEStEd iN iNFRAStRUCtURE% oF BRAzil’S gdP
1. Scenarios based on forecasts made by the Morgan Stanley Bank / Source: Morgan Stanley’s Paving the Way, published in 2010; press survey; BCG
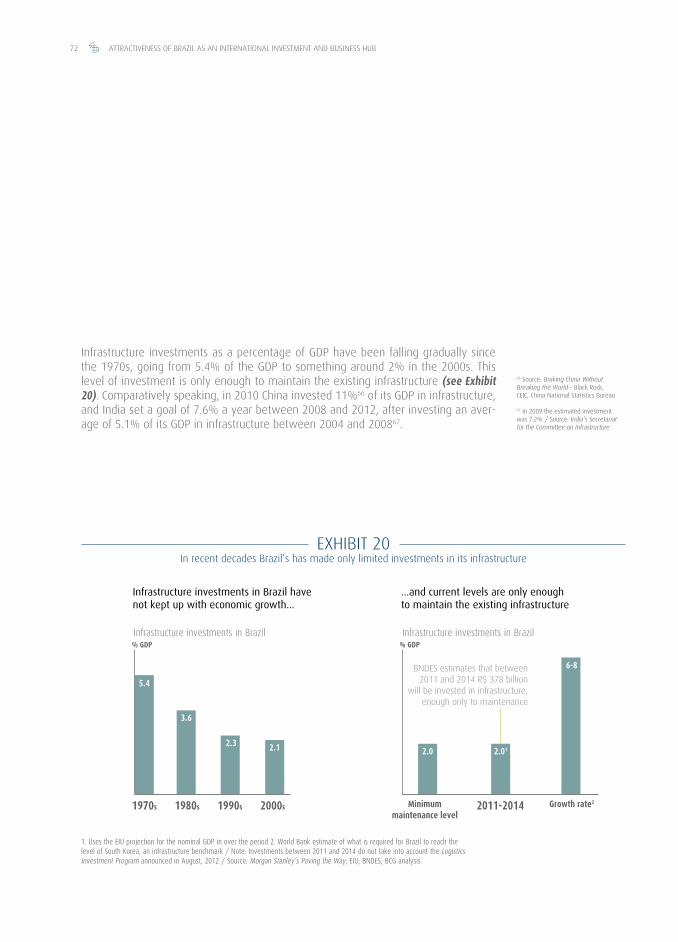
72 AttrActiveness of BrAzil As An internAtionAl investment And Business huB
infrastructure investments as a percentage of GdP have been falling gradually since the 1970s, going from 5.4% of the GdP to something around 2% in the 2000s. this level of investment is only enough to maintain the existing infrastructure (see Exhibit 20). comparatively speaking, in 2010 china invested 11%66 of its GdP in infrastructure, and india set a goal of 7.6% a year between 2008 and 2012, after investing an aver-age of 5.1% of its GdP in infrastructure between 2004 and 200867.
66 source: Braking china Without Breaking the World - Black rock, ceic, china national statistics Bureau
67 in 2009 the estimated investment was 7.2% / source: india’s secretariat for the committee on infrastructure
exhiBit 20in recent decades Brazil’s has made only limited investments in its infrastructure
Infrastructure investments in brazil have not kept up with economic growth...
...and current levels are only enough to maintain the existing infrastructure
% gdP % gdPInfrastructure investments in Brazil Infrastructure investments in Brazil
1. Uses the EIU projection for the nominal GDP in over the period 2. World Bank estimate of what is required for Brazil to reach the level of South Korea, an infrastructure benchmark / Note: Investments between 2011 and 2014 do not take into account the Logistics Investment Program announced in August, 2012 / Source: Morgan Stanley’s Paving the Way; EIU; BNDES; BCG analysis
5.4
3.6
2.12.32.0 2.01
6-8
1970s 1980s minimum maintenance level
1990s 2011-20142000s growth rate2
Bndes estimates that between 2011 and 2014 r$ 378 billion
will be invested in infrastructure, enough only to maintenance

AttrActiveness of BrAzil As An internAtionAl investment And Business huB 73
this low level of investment has clearly impacted the country’s current infrastruc-ture, which is inadequate across the board. Brazil is ranked poorly in international rankings comparing the infrastructure of different countries, such as the one pub-lished by the economist intelligence unit, in which Brazil is the 25th in a list of 60 countries (see Exhibit 21).
1. Countries with the same score are ranked in the same position. Nigeria, the last country on the list, is in 38th position / Source: EIU
exhiBit 21Brazil’s physical infrastructure is ranked 25th out of a list of 60 countries1
Colo
mBi
A
BRAz
il
RUSS
iA
mEx
iCo
CHil
E
ARgE
NtiN
A
SoUt
H ko
REA
HoNg
koN
g
UNit
Ed k
iNgd
om
JAPA
N
CANA
dA
AUSt
RAli
A
gERm
ANY
SiNg
APoR
E
FRAN
CE
USA
FiNl
ANd
8.5 8.57.8
7.06.6
6.2 6.0 6.0 5.9
9.0 9.09.09.3 9.29.49.49.6
eIu infrastructure score: 0 (minimum) - 10 (maximum) - 2011
Average: 8.1
dENm
ARk
1st 4th 7th
19th3rd 7th
10th
24th
25th2nd 5th
10th
22nd3rd 7th
14th
25th
26th
9.7
Infrastructure Investments as a percentage of gdp have been fallIng gradually sInce the 1970s, goIng from 5.4% of the gdp to somethIng around 2% In the 2000s. thIs level of Investment Is only enough to maIntaIn the exIstIng Infrastructure

74 AttrActiveness of BrAzil As An internAtionAl investment And Business huB
Box Bthe 2012 airport concessions are an attempt to attract private
enterprise to reduce the nation’s infrastructure bottlenecks
in early 2012, the operation of three of the country’s main airports was handed over to private enterprise: cumbica (são Paulo), viracopos (campinas) and Jus-celino Kubitschek (Brasília), which together handle over 50 million passengers a year. the average premium paid for the airport concessions was 348%, and the Government collected some r$ 24 billion in these transactions.
An important step to enable airport concessions was the creation of the civil Aviation Bureau in 2011, which is responsible for, among other things, formula-ting civil aviation policies, was an important step to enable airport concessions.
these measures signal the Brazilian Government’s commitment to addressing the infrastructure bottlenecks, as well as the interest of the private sector in investing in this sector. other airports such as Galeão (rio de Janeiro) and con-fins (Belo horizonte) should also be auctioned either as concessions or public--private partnerships.
note: the concession for the são Gonçalo do Amarante (rn) was granted in 2011
source: federal Government, infraero, AnAc, press clippings, BcG analysis
the infrastructure scenario is so unfavorable that the theme has become quite impor-tant on this nation’s agenda. one example is the Government’s PAc 2 (Accelerated Growth Program #2) announced for 2011 – 2014. this program calls for Government and private investments in infrastructure totaling r$ 955 billion. According to the 4th Balance statement issued for PAc 2, by June 2012 34% of this had already been invested. the program includes improvements in energy, transportation and basic ser-vices, among others.
however, the shortage of resources and fiscal austerity limit public investments in infrastructure. Given this, and the need to maintain a prudent macroeconomic policy, it is essential to attract private investors to close this structural gap.
early in 2011 concessions were granted for three major airports: cumbica (são Paulo), viracopos (campinas) and Juscelino Kubitschek (Brasília), for an average premium of 348%. Before this, in 2011, the concession for the são Gonçalo do Amarante airport in rio Grande do norte had been purchased at auction for 229% above the minimum price (see Box B).

AttrActiveness of BrAzil As An internAtionAl investment And Business huB 75
Box cconcessions and Public-Private Partnerships (PPPs)
as a means to enable infrastructure investments in Brazil
Public-Private Partnerships (PPPs) emerged following the 1970s oil crisis as a respon-se to the state’s diminished ability to finance major works.
A PPP is a concession agreement for a specified period of time between, on the one hand, a private entity that is responsible for designing, building, developing and run-ning an enterprise of public interest and, on the other hand, the state, which shares the risks and ensures a previously agreed rate of return. Between 1985 and 2011 PPPs funded 1,969 projects around the world, with a total investment of some us$ 774 billion. in latin America, us$ 88.5 billion were invested in 289 projects.
Because of the shortage of government funds, PPPs and concessions present a viable option to close Brazil’s infrastructure gap.
there are numerous examples of successful PPPs around the world, such as roads in Portugal, inter-city roads in chile and investments in water and sanitation in france. in Brazil there are road concessions in the state of são Paulo, as well as concessions for ports and electricity generators and distributors.
PPPs offer flexibility to allow private enterprise to invest in areas where their parti-cipation in the past has been timid, such as healthcare, education and public safety. for instance the first prison complex built as a PPP is going up in the state of minas Gerais. this 3,000 inmate facility should be inaugurated in 2012.
source: 2010 international survey of Public-Private Partnerships – Public Works financing; Bndes, press clippings, BcG analysis
in addition to these initiatives, in August 2012 the Brazilian Government launched its logistics investment Plan, based primarily on attracting private enterprise to the road and railroad sectors68.
the road and rail program calls for building 7.5 thousand kilometers of roads, using a model where the concessionaire is selected based on the lowest toll rate charged. Another 10 thousand kilometers of railroads should be built using PPPs, and will provide an attractive option for the transportation sector (see Box C). in all, over the next five years some r$ 23.5 billion should be invested in roads and r$ 56.0 billion in railroads. the tender documents to enable these projects are expected to be pub-lished between late 2012 and early 2013, and the corresponding contracts should be signed by the middle of 2013.
68 Plans for the port and airport sectors had not yet been disclosed when this
report was issued

76 AttrActiveness of BrAzil As An internAtionAl investment And Business huB
Based on the main requirements of an investment and business hub, infrastruc-ture can be split into four main categories: urban mobility, logistics connectivity, telecommunication and basic services. these are discussed below using the matrix shown in Exhibit 22.
exhiBit 22elements of physical infrastructure shall be addressed based on their importance for a hub and their level of development
analyses focused on the most important categories and those with the slowest development
HIGH
LOW
ACCEPTABLE DEFICIENT
CRITICAL
DeFICIeNTe
importance for a business hub
level of development in Brazil (focus on sP and rio)
4. BASiCSERviCES (PoWER, WAtER ANd SANitAtioN)
1. URBAN moBilitY
Source: BCG analysis
2. CoNNECtivitYlogiStiCS
3. tElECom

AttrActiveness of BrAzil As An internAtionAl investment And Business huB 77
Urban mobility
são Paulo and rio de Janeiro are Brazil’s two main business centers, accounting for about 30% of the country’s population and 44% of its GdP69, yet both have significant gaps in urban mobility. são Paulo is the sixth worst city in the world according to the 2010 iBm traffic congestion index70, with an average of 114 kilometers of congested streets each day in 200871. rio de Janeiro is not far behind, with an average of 95 kilometers72 of traffic congestion during rush hours.
the problem is even more critical because of the limited availability of subway lines. on a per capita basis, são Paulo and rio have less than half the amount of subway lines as do mexico city, london, Beijing and shanghai, all of them with similar popula-tion densities. Both cities are working hard to address this gap: são Paulo expects to increase its subway lines from the current 74 kilometers to 104 kilometers by 2014, and to 200 kilometers by 2018. rio, with only 42 kilometers of subway lines, will ex-tend this to 55 kilometers by 2015.
Logistics connectivity
Below we find the logistics connectivity analyses that, for a purpose of simplicity, have been limited to the rio-são Paulo axis and to air, road, port, rail and waterway connections:
• Each day some 115 flights connect São Paulo and Rio de Janeiro73, far more than the 70 daily flights between new york and Washington d.c.74. 1,300 flights connect são Paulo to the world each week, almost the same number as chicago, Beijing and mexi-co city. however, the airports serving são Paulo and rio de Janeiro are overloaded, and even with the recent concessions and planned works, increases in capacity may not be enough to relieve the situation in these airports over the short term75 (see Exhibit 23);
• road connections within the states of são Paulo and rio de Janeiro are abundant and of relatively good quality, despite a few maintenance problems they share with the rest of the country. According to the 2011 survey by the national transportation federation (confederação nacional de transportes), 78.8% and 65.9% of the roads in são Paulo and rio de Janeiro, respectively, are considered good or excellent;
69 source: iBGe
70 this index is made up of variables such as time taken to get to work, perception
of worsening traffic, stress caused to drivers and negative impact on work
71 calculated as the average traffic during the morning and evening rush hours. source: nossa são Paulo observatory
72 source: metropolitan rio de Janeiro urban transportation master Plan
73 the main airports serving these cities are: rio de Janeiro international Airport/Galeão – Antônio carlos Jobim
(GiG), santos dumont Airport (sdu), são Paulo international Airport/
Guarulhos – Governador André franco montoro (Gru), congonhas Airport/são
Paulo (cGh), viracopos international Airport/campinas (vcP)
74 data for June 4 - 10, 2012. source: oAG database
75 With the exception of the rio de Janeiro international Airport/Galeão

78 AttrActiveness of BrAzil As An internAtionAl investment And Business huB
• Nine sea ports connect são Paulo and rio de Janeiro to other parts of the world. in 2011 these ports handled 46% of all the containers in Brazil76. however, they have cost and efficiency bottlenecks, as do the ports elsewhere in the country. in an at-tempt to address this weakness, the Brazilian Government has been taking measures to improve and expand existing port facilities. in addition, the private sector has plans to build ports such as the sudeste and Açu ports in the state of rio de Janeiro, in which some r$ 5 billion will be invested77 headed by the eBx conglomerate. outside the rio-são Paulo axis vale announced it has initiated studies to build the espadarte Port in the state of Pará to ship its iron ore output;
• rail connections in Brazil are limited for a country of this size, and highly concen-trated in the southeast. A serious problem affecting the Brazilian rail network is that there are different gauges, making continuity difficult and requiring transfer stations. in 2011, changes were implemented in the railroad regulatory framework to improve the existing network. Among other measures the new regulations require that rail concessionaires grant other rail operators right of way and to use their infrastructure for a price78, which could make the sector more competitive.
76 calculated based on total weight. source: national Waterway transpor-tation Agency (Agência nacional de transportes Aquaviários – Antt)
77 source: mmx and llx investor relations web page
78 source: Antt resolutions 3,694, 3,695 and 3,696 of 2011
exhiBit 23the airports in são Paulo and rio de Janeiro are overloaded, and planned expansions may not be sufficient
already the main airports are operating above capacity... ... and the improvements planned may not be sufficient
Capacity utilization in number of passenger per year / nominal capacity - % Passenger capacity by 2014 - million
CUmBiCA(SP)
CUmBiCA(SP)2
CoNgoNHAS (SP)
S. dUmoNt (RJ)
gAlEÃo(RJ)
gAlEÃo(RJ) 2
83%
100%
140%
146%
three of the four main airports in são Paulo and rio de Janeiro are already overloaded
the plans do not include any buffer for peak hours1
S. dUmoNt (RJ)3
18 8
1815
CoNgoNHAS (SP)3
12 3
22
8
21 14 35
26
15
40
Additional capacity by 2014
current capacity
estimated demand by 2014 - million
1. 20 to 40% spare capacity is recommended to accommodate demand in peak periods 2. Based on IPEA projections 3. Total demand in Brazil has been calculated at 191 million passengers per year - demand breakdown by airport based on the current breakdown. This is not a final analysis but is merely a scenario simulation / Source: IATA; Infraero; Federal Audit Court; IPEA; BCG analysis
99

AttrActiveness of BrAzil As An internAtionAl investment And Business huB 79
79 2011 inland navigation statistics, national Waterway transportation
Agency (Agência nacional de trans-portes Aquaviários)
80 source: 2012 Brazilian telecom Atlas
81 out of a total of 5,565 cities and towns
82 source: telco
furthermore, the logistics investment Program mentioned above calls for a public-private partnership model for new rail lines, with the Brazilian Government contract-ing the construction and maintenance of new lines, and management in charge of valec, a state owned company that would offer the right of way to interested play-ers. revenue from this operation would be use to complement the remuneration of the railroad builder;
• Although waterway transportation thrives in Brazil (25 million tons in 2011), currently this means is used only for commodities and other basic materials79. it is important to stimulate this modal so that more types of merchandise are transported by waterway, relieving other means of transport.
focusing specifically on the são Paulo - rio de Janeiro axis, logistics connections in gen-eral are poor, with quite significant bottlenecks. the initiatives pointed out here follow the path of offering solutions to these problems, however these are long term projects and require continuous monitoring to ensure they proceed on spec and without delay.
Telecommunications
the states of são Paulo and rio de Janeiro are fully covered by fixed and mobile te-lephony services80. furthermore, with the exception of a few gaps in the areas farthest from the major urban centers, both states offer their populations good broadband in-ternet coverage. it is worth mentioning, though, that by 2011 2,625 cities81 and 83.2% of the population already had 3G coverage82.
telecommunications coverage is therefore an important item to highlight. in this case the shortcomings of both states are primarily related to the quality of the mo-bile services offered and the prices charged, which are quite high compared to other countries (see Exhibit 24).
At the country level, in 2012 the Government adopted severe measures regarding the quality of the services provided by mobile telephony operators, and has tightened its control over the industry to improve quality of service. in June 2012, the country’s four main operators purchased 4G frequencies at a government auction for some r$ 2.5 billion. the 4G network should become operational sometime in 2013, and while it should not change the competitive environment, it will make more advanced services available to the population.

80 AttrActiveness of BrAzil As An internAtionAl investment And Business huB
857
767
exhiBit 24Brazil has a good telecom platform and clear opportunities for improvement
1.0
0.9
1.3
0.8
1.0
0.9
1.9
2.3
0.0
0.3
0.5
0.1
0.3
0.1
0.3
0.2
0.4
mobile telephony costs in brazilare higher than the world average
Cost of a 3 minutelocal call during peak hours - US$, 2010
HoNg koNg
iNdiA
RUSSiA
gERmANY
mExiCo
CHiNA
SiNgAPoRE
CHilE
AUStRAliA1
USA
SoUtH koREA
UNitEd kiNgdom
ARgENtiNA
CANAdA
JAPAN2
BRAzil
FRANCE
average: 0.7
actual connection speeds are lower than what the operators sell
Speed sold by the operators
769
873
551
873
661
371
1Q10
2Q10
3Q10
4Q10
1Q11
2Q11
3Q11
4Q11
1,024
1. 2008 data 2. Data collected from local sources and converted using the average exchange rate for the year. Considers the average cost for a three minute call charged by four operators: NTT, KDDI, SoftBank Mobile and iMobileSource: Teleco; Akamai; ITU; Japan’s Ministry of Communications, EIU; BCG analysis
Actual data transmission speeds - Kbps

AttrActiveness of BrAzil As An internAtionAl investment And Business huB 81

82 AttrActiveness of BrAzil As An internAtionAl investment And Business huB
Basic services
Between 2000 and 2002 Brazil experienced power rationing and rolling blackouts for a number of reasons, among them the absence of planning and investment in the electricity sector, and an extended period of drought, critical for the Brazilian power matrix which is heavily dependent on hydro plants. As a result, the electricity sector increased its planning efforts, including new regulations, power auctions and projects for new hydro and thermal power plants83.
the availability of basic services such as water and sanitation is satisfactory in Brazil’s urban centers. According to a 2010 World Bank report, Brazil is close to developed na-tions in access to potable water, and close to other emerging nations and better than the other Brics when it comes to basic sanitation coverage (see Exhibit 25).
Source: World Bank; BCG analysis
exhiBit 25Access to water and basic sanitation in Brazil is close to benchmark levels
97
97
98
98
99
99
100
100
100
100
100
100
100
100
100
100 100
100
100
100
100
100
100
100
100
98
85
74
74
91
87
58
Access to sanitationAccess to clean water
iNdiA
mExiCo
ARgENtiNA
CHiNA
RUSSiA
BRAzil
CHilE
gERmANY
AUStRAliA
CANAdA
SoUtH koREA
UNitEd kiNgdom
SiNgAPoRE
USA
FRANCE
JAPAN
% urban population
83 According to the Government’s plans disclosed in the 10-year energy Plan published by empresa de Pesquisa ener-gética, through 2020 electricity supply should exceed demand by 6 to 10%
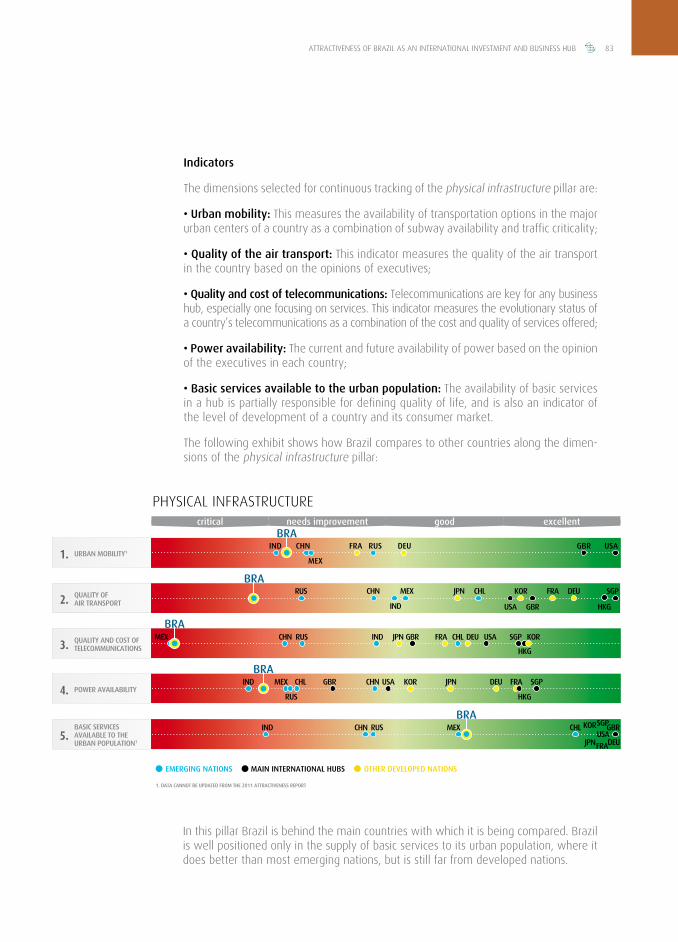
AttrActiveness of BrAzil As An internAtionAl investment And Business huB 83
PhysicAl infrAstructurecritical needs improvement good excellent
PoweR AvAILABILITyKoR jPN DeU FRAgBR
HKg
sgPCHNMeX CHL UsAIND
RUs
BRA
4.
BAsIC seRvICes AvAILABLe To THe URBAN PoPULATIoN1
CHN gBRsgP
FRAjPN
KoRUsA
DeU
MeXIND RUs CHLBRA
5.
FRA DeU gBRRUsIND
MeX
CHNURBAN MoBILITy1
BRAUsA
1.
jPN KoR FRA DeU
gBRUsA HKg
RUs CHN
IND
CHLMeXQUALITy oF AIR TRANsPoRT
sgPBRA
2.
QUALITy AND CosT oF TeLeCoMMUNICATIoNs
jPN DeUFRA KoRsgPgBRCHNMeX INDRUs
HKg
UsACHL
BRA
3.
1. DATA CANNoT Be UPDATeD FRoM THe 2011 ATTRACTIveNess RePoRT
MAIN INTeRNATIoNAL HUBs oTHeR DeveLoPeD NATIoNseMeRgINg NATIoNs
Indicators
the dimensions selected for continuous tracking of the physical infrastructure pillar are:
• Urban mobility: this measures the availability of transportation options in the major urban centers of a country as a combination of subway availability and traffic criticality;
• Quality of the air transport: this indicator measures the quality of the air transport in the country based on the opinions of executives;
• Quality and cost of telecommunications: telecommunications are key for any business hub, especially one focusing on services. this indicator measures the evolutionary status of a country’s telecommunications as a combination of the cost and quality of services offered;
• Power availability: the current and future availability of power based on the opinion of the executives in each country;
• Basic services available to the urban population: the availability of basic services in a hub is partially responsible for defining quality of life, and is also an indicator of the level of development of a country and its consumer market.
the following exhibit shows how Brazil compares to other countries along the dimen-sions of the physical infrastructure pillar:
in this pillar Brazil is behind the main countries with which it is being compared. Brazil is well positioned only in the supply of basic services to its urban population, where it does better than most emerging nations, but is still far from developed nations.

84 AttrActiveness of BrAzil As An internAtionAl investment And Business huB
however, in the other indicators Brazil ranks as “critical” or “needs development”. ur-ban mobility is poor and, in those dimensions where perceptions were measured, such as the quality of air transport, the quality and cost of telecommunications and power availability, the country is not attractive in relative or absolute terms.
Conclusion
After decades of limited investment in its physical infrastructure, Brazil now has ma-jor bottlenecks in all areas important for a business hub. the two main cities – são Paulo and rio de Janeiro – do not offer suitable urban transportation, the nation’s railroad network is proportionately small, its ports are still inefficient, waterway flows are limited and the airports of both of these cities are already operating well above their capacity.
this scenario would be even more serious were it not for the outlook for improve-ments going forward. today the Brazilian Government is clearly committed to ad-dressing these bottlenecks, in particular regarding the country’s transportation infra-structure, given its increasingly latent shortcomings. the recent concession of three important airports and the logistics investment Program announced in August 2012 are clear evidence of the Government’s determination to attract private enterprise as an effective option for addressing these bottlenecks. Already clear opportunities for investment in the coming years have arisen, which in itself is an advantage. finally, these investments should also make a positive contribution to positioning Brazil as an investment and business hub.
brazIl Is ranked well - above most emergIng countrIes - regardIng the offer of basIc servIces to the urban populatIon
AttrActiveness of BrAzil As An internAtionAl investment And Business huB 85

86 AttrActiveness of BrAzil As An internAtionAl investment And Business huB
05 financial infrastructure
A strong and robust financial infrastructure that is capable of offering security and suitable financing terms is essential for an international investment and business hub.
Brazil starts out from a solid position in this pillar: the regulation of the financial system is recognized internationally in rankings of competitiveness such as those published by the World economic forum and the imd. this solid position may also be attributed to the regulation and oversight of specific segments such as derivatives, an area where it is a reference for other nations due to centralized negotiation and registration (see Box d). in addition, Brazilian banks increasingly stand out globally due to their solidity. for example, in 2012, two banks headquartered in Brazil were ranked among the World’s 20 strongest Banks84. furthermore, the Brazilian financial system has remained profit-able, despite the recent financial crisis (see Exhibit 26).
main aspects of the financial infrastructure pillar
Direct benefits of a financial infrastructure:• Funding the economy: if a country offers the credit instruments businesses
require, it will be more attractive for investments and business and foster the international expansion of its multinationals.
• Efficient resource allocation: Widespread availability of risk management ins-truments reduces uncertainty and makes business operating costs more predictable.
Indirect benefits of a financial infrastructure: the financial industry also contribu-tes indirectly, in the form of taxes and jobs. it also stimulates specialized professio-nal services such as auditing, legal counsel, information technology and consulting.
84 source: Bloomberg

AttrActiveness of BrAzil As An internAtionAl investment And Business huB 87

88 AttrActiveness of BrAzil As An internAtionAl investment And Business huB
Box dBrazil as a reference of a solid, regulated financial market
one often hears that Brazil came through the 2008 financial crisis relatively uns-cathed. this is due not only to the country’s solid macroeconomics, but also to the organization and regulation of its financial industry. there are balanced rules and re-gulations in place that weigh the dichotomy between security and flexibility neces-sary for market development. examples of reference regulations in Brazil include:
• investment funds are closely monitored by the regulator, for instance they are required to disclose their current portfolio positions within at most three months. this makes it much harder for fraudulent schemes such as the madoff affair to take place in Brazil;
• derivative transactions are centrally recorded in the ced (central de exposição a derivativos or derivatives exposure center). if authorized, a company’s position in these transactions may be checked, conferring increased transparency to the market and avoiding potential overexposure. the us and the uK are developing systems inspired on this model;
• stock exchange transactions in Brazil have a central counterpart, ensuring transaction settlement and the security of the parties involved;
• in Brazil, the risk of intermediary insolvency does not compromise the trans-fer of funds to complete transactions. these payments use Brazilian central Bank reserve currency (settlement in central bank line), and the amounts involved are not included in the bankrupt estate even if they are still in the hands of the in-termediaries;
• the country demands that their banks have a Basel index of 11%, higher than the 8% required worldwide. in April 2012 the average Basel index for banks in Brazil was 16%, a solid position. furthermore, the central Bank has analyzed and has full confidence in the ability of Brazil’s financial institutions to comply with Basel iii requirements as of 2013, which demand stricter composition of capital requirements and increase the minimum Basel index to 13%.
considering that in this regard Brazil starts out at a high level, below is a more granular analysis of the existing strengths and opportunities to continue to enhance Brazil’s already solid financial infrastructure and reap the direct and indirect benefits provided by a robust financial infrastructure, in particular as they relate to Brazil as an invest-ment and business hub.

AttrActiveness of BrAzil As An internAtionAl investment And Business huB 89
exhiBit 26Brazil has a strong financial system that compares well with that of developed nations
1. Among the world’s main banking systems assessed in a BCG’s survey entitled “Cre-ating Value in Banking” 2. TSR: Total shareholder returns, comprised of capital gains and dividends 3. In US$ / Note: TSRs always calculated in local currency / Source: 2012 BCG report entitled “Creating Value in Banking”; EIU; BIS; World Bank; Standard & Poor’s; World Federation of Exchanges; BCG analysisemerging nations developed nations
bank shareholder returns are higher than in developed economies1
100
200
300
400
Variation in the stock exchange index3
2005 2006 2007 2008 2009 2010 20112004
USA
RUSSiA
mExiCo
iNdiA
CHiNA
BRAzil
JAPAN
index 2004=100
of the world’s main economies, brazil’s stock market has offered the greatest returns since 2004
tSR2 2007–2011 p.y. (%)
iNdoNESiA
ColomBiA
CHilE
mExiCo
iNdiA
BRAzil
SiNgAPoRE
CHiNA
HoNg koNg
RUSSiA
USA
UNitEd kiNgdom
gERmANY
FRANCE
JAPAN
-5.9
-5.5
-4.5
-0.3
6.2
6.2
10.2
10.3
14.1
20.2
-23.5
-21.3
-19.4
-16.3
-13.8

90 AttrActiveness of BrAzil As An internAtionAl investment And Business huB
exhiBit 27corporate funding has increased significantly in Brazil in recent years
Direct benefits a financial infrastructure offers a hub
the direct benefits of a financial infrastructure have been split into two main groups: funding the economy and efficient risk allocation.
Funding the economy
looking at some of the types of financing used by businesses, we find these have evolved greatly in recent years (see Exhibit 27). Bank credit, including both free funds and Bndes directed lines, has grown at 15% a year in real terms since 2004, more than doubling in the period. capitalization of companies listed on the Bm&fBovesPA increased 43% between 2004 and 2007, and has been essentially stable since then.
the only exception is the market for private debt (such as debentures), which in Brazil is still a little used funding mechanism. Private debt socks in Brazil amount to only some r$ 4 billion, quite low compared to corporate credit. it has also grown at only 4% a year or so in real terms.
the stock exchange grew through 2007, and had a slight drop ever since
Market cap of the companies listed on the BM&FBOVESPA exchange2 (R$ B)1
2004 2005 2006 2007 2008 2009 2010 2011
8461,073
1,512
2,488
1,362
2,335 2,3982,225
+43%
-3%
free credit directed credit (Bndes)
business (pj) credit has grown significantly in brazil
Inventory of business (PJ) credit in Brazil (R$ B)1
2004 2005 2006 2007 2008 2009 2010 2011
1. Based on December 2009 values, adjusted using the IGPM 2. On the last business day of the yearSource: Brazilian Central Bank; BIS; Central Banks and other institutions in the individual countries; Bloomberg
+15%
414476
543635
789898
9611,073
38%37%
35%32%
30%37%
39%39%
62% 63%65%
68% 70% 63% 61% 61%
the same is true for debentures, although they have grown at a slower pace
Brazilian inventory of debentures (R$ B)1
2004 2005 2006 2007 2008 2009 2010 2011
16 15 17 18 1920 19 20
+4%

AttrActiveness of BrAzil As An internAtionAl investment And Business huB 91
however, falling interest rates over the years, with the lowest levels being reached in 2012, have made more room for this type of funding mechanism to grow, both because the implicit spread is smaller, and because investors are looking for options offering higher yields than government bonds.
looking at the ratio between these funding mechanisms and the country’s GdP, a comparison with other countries shows there is room for growth in Brazil, as it lags behind countries such as the us, china and france in terms of corporate credit and debentures. the only position in which Brazil is aligned with most other countries in-cluded in the survey is the market cap of its traded companies (see Exhibit 28).
As right now the Brazilian Government’s agenda includes the search for increased investment, especially in physical infrastructure, there is a need to keep expanding and improving measures to develop the financing options available in the country. the Government has been taking specific measures to stimulate infrastructure (see the chapter on physical infrastructure) and research and development projects, especially by taking measures to reduce the tax burden.
Listed company market caps3/ 2011 GDP
UNitEd kiNgdom
USA
CHiNA
SoUtH koREA
iNdiA
FRANCE
BRAzil
gERmANY 35%
37%
48%
51%
54%
87%
99%
125%
exhiBit 28the different types of corporate funding available in Brazil remain below global benchmarks
1. 2011 data 2. Free and directed/BNDES resources account for 15% and 9% respectively 3. On the last business day of the year / Note: Data has been revised wince the previous reportSource: Brazilian Central Bank; BIS; Central Banks and other institutions in the individual countries; Bloomberg; EIU
Inventory of business credit/ 2010 GDP
CHiNA1
USA
FRANCE
iNdiA
gERmANY
UNitEd kiNgdom
BRAzil
SoUtH koREA
24%2
29%
15%
30%
32%
32%
40%
76%
94%
0.8%
0.4%
1.1%
9.4%
9.6%
9.9%
21.6%
36.5%
Debenture inventory/ 2011 GDP
SoUtH koREA
USA
FRANCE
gERmANY
CHiNA
iNdiA
UNitEd kiNgdom
BRAzil

92 AttrActiveness of BrAzil As An internAtionAl investment And Business huB
• Bank credit: Although bank credit has expanded in recent years, barriers for further growth remain, the most important being the relative short loan terms and structural factors that drive up market spreads (see Exhibit 29). A system of positive credit ratings would help further bank credit. such a system is incipient and in the regulation phase, and is expected to help measure the default rate and the spread charged of those who pay their debts on time (good payers). in addition to further regulation, the existence of positive credit ratings and what they are should be disclosed, as consumers must give their permission before their name is added to such lists.
•Debentures: the debentures market in Brazil is not yet well developed, as shown in Exhibit 28. the main reason is that until recently, debentures competed with govern-ment bonds, as these offered high interest rates, lower risk and increased liquidity.
exhiBit 29terms and structural factors influence spreads and limit credit
23%
57%
19%
1%
< 1 year administrative costs
default
taxes and compulsory loans
net residue (profit)
Working capital (~16 months)
other 1-2 years
> 2 years
Breakdown of business (PJ) credit by loan term1,2 Breakdown of the spread in Brazil3
2011 2010
13%
29%
26%
33%
1. Dec/2011. Only credit transactions using free resources that are interest rate references – excludes BNDES, leasing, etc. 2. < 1 year: Secured Accounts; Vendor; Trade receivables discounting, ACC and other; 1-2 years: External transfers, import finance, loans to purchase assets (and working capital); > 2 years: Mortgages 3. According to the Brazilian Central Bank Report on Credit and the Banking Economy (2010). Based on the calculation methodology used in 2008. This study does not distinguish personal (PF) and business (PJ) loans / Source: Brazilian Central Bank

AttrActiveness of BrAzil As An internAtionAl investment And Business huB 93
falling interest rates should make debentures more attractive, nevertheless a struc-tured program is required, involving the regulator and private initiative to ensure a simpler, more efficient issuing process, increased liquidity in the secondary market and a larger base of investors and issuers. the Brazilian Government has introduced important measures for this, such as lower taxes and institutional changes, allowing monetary correction in periods of less than a year, modernizing one of the provisions imposed by the real Plan (see Box E).
Box eincentivizing secondary market liquidity in domestic debt markets
law #12,431, converted from Provisional measure 517, was signed in June 2011 in or-der to encourage long term financing. this was an important step for developing private debt instruments in Brazil, and for enhancing the liquidity of the secondary debt market.
this law introduced the following regulatory changes:
• it reduced the income tax rate on the income earned by foreigners investing in Brazilian private bonds to zero;
• it waived the 30-day iof (tax on financial transactions) on private debt1 transactions;
• it allows issuers to buy debentures back for an amount larger than their face value in the event of an increase in value;
• Private debt bonds may be monetarily corrected at the same interval as that stipulated for interest, even if this period is less than one year;
• changes in Brazil’s corporate (s.A.) law allow bonds to be issued in amounts higher than the share capital of the issuer. thus special Purpose enterprises (sPes) need not be capitalized to issue debentures;
• it enables concomitant issues of debentures by the same issuer in order to offer issuers more opportunities to take advantage of favorable market conditions.
the changes brought about by this law lifted most of the regulatory obstacles to liquidity. furthermore, in 2012 more than 40 representatives from industry, tra-de and financial institutions met with the minister of the treasury and the Bndes President to present a proposal to eliminate the remaining hurdles, thus further improving the framework required to develop this type of funding.
1 IOF waived by Decree 7,632 of 2011

94 AttrActiveness of BrAzil As An internAtionAl investment And Business huB
one should also call attention to the efforts made in 2011 to self regulate the fixed yield market, similar to the successful model used by the novo mercado85 to issue stock, with stricter transparency and governance requirements to attract investors, such as: at least 10 investors, each holding no more than 20% of the offer, annually updated credit risk rating and a mechanism that ensures that investment analysts will issue a report on the asset within 12 months of issuing debentures.
• Stock: As mentioned, the market cap of Brazil’s stock market is about 45% of the GdP, almost on a par with france and higher than Germany. nevertheless, there are opportunities to increase the use of stocks as a source of funding. small companies, for instance, make up less of the stock market in Brazil than in the uK, one of the world’s main investment and business hubs (see Exhibit 30). the stock market’s Bovespa mais initiative to encourage the listing of smaller businesses must be followed by a broader effort to simplify and lower the cost of issuing and trading stock for this segment.
lastly, Brazilian businesses already have good access to international capital markets through the stock markets abroad. nevertheless, as much of this is in the form of Adrs86, this does nothing to increase liquidity within the domestic market. companies listed only locally do not benefit from the liquidity of these Adrs.
85 Bm&fBovesPA rules for listing that demand corporate governance standar-ds above those required by law
86 American depositary receipts
exhiBit 30only a few small businesses are listed on exchanges in Brazil
Breakdown of traded companies by range of Market Cap1
1. Data for June, 2012 / Source: Bloomberg; BCG analysis<500m 500m-5B >5B
76
17
4146
137
% total number of companies
market cap ranges (US$)
Bm&fBovesPA is attempting to attract smaller businesses with initiatives such as the “Bovespa mais” program
london são Paulo

AttrActiveness of BrAzil As An internAtionAl investment And Business huB 95
in almost all of latin America’s main markets one finds shares being traded outside the market of origin (see Exhibit 31), which suggests that measures to pool liquidity in latin American markets, such as the alliance underway between the stock markets in Peru, chile and colombia, could help attract to regional markets some of the liquidity that local businesses are now leaving in new york and other international hubs.
1. Volume traded (in US$) in the market of origin of the traded company’s “ultimate parent com-pany” versus the volume traded in other marketsNote: Includes shares, rights, depositary receipts and units. Data for June, 2011 / Source: Bloom-berg; BCG analysis
exhiBit 31latin companies “export” market liquidity
% volume of shares traded in the market of origin compared to volume traded in other countries by company country of origin (2011)1
domesticinternational
0%
2%
13%
16%
17%
19%
21%
27%
28%
52%
55%
58%
67%
90%
95%ARgENtiNA
ColomBiA
mExiCo
HoNg koNg
CHiNA
CHilE
iNdiA
PERU
BRAzil
RUSSiA
UNitEd kiNgdom
FRANCE
SiNgAPoRE
JAPAN
USA

96 AttrActiveness of BrAzil As An internAtionAl investment And Business huB
conversely, in 2010 Bm&fBovesPA made room for unsponsored Bdrs87 of some of the world’s main blue-chips such as Apple, Avon, Google, nike and Walmart. unsponsored Bdrs are issued by depository institutions without the participation of the foreign companies that issued the backing securities. currently Bdrs for some 70 companies are traded, but this market is still very incipient and volumes are low. however, it is an additional step in the international expansion of the Brazilian market and connection with global markets.
Levers of efficient risk allocation
efficient risk allocation requires a strong financial system so as to enable offering instruments such as derivatives and insurance to mitigate all sorts of operating risks.
for some types of derivatives, Brazil is already on a par with global standards in terms of volume traded, while penetration of commodity and index derivatives is still low (see Exhibit 32). if well managed, a stronger derivatives market will bring real benefits to the economy, such as more efficient risk management tools, consequently reducing the cost to fund production. 87 Brazilian depositary receipts
gloBAl BRAzil
index
shares
interest
commodities
exchange
exhiBit 32the Brazilian market has room to grow in commodity and index derivatives
Nº of derivative contracts negotiated by type, World vs. Brazil (2011)
41%
4%
22%
56%
11%
14%
32%
13%8%
Note: Indices include ETFsSource: World Economic Forum; BCG analysis
25.0 B 1.5 B
0%

AttrActiveness of BrAzil As An internAtionAl investment And Business huB 97
BRAzil
exhiBit 33there is ample room for insurance to grow in Brazil
GDP vs. size of insurance market by country
1. Absolute values in comment boxes only, chart is log based / Source: SwissRe; BCG analysis
1
100 1,000 10,000 100,00010
10
100
1,000
10,000
log Premiums(US$ B, 2010)
log gdP (US$ B, 2010)
GdP: us$ 2.1 t1 Premium: us$ 64 t1
compared to global standards, the insurance market in Brazil is under-penetrated. Pre-miums as a percentage of the country’s GdP suggest it could double in size (see Exhibit 33). following the breakup of the irB-Brasil (Brazilian reinsurance institute) monopoly in 2008, the country’s reinsurance industry changed significantly. currently more than 100 reinsurers are registered to operate in Brazil, and the national federation of rein-surance companies expects that this r$ 5.7 billion market (2011) will grow at annual rates of over 15% over the next five years.
Indirect benefits of a financial infrastructure
the financial industry is an important pillar of the economy of other investment and business hubs, due to its contribution to the GdP, the taxes it pays and the jobs it cre-ates. regarding this last topic, the financial industry could increase its share of total jobs, currently around 2% and below benchmark levels for other hubs (see Exhibit 34).
Potential

98 AttrActiveness of BrAzil As An internAtionAl investment And Business huB
A stronger financial infrastructure also stimulates other sectors of the economy with direct or indirect links to the financial industry such as auditing, consulting, legal counsel, information technology and even hotels and airlines. furthermore, on the job creation side, it is important to remember that jobs in the financial industry are normally highly qualified and specialized. this contributes to offering the economy a more developed set of talents.
Financial services GDP3 (% of total)
5
10
15
0
20
25
30
exhiBit 34the financial industry plays an important role in creating jobs, economic growth and tax revenue
Employment in the financial services industry1
(% of total)
5
10
15
0UNitEd
kiNgdomUNitEd
kiNgdomUNitEd
kiNgdom
BRAzil
NYCloN
SiNgAPoRE USASWitzER-lANd
SWitzER-lANd
SWitzER-lANd
BRAzil~7%
8% of the jobs, but 32% of the payroll in nyc
8%8%
~2%2
20
25
30
5
10
15
20
25
30
Taxes on financial services4 (% of total)
BRAzil
~6%
0USASiNgAPoRE
12%13%
26%
1. 2009 data for London, 2010 for the United Kingdom, New York and Brazil, and 2011 for Singapore, Switzerland and the US. Data for the US excludes farm jobs 2. Calculated based on the total number of formal jobs in Brazil (~44 million in 2010) 3. 2010 data for the US, Brazil and UK, and 2011 for Switzerland and Singapore 4. 2007 data for Singapore, 2008 for the US, 2010 for Brazil and 2011 for the UK / Source: US Bureau of Labor; New York State Department of Labor; Federal Department of Finance (Switzerland); Ministry of Manpower (Singapore); City of London; Press Clippings; Ministry of Labor and Employment; IBGE; BCG analysis
SiNgAPoRE USA
11%
9%
12%
9%
6.2%5.9%5.5%
4.0%
8%

AttrActiveness of BrAzil As An internAtionAl investment And Business huB 99
Indicators
the dimensions selected for continuous tracking of the financial infrastructure pillar are:
• Effectiveness of the financial regulations: the opinion of executives on the suf-ficiency and effectiveness of regulations governing the financial system of each coun-try, which is required for creating a hub as it ensures a balance between operational security and flexibility;
• Use of financial resources: this can be split into three sub-dimensions: the stock exchange, debentures and corporate credit. Analyzing the combination of all three enables assessing the degree of maturity with which the different financial resources are used by businesses. however, each country may prefer a different mix, therefore the analysis of each sub-dimension alone is less relevant;
• Share of regional and international companies in the stock exchange: this measures the international component of the stock exchange in each country. A more international exchange is more attractive to foreign businesses and is an indication that international business is more important for the country;
• Availability of financial services: this measures the availability of financial services in each country based on the opinion of executives. the availability of financial services is important as it provides the funding needs and appropriate allocation of resources and risks within a hub;
• Stock exchange liquidity: the greater the liquidity of the stock exchange the more dynamic the financial market of which it is a part, and the greater the possibilities of self funding and of entering and exiting investments in the stock exchange.
• Projection as an IFC88: this indicator measures the recognition of a country’s financial system as an international financial center. A higher score means a country’s financial infrastructure is better prepared to support an investment and business hub.
the following exhibit shows how Brazil compares to other countries along the dimen-sions of the financial infrastructure pillar:88 international financial center

100 AttrActiveness of BrAzil As An internAtionAl investment And Business huB
finAnciAl infrAstructurecritical needs improvement good excellent
Use
oF
FIN
AN
CIA
L Re
soUR
Ces
sHARe oF RegIoNAL AND INTeRNATIoNAL CoMPANIes IN THe sToCK eXCHANge
jPN UsA gBR
CHN
INDRUs CHL MeX
BRAKoR sgP HKgFRA
5.
AvAILABILITy oF FINANCIAL seRvICes
KoR jPN FRA
DeU
gBRRUs
CHN
IND CHLMeXBRA
sgP
HKgUsA6.
PRojeCTIoN As AN IFCKoR DeUjPN HKg gBRFRAIND RUs MeX CHN
BRA
sgP UsA8.
KoR
FRA
jPN
gBRRUs IND CHLMeXCHN DeUeFFeCTIveNess oF FINANCIAL RegULATIoNs
BRAUsA
HKg
sgP1.
DeBeNTUResjPN
DeU
FRA KoRsgP
gBR
HKg UsACHN CHLIND MeX
BRA
3.
jPNIND
FRA
UsA gBR sgP HKg
RUs
CHN CHL
MeXsToCK eXCHANge
DeU KoRBRA
2.
CoRPoRATe CReDIT
KoR FRA
gBR
UsA CHNsgP
IND
DeUBRA
4.
sToCK eXCHANge LIQUIDITy
FRA jPN HKggBR
DeU
KoRINDCHL RUs
CHN
MeX
BRA
sgP
UsA7.
MAIN INTeRNATIoNAL HUBs oTHeR DeveLoPeD NATIoNseMeRgINg NATIoNs
the effectiveness of its financial regulations is one of Brazil’s strengths, where it stands out from the other countries in the analysis. furthermore, the liquidity of its stock market is good and there is the perception of the country’s financial services is also good.
however, these dimensions are not enough to propel the country into a position as an important international financial center. in addition, there is still a lot of room for the in-ternationalization of its stock exchange and the use of financial services, translated as the ratio of market capitalization, debentures and corporate credit to the GdP.

AttrActiveness of BrAzil As An internAtionAl investment And Business huB 101
Conclusion
credibility of the financial environment is essential for the economic stability of a country. in this pillar Brazil presents a number of strengths for an investment and business hub, in particular its prudent regulations and solid and profitable financial institutions. there is suitable oversight of financial transactions, balancing the flex-ibility the market needs and the security it must provide to ensure the system en-dures. in addition, most Brazilian banks are solid and offer positive returns to their shareholders. this is important given that the returns of most of their international peers dropped sharply due to the current crisis scenario. All of these helped keep the effects of financial crisis that started in 2008 from being felt as strongly in Brazil as they were in a number of other countries.
Given this strong platform, efforts can turn to addressing the theme of suitable financ-ing for companies and businesses. falling interest rates and recent legislative changes signal the Brazilian Government’s interest in increasing the availability of instruments that can meet market needs. this agenda may continue with initiatives to extend bank loan terms, expand and encourage the private debt market and enhance access to the stock exchange for both domestic and international companies. Brazil is well positioned and on the right path to increase its attractiveness in this pillar.
brazIl presents a number of strengths for an Investment and busIness hub, In partIcular Its prudent regulatIons and solId and profItable fInancIal InstItutIons

102 AttrActiveness of BrAzil As An internAtionAl investment And Business huB
Being part of a dense network of intermodal connections is a reflection of a country’s importance as an investment and business hub. the connections within such networks may be intra-regional or global. the former relates to close partners within a hub, while the latter defines its position in terms of how open it is to the world.
despite the mercosur and other initiatives to integrate the region, there are actually few connections between the countries that make up south America. A consolidated investment and business hub in the region would create economies of scale and scope that would be more evident to the other nations in the interconnected network where Brazil, because of its size and activities, would be a natural candidate to play a key role.
for this reason integration between Brazil and latin America and the world needs re-newed impetus. Broad but not very effective measures such as unAsur89 are not enou-gh to consolidate the nation’s regional and global projection. efforts focused more on matters that can truly deliver relevant economic impact are the best way for Brazil to increase its connectivity. 89 union of south American nations
main aspects of the connectivity pillarTrade in goods and services: A hub should offer an environment that enables and promotes the international trade of goods and services, which today is essential for the businesses installed in any country.
Investment and capital flows: stimulating and channeling international capital flows is a vital component of any hub. A favorable environment has advantages that affect the country and the entire region.
International business operations: in order for a country to be truly integrated to a global business network, it is important that it be the headquarters of multinational corporations and contribute to the international expansion of local businesses.
People mobility: it is essential that executives and decision makers in all sectors be able to easily enter and exit the hub. this has to do not only with regulations, but also airport infrastructure, the main means people use to travel between countries.
06connectivity

AttrActiveness of BrAzil As An internAtionAl investment And Business huB 103
Brazil is in the lower half of rankings in four key aspects that translate this perception: the trade of goods and services, capital and investment flows, international business operations and people mobility (see Exhibit 35). the purpose of this chapter is to analyze the country’s situation along these four aspects.
exhiBit 35Brazil is still considered weak when it comes to connectivity
1. Based on weights assigned to the various components: tariffs, quotas, customs efficiency, hidden administrative restrictions and controls on capital and the exchange rate. Source: Fraser Institute – Economic Freedom of the World 2. Based on a survey of executives. 1 = very restricted, 7 = no restrictions of any type. Source: World Economic Forum – Global Competitiveness Report 2010-2011 3. Based on a survey of executives. 1 = very rare, 7 = highly prevalent. Source: World Economic Forum – Global Competitiveness Report 2012-2013 4. Ranking based on the combination of a number of metrics: Number of citizens studying abroad, % foreign students in the country, knowledge of foreign languages, foreigner recruiting, openness of the country’s international trade. Source: Heidrick and Stru-ggles – Mapping Global Talent. Study focusing on the more populous countries, excludes Chile, Singapore and Hong Kong
People
restrictions on capital flows(score of 1 through 7)2
investment and capital
prevalence of foreign property(score of 1 through 7)3
international business operations
freedom for interna-tional trade
(score of 1 through 10)1
goods and services
gBRdEUFRAiNdUSACHN
mEx
koRRUSBRA
JPN
SgPgBR
dEUCHl
mExFRAJPN
USABRA
BRA
iNd
koR
RUS
CHN
139
144
30
141
gBR
CHlFRA
mEx
dEU
USA
iNd
JPN
CHN
koR
RUS
gBR
HkgHkgSgP SgP
HkgCHl
dEU
CHN
koRFRA
USA
mEx
iNd
BRA
JPNRUS111
114
105
76
54
48
4140
30
20
14
21
610
15
20
424651
69
75
94
119
123
73
82
1 3 2389
1011
16
192123
27
14
45
18
24
51
44
84
90
99
91
133
9
Mobility and relative openness of the Job Market(rank among the 30 study countries)4

104 AttrActiveness of BrAzil As An internAtionAl investment And Business huB
Trade in goods and services
international trade in goods and services has grown faster in Brazil and latin America than global trade as a whole. Between 2007 and 2011 latin American goods exports, in us dollar terms, grew at an annual average rate of 9.2%, while imports grew 9.8%, compared to 6.8% and 6.4% globally. service exports from latin America grew 7.0%, and in the world 5.0%. latin American imports grew 11.7%, while global imports increa-sed 7.0%. these numbers are even larger for Brazil, with the trade of goods and services growing at twice the global rate (see Exhibit 36).
exhiBit 36latin America and Brazil stand out in terms of their growth in international trade
goods servIces
Average annual growth between 2007 and 2011, in US$% p.y.
Average annual growth between 2007 and 2011, in US$% p.y.
WoRld
WoRld
WoRld
ExPo
Rt F
loW
Sim
PoRt
Flo
WS
lAtiN AmERiCA
lAtiN AmERiCA
lAtiN AmERiCA
BRAzil
BRAzil
BRAzil
WoRld lAtiN AmERiCA
BRAzil
Note: All values are nominal. Latin America includes Brazil / Source: UNCTADStat; BCG analysis
12.4%9.2%6.8%12.5%
7.0%5.0%
16.7%
9.8%6.4% 5.2%11.7%
19.7%

AttrActiveness of BrAzil As An internAtionAl investment And Business huB 105
despite this strong growth, there is still room for larger flows of goods and services in the region and country, in particular when one looks at foreign trade as a percentage of GdP. in 2011, while Asia and europe were responsible for a larger share of international trade than their share of the global GdP, latin America, which accounted for about 8% of the global GdP, was responsible for only 6% of the international trade in goods, and 4% of the trade in services. the same is true for Brazil, which is responsible for 3% of the global GdP, but for on 1% of the import and export of goods and services (see Exhibit 37).
exhiBit 37there is room for latin America and Brazil to increase their share of world trade
goods servIces
Share of the GDP and international trade in goods Share of the GDP and international trade in services
gdP gdPimPoRtS imPoRtSExPoRtS ExPoRtS
% 2011% Ft/
% gdP1
% Ft/% gdP1% 2011
other other
latin aMerica
latin aMerica
europe europe
BRAzil
asia asia
73% 76%
74%
158%
149% 110%
132%
47%
1% 1%1% 2%39% 41%3% 3%
1. Imports and exports as a percent share of the GDP (average)Note: All values are nominal / Source: UNCTADStat; BCG analysis
38%
23%
34%
6%
37%
24%
33%
6%
51%
16%
25%
8%
40%
18%
38%
5%
38%
17%
42%
3%
51%
16%
25%
8%

106 AttrActiveness of BrAzil As An internAtionAl investment And Business huB
intra-regional trade within latin America also has room to grow. for example in 2010, 51% of Asia’s exports and 45% of its imports were intra-regional, while for europe these figures are 65% and 62% respectively. that same year only 18% of the imports and exports in latin America were within the region.
to take advantage of this potential, latin America should address the issue of customs barriers, as most of its countries have significant restrictions on the import of goods (see Exhibit 38) and services. in the case of services, this is reflected in the fact that it has the smallest number of service sectors with signed GAts90 agreements, and thus open to international trade and competition (see Exhibit 39).
90 General Agreement on trade in services
1. Reflects a uniform tariff that would keep domestic import levels constant 2. Reflects a uniform tariff that would keep the level of imports by the exporter’s commercial partners constant / Source: World Trade Indicators 2009/10 – World Bank
exhiBit 38customs barriers for importing and exporting goods are larger in latin America than in europe and Asia
equivalent import tariffs are the highest in latin america
Restrictions on the import of goods1
tariffs include tariffs + non tariff restrictions on imports
SoUtH koREA
CHiNA
iNdoNESiA
FRANCE
gERmANY
itAlY
UNitEd kiNgdom
SiNgAPoRE
CHilE
ARgENtiNA
BRAzil
mExiCo 27.4%
22.1%
15.7%
9.4%
19.7%
10.0%
9.8%
7.6%
10.1%
10.1%
10.1%
10.1% World average: 14.1
moRE REStRiCtivE
tariffs imposed on latin american exports are also the highest
Restrictions for accessing other markets2
tariffs include tariffs + non tariff restrictions on exports
SoUtH koREA
CHiNA
SiNgAPoRE
FRANCE
gERmANY
itAlY
UNitEd kiNgdom
iNdoNESiA
mExiCo
CHilE
BRAzil
ARgENtiNA 16.4%
12.3%
8.3%
5.1%
12.7%
9.8%
9.2%
9.1%
9.1%
9.1%
9.1%
6.5%
World average: 12.2
moRE REStRiCtivE
europe
Asia
latin America

AttrActiveness of BrAzil As An internAtionAl investment And Business huB 107
1. From the WTO page: “The General Agreement on Trade in Services (GATS) is the first and only set of multilateral rules governing international trade in services. It was developed in response to the huge growth of the services economy over the past 30 years and the greater potential for trading services brought about by the communications revolution.” 2. Each sector has 3 to 9 sub--sectors that require specific commitments (e.g.: financial services has 3 sub-segments - Insurance, Banking and other financial services) / Source: WTO trade in services database
% commitments signed by sector2
number of signed gats1 commitments per country
viEt
NAm
mEx
iCo
RANkiNg
ECUA
doR
vENE
zUEl
A
ARgE
NtiN
A
BRAz
il
Colo
mBi
A
PERU
URUg
UAY
CHil
E
Boli
viA
PARA
gUAY
50
30
22 21 19 1714 14
12 11 95
exhiBit 39latin American countries could increase their share of international service agreements
01 39 51 55 57 60 69 72 83 85 89 117
Fina
ncia
l se
rvic
es
Trav
el a
nd to
urism
Busin
ess
serv
ices
Cons
truct
ion
and
engi
neer
ing
Envi
ronm
enta
l se
rvic
es
Recr
eatio
n an
d cu
lture
Dist
ribut
ion
Educ
atio
n
Tran
spor
tatio
n
Heal
thca
re
Tele
com
viEtNAm
mExiCo
ECUAdoR
vENEzUElA
ARgENtiNA
BRAzil
ColomBiA
PERU
URUgUAY
CHilE
BoliviA
PARAgUAY
100%100%
67%
67%
100%
67%
67%
67%
67%
100%
67%
67%
100%80%
20%
100%
80%
80%
80%
0%
0%
0%
0%
0%
60%60%
20%
40%
40%
20%
20%
20%
20%
20%
20%
0%
100%75%
50%
75%
100%
25%
50%
50%
75%
75%
50%
75%
100%0%
60%
40%
0%
0%
0%
40%
20%
0%
60%
0%
100%0%
100%
0%
0%
0%
25%
0%
0%
0%
0%
0%
100%44%
33%
22%
0%
44%
0%
22%
11%
11%
0%
0%
83%83%
67%
83%
50%
33%
67%
50%
67%
50%
0%
0%
80%40%
20%
0%
60%
60%
0%
40%
0%
0%
0%
0%
80%80%
0%
0%
0%
0%
0%
0%
0%
0%
0%
0%
100%50%
25%
0%
0%
0%
0%
0%
0%
0%
25%
0%

108 AttrActiveness of BrAzil As An internAtionAl investment And Business huB
to pursue this agenda, countries must address a variety of issues such as eliminating the current subsidies and protectionist policies, extensive bureaucracy and frequent deman-ds from domestic manufacturers. here Brazil has not made significant progress in the recent past. When it comes to international trade, Brazil ranks only 121st out of the 183 countries in the World Bank’s 2012 doing Business report. Also according to this report, exporting a standard container from Brazil requires 13 days, 7 documents and us$ 2,215. importing this same container would take 17 days, 8 documents and us$ 2,275.
meanwhile, other countries in the region have made efforts to strengthen their global connection, such as the free trade agreement signed by colombia and the us in 2012. in broader terms, discussions regarding more integration between the mercosur and china and the eu remain on the table. to drive its economic growth, Brazil should focus on competitiveness and commercial diplomacy, opening itself to other markets, which were precisely the mercosur’s aspirations when it was conceived. twenty one years after it was created, the block still has trouble adopting strategies to foster free trade among its members and present an alternative to the advances of the united states, which already has bilateral agreements with Pacific rim countries such as chile, colombia and Peru.
in addition to the challenge of customs barriers and bureaucracy, trade in goods faces the additional bottleneck of Brazil’s logistics infrastructure. there are few overland connec-tions with neighboring countries, roads are occasionally blocked and their quality is poor, and the railways have different gauges and are poorly maintained. this scenario repeats itself with Brazil’s ports, where a survey gave Brazil 2.6 points on a score of 1 to 791. the world’s main international hubs such as hong Kong, singapore, the us and uK all score 5.6 or above, reinforcing the fact that Brazil must improve in this area.
While Brazil has taken a number of quite positive initiatives to address its infrastructure bottlenecks, more effective results require the completion of major works. As examples we have the revamping of the santos and são sebastião ports, and the construction of one of the world’s largest bulk export terminals in maranhão. important railroad projects are also in the design or construction phase, such as the são Paulo ring railroad (ferro-anel), ferrovia leste-oeste (east-West), nova transnordestina (northeast) and ferrovia norte-sul (north-south) (see the chapter on physical infrastructure for more details re-garding plans for Brazil’s infrastructure).
91 source: World economic forum – Global competitiveness report, 2012-2013

AttrActiveness of BrAzil As An internAtionAl investment And Business huB 109

110 AttrActiveness of BrAzil As An internAtionAl investment And Business huB
Capital and Investment Flows
inward foreign direct investment (fdi) in latin America increased between 2007 and 2011, with the region receiving a share of fdi similar to the region’s share of the glo-bal GdP. here we can look up to Asia as evidence that, if stimulated due to intrinsic economics or the regulatory environment, fdi can reach levels above a region’s or nation’s share of the GdP. for example, between 2007 and 2011 Asia’s share of the global fdi was 1.26 times its share of the global GdP, but in latin America this ratio was only 1.07. Also, latin American countries still account for only a small share of the world’s outward fdi.
Between 2009 and 2011, Brazil led in terms of the share of foreign direct investment into latin America, receiving 41% of the total. however, once we factor the GdP into these flows, the picture changes, and chile comes out as the region’s winner, with a good indicator of regional attractiveness (see Exhibit 41).
exhiBit 40inward fdi into latin America is proportional to its GdP, but outward fdi is still smaller
while latin america’s share of inward fdI1 is growing, it is still smaller than other regions
latin america has a negligible share of the outward fdI, even as a percent of its gdp
Share of the world’s inward FDI Share of the world’s outward FDI
% world total inward Fdi % world total outward Fdi
otHER2
lAtiN AmERiCA3
EURoPEAN UNioN
EURoPEAN UNioN EURoPEAN UNioN
SoUtHEASt ASiA SoUtHEASt ASiA
lAtiN AmERiCA lAtiN AmERiCA
SoUtHEASt ASiA4
39.2
43.2
5.6
11.9
49.5
30.3
7.1
13.1
46.6
29.8
6.4
17.2
44.4
24.3
9.0
22.3
41.0
27.6
9.8
21.6
2007 20072008 20082009 20092010
1.07 0.26
1.26 0.91
1.11 1.46
20102011 2011
iNdEx iNdEx% inward Fdi/% world gdP(Average for 2007-2011)
% outward Fdi/% world gdP(Average for 2007-2011)
1. Foreign Direct Investment 2. Includes the US, Canada, Australia, Russia and tax havens, among others 3. Argentina, Bolivia, Brazil, Chile, Colombia, Ecuador, Falkland Islands, Guia-na, Paraguay, Peru, Surinam, Uruguay, Venezuela, Belize, Costa Rica, El Salvador, Guatemala, Honduras, Mexico, Nicaragua and Panama 4. Selected countries: Cambodia, North Korea, South Korea, China, Singapore, Philippines, Hong Kong, Indonesia, Laos, Macau, Malaysia, Myanmar, Thailand, Taiwan, VietnamNote: According to the most recent data taken from UNCTAD by August 2012 / Source: UNCTADStat; BCG analysis
36.1
54.8
1.27.9
41.0
48.6
1.98.4
50.4
33.5
1.1
15.0
46.7
33.3
3.3
16.7
50.8
33.2
1.9
14.2

AttrActiveness of BrAzil As An internAtionAl investment And Business huB 111
1. Average for 2009 – 2011 2. Index (% of total inward FDI for the region/ country GDP as a % of total region GDP, based on the average for 2009 - 2011) 3. Index (country % of region’s outward FDI / country GDP as a % of total region GDP, based on the average for 2009 - 2011) 4. Fiscal havens are not included explicitly, but account for 6% and 19% of Brazil’s inward and outward FDI respectively / Note: Net value, considers positive and negative FDI flows. For outward FDI, positive values are the amount companies invested abroad. Negative amounts mean values companies sent funds to Brazil from their country of origin / Source: IMF; UNCTAD World Investment Report; UNCTADStat; Brazilian Central Bank; BCG analysis
exhiBit 41Although Brazil receives a significant volume of direct investments, overall latin America’s share of the global fdi is limited
brazil is the leading latin american country in inward net fdI, but lost share in outward fdI due to capital repatriation
latin america accounts for less than 10% of brazil’s gross inward and outward fdI
Net FDI for Latin America by country of destination - % of total1
Gross foreign investment in Brazil by country of origin (2011)4 Gross foreign investment made by Brazil by country of destination (2011)4
Inward net FDI weighted by the country’s share of the regional GDP2
Net outward FDI weighted by the country’s share of the regional GDP3
Net FDI for Latin America by country of origin - % of total1
mExiCo
BRAzil
16.4
BRAzil
CHilE
41.1 32.1
30.7
19.5CHilE
CHilE CHilEBRAzil BRAzilmExiCo mExiCo
13.3
mExiCo
ColomBiA 7.9
ColomBiA
ARgENtiNA
6.7
ARgENtiNA
PERU
5.3
PERU
otHER 9.3 otHER
US$ m US$ m
5,000 10,000 15,000 40,000
otHER
lAtiN AmERiCA
NoRtH AmERiCA
EURoPE 56%
15%
19%
3%
5,000 10,000 15,000
otHER 4%
lAtiN AmERiCA
2,306
855
10%
NoRtH AmERiCA
15%
EURoPE 12,332
3,581
53%
3.4
0.9
0.5
12.9
3.13
0.95 0.76
7.25
1.48 0.01
39,082
1,961
13,365
10,698

112 AttrActiveness of BrAzil As An internAtionAl investment And Business huB
in the case of outward fdi, between 2009 and 2011 Brazil’s share is low, and the overall account was negative due to the repatriation of capital Brazilian companies had sent abroad92. this does not mean that Brazilian companies have discarded the idea of inter-national expansion, but is an indication of a preference to invest in Brazil rather than in countries whose economic scenario is still uncertain.
finally, the intra-regional connectivity of Brazil’s foreign direct investment is still limited, as the main focus of inward and outward fdi are the countries of europe and north America (see Exhibit 41).
ratifying bilateral investment agreements, making investments between signatory countries easier and safer could be a tool to increase Brazil’s prominence. creating rules to protect property and indemnify expropriations, the ability to freely transfer investment yields to the country or origin, and the stipulation that disputes may be resolved by international courts would enable the flow of portfolio93 and foreign direct investment. comparatively speaking, Brazil has agreements with 14 countries, primarily within the mercosur, far fewer than the 51 agreements chile has signed with partners such as the us, canada, mexico and india.
Another lever that could contribute to enhanced investment flows in latin America is the implementation of local currency Payment systems (sml in Portuguese). this is a payments system used in commercial transactions that allows payables and receivables to flow between countries in their respective currencies. smls reduce the transaction, financial and administrative costs of exchange transactions, and make the entire process more agile, eliminating the need for real-us dollar and us dollar-local currency transac-tions, and vice-versa. concerning mercosur, the first local currency payment system was created in 2008, between Brazil and Argentina. currently the implementation of such a system with uruguay is being negotiated, and right now needs only approval by the Brazilian congress. other countries and regions are looking into using their own local currency for payments to reduce their dependence on the us dollar. At the second Bric summit in 2010, the leaders of the four Bric economies agreed to look into mechanisms to use their own currency for bilateral trade.
other factors that facilitate the flow of capital are exchange policies and regulations. sim-ple, modern rules would eliminate the restrictions that hamper exchange transactions, making them more dynamic. Brazil has made a lot of progress here: the 2005 interna-tional capital and foreign exchange market regulation (rmcci in Portuguese) and other new standards revised obsolete requirements and the multiple documents that used to be necessary to complete an exchange transaction. in the macroeconomic context, the use of iof (tax on financial transactions) as an exchange-policy tool to contain the rising value of local currency still brings some insecurity to market agents, as any increase in the iof rate is enforceable immediately after the Presidential decree is signed. to illustra-te this, among the transactions subject to this tax, the percentage of iof charged when settling exchange transactions contracted by a foreign investor interested in funds to in-vest in the Brazilian capital market has gone up gradually from 0% to 6% since late 2009.
92 this includes Brazilian individuals and govern-ment agencies
93 unlike direct investment, portfolio investments do not have a lasting interest in the asset or in actual managerial control over the asset. these include government and company bonds and shares. shareholdings of up to 10% of the a company’s capital are considered portfolio investments

AttrActiveness of BrAzil As An internAtionAl investment And Business huB 113

114 AttrActiveness of BrAzil As An internAtionAl investment And Business huB
International business operations
recent years have witnessed the steady growth of international expansion by latin American businesses. in 2004, foreign direct investment (fdi) reached us$ 17 billion, more than three times as much as in 2002 and 2003, when inward fdi in Brazil amoun-ted to around us$ 6 billion. A new level was set in the following years, and the trend has been upwards ever since.
furthermore, nine latin American companies, three of them Brazilian, were on the 2010 list of the 100 emerging nation companies with the largest volume of assets abroad94. in 2010 these companies had a total of us$ 173 billion in assets abroad, compared to just us$ 35 billion in 2003, close to 400% growth in seven years. 16.2% of the total assets on this now belong to multilatinas95, compared to 14.1% in 2003. in the past two years, one more latin American joined the list of the 100 companies with the largest volume of assets held abroad: in 2011 vale reached the 61st position, overcoming cemex, the only other multilatin in this report, now in 86th place (see Exhibit 42).
in June 2012, fundação dom cabral (fdc) published a list of the most multinational com-panies in Brazil, and for the second consecutive year JBs was the first ranked, with 53.8% internationalization96. Gerdau came in second, at 51.6%, and stefanini, which dropped a level between 2011 and 2012, came in third, at 46.4%. Among companies with annual revenue of r$ 1 billion or less, the most internationalized are metalfrio (45.2%), ibope (43.8%) and sabó (36.3%) vale is present in the largest number of countries (38). the mining giant is followed by stefanini, present in 26 countries, and by odebrecht, with activities in 25 countries. Among franchises, via uno has an internationalization level of 18.3%, fábrica di chocolate 12.1% and showcolate 10.9%.
this study, based on 2011 data, also shows that the internationalization of Brazilian companies has been growing steadily at a rate of 1% a year. in all, 47 multinationals were included in the survey. 60.9% of them plan to expand in the markets where they are already present, and 27.5% plan to enter new markets. most of the businesses interviewed in the survey believe the advantages of internationalization are greater than the risks involved. 87.3% of the multinationals believe this type of move helps to improve Brazil’s image abroad. 69.9% believe that a further benefit is that it brings new processes and technologies to manufacturing activities in Brazil. According to the survey, Brazilian businesses are more present in other latin American countries (77.8%) and in north America (57.1%). According to the fdc’s nucleus for internatio-nal Business, 63.3% of the surveyed companies had their first international subsidiary in one of the countries in the region.
94 source: World investment report - unctAd
95 multinationals headquartered in latin America
96 internationalization is represented by the transnationality index combining three measures: percentage of international assets to total assets, percentage of international revenues to total revenues and percentage of overseas employees to total employees, to determine the overall degree of internationalization of companies
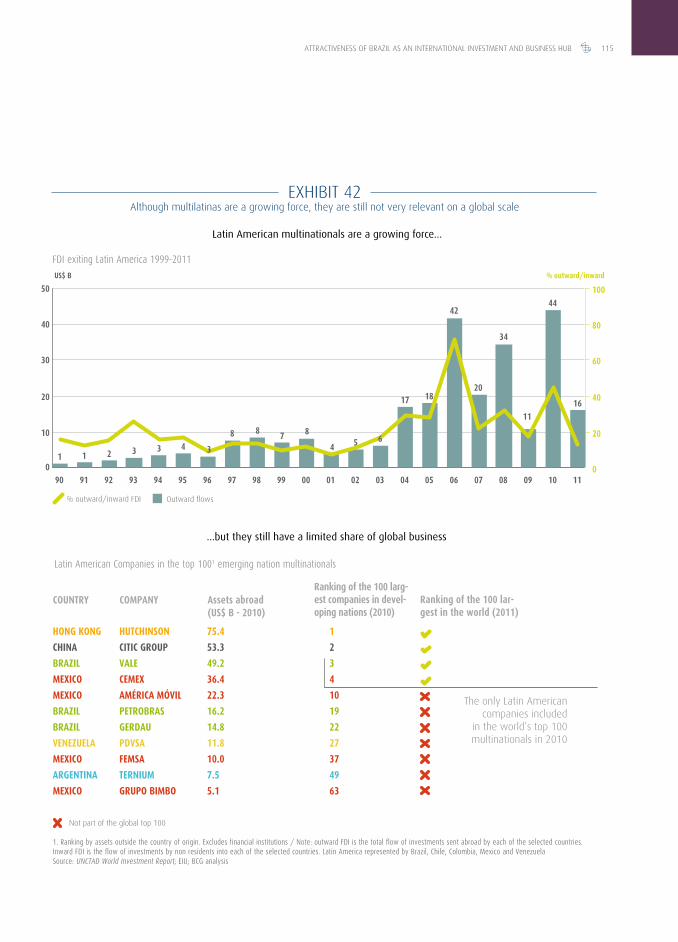
AttrActiveness of BrAzil As An internAtionAl investment And Business huB 115
exhiBit 42Although multilatinas are a growing force, they are still not very relevant on a global scale
latin american multinationals are a growing force...
...but they still have a limited share of global business
Latin American Companies in the top 1001 emerging nation multinationals
1. Ranking by assets outside the country of origin. Excludes financial institutions / Note: outward FDI is the total flow of investments sent abroad by each of the selected countries. Inward FDI is the flow of investments by non residents into each of the selected countries. Latin America represented by Brazil, Chile, Colombia, Mexico and Venezuela Source: UNCTAD World Investment Report; EIU; BCG analysis
% outward/inward fdi outward flows
CoUNtRYRanking of the 100 larg-est companies in devel-oping nations (2010)
Assets abroad (US$ B - 2010)
Ranking of the 100 lar-gest in the world (2011)
HoNg koNg HUtCHiNSoN 75.4 1
CHiNA CitiC gRoUP 53.3 2
BRAzil vAlE 49.2 3
mExiCo CEmEx 36.4 4
mExiCo AmÉRiCA mÓvil 22.3 10
BRAzil PEtRoBRAS 16.2 19
BRAzil gERdAU 14.8 22
vENEzUElA PdvSA 11.8 27
mExiCo FEmSA 10.0 37
ARgENtiNA tERNiUm 7.5 49
mExiCo gRUPo BimBo 5.1 63
the only latin American companies included
in the world’s top 100 multinationals in 2010
ComPANY
not part of the global top 100
FDI exiting Latin America 1999-2011
US$ B % outward/inward
90 91 92 93 96 97 98 99 00 01 02 03 04 05 07 08 1009 110694 95
10
0
20 40
20
0
30 60
40 80
50 100
4442
1817 16
11
34
20
654
888
3433211
7

116 AttrActiveness of BrAzil As An internAtionAl investment And Business huB
When it comes to attracting multinationals, Brazil stands out quite clearly. of all latin American countries, Brazil has the largest number of foreign companies, considering the 30 largest by revenue in north America, Asia and europe. furthermore, it is the most attractive country to companies in all three of these regions, capturing the attention of businesses seeking investment and business opportunities (see Exhibit 43).
exhiBit 43Brazil is the leading latin American nation when it comes to attracting european and Asian businesses
brazil is the country with the most foreign companies... ... and also leads in terms of attracting companies from regions abroad
Latin American presence of the 30 largest companies in Asia, Europe and North America1
Presence of the 10 largest companies of each region in Latin American’s countries1
1. Ten largest companies in each region by revenue / Note: Company presence may average manufacturing sites, offices etc. Includes all forms of activitySource: Forbes 2012; company websites; BCG analysis
24
22
14
11
8
3
1513
19EU
RoPE
NoRt
H Am
ERiC
AAS
iA
Brazil
Argentina
mexico
Chile
Brazil
Argentina
mexico
Chile
Brazil
Argentina
mexico
Chile
8
7
7
7
6
6
5
4
9
8
8
4
AttrActiveness of BrAzil As An internAtionAl investment And Business huB 117
to further promote interconnection between latin nations, converging accounting, finan-cial, tax and technical standards would be an important initiative to reduce the cost of adapting investment and businesses, and leverage the region’s potential.
this harmonization process is already underway for accounting standards, as more and more nations adopt international financial reporting standards (ifrs)97 - adopted by colombia and chile in 2009, and by Brazil, Peru and Argentina in 2011. common syste-ms and databases, if adopted, would also benefit the region. there are other examples of possible unifications such as registration of businesses and individuals, payments, brands, patents, credit histories, customs and international trade data that could further promote Brazil’s image as an international investment and business hub.
People mobility
Brazil has been able to attract a growing number of foreign workers, as shown by the number of applications for work visas. however, it is important to understand that the country still has shortcomings, not only in terms of the difficulty to obtain visas, but also a relatively limited capability to operate international flights.
the number of work visas granted increased from 40 thousand in 2008 to 70 thousand in 2011. latin American nationals account for about 8% of all the work visas granted, a percentage that has remained relatively stable over time.
however the flow of tourists has not increased, and numbers have remained relatively flat since 2005. the number of latin American visitors to Brazil has increased in absolute terms and as a percentage of the tourists traveling to the country (see Exhibit 44).
it is interesting to note that, according to the 2010 iBGe census, only 0.2% of the popula-tion is made up of foreigners98, quite a small number if one considers this nation’s history of welcoming immigrants in the late 19th and early 20th centuries. Bearing in mind the contribution of immigrants to the country, recently the Presidential Bureau of strategic Affairs created a Working Group to look into the potential intensity of immigrant flows, their importance for the development of the country and means to encourage such flows. Among the themes discussed will be an assessment of the impact qualified and unskilled labor immigration policies may have on a country’s development, and factors that can be used to inhibit or promote such immigration flows.
one factor that contributes to the low numbers of immigrants in Brazil is the complexity and slowness of the process for authorizing the entry of foreigners into the country, still overly protective of Brazilian workers.
97 international Accounting standards published by the iAsB (international
Accounting standards Board). the iAsB has been attempting to implement
these standards since 2011 to make it easier to combine and compare accoun-
ting data for businesses operating in different countries
98 A person born abroad, or born in Brazil but registered in a foreign
embassy or consulate, and who has not been naturalized

118 AttrActiveness of BrAzil As An internAtionAl investment And Business huB
non mercosur foreigners who wish to work in Brazil face a two-month process that includes employer sponsorship, proof of professional experience, and a college or uni-versity degree. it can take up to two years to get such a visa renewed. one of the paths for simplifying this process would be to expand the boundaries of the mercosur free movement and residence agreement, similar to what was announced in August 2012 regarding colombia, as well as regional databases of individuals.
finally, looking at the infrastructure required to connect people to the country, Brazil is relatively well connected compared to other latin American nations. flights from Brazil go to 31 international destinations, about half of them within latin America. however, the number seats available on international flights is low compared to its population, and there is room to increase current capacity (see Exhibit 45).
latin america’s share of travelers to brazil is large and growing
exhiBit 44Brazil is attracting larger numbers of foreign workers, but not tourists
Travelers1 entering Brazil by country of origin
~60% of the latin American travelers come from Argentina,
and ~50% of these travel in the south of the country
100
80
60
40
20
02005 2006 2007 2008 2009 2010 2011
otHER2
NoRtH AmERiCA
lAtiN AmERiCA
EURoPE
latin america’s share of workers entering brazil is dropping
Number of work visas issued in Brazil each year by country of origin of worker
2008
44.0 5.442.9 5.056.0 5.070.5 5.1 4.8 5.2 5.4
2009 2010 2011
% work visas by region % travelers from each region100
80
60
40
20
0
total number of visas
(thousand)
total travelers (m)
otHER
NoRtH AmERiCA
ASiA
lAtiN AmERiCA
EURoPE
1. Number of travelers includes tourists and business travelers 2. Includes Asian nations / Note: Data available for 2008 through 2011 includes different countries from those included in the 2011 Attractiveness Report / Source: Ministry of Labor and Employment; Ministry of Tourism; BCG analysis
8
36
29
15
13
8
36
28
15
13
8
37
29
15
11
7
36
30
16
10
38
33
16
12
37
34
16
14
38
32
15
14
41
29
14
16
44
28
14
14
47
26
14
13
49
25
12
14

AttrActiveness of BrAzil As An internAtionAl investment And Business huB 119
12%
Indicators
the dimensions selected for continuous tracking of the connectivity pillar are:
• International openness for trade in goods: restrictions on the importation of goods, resistance on the part of other countries to its exports are evidence of a country’s willing-ness for commercial connectivity.
• Trade in goods: trade in goods is one of the most important activities for any business hub and is therefore something to be developed;
• International openness for trade in services: Being a signatory to international agreements for the trade in services is evidence of a country’s disposition for connecti-vity in the trade in services;
brazil offers more international flight destinations than any other country in latin america...
exhiBit 45Brazil leads in the number of destinations of international flights, but has a low number of seats in proportion to its population
...however, seats per capita is still low
# of international destinations by country of origin (2012)
Seats on international flights/day/million inhabitants1 (2012)
0
Note: Based on flights in the week of June 4th to 10th, 2012. Departures only (~half of the total number of flights) / Source: OAG database; BCG analysis
BRAzil
vENEzUElA
ColomBiA
mExiCo
PERU
ECUAdoR
ARgENtiNA
CHilE
PANAmA
0 10 20 30 40
31
31
27
23
23
20
20
19
BRAzil
PANAmA
mExiCo
vENEzUElA
ARgENtiNA
ColomBiA
PERU
CHilE 66%
75%
75%
15%
15%
10%
10%
13%
9%
7%
6%
26%
22%
37% 12%
6%
61%
70%
44%
87%
52% 26% 23%
11% 21%
latin America
europe
Asia
other
4,855
643
471
406
414
374
309
311
167
500 1,000 4,000
EURoPE

120 AttrActiveness of BrAzil As An internAtionAl investment And Business huB
• Trade in services: trade in services has added importance when it comes to creating a service based business hub;
• Capital flows: the inward and outward flow of capital is a key indicator for an invest-ment and business hub, as it enables funding domestic issuers and offers greater options for investing elsewhere in the world;
• International agreements allowing capital flows: Being a signatory to bilateral investment agreements demonstrates willingness to facilitate the inward and outward capital flows;
• National regulations supporting international capital flows: this helps measure the extent to which a country’s regulation, in and of itself, facilitates capital inflows, based on the opinion of experts;
• Expansion of the country’s multinationals: international activities of the country’s multinationals and their ability to compete in the global arena are important means of connectivity for a hub, as they can leverage other flows such as people and trade;
• Ease of entry for foreign multinationals: the readiness of a country’s regulation to receive foreign businesses is a determining factor when it comes to their willingness to enter a country, leveraging the country’s economy and connectivity;
• Openness to immigrants: immigrant share of the population of a country is evidence of its people connectivity to the rest of the world;
• People mobility: international people mobility, measured here by the number of flights to foreign destinations originating in the country, is a relevant point as it enables people to enter and leave a hub.
the following exhibit shows how Brazil compares to other countries along the indicators of the connectivity pillar:

AttrActiveness of BrAzil As An internAtionAl investment And Business huB 121
Brazil was found to be “critical” or “needs development” in all of the dimensions asses-sed, and is quite far from the other hubs included in the analysis. nevertheless, when it comes to expansion of its multinationals, looking at the list of the 100 companies with the largest volume of assets abroad, the inclusion of vale moved Brazil from “critical” to “needs improvement”.
capital flows and the trade in goods and services are weighted based on country share of the global GdP. thus hong Kong and singapore, being smaller, come out at the top of the list. nevertheless, other countries with GdPs larger than Brazil’s continue to be ranked higher, showing there is still room for improvement. to this end international agreements could be used to leverage flows, as they are enablers of such dimensions.
connectivity
critical needs improvement good excellent
TRA
De
CAPI
TAL
BUsI
Nes
ses
Peo
PLe
jPN KoR sgPDeUgBRUsA RUs CHNIND MeXTRADe IN gooDs
FRA
HKgCHL2.
BRA
KoR jPN DeU UsARUs CHN CHLINDMeX
sgP FRAgBR
INTeRNATIoNAL oPeNNess FoR TRADe IN gooDs1
1.
BRAHKg
PeoPLe MoBILITyCHL IND CHN RUsMeX HKg
gBRjPN
FRA11.
BRAUsAsgP
KoRDeU
CHN
IND RUsUsA
MeX
CHLjPN
KoR
HKgsgPgBRDeU FRA5.
BRA
CAPITAL FLows
INTeRNATIoNAL oPeNNess FoR TRADe IN seRvICes1
3.jPNDeU
FRAKoRsgP CHNIND MeX gBR
HKg
CHL
BRAUsA
TRADe IN seRvICesFRA KoR
sgP
gBRCHN CHL INDMeX jPN
RUs
UsA DeU HKg4.
BRA
CHNCHLMeX FRAjPN
gBR
sgP DeUKoR6.
BRA
HKg
INTeRNATIoNAL AgRe-eMeNTs ALLowINg CAPITAL FLows1 INDRUs
UsA
CHN RUs CHL
IND
MeX gBR HKgUsA jPNKoR7.
BRA
DeU
sgPFRANATIoNAL RegULA-TIoNs sUPPoRTINg INTeRNATIoNAL CAPITAL FLows1
eXPANsIoN oF THe CoUNTRy’s MULTINATIoNALs IND
RUs MeX CHNCHL HKg gBR UsAjPN DeU FRA
KoR8.
BRAsgP
eAse oF eNTRy FoR FoReIgN MULTINATIoNALs1
IND
CHL
MeX RUsCHN UsAKoR FRA9.
gBR
sgP jPN
oPeNNess To IMMIgRANTs1
IND RUsCHN MeX CHL gBR HKgKoR jPN DeU10.
BRA
UsA sgPFRA
BRA
1. DATA CANNoT Be UPDATeD FRoM THe 2011 ATTRACTIveNess RePoRT
MAIN INTeRNATIoNAL HUBs oTHeR DeveLoPeD NATIoNseMeRgINg NATIoNs

122 AttrActiveness of BrAzil As An internAtionAl investment And Business huB
Conclusion
Brazil’s size and prominence in the region make it an important center of connectivity with the world, and the natural destination of international flows of goods, services, ca-pital and people. this important position can be consolidated to materialize the country’s potential, irradiating the advantages of being an investment and business hub to the entire region. to achieve this, Brazil must promote an international agenda focused on building partnerships and signing agreements with the rest of the world, along with initiatives to standardize its regulatory framework and technical standards.
on the business front, multilatinas continue to expand their international activities but, with a few exceptions, are still far from being global exponents. finally, regarding people mobility, modern legislation enabling greater flows of foreigners is essential. making it easier for decision makers and qualified professionals to enter and leave the country will foster an environment that is suitable for the decision making centers of businesses and regional headquarters. this would be one more lever contributing to disclosing the virtues of the country.
makIng It easIer for decIsIon makers and qualIfIed professIonals to enter and leave the country wIll foster an envIronment that Is suItable for the decIsIon makIng centers of busInesses and regIonal headquarters

AttrActiveness of BrAzil As An internAtionAl investment And Business huB 123

124 AttrActiveness of BrAzil As An internAtionAl investment And Business huB
07iMage of the country
the image of a country reflects the world’s perception of a hub and, to a certain extent, the other pillars of attractiveness. the image of a country may be the result of the ex-perience of foreigners living in it, information spread in the media or formal reports. A country must have a suitable environment and this must be properly publicized so that its image may be projected accurately, stressing qualities and putting shortcomings in the right context in order to increase its attractiveness as a hub.
this section is split into three aspects essential for the image of a hub: a place to do business, a place to live and a place to travel to.
main aspects of the image of the country pillarA place to do business: the various business agents, be they businesses, people or investors, may be more inclined towards a country with a positive reputation for doing business.
A place to live: the image of a country as a good place to live, the result of good living conditions for its inhabitants, is essential for attracting talents and therefore for creating an investment and business hub.
A tourist destination: tourism brings in revenue and helps disclose the country to international travelers, as they return to their countries of origin and talk about their experience.

AttrActiveness of BrAzil As An internAtionAl investment And Business huB 125
A place to do business
to consolidate its position as an investment and business hub it is critical that Brazil develop a solid and positive image as a place to do business. this can be measured using indexes that analyze the relative perception of a given country or city, or more tangible indicators such as a hub’s ability to attract events such as business congres-ses. the nation Brands index99, which measures country image based on a number of dimensions, shows that Brazil’s image in terms of idea and product generation, and also its institutional environment, is not favorable, scoring below the average for all countries included in the survey (see Exhibit 46).
99 2010 Anholt-GfK roper nation Brands report de evaluation of 50 countries
exhiBit 46Brazil’s image as a place to do business is below the global average
1. The country contributes with innovations in science and technology; knowledge of where the product is manufactured increases likelihood to buy; has a creative environment and advanced business ideas 2. Government is honest and respectful of rights; the country acts responsibly in terms of protection and security; there is concern with poverty and the environment / Note: survey of 50 nations Source: The Anholt-GfK Roper Nation Brands IndexSM 2010 50 Country Report
Domestic Products1 Institutional Environment2
BESt BESt
WoRSt WoRSt
AvERAgE
AvERAgE
JAPAN CANAdA
BRAzil
BRAzil
ANgolA iRAN
77
37
53
66
34
52
51
52
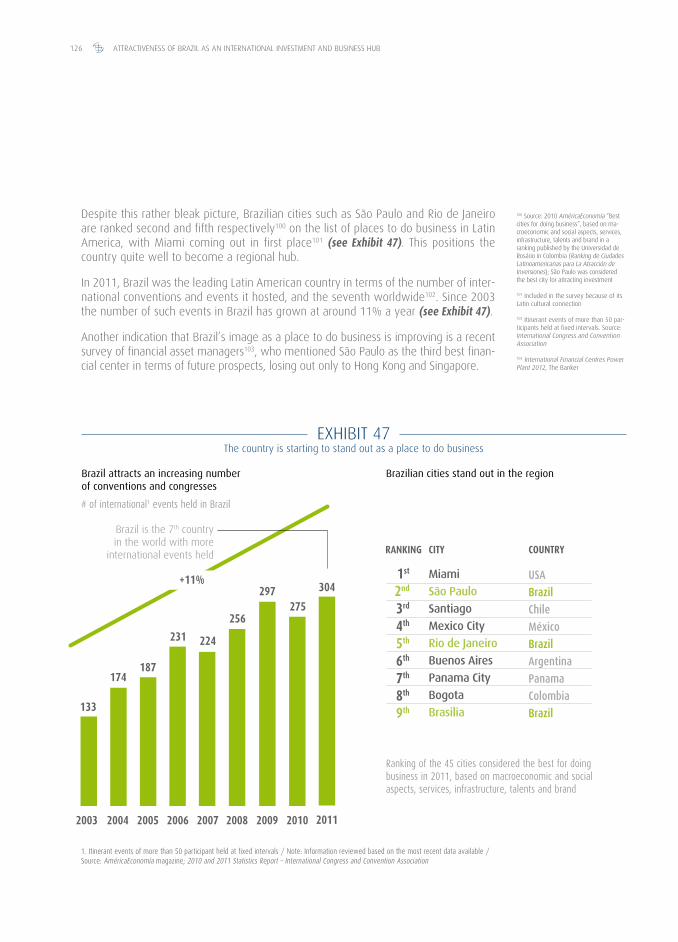
126 AttrActiveness of BrAzil As An internAtionAl investment And Business huB
despite this rather bleak picture, Brazilian cities such as são Paulo and rio de Janeiro are ranked second and fifth respectively100 on the list of places to do business in latin America, with miami coming out in first place101 (see Exhibit 47). this positions the country quite well to become a regional hub.
in 2011, Brazil was the leading latin American country in terms of the number of inter-national conventions and events it hosted, and the seventh worldwide102. since 2003 the number of such events in Brazil has grown at around 11% a year (see Exhibit 47).
Another indication that Brazil’s image as a place to do business is improving is a recent survey of financial asset managers103, who mentioned são Paulo as the third best finan-cial center in terms of future prospects, losing out only to hong Kong and singapore.
100 source: 2010 Américaeconomía “Best cities for doing business”, based on ma-croeconomic and social aspects, services, infrastructure, talents and brand in a ranking published by the universidad de rosário in colombia (ranking de ciudades latinoamericanas para la Atracción de inversiones); são Paulo was considered the best city for attracting investment
101 included in the survey because of its latin cultural connection
102 itinerant events of more than 50 par-ticipants held at fixed intervals. source: international congress and convention Association
103 international financial centres Power Plant 2012, the Banker
exhiBit 47the country is starting to stand out as a place to do business
brazil attracts an increasing number of conventions and congresses
# of international1 events held in Brazil
2004 2005 2006 2007 2008 2009 2010 20112003
+11%
Brazil is the 7th country in the world with more
international events held
1. Itinerant events of more than 50 participant held at fixed intervals / Note: Information reviewed based on the most recent data available / Source: AméricaEconomía magazine; 2010 and 2011 Statistics Report – International Congress and Convention Association
Ranking of the 45 cities considered the best for doing business in 2011, based on macroeconomic and social aspects, services, infrastructure, talents and brand
brazilian cities stand out in the region
usa
brazil
chile
México
brazil
argentina
panama
colombia
brazil
Miami
são Paulo
santiago
Mexico City
Rio de janeiro
Buenos Aires
Panama City
Bogota
Brasilia
1st
2nd
3rd
4th
5th
6th
7th
8th
9th
CoUNtRYCitYRANkiNg
297
256
224231
187174
133
275
304

AttrActiveness of BrAzil As An internAtionAl investment And Business huB 127
104 the Wealth report 2012
105 the model most often used for such reports according to a KPmG and ernst &
young survey
still on the growing importance of são Paulo as an international investment and busi-ness hub, a survey of citi Private Bank consultants and Knight frank experts in luxury properties around the world104 suggests that by 2022, são Paulo will be the 8th most important city in the world for the very wealthy, passing Geneva, rome, moscow, du-bai, mumbai, frankfurt, madrid and vancouver. rio de Janeiro was also mentioned as being among the 20 cities that will most increase in importance in the world.
sustainability is increasingly a recurring and important theme on companies’ agen-das, and contributes to a positive image of Brazil as an investment and business hub. in 2011, Brazil was the sixth country in the number of businesses publishing annual sustainability reports using Gri (Global reporting initiative) guidelines105 (see Exhibit 48). however, Brazilian corporate sustainability practices are not fully reflected in global sustainability rankings: of the 100 most sustainable businesses in the world according to corporate Knights, only three are Brazilian (see Exhibit 48). however, it is worth mentioning that the three companies that are in the ranking improved their position compared to 2010, in particular natura, which climbed to the number 2 position in 2012.
still on the theme of the country’s prominence in sustainability, in 2012 it hosted the rio+20 united nations conference on sustainable development, consolidating its posi-tion in the global debate on the topic.
Given the economic scenario and increased exposure, Brazil should seize the moment and promote its international investment and business image. Both Best (Brazil: ex-cellence in securities transactions), which presents the Brazilian capital and financial markets to foreign investors, and APex (Brazilian Agency for the Promotion of exports and investments), which promotes Brazil in the context of world trade, have initiatives to attract businesses in Brazil, and while important, these efforts still have quite limited reach. further efforts are required to spread Brazil’s strengths and mitigate any nega-tive misconceptions there may be about doing business in the country.
sustaInabIlIty Is IncreasIngly a recurrIng and Important theme on companIes’ agendas, and contrIbutes to a posItIve Image of brazIl as an Investment and busIness hub

128 AttrActiveness of BrAzil As An internAtionAl investment And Business huB
USA UNitEd kiNgdom
JAPAN JAPAN
SPAiN USA
CHiNA FRANCE
SWEdEN CANAdA
BRAzil AUStRAliA
gERmANY SWitzERlANd
AUStRAliA gERmANY
SoUtH koREA SWEdEN
NEtHERlANdS dENmARk
SoUtH AFRiCA NEtHERlANdS
CANAdA SPAiN
UNitEd kiNgdom BRAzil
SWitzERlANd FiNlANd
itAlY SiNgAPoRE
RUSSiA SoUtH koREA
ARgENtiNA iNdiA
AUStRiA otHER
exhiBit 48Brazilian businesses are very concerned with sustainability, yet this fact is not recognized internationally
# of businesses publishingsustainability reports1 -2011
# of companies among the 100 most sustainable2
197 12
352
172 8
162 8
139 6
123 6
115 5
110 5
98 4
98 4
88 4
83 4
81 3
74 2
59 2
55 2
53 1
52 9
brazil is number 6 when it comes to the number of reports published...
...but has only 3 companies on the global list of the 100 most sustainable
1. Includes only companies that disclose their results using GRI standards (Global Reporting Initiative) guidelines, the ones most often used based on a KPMG and Ernst & Young survey completed in 2011 2. Corporate Knights The World’s Most Sustainable Companies - 2012Source: GRI; Corporate Knights; BCG analysis
2. natura61. Bradesco81. Petrobrás
15

AttrActiveness of BrAzil As An internAtionAl investment And Business huB 129
A place to live
Brazil is still not considered a good place to live, although recognized the world over for its cultural openness and hospitality, and in spite of the fact that in 2009 forbes magazine elected rio de Janeiro the happiest city in the world106. in the economist intelligence unit ranking on this same topic, published in 2012, são Paulo and rio de Janeiro were ranked only 42nd and 43rd out of a list of 70 cities (see Exhibit 49). this gap may be based on real issues such as traffic congestion and public safety, but it is also partly the result of the poor spread of the country’s strengths and improvements made to remedy its weaknesses.
obviously, investing to improve weaknesses will have an important impact on Brazil’s perception abroad, but there should be some structured spread of these efforts and results, which does not exist right now. today, Brazil’s image as a place to live is being diffusely spread by the media, international rankings and people going into and out of the country. there is still no consistent strategy to highlight the country’s advantages, or point to the progress it has made and put its shortcomings into perspective.
the 2011 effort to bring peace to rio’s main slums was widely reported in the in-ternational media, which is an example of positive advertising. it is also worthwhile mentioning that in 2010, the homicide rate in são Paulo was lower than in some of the metropolitan regions of the united states: 10.6107 per 100 thousand inhabitants, compared to 21.9 in Washington d.c. and 15.2 in chicago108.
Brazil should spread its efforts in a more organized and consistent way, using the press, global opinion leaders visiting Brazil or international campaigns, working to tear down any resistance there may be resulting from a lack of information or even misinformation.
106 source: forbes magazine list of the World’s happiest cities, published in
september 2009
107 in 2011 there were 1,019 homicides, or 9.0 per 100,000 inhabitants. Based on the numbers for the first half of the year, and the increase in population between
2009 and 2011, the homicide rate in 2012 should be around 10.7 per 100 thousand
inhabitants. source: state of são Paulo Bureau of Public safety
108 source: fBi (federal Bureau
of investigation)
exhiBit 49Brazil does not have a good image as a place to live
canada
australia
japan
argentina
chile
peru
braZil
braZil
Mexico
coloMbia
veneZuela
toronto
sydney
osaka
buenos aires
santiago
lima
são paulo
rio de janeiro
Mexico city
bogota
caracas
1st
2nd
3rd
26th
27th
36th 42nd
43rd
48th
50th
55th
1. 2012 EIU ranking of the 70 best cities to live in, based on stability, healthcare services, culture and environment, education and infrastructure / Source: EIU
CoUNtRYCitYRANkiNg1

130 AttrActiveness of BrAzil As An internAtionAl investment And Business huB
A tourist destination
the country’s natural beauty and culture contribute to its positive image as a tourist destination, which is highlighted internationally (see Exhibit 50). however, this posi-tive image is not reflected in the number of incoming tourists. Brazil is only the 39th ranked country on the list of the 60 most attractive travel destinations (see Exhibit 50), and gets less than 1% of the world travelers. What is even worse is that the country has not kept up with the growth in international travel, as the number of tourists into Brazil has remained flat and the number of business travelers actually declined (see Exhibit 51).
exhiBit 50despite a good image, Brazil attracts fewer than 1% of the world’s travelers
1. Questions: Interest in visiting the country, it is rich in natural beauty and historical monuments, and its cities are exci-ting 2. It is successful in ports and has both cultural heritage and a contemporary culture Note: survey of 50 countries 3. Refers to all types of temporary visitors - tourists and business travelers - excludes visitors who will exercise some form of remunerated activity in the country of destination. Average for 2009 - 2011 / Source: The Anholt-GfK Roper Nation Brands Index SM, 2010 50 Country report, EIU
Tourism1 Culture2
brazil has a positive image in tourism and cultural issues...
BESt BESt
WoRSt WoRSt
AvERAgE
AvERAgE
itAlY
BRAzil BRAzil
USA
iRAN iRAN
75
62
70
56
45
67 63
43
Ranking Country % of world travelers
...but attracts only a small share of the world’s tourist trade3
10.4%
7.8%
7.3%
4.0%
3.8%
3.4%
3.1%
3.1%
2.3%
1.2%
1.1%
1.0%
0.7%
0.7%
france
usa
china
united Kingdom
hong Kong
germany
russia
Mexico
canada
singapore
south Korea
japan
india
braZil
1st
2nd
4th
6th
7th
9th
11th
12th
15th
24th
27th
31st 37th 39th
Brazil is ranked 39th out of 60 countries
Brazil is ranked 10th out of 50 countries
Brazil is ranked 13th out of
50 countries

AttrActiveness of BrAzil As An internAtionAl investment And Business huB 131
Brazil has an even greater opportunity to capture a greater share of international tra-vel, as it already enjoys a favorable image internationally. Brazil has a good standing in ecotourism, and according to both forbes109 and national Geographic110, the Brazilian Pantanal is an absolute “must know” green vacation destination.
Brazil could also use the perception of those tourists who have had the chance to learn about its potential as a lever to develop its image as a place to live and do business, one that is consistent with an investment and business hub.
the Brazilian ministry of tourism and the Brazilian tourism institute (embratur) often take initiatives, and it is important to ensure they continue. the 2014 fifA World cup and the 2016 olympic Games are events capable of attracting 600 thousand and 380 thousand foreign visitors respectively111, and they present unique opportunities to con-solidate a positive image in a large number of travelers over a short period of time.
109 the World’ Best Green vacations
110 Best Green Adventures
111 source: embratur
exhiBit 51tourism in Brazil has not followed the growing number of tourists in the world
business travel to brazil has increased since 2005the number of international travelers has remained constant
-0.2%
-5.2%
+2.0%
20062005 2007 2008 2009 2010
CAgR05-11
leisure
business
other
International travelers in Brazil (M)International travelers by destination (M)
3.2%
2.7%
0.2%
CAgR05-11
world
latin aMerica
braZil20062005 2007 2008 2009 2010 2011
668.5
703.4
756.5
747.4
715.2
762.2
785.8
34.834.7 38.236.5 36.6 40.9 42.0
5.4 5.0 5.0 5.1 4.8 5.2 5.4
1.4 (27%)
1.6 (29%)
2.4 (44%)
1.4 (28%)
1.4 (28%)
2.2 (44%)
1.4 (28%)
1.4 (27%)
2.2 (44%)
1.5 (30%)
1.4 (27%)
2.2 (43%)
1.5 (32%)
1.1 (23%)
2.2 (46%)
1.6 (31%)
1.2 (23%)
2.4 (46%)
5.45.0 5.0 5.1 5.2
4.8
Note: According to the most recent data taken from the EIU / Source: Ministry of Tourism; EIU, BCG analysis

132 AttrActiveness of BrAzil As An internAtionAl investment And Business huB
Indicators
the dimensions selected for continuous tracking of the image of the country pillar are:
• Image as a place to do business: the positive image of a hub in the business world is essential if it is to attract investors and businesses in search of opportunities;
• Foreign interest in the country’s investment and business: foreign interest in Brazil, measured here by the number of searches containing the country name and business related words, measures its international projection and therefore its poten-tial for attracting foreign business;
• Attractiveness for international events: the number of international events held in a hub is a measure of how interesting it is to foreign businesses and investors, and contributes to creating a hub;
• Sustainability: A country’s attitude towards its natural resources defines its sustai-nability and contributes to its business image. it also influences its image as a place to live and as a tourist destination;
• Quality of life: Quality of life defines a country’s image as a place to live, and thus its attraction to international talents and businesses looking for locations around the world;
• Cultural openness: the cultural openness of a country means it welcomes business travelers and tourists, and also ensures its own citizens are welcome abroad, it is a key element for consolidating a hub with international ambitions;
• Personal safety and asset security: together with quality of life, safety and security define the attractiveness of a hub as a place to live or travel to;
• Image for tourism and leisure: leisure and tourism contribute directly to a hub as they generate business and, indirectly, help develop a country’s image abroad;
• Quantity of visitors: intensity of travel, as well as the country’s image in this regard, me-asures international interest in the country and helps spread the hub’s international image.
the following exhibit shows how Brazil compares to other countries along the dimen-sions of the image of the country pillar:

AttrActiveness of BrAzil As An internAtionAl investment And Business huB 133

134 AttrActiveness of BrAzil As An internAtionAl investment And Business huB
in the dimensions related to the image of the country as a place to live and do busi-ness, Brazil stands out in its attractiveness for international events and sustainability. however, in the more fundamental dimensions such as international interest in invest-ment and business, and the image of the country for business, Brazil still comes out as “critical” or “needs development”.
Brazil’s image is particularly unfavorable as a place to live, as it is rated “critical” in quality of life and personal safety and asset security, despite an excellent position in cultural openness, where it is the best-ranked country of all those included in the analysis.
finally, Brazil does well as a tourist destination but has not been able to translate this positive perception into more intense tourist flows.
imAGe of the country
critical needs improvement good excellent
FRA DeU CHLgBR
UsA
sgP HKgjPN KoRRUs IND
MeX
CHNCULTURAL oPeNNess6.
BRA
HKg sgP
UsA
DeU
RUs
CHL
FRA
KoR INDFoReIgN INTeResT IN THe CoUNTRy’s INvesTMeNT AND BUsINess
2.
BRA
jPN
MeX CHN gBR
KoR
CHN FRAHKg
MeX
RUsCHLQUANTITy oF vIsIToRs9.
BRAIND jPN
DeU gBR UsA
sgP
CHL sgP
RUs
UsAgBRCHN
MeX
IMAge As A PLACe To Do BUsINess1.
BRA
IND FRA jPN
KoR
DeU
gBR
DeUHKg sgP
KoR CHN
RUs IND MeXCHL jPNATTRACTIveNess FoR INTeRNATIoNAL eveNTs3.
BRAUsAFRA
FRA
DeU gBRKoR jPNCHLMeXIND RUsCHNsUsTAINABILITy4.
BRAsgP
UsA
KoR gBR
FRA
UsA sgPIND DeU
RUs
CHN CHL jPNQUALITy oF LIFe5.
BRAHKg
MeX
CHLKoR
jPN
gBR sgP
HKg
UsARUs
CHN
INDPeRsoNAL sAFeTy AND AsseT seCURITy7.
BRAMeX FRA DeU
jPN DeU
FRA
sgP RUsCHL CHNIMAge FoR ToURIsM AND LeIsURe8.
BRA
INDKoR
MeX UsA
gBR
MAIN INTeRNATIoNAL HUBs oTHeR DeveLoPeD NATIoNseMeRgINg NATIoNs

AttrActiveness of BrAzil As An internAtionAl investment And Business huB 135

136 AttrActiveness of BrAzil As An internAtionAl investment And Business huB
Conclusion
to leverage this pillar, Brazil should continue to pursue its efforts, especially when it comes to its image for business. furthermore, perceptions that impact day-to-day life such as quality of life, personal safety and asset security, if properly handled, could doubly contribute to improve Brazil’s image. in first place, they would have a positive impact on people’s interest in Brazil as a place to live, and would also impact the number of international travelers choosing Brazil as a destination. this would influence Brazil’s position in this matter, which does not accurately reflect reality, especially compared to other countries.
important international events such as rio+20 in 2012, focusing on sustainable deve-lopment, can help consolidate the country’s image. in the near future, the fifA World cup in 2014 and the olympic Games in 2016 are events that can catalyze initiatives to advertise Brazil abroad and consequently help to improve the perception of the coun-try. But it is critical that the improvement measures expected, especially those related to physical infrastructure, are actually completed in time for these events. otherwise the country’s image could be seriously damaged.
furthermore, a better image of the country along any of the dimensions analyzed will benefit greatly from coordinated and focused efforts, such as media campaigns or initiatives such as Best or APex, which still have a limited scope.
Important InternatIonal events such as rIo+20 In 2012, focusIng on sustaInable development, can help consolIdate the country’s Image

AttrActiveness of BrAzil As An internAtionAl investment And Business huB 137

138 AttrActiveness of BrAzil As An internAtionAl investment And Business huB
conclusion
An international investment and business hub fosters the development of a coun-try and its region. latin America, like other regions in the world, needs a strong network of hubs, some of which must be global, and for this Brazil is one of the natural candidates.
this report reexamines the seven pillars that make a hub attractive - macroeco-nomic environment, institutional environment, talent and human capital, physi-cal infrastructure, financial infrastructure, connectivity and image of the country, showing how Brazil’s performance compares to that of 13 countries along the 57 dimensions that make up these pillars. While Brazil is currently quite far from the world’s leading hubs, the country has a number of qualities that make it suitable as a hub, such as a robust economy, strong financial infrastructure and political and institutional stability.
Brazil stands out for its size. it is already the world’s sixth largest economy, having surpassed the uK in 2011. it is also in the demographic bonus phase, what makes it the only one of the world’s large economies whose population grows fast enough to supply the future need for manpower. right now it attracts 40% of all of the foreign direct investment going into latin America, and cities such as são Paulo and rio de Janeiro are already considered as good places to do business in the region.
interest rates have been dropping steadily, and in 2012 reached the lowest level ever since records have been kept (1986) - less than 3% a year, compared to 12% in 2006. this brings interest rates in Brazil in line with other emerging nations such as china and russia, and opens the way for cheaper financing. lower interest rates also encourage the use of other financial instruments such as debentures, which are still little used in Brazil.
Given this scenario, Brazil has become more attractive to international talents, as shown in the results of a global survey with executives conducted by the imd and the growing number of work visas granted. this can be attributed to the positive ou-tlook for Brazil and a global crisis that is driving companies to invest in the country and moving talents to come take advantage of the existing opportunities.
AttrActiveness of BrAzil As An internAtionAl investment And Business huB 139
there is still a lot to be done to ensure the continuity of the positive measures already underway. however, given the global scenario and the advances of the last decade, the outlook for Brazil is quite positive, not only because of its inherent potential, but also because of the progress it has made in recent years.
however, the future presents clear challenges requiring long-term initiatives that should start as soon as possible. if these are properly addressed they can contri-bute to taking advantage of this auspicious economic moment, helping to make Brazil more attractive. some of these challenges are: improving the still precarious transport infrastructure, a less complex tax system and better qualified manpower.
it is clear that the Brazilian Government is committed to reducing the bottlenecks in physical infrastructure, with the involvement of the private sector, as in the case of the concession of three large airports in 2012 and the logistics investment Program announced in mid-2012.
Besides this, 4G mobile telephone frequencies were auctioned also in 2012, ena-bling more advanced mobile data services available to the population in time for the fifA World cup in 2014, probably with no change in the competition environment.
in order to take advantage of the favorable international scenario, the Presidential Bureau of strategic Affairs is looking at ways to encourage qualified foreigners to come to Brazil, which would also help improving the training of local talents.
BrAin is aware of all the above and continuously looks for opportunities of improve-ment and, as it has been the case since the beginning, works hard to improve Brazil’s attractiveness. All those who realize the importance of creating an international invest-ment and business hub in Brazil and latin America are invited to participate.
visit our website to track and be part of this process: www.brainbrasil.org.

140 AttrActiveness of BrAzil As An internAtionAl investment And Business huB
APPendix: detAils of the indicAtors used112
112 ranking criteria based on averages and standard deviations except where otherwise mentioned

AttrActiveness of BrAzil As An internAtionAl investment And Business huB 141
mAcroeconomic environment
FiSCAl SoliditYP
ExtERNAl vUlNERABilitY
ECoNomiC volAtilitY
HUmAN dEvEloPmENt
iNComE diStRiBUtioN
diMension indicator sourcerationale for selection
ranKing criteria
World economic outlook database, imf
the economist intelligence unit
the economist intelligence unit
human development reports, undP
World competitiveness yearbook, imd4
consistent assessments since 1984, global coverage
covers 150 countries
covers 150 countries
data available for over 160 countries since 1970
Published consistently since 1989, currently covers 59 countries
Critical: ≥ 83needs improvement: 83 to 49Good: 49 to 15Excellent: ≤ 15
Critical: ≤ 23needs improvement: 23 to 99Good: 99 to 175Excellent: ≥ 175
Critical: ≥ 0.8needs improvement: 0.8 to 0.5Good: 0.5 to 0.2Excellent: ≤ 0.2
Critical: ≤ 0.77needs improvement: 0.77 to 0.82Good: 0.82 to 0.86Excellent: ≥ 0.86
Critical: ≥ 50needs improvement: 50 to 42Good: 42 to 33Excellent: ≤ 335
ECoNomiC gRoWtHP
the economist intelligence unit
covers 150 countries. 5-year projections for all countries
Analytical distribution:Critical: ≤ -1needs improvement: -1 - 1.5Good: 1.5 to 4Excellent: ≥ 4
Projected average annual GdP growth over the next 5 years
moNEtARY StABilitYP
the economist intelligence unit
covers 150 countries. 5-year projections for all countries
Analytical distribution:Critical: ≥ 20needs improvement: 8 to 20Good: 4 to 8Excellent: ≤ 4
Projected average annual inflation rate over the next 5 years
Projected Gross Public sector debt (% GdP)
international reserves/ total external debt1
variation in the short term interest rate for government bonds2
human development index (idh)3
Gini index
1
2
3
4
5
6
7
1. last three years 2. last five years 3. calculated based on health, education and the economy 4. Based on imd data, a different source from the 2011 report 5. maximum and minimum distribution according to the universe of countries available. All other values distributed linearly / P: indicator based on projected data

142 AttrActiveness of BrAzil As An internAtionAl investment And Business huB
institutionAl environment
lEgAl SECURitY
lABoR mARkEt FlExiBilitY
EASE oF oPENiNg A BUSiNESS
HoW EASY it iS FoR BUSiNESSES to PAY tAxES
diMension indicator sourcerationale for selection
ranKing criteria
World Governance indicators, World Bank
World competitiveness yearbook, imd
investing Accross Borders, World Bank
doing Business, World Bank
has consistently covered 230 nations since 1996
Published consistently since 1989, currently covers 59 countries
initiative covering 87 countries focusing specifically on fdi (foreign direct investment)
detailed study of 183 countries since 2002
Analytical distribution:Critical: ≤ -1needs improvement: -1 to 0Good: 0 to 1Excellent: ≥ 1
Critical: ≥ 46needs improvement: 46 to 28Good: 28 to 11Excellent: ≤ 11
Critical: ≤ 50needs improvement: 50 to 64Good: 64 to 79Excellent: ≥ 79
Critical: ≥ 524needs improvement: 524 to 277Good: 277 to 29Excellent: ≤ 29
PolitiCAl StABilitY World Governance indicators, World Bank
has consistently covered 230 nations since 1996
Analytical distribution:Critical: ≤ -1needs improvement: -1 to -0Good: 0 to 1Excellent: ≥ 1
Political stability and absence of political violence (score)
QUAlitY oF REgUlAtioNS
World Governance indicators, World Bank
has consistently covered 230 nations since 1996
Analytical distribution:Critical: ≤ -1needs improvement: -1 to 0Good: 0 to 1Excellent: ≥ 1
Quality of regulations(score)
rule of law(score)
labor market flexibility (score)
ease of opening a foreign businesses (score)
hours required to pay taxes
1
2
3
4
5
6

AttrActiveness of BrAzil As An internAtionAl investment And Business huB 143
tAlent And humAn cAPitAl
QUAlitY oF PRimARY ANd SECoNdARY
EdUCAtioN
QUANtitY oF HigHER EdUCAtioN
AligNmENt BEtWEEN HigHER EdUCAtioN
ANd tHE mARkEt
iNtERNAtioNAlizAtioN oF tHE CoUNtRY’S EdUCAtioN (FoREigN lANgUAgES ANd
ExPERiENCE)
AvAilABilitY oF QUAliFiEd mANAgERS
ANd ENgiNEERS
diMension indicator sourcerationale for selection
ranKing criteria
oecd
unesco, iBGe, and the World economic forum competitiveness report
World competitiveness yearbook, imd
World competitiveness yearbook, imd
World competitiveness yearbook, imd
this test provides a unified version of learning around the world, applied every three years to 15 year olds in 65 countries
shows the percent people of university age enrolled in universities1
A report published annually based on primary data sources and a glo-bal opinion survey of executives with some 4,500 respondents
A report published annually based on primary data sources and a glo-bal opinion survey of executives with some 4,500 respondents
A report published annually based on primary data sources and a glo-bal opinion survey of executives with some 4,500 respondents
A report published annually based on primary data sources and a glo-bal opinion survey of executives with some 4,500 respondents
A report published annually based on primary data sources and a glo-bal opinion survey of executives with some 4,500 respondents
A report published annually based on primary data sources and a glo-bal opinion survey of executives with some 4,500 respondents
countries that manage their diaspora are positives, those that do not are negatives
dEmogRAPHiC CoNtiNgENtP
un, ilo, the economist intelligence unit, oecd, euromonitor
reflects demographic sufficiency for economic development
Analytical distribution:Critical: ≤ -1needs improvement: -1 to 0Good: 0 to 1Excellent: ≥ 1
cAGr gap between eAP and demand for workers
QUANtitY oF PRimARY ANd SECoNdARY
EdUCAtioN
unesco, iBGe, ministry of education and the World economic forum competitiveness report
measures the percentage of the school age population actually in school1
Critical: ≤ 440needs improvement: 440 to 468Good: 468 to 495Excellent: ≥ 495
Critical: ≤ 27needs improvement: 27 to 40Good: 40 to 54Excellent: ≥ 54
Critical: ≤ 4.9needs improvement: 4.9 to 5.6Good: 5.6 to 6.4Excellent: ≥ 6.4
Critical: ≤ 3.4needs improvement: 3.4 to 4.2Good: 4.2 to 5Excellent: ≥ 4.8
Critical: ≤ 5.6needs improvement: 5.6 to 6.1Good: 6.1 to 6.6Excellent: ≥ 6.6
Critical: ≤ 3.5needs improvement: 3.5 to 4.9Good: 4.9 to 6.2Excellent: ≥ 6.2
Critical: ≤ 4.4needs improvement: 4.4 to 5.3Good: 5.3 to 6.2Excellent: ≥ 6.2
Critical: ≤ 5.6needs improvement: 5.6 to 6.1Good: 6.1 to 6.5Excellent: ≥ 6.5
Critical: ≤ 75needs improvement: 75 to 82Good: 82 to 90Excellent: ≥ 90
Average between the net enrollment rate in primary and secondary school
Average scores in reading, science and mathematics in the international PisA test
Gross enrollment rate in higher education
score given by execu-tives regarding how well higher education is aligned with what the market needs
Average flow of students coming into and leaving the country to study, and score given by executives regarding the alignment of language education and market needs
Assessment of the avai-lability of qualified senior managers and engineers
iNtENSitY oF RESEARCH ANd dEvEloPmENt
AttRACtivENESS oF tHE CoUNtRY
to iNtERNAtioNAl tAlENtS
tAlENt immigRAtioN ComPlExitY
diASPoRA mANAgEmENt
number of ftes (full-time equivalents) in research and development per thousand inhabitants
score given by executi-ves to the attractiveness of the country to interna-tional talents
score given by executives to the complexity for talents to enter a country
existence of programs or entities to manage the diaspora in each country
World competitiveness yearbook, imd
World competitiveness yearbook, imd
World competitiveness yearbook, imd
Qualitative BcG analysis based on country websites
there is no secondary data available for this assessment - BrAin may continue the analysis of several countries in future years
1
2
3
4
5
6
7
8
9
10
11
P: indicator based on projected data 1. Brazil data being reviewed by unesco. Based on iBGe and ministry of education information

144 AttrActiveness of BrAzil As An internAtionAl investment And Business huB
PhysicAl infrAstructure
QUAlitY ANd CoSt oF tElECommUNiCAtioN
AvAliABilitY oF PoWER
BASiC SERviCES AvAliABlE to tHE
URBAN PoPUlAtioN
World competitiveness yearbook, imd
World competitiveness yearbook, imd
World Bank
A report published annually based on primary data sources and a global opinion survey of executives with some 4,500 respondents
A report published an-nually based on primary data sources and a global opinion survey of executives with some 4,500 respondents
indicator shows how much of the urban population is served by basic services
critical: < 6.6needs improvement: 6.6 to 7.7Good: 7.7 to 8.8excellent: > 8.8
critical: < 4.4needs improvement: 4.4 to 6.1Good: 6.1 to 7.7excellent: > 7.7
critical: < 80needs improvement: 80 to 87Good: 87 to 95excellent: > 95
URBAN moBilitY iBm commuter Pain index and domestic sources about size of subway network and population
indicators reflect the urban mobility options available in the economic centers of each country
critical: < 1.5needs improvement: 1.5 to 4.1Good: 4.1 to 6.7excellent: > 6.7
score is a combination of traffic (commuter Pain index) and subway availability in the main cities in each country
QUAlitY oF tHE AiR tRANSPoRt
World economic forum Global executive opinion survey in its Global com-petitiveness report
Annual survey of more than 15,000 executives in 139 countries
critical: < 3.5needs improvement: 3.5 to 4.6Good: 4.6 to 5.7excellent: > 5.7
opinions of executives about the air transport in each country
opinions of executives about the telecommunications infrastructure in each country
opinions of executives about the current and future power situation in each country
Average % urban population with access to water and sanitation
1
2
3
4
5
diMension indicator sourcerationale for selection
ranKing criteria

AttrActiveness of BrAzil As An internAtionAl investment And Business huB 145
diMension indicator sourcerationale for selection
ranKing criteria
finAnciAl infrAstructure
dEBENtURES
use
of
fIn
an
cIa
l re
sou
rces
BUSiNESS (PJ) CREdit
iNtERNAtioNAl ComPANY SHARE
oF tHE StoCk ExCHANgE
AvAliABilitY oF FiNANCiAl SERviCES
StoCk ExCHANgE liQUiditY
Bank for international settlements (Bis) and the economist intelligence unit
central banks in each country
Bloomberg data analysis
World economic forum Global executive opinion survey in its Global com-petitiveness report
World Bank dataPrimary. source:standard & Poor’s
data disclosed annually based on primary data sources
data disclosed annually for most countries. Primary data
Primary data disclosed in real time
Broad qualitative (survey) indicator of the availability of financial services in the country
indicator showing the vitality of the stock market in 119 countries, data available since 1990
critical: < 4.3%needs improvement: 4.3% to 8.6%Good: 8.6% to 12.9%excellent: > 12.9%
critical: < 35%needs improvement: 35% to 47%Good: 47% to 59%excellent: > 59%
Analytical distribution:critical: < 5%needs improvement: 5% to 10%Good: 10% to 25%
critical: < 3.9needs improvement: 3.9 to 4.8Good: 4.8 to 5.7excellent: > 5.7
critical: < 14% needs improvement: 14% to 40%Good: 40% a 66%excellent: > 66%
EFFECtivENESS oF FiNANCiAl REgUlAtioNS
World competitiveness yearbook, imd
A report published annually based on primary data sources and a global opinion survey of executives with some 4,500 respondents
Analytical distribution:critical: < 4.0needs improvement 4.0 to 5.0Good: 5.0 to 6.5excellent: > 6.5
opinion of executives on whether or not the financial market is sufficiently regulated
StoCk ExCHANgE Bloomberg and the economist intelligence unit1
data disclosed annually based on primary data sources
Analytical distribution:critical: < 60%needs improvement: 60% to 90%Good: 90% to 120%excellent: >120%
market cap of traded companies/GdP
stock of private corporate debt bonds/GdP
stock of business (PJ) credit/GdP
% of the volume traded on local stock exchanges from companies based in other countries
executive opinions on the availability of financial services in the country
total volume traded during ye year / total average ma-rket cap of listed companies during the same year
PRoJECtioN AS AN iFC relative position in 2 of the main ifc (international financial centers) rankings
z/yen Group Global financial centers index and the Banker interna-tional financial centers
thermometers of how the outside worlds views Brazil as an international financial hub are consistently disclosed
critical: bottom quartileneeds improvement: 3rd quartileGood: 2nd quartileexcellent: 1st quartile
1
2
3
4
5
6
7
8
1. source replaced by Bloomberg and the economist intelligence unit data

146 AttrActiveness of BrAzil As An internAtionAl investment And Business huB
diMension indicator sourcerationale for selection
ranKing criteria
connectivity
iNtERNAtioNAl oPENNESS FoR tRAdE
oF goodS
World trade indicators, World Bank
indicators published annually in public sources - calculated by a reputable source
critical: > 12.5needs improvement: 12.5 - 11.0Good: 11.0 to 9.4excellent: < 9.4
Average of tariffs to restrict imports and access to other markets in each country, taking into account the country’s tariff and non tariff barriers
tRAdE iN goodS unctAdstat indicators published annu-ally by public sources
Analytical distribution:critical: < 0.5needs improvement: 0.5 to 1.0Good: 1.0 to 1.5excellent: > 1.5
country share of the international trade in goods/country share of world GdP
iNtERNAtioNAl oPENNESS FoR tRAdE
iN SERviCES
World trade indicators, World Bank
indicators published an-nually in public sources - calculated by a reputable source
critical: < 27needs improvement: 27 to 35Good: 35 to 43excellent: > 43
different sub-sector share of international agreements for the trade in services (GAts)
tRAdE iN SERviCES unctAdstat indicators published annu-ally by public sources
Analytical distribution:critical: < 0.5needs improvement: 0.5 to 1.0Good: 1.0 to 1.5excellent: > 1.5
country share of internatio-nal trade in services/coun-try share of world GdP
CAPitAl FloWS unctAdstat year by year data available for 207 countries since 1970
Analytical distribution:critical: < 0.5needs improvement: 0.5 to 1.0Good: 1.0 to 1.5excellent: > 1.5
country share of international capital flows/country share of world GdP
AgREEmENtS AlloWiNg
CAPitAl FloWS
international centre for settlement of invest-ment disputes (icsid), World Bank
covers 177 countries, based on official information repor-ted by national governments
critical: < 0needs improvement: 0 to 21Good: 21 to 48excellent: > 48
number of bilateral agreements signed by the country
EASE oF ENtRY FoR FoREigN
mUltiNAtioNAlS
investing Across Borders, World Bank
open source covering 87 countries
critical: < 50.2needs improvement: 50.2 to 64.5Good: 64.5 to 78.8excellent: > 78.8
index based on regulatory demands
NAtioNAl REgUlAtioNS SUPPoRtiNg
CAPitAl FloWS
World economic forum Global executive opinion survey in its Global com-petitiveness report
study published annually for more than 30 years, current methodology in place since 2005, covers 125 countries
critical: < 3.8needs improvement: 3.8 to 4.6Good: 4.6 to 5.3excellent: > 5.3
executive opinions on the availability of financial services in the country
immigRANt RECEPtioN
un indicators published annu-ally by public sources
critical: <1.5%needs development: 1.5% to 3.1%Good: 3.1% to 9.2%excellent: > 9.2%
immigrants as a percentage of the total population in each country
PEoPlE moBilitY Analysis of oAG data-base information
simple indicator of a country’s air transport connectivity
Analytical distribution:critical: < 10needs development: 10 a 40Good: 40 a 70excellent: > 70
number of internatio-nal flight destinations from country per week (may 2012)
ExPANSioN oF tHE CoUNtRY’S
mUltiNACioNAlS
countries represented in the list of 100 largest businesses by assets held abroad, considering the sum of all assets held by these companies outside
World investment report, unctAd
ranking published since 1991, global coverage
critical: not on listneeds improvement: Below the top 10Good: Between # 6 and #10excellent: Among the top 5
1
2
3
4
5
6
9
7
10
11
8

AttrActiveness of BrAzil As An internAtionAl investment And Business huB 147
diMension indicator sourcerationale for selection
ranKing criteria
imAGe of the country
imAgE AS A PlACE to do BUSiNESS
the Ankholt-GfK roper nation Brands index
the best known inter-national indicator of national trademarks
critical: < 48needs improvement: 48 to 42Good: 52 to 56excellent: > 56
Average business related image scores (domestic goods, macro environment, investment and immigration)
FoREigN iNtERESt iN tHE CoUNtRY’S
BUSiNESS ANd iNvEStmENtS
Google this represents the country’s image in public opinion and is available in real time
critical: < 115needs improvement: 115 to 312Good: 312 to 509excellent: > 509
# of internet searches in english using the country name and “investment” and “business” originating in all countries
AtRACtivENESS FoR iNtERNAtioNAl EvENtS
international congress and convention Association
fairs and events reflect business interest in Brazil, published annually
critical: < 31needs improvement: 31 to 97Good: 97 to 163excellent: > 163
% international events held in each country
SUStAiNtABilitY yale center for environ-mental law and Policy (ycelP) and center for international earth science information network (ciesin)
indicator reflects the ecolo-gical sustainability of each country based on the impact of all of its activities on the environment
critical: < 48needs improvement: 48 to 53Good: 53 to 58excellent: > 58
2010 environmental Performance index
QUAlitY oF liFE
World competitiveness yearbook, imd
A report published annually based on primary data sources and a global opinion survey of executives with some 4,500 respondents
critical: < 5.5needs improvement: 5.5 to 6.5Good: 6.5 to 7.6excellent: > 7.6
opinions of executives on the quality of life in each country
CUltURAl oPENNESS
World competitiveness yearbook, imd
A report published annually based on primary data sources and a global opinion survey of executives with some 4,500 respondents
critical: < 6.3needs improvement:: 6.3 to 6.9Good: 6.9 to 7.4excellent: > 7.4
executive opinions of how open each country’s culture is to foreign ideas
PERSoNAl SAFEtY ANd ASSEt
SECURitY
World competitiveness yearbook, imd
A report published annually based on primary data sources and a global opinion survey of executives with some 4,500 respondents
critical: < 5.6needs improvement: 5.6 to 6.7Good: 6.7 to 7.7excellent: > 7.7
opinions of executives about personal safety and asset security in each country
QUANtitY oF viSitoRS
% world travelers going to each country
the economist intelligence unit
this information is available annually and shows traveler interest in each country
critical: < 0.7needs improvement: 0.7 to 1.8Good 1.8 to 2.8excellent: > 2.8
1
2
3
4
5
6
7
9
imAgE FoR tRAvEl ANd lEiSURE
Average of the country’s business related image scores (tourism, culture and hospitality)
the Ankholt-GfK roper nation Brands index
the best known inter-national indicator of national trademarks
critical: > 56needs improvement: 56 to 59Good: 59 to 62excellent: > 628

148 AttrActiveness of BrAzil As An internAtionAl investment And Business huB

AttrActiveness of BrAzil As An internAtionAl investment And Business huB 149


www.brainbrasi l .org