Attaining Thermal Comfort in Buildings with Predominantly ... · Attaining Thermal Comfort in...
27
presented to: ANSYS Boston Regional Conference Attaining Thermal Comfort in Buildings with Predominantly Glazed Facades September 14, 2011
Transcript of Attaining Thermal Comfort in Buildings with Predominantly ... · Attaining Thermal Comfort in...

presented to:ANSYS Boston Regional Conference
Attaining Thermal Comfort in
Buildings with Predominantly
Glazed Facades
September 14, 2011

Case Study Background• High floor to ceiling windows• Large skylight area• Automatic Shading Devices• External Shades• Chilled Beam HVAC design• The space evaluated is the most dangerous area for thermal discomfort

Designing for Comfort vs. Energy Reduction• Why is this good practice?• Allows the space to keep an active chilled beam HVAC design rather
than switching to a Variable Air Volume system• Reacts to peak cooling issues with low static pressure fan coil units
rather than a medium pressure VAV system• So why increase energy for comfort?• Ignoring comfort only increases energy in operation• Operators will “adjust” the system until occupants are satisfied• These adjustments are a big reason for buildings not living up to their
modeled performance• By acknowledging thermal comfort and providing an approach that is
operationally realistic, the design building can achieve the modeled energy target
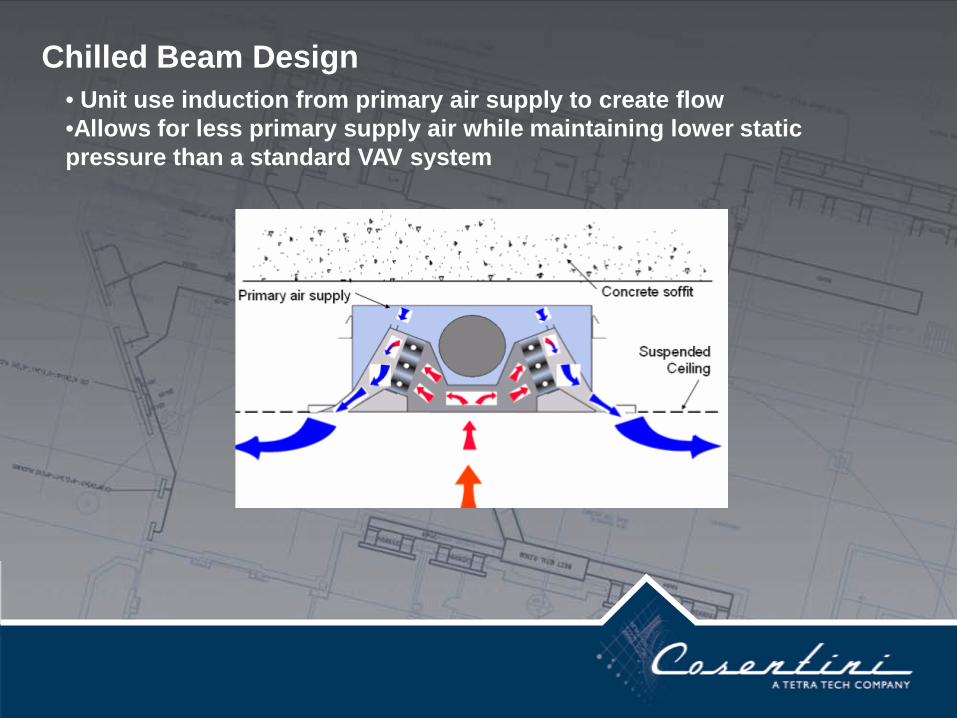
Chilled Beam Design• Unit use induction from primary air supply to create flow•Allows for less primary supply air while maintaining lower static pressure than a standard VAV system

Chilled Beam Approximation and Boundary Conditions• Actual flow leaving the chilled beam is not directly measured• 2D simulation used to approximate chilled beam slot leaving velocity• Chilled beam slot width was varied to match value from Reference
point “VH1” from vendor’s calculator
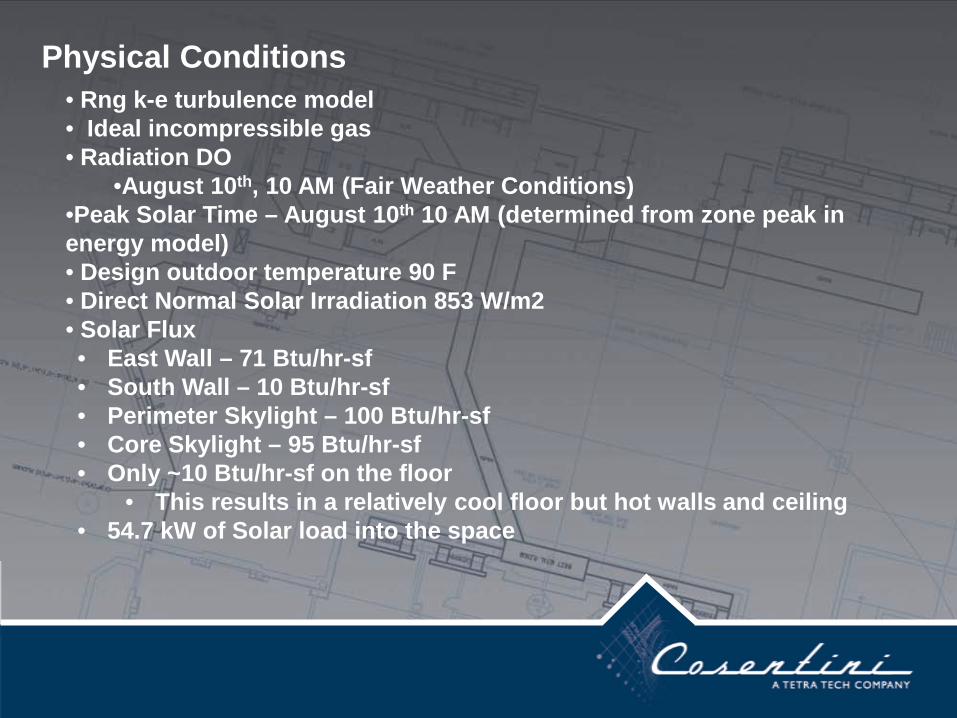
Physical Conditions• Rng k-e turbulence model• Ideal incompressible gas• Radiation DO
•August 10th, 10 AM (Fair Weather Conditions)•Peak Solar Time – August 10th 10 AM (determined from zone peak in energy model)• Design outdoor temperature 90 F• Direct Normal Solar Irradiation 853 W/m2• Solar Flux• East Wall – 71 Btu/hr-sf• South Wall – 10 Btu/hr-sf• Perimeter Skylight – 100 Btu/hr-sf• Core Skylight – 95 Btu/hr-sf• Only ~10 Btu/hr-sf on the floor
• This results in a relatively cool floor but hot walls and ceiling• 54.7 kW of Solar load into the space

Boundary Conditions• Core Skylight • Triple Glazed ( U-value of 0.21 Btu/hr-sf )
• 5.22% trans, 53.25% reflect, 41.53% abs•Perimeter Glass Wall• Triple Glazed ( U-value of 0.19 Btu/hr-sf )
• 23 % trans, 32% reflect, 45% abs• Automatic Shades ( activated by glare and light levels )
• 3% trans, 72% reflect, 25 % abs• Adjusted Perimeter Glass Wall to include shades• Transmissivity = 23 % * 3% = 0.69%• Reflectivity = 23% - 0.69% + 32 % = 54.31%• Absorptivity = 1 – 0.69% - 54.31% = 45%
• 8 Occupants (450 Btu/person)• 8 Computers (400 W each, recirculation inlets/outlets)
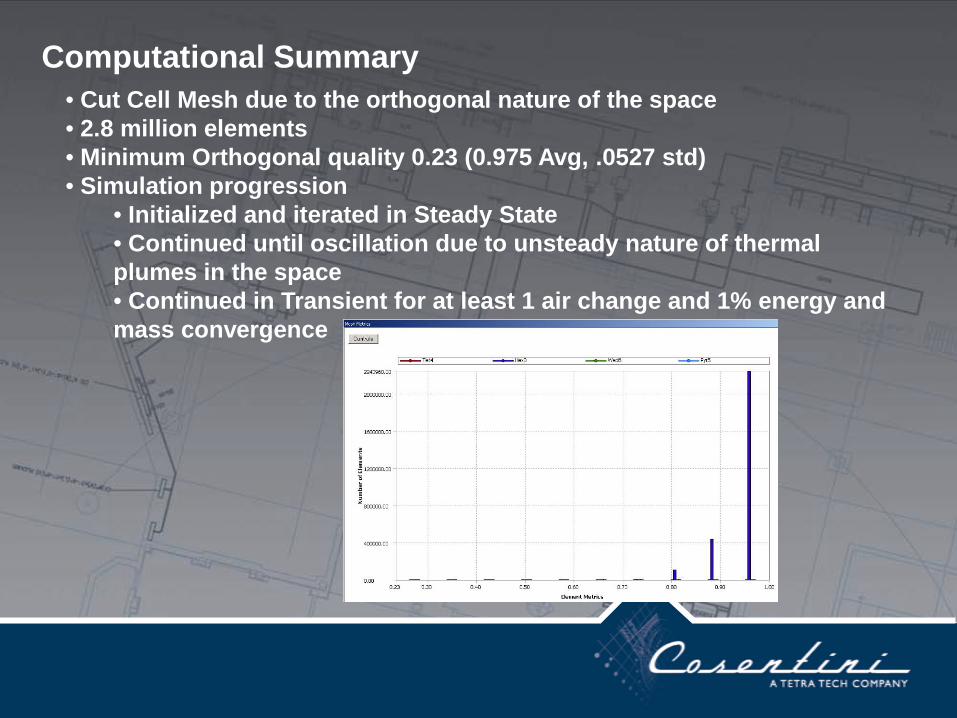
Computational Summary• Cut Cell Mesh due to the orthogonal nature of the space• 2.8 million elements• Minimum Orthogonal quality 0.23 (0.975 Avg, .0527 std)• Simulation progression
• Initialized and iterated in Steady State• Continued until oscillation due to unsteady nature of thermal plumes in the space• Continued in Transient for at least 1 air change and 1% energy and mass convergence
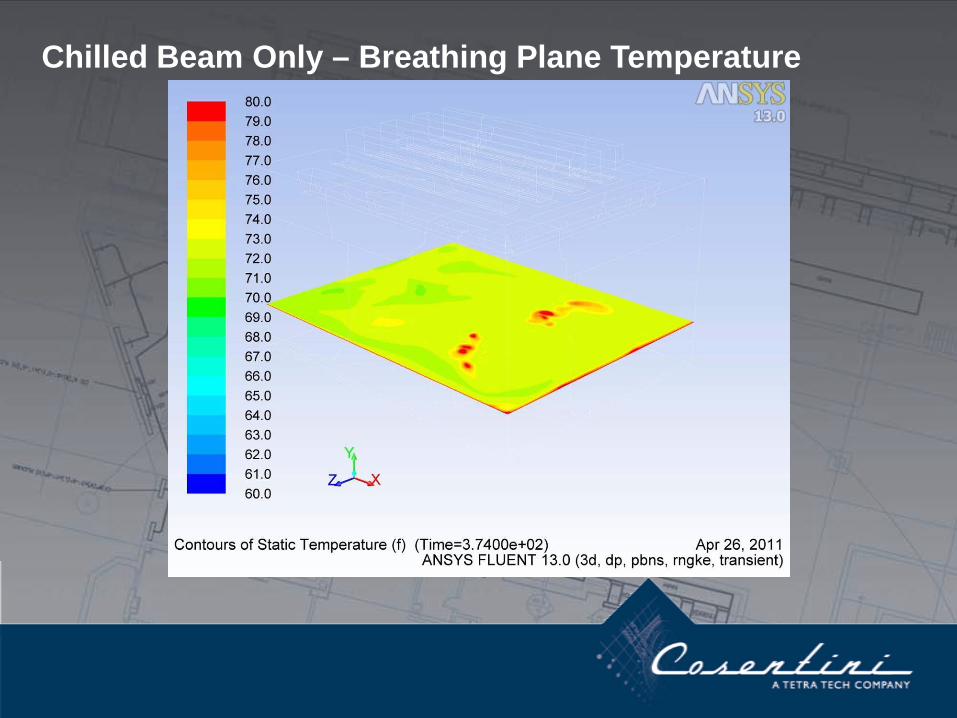
Chilled Beam Only – Breathing Plane Temperature

Chilled Beam Only – Breathing Plane Velocity

Chilled Beam Only – Airflow
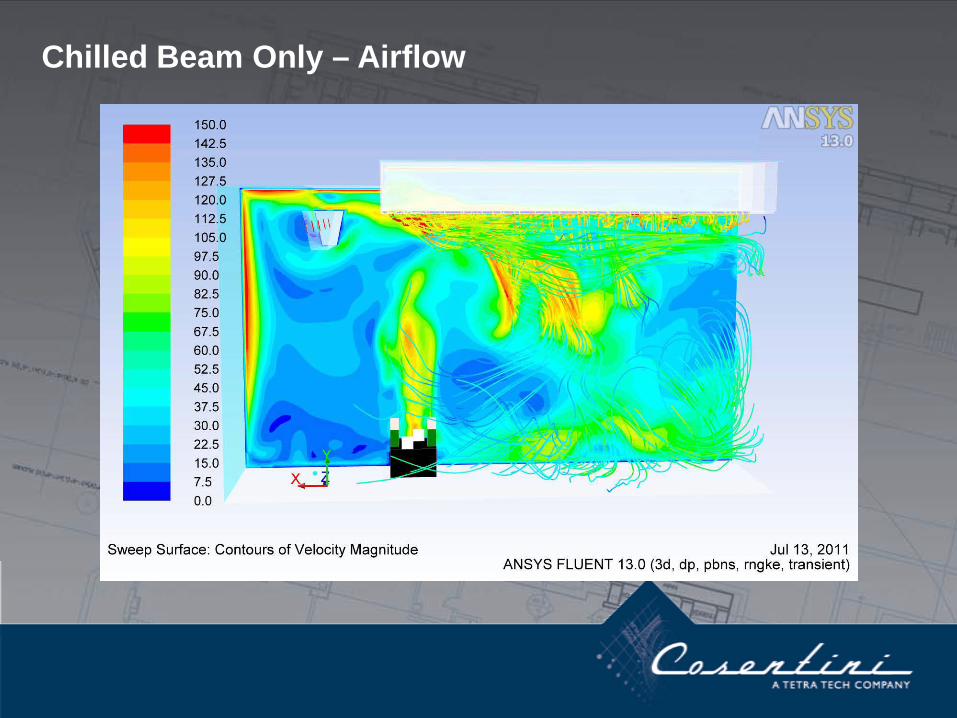
Chilled Beam Only – Airflow

Chilled Beam Only – Comfort Analysis• Temperature is at a reasonable level, but is it really comfortable?• Refer to ASHRAE 55 – 2004 (Thermal Comfort) to check
• Use Predicted Mean Vote Calculation to analyze comfort• Inputs are Air Temp, Mean Radiant Temp, Relative Humidity, Air Velocity, Clothing Level, Activity Level, and External Work•Output is a number between –2 and 2 to describe how people experience the environment

The Problem
• We can extract the Peak values from the CFD simulation and energy model to analyze the comfort in the space
•We find that the space is actually uncomfortable due to the high radiant temperature in the space
FAir Temperature 76
FRadiant Temp 95.0
%Rel Hum 50
ft/minAir Velocity 40
CloClothing Level 0.97
MetActivity 1
MetExternal Work 0
AtmPressure 0
PMV1.38PPD44.49
Design Level

Fan Assisted CB – Breathing Plane Temperature
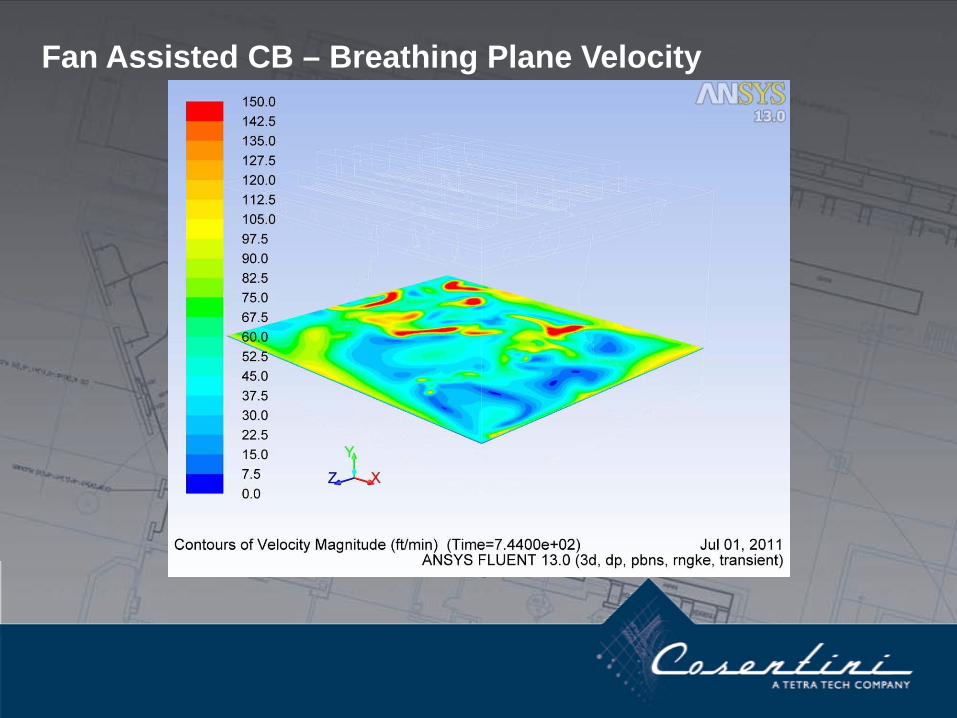
Fan Assisted CB – Breathing Plane Velocity
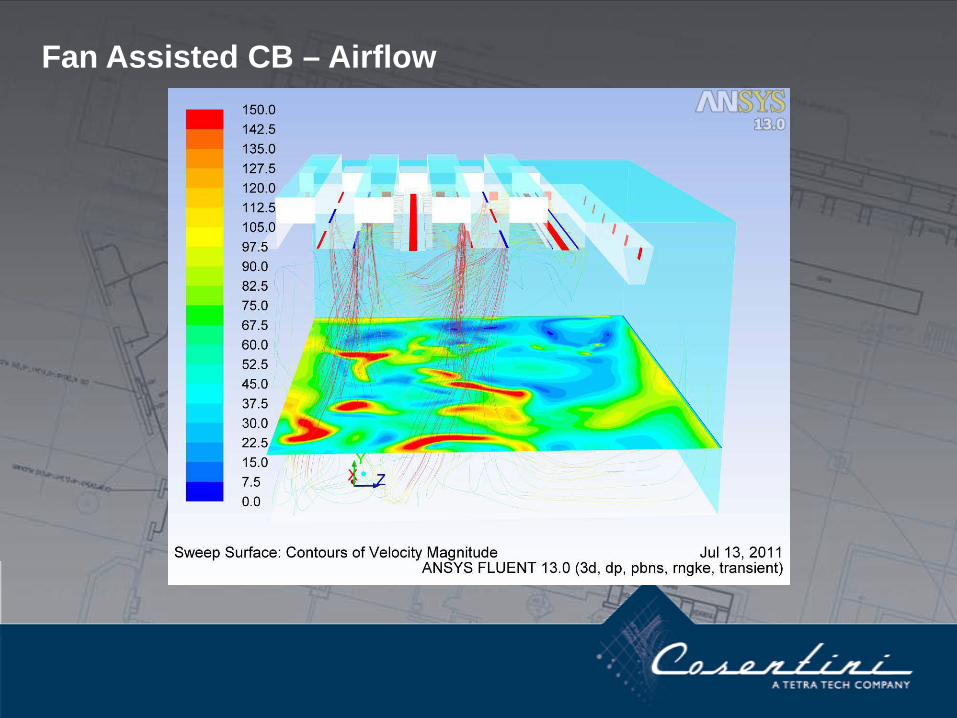
Fan Assisted CB – Airflow

Fan Assisted CB – Airflow

The Design Results
• Extracting the peak values again, we can see comfort is vastly improved
•The space is now comfortable at peak times
FAir Temperature 69
FRadiant Temp 95.0
%Rel Hum 50
ft/minAir Velocity 60
CloClothing Level 0.97
MetActivity 1
MetExternal Work 0
AtmPressure 0
PMV0.40PPD8.34
Design Level
Operation – What about part load?
• Theoretical models are great at sizing systems, but how can they be controlled in the real world?• Using EnergyPlus to analyze the cooling season we can see how the space will react• With some custom code that controls the building’s BMS system, GenOpt (LBNL) can optimize the operative temperature (weighted average between mean air and mean radiant temperature) to find the ratio that results in the most comfortable cooling season• Recalling the PMV calculation, some inputs are easy to monitor (Air temp, Relative Humidity), some can be adjusted by the operator (Clothing level, Activity level, work level), and some will require further analysis to control (Mean radiant temperature, velocity)• Using this data, we can plot the glazed façade’s temperature against the mean radiant temperature•In design, thermostats can measure the temperature of the glazing and report back the data to the BMS system

GenOpt Output

Operation – Approximating MRT and airflow
• The CFD simulation results can allow us to set a simple function that will return the air velocity at the breathing plane based on the part load of the fan coil motors (can be adjusted during balancing)
• 40 ft/min – 60 ft/min Range • The mean radiant temperature will require more analysis due to the fact that it is more difficult to measure
• Client will not install MRT sensor, now what?• Using this data, we can plot the glazed façade’s temperature
against the mean radiant temperature• In operation, thermostats can measure the temperature of the
glazed wall and report back the data to the BMS system

South Zone Controls
South Zone MRT Graph
y = 1.0029x + 0.4221
R2 = 0.9844
24.000
25.000
26.000
27.000
28.000
29.000
24.000 25.000 26.000 27.000 28.000 29.000
South Wall Temperature
Mea
n Ra
dian
t Te
mp.

East Zone Controls
East Zone MRT Graph
y = 0.3569x + 16.585
R2 = 0.9856
25.000
25.500
26.000
26.500
27.000
27.500
28.000
24.000 26.000 28.000 30.000 32.000
Skylight Temperature
Mea
n Ra
dian
t Te
mp.

The Predicted Operational Results – What do we Gain?• The seasonal PMV with the modified control system is far superior to the standard setpoint control
Predicted Mean Vote Over Cooling Season (South)
-1
-0.5
0
0.5
1
1.5
2
6 8 10 12 14 16
Hour
PMV
Base Avg PMV Base Min PMV Base Max PMV
Design Avg PMV Design Min PMV Design Max PMV

The Predicted Operational Results – What do we Gain?• The seasonal PMV with the modified control system is far superior to the standard setpoint control
Predicted Mean Vote Over Cooling Season (East)
-0.5
0
0.5
1
1.5
6 8 10 12 14 16
Hour
PMV
Base Avg PMV Base Min PMV Base Max PMV
Design Avg PMV Design Min PMV Design Max PMV

Summary• Active chilled beams save energy when compared to a traditional VAV system• Special controls are required for high load spaces• By analyzing comfort criteria in design phase, we can establish an energy efficient response to the environment without having the operator make costly adjustments• The space now not only benefits from an energy efficient design but also has a “smart” control system that reacts to comfort rather than simply dry bulb temperature• This use of ANSYS FLUENT and energy modeling software is one method to ensure a zone will be well designed and able to maintain an appropriate comfort level for the occupants