
Attaining economic growth through financial development ...
23
Attaining economic growth through financial development and foreign direct investment Rudra Pradhan Indian Institute of Technology Kharagpur, Kharagpur, India Mak B. Arvin Department of Economics, Trent University, Oshawa, Canada Sahar Bahmani University of Wisconsin-Parkside, Kenosha, Wisconsin, USA, and John H. Hall University of Pretoria, Pretoria, South Africa Abstract Purpose – The purpose of this paper is to consider the heterogeneous relationship among financial development, foreign direct investment (FDI) and economic growth, examining the possible directions of causality among them in both the short and long runs. Design/methodology/approach – A sample of the G-20 countries over the period 1970–2016 is utilized. A vector error-correction model is used to consider the possible directions of causality among financial development, FDI and economic growth. Findings – Results suggest a cointegrating relationship among the three series. Although short-run links among the variables are mostly non-uniform, both financial development and FDI matter in the determination of long-run economic growth. Practical implications – Attention must be paid to policies that promote financial development. This, in turn, calls for fostering incentives to guarantee continued support to liberalize the economy and promoting capital openness. Additionally, financial infrastructure should be improved to improve financial innovation. The establishment of a well-developed financial market, including well-functioning banks and other financial institutions, can facilitate further investment and an easier means of raising capital to support the activities of FDI. Economic growth can ultimately be elevated through both financial development and FDI. Originality/value – The study considers a sample of the G-20 countries, which have received relatively little attention in the existing literature. In addition, the study concurrently analyses the trivariate causal relationship among financial development, FDI and economic growth, a topic on which there has been a dearth of research. Keywords Financial development, Economic growth, Foreign direct investment, The G-20 countries Paper type Research paper 1. Introduction Financial development is one of the driving factors behind economic growth. The connection between the two has been the major focus of a significant corpus of both theoretical and empirical research since the seminal work of Schumpeter (1911). Several studies have examined the effect of financial development and economic growth using an array of techniques, such as cross-sectional, time series and panel data (see, inter alia, Levine, 2003; Beck and Levine, 2004; Herwartz and Walle, 2014; Jedidia et al., 2014; Ngare et al., 2014). Empirical evidence from previous studies has established the presence of a positive long-run relationship between various indicators of financial development and economic growth. Specifically, most of these papers suggest that a well-developed financial system is 1
Transcript of Attaining economic growth through financial development ...

Attaining economic growth through financial development and foreign direct investment
Rudra PradhanIndian Institute of Technology Kharagpur, Kharagpur, India
Mak B. ArvinDepartment of Economics, Trent University, Oshawa, Canada
Sahar BahmaniUniversity of Wisconsin-Parkside, Kenosha, Wisconsin, USA, and
John H. HallUniversity of Pretoria, Pretoria, South Africa
AbstractPurpose – The purpose of this paper is to consider the heterogeneous relationship among financialdevelopment, foreign direct investment (FDI) and economic growth, examining the possible directions ofcausality among them in both the short and long runs.Design/methodology/approach – A sample of the G-20 countries over the period 1970–2016 is utilized.A vector error-correction model is used to consider the possible directions of causality among financialdevelopment, FDI and economic growth.Findings – Results suggest a cointegrating relationship among the three series. Although short-run linksamong the variables are mostly non-uniform, both financial development and FDI matter in the determinationof long-run economic growth.Practical implications – Attention must be paid to policies that promote financial development. This, inturn, calls for fostering incentives to guarantee continued support to liberalize the economy and promotingcapital openness. Additionally, financial infrastructure should be improved to improve financial innovation.The establishment of a well-developed financial market, including well-functioning banks and other financialinstitutions, can facilitate further investment and an easier means of raising capital to support the activities ofFDI. Economic growth can ultimately be elevated through both financial development and FDI.Originality/value – The study considers a sample of the G-20 countries, which have received relatively littleattention in the existing literature. In addition, the study concurrently analyses the trivariate causalrelationship among financial development, FDI and economic growth, a topic on which there has been adearth of research.Keywords Financial development, Economic growth, Foreign direct investment, The G-20 countriesPaper type Research paper
1. IntroductionFinancial development is one of the driving factors behind economic growth. The connectionbetween the two has been the major focus of a significant corpus of both theoretical andempirical research since the seminal work of Schumpeter (1911). Several studies haveexamined the effect of financial development and economic growth using an array oftechniques, such as cross-sectional, time series and panel data (see, inter alia, Levine, 2003;Beck and Levine, 2004; Herwartz and Walle, 2014; Jedidia et al., 2014; Ngare et al., 2014).
Empirical evidence from previous studies has established the presence of a positivelong-run relationship between various indicators of financial development and economicgrowth. Specifically, most of these papers suggest that a well-developed financial system is
1

growth-enhancing, and therefore, consistent with the proposition of “more finance, moregrowth” (see, inter alia, Law and Singh, 2014; Pradhan, Arvin, Bahmani, Hall and Norman,2017; Pradhan, Arvin, Norman and Hall, 2014). At the same time, the focus on causalitybetween financial development and economic growth has gained considerable interestamongst economists and policy makers. Subsequently, there have been numerous studies, inthis regard, for both developed and developing countries. While most of these studies haveconfirmed the existence of a causal relationship from financial development to economicgrowth (see, inter alia, Pradhan, Arvin and Hall, 2018; Pradhan, Arvin, Bennett, Nair andHall, 2016; Hassan et al., 2011), a number of studies have failed to find evidence of causalityfrom financial development to economic growth. Hence, the existing empirical studies on therelationship between financial development and economic growth do not provide conclusiveevidence on the nature and direction of this relationship and there is no consensus amongeconomists about the nature of this relationship either.
Similar to the finance-growth nexus, the link between foreign direct investment (FDI) andeconomic growth has garnered much attention in the finance literature. This debate mostlyfocuses on the channels through which FDI may contribute to economic growth anddevelopment of recipient countries. In particular, it has been discussed to what extent FDImay augment technological change through spillover effects of knowledge and new capitalgoods, that is, the process of technological diffusion. It has been further argued that thecontribution that FDI makes to economic growth and technology is strongly dependent onthe circumstances in the recipient countries (see, inter alia, Barro and Sala-i-Martin, 1995;Hermes and Lensink, 2003).
The literature suggests that the development of the financial system of a recipient country isan important pre-condition in order for the FDI to have a positive impact on economic growth(see, inter alia, Adeinyi et al., 2012; Alfaro et al., 2004). A country’s financial system can enhancethe efficient allocation of resources and hence, can improve the absorptive capacity of a countrywith respect to FDI inflows. More specifically, a well-developed financial system may contributeto the process of technological diffusion associated with FDI. This implies the possibility of a linkamong financial development, FDI and economic growth. Therefore, the present paper makes anattempt to integrate FDI with the finance-growth nexus.
The contribution of the present study is sixfold. First, the findings of this study can shedadditional light on the relationship among variables in the dynamics between financialdevelopment and economic growth, between FDI and economic growth, and between financialdevelopment and FDI, as prior empirical results on these variables are mixed. Second, the studyanalyses the trivariate causal relationship among financial development, FDI and economicgrowth. To the best of our knowledge, there is a dearth of research on the probable concurrentcausal relationship among these three variables. Third, a multivariate panel data estimationprocedure that can offer more robust estimates by applying variations between countries, aswell as variations over time, is deployed. Fourth, a novelty of the study lies in its treatment ofdisaggregated financial development. Fifth, the study considers a sample (the G-20 countries)which have received relatively little attention in the existing literature. Sixth, more advancedeconometric techniques than those previously used in the literature to establish whether thereare causal links between the three sets of variables are utilized.
The rest of this paper is structured as follows: Section 2 presents the theoreticalframework; Section 3 presents a literature review and provides a rationale for the analysis;Section 4 describes the econometric methodology used in the study; Section 5 discusses theempirical results; and finally, the main findings and conclusions are provided in Section 6.
2. Theoretical frameworkThe motives and drivers of both financial development and FDI inflow change over time,but the priority toward growth and development remains the same for both developed and
2

developing countries. This section presents the theoretical framework linking financialdevelopment and economic growth, FDI and economic growth, and financial developmentand FDI.
2.1 Financial development and economic growthHistorically, the financial system is considered as the nerve center of a country’s economicdevelopment. It is true that an efficient provision of financial services determines theeconomic growth and prosperity of a country (see, inter alia, Freytag and Frickea, 2017;Freckleton et al., 2012; Ahmed and Wahid, 2011; Seetanah and Ramessur, 2009; Pradhan,Arvin and Bahmani, 2015). Usually, financial development contributes toward economicgrowth by the following means: ensuring financial stability; supporting trade andcommerce; mobilizing domestic savings; allowing different risks to be managed efficientlyby encouraging the accumulation of new capital; increasing a more efficient allocation ofdomestic capital; and assisting to reduce or mitigate losses. In addition, there are threeelementary features of financial systems that capture the impact of the above functions oneconomic growth, namely, the level, efficiency and composition of financial intermediation(Alfaro et al., 2009; Bianchi, 2010; Pradhan, Arvin and Hall, 2018; Pradhan, Arvin, Bahmani,Hall and Norman, 2018).
The role of financial development in fostering economic growth has receiveda considerable attention since the emergence of the endogenous growth theory.The theoretical contributions in this area can be divided into five strands. First, financialsystems can allocate resources more efficiently as per the developmental requirement(Wu et al., 2010). Second, financial markets allow firms to diversify portfolios, increaseliquidity, reduce risks and hence stimulate growth. Third, financial development providesan exit mechanism for agents and improves the efficiency of financial intermediation(see, inter alia, Rousseau and Wachtel, 2000; Arestis et al., 2001). Fourth, financial marketsalso foster specialization in entrepreneurship and the adoption of new technologies(Greenwood and Smith, 1997). Fifth, financial markets impact economic growth throughchanges in incentives for corporate control (Choong et al., 2004; Pradhan, Arvin, Nair, Halland Gupta, 2017).
2.2 Foreign direct investment and economic growthThe literature identifies several channels through which FDI contributes to economicgrowth. FDI encourages the incorporation of new inputs and technologies in the productionsystems of host countries. FDI could also stimulate economic growth endogenously if itgenerates productivity, positive externalities and spillover effects. Since FDI is consideredas an important source of know-how, human capital and technological diffusion, thesefactors can be initiated to promote economic growth through FDI inflows (Xiaohui et al.,2002; De Vita and Kyaw, 2008; Saini and Singhania, 2018).
The theoretical contributions in this area can be divided into three strands. First, theneoclassical theory, which is the notion that FDI contributes positively toward the economicdevelopment of the host country by increasing its well-being status. FDI leads to capitalformation in the host country, thereby influencing the reinvestment of profits and furtherinflows of capital therein. The infusion of foreign capital could result in a lower balance ofpayments and provides higher-order techniques of production by replacing unproductivemethods. It adds value to host countries with respect to technology spillover, highermanagerial skills and improved marketing information skills (see, for instance, Dwivedi,2012). Second, the dependency theory, which is the notion that developing countries are wellendowed with natural resources and they need innovative techniques to maximize theiroutput. The dependency theory tries to bridge this technological gap. During the 1970s,many East Asian and Latin American countries followed this approach. However, these
3

countries later had to shift from the dependency principle of stringent strategies to liberalpolicies for more capital inflows, as this theory proved unhealthy for the development ofemerging countries, leading to the shift from a closed economy to an open economy. Third,the industrialization theory and spillover effects. This theory considers FDI as the transferof the “package” including capital, management, new technology, and is characterized as aninternational extension of the industrial organization theory. According to this theory, FDIinfuses a contagion effect in the host country through the adoption of management practicesand advanced technology principles. It is a channel that promotes growth by technologytransmission from the parent firm of a multinational corporation (MNC) to its subsidiaryabroad (see, inter alia, Zhao et al., 2017; Saini and Singhania, 2018).
2.3 Financial development and foreign direct investmentMany policy makers in developing countries believe that FDI has several positive effects,especially on economic growth. With the onset of absorptive capacities, research on whetherthe level of development of the domestic financial system could also partly determine thepositive effects of FDI on economic growth gave an affirmative answer (see, inter alia,Tsagkanos et al., 2018; Hermes and Lensink, 2003; Alfaro et al., 2004; Kholdy and Sohrabian,2008). This opened a new debate to be explored, i.e. if having a minimum threshold level offinancial development is a pre-requisite for the positive impact of FDI on growth, is it notreasonable and logical to ask whether FDI itself could contribute to financial development,and hence enhancing its chances for stimulating economic growth? The financial system ofa country includes its banking sector, other financial institutions, the stock market and thebond market. In this regard, it is imperative to understand the link between FDI and anefficient financial system and to identify those variables that contribute to FDI inflows(Desbordes and Wei, 2017).
It is plausible that in doing its multinational capital budgeting, and in analyzing countryrisk, a foreign enterprise will prefer to invest in a country where the financial system is moredeveloped with the resultant relative easy access to funds if needed. In contrast, aninefficient and under-developed financial system will have a high cost of operation whichwill be passed on to clients, resulting in a higher cost of capital for the foreign enterprise. Inaddition, an under-developed financial system may not be able to provide the foreignenterprise with the level of services that it requires for doing international business. Anunder-developed banking system may, for example, not have advanced payment systems,letters of credit may take too long to clear and the under-developed banking system may nothave the capacity to meet the loan requirements of the foreign enterprise. Also, if the foreignenterprise needs funds to finance working capital, or for other needs, it may decide toborrow from its local bankers based on its expectations of interest rates and currencymovements. If the foreign enterprise is set up to produce domestically and then export itsproducts, it may need to rely on a local bank for its international business (i.e. letters ofcredit). Foreign enterprises will, therefore, prefer to invest in a country that has a moreadvanced banking system, assuming that the project has a positive net present value, allother things being constant (Agbloyor et al., 2012).
Foreign enterprises may also seek to raise extra funds in the form of equity in order tomaintain a certain capital structure once they have entered the host country. The keydecision for them, therefore, will be how efficient the local stock market is. If the market isinefficient, they will not be enthusiastic enough to list on it because the value of theirinvestment will not be fairly priced. This also implies that the enterprise may not be able toraise new equity because they may think that the market has under-priced the value of theirshares, resulting in a value lesser than the intrinsic value of the equity that they issued.Therefore, a country with a relatively better-developed stock market should attract moreFDI (Agbloyor et al., 2012).
4

In investigating the theoretical framework for the directional relationship from FDI tofinancial development, Desai et al. (2006) argue that any increase in net inflows of FDIincreases the funds available in the economy and stimulates financial intermediationthrough financial markets or the banking system. Agbloyor et al. (2012) give some insight asto how inflows of FDI can play an active role in promoting both the domestic banking sectorand the domestic stock market. They correctly assert that when foreign firms enter into adomestic economy, they make use of the domestic financial markets. Firms are most likelyto open a local bank account to manage their local transactions. As these enterprises arelucrative clients for banks, funds are made available to the banking sector to enhance itslending potential. These enterprises are also more likely to demand higher quality andinternationally comparable banking services. Therefore, the inflows of FDI may facilitateways to promote domestic banking sector development.
Regarding FDI being a stimulus for stock market growth, Agbloyor et al. (2012) find thatsome foreign enterprises decide to list on local stock exchanges. Being MNCs, suchenterprises are usually so large that they can significantly increase the market capitalizationand liquidity of the stock exchanges concerned. The listing of such companies may alsoattract non-resident foreign investors to the local stock exchange. Further, someinvestments in the local stock market can come under realms of FDI if the equity holdingacquired exceeds 10 percent of the voting equity of the company invested in. Suchinvestments have been known to promote domestic stock market development. Therefore,FDI is an important driver for the development of the domestic stock market.
3. Literature reviewThis section discusses three strands of literature on the causal relationship among financialdevelopment, FDI, and economic growth.
The first strand of literature considers the nexus between financial development andeconomic growth. There are four different ways we can classify the results of existing studieson the relationship between financial development and economic growth. These comprise ofSLHA – the supply-leading hypothesis of financial development and economic growth, DFHA –the demand-following hypothesis of financial development and economic growth, FBHA – thefeedback hypothesis between financial development and economic growth, and NEHA – theneutrality hypothesis between financial development and economic growth.
SLHA proposes a unidirectional Granger causality from financial development toeconomic growth. There are at least four ways in which financial development can increaseeconomic growth (see, inter alia, Pradhan, Arvin and Hall, 2018), namely through increasingthe efficiency in intermediation between borrowers and lenders, improving the allocation ofresources (via fund pooling, risk diversification, liquidity management, screening andmonitoring), increasing saving rates, and promoting the development of markets andinstruments that enable risk sharing and facilitate economic growth. The studies supportingthis hypothesis are those of Pradhan, Arvin, Bahmani, Hall and Norman (2018), Wu et al.(2010), Ayyagari et al. (2007), Beck et al. (2000) and Levine (1998).
DFHA proposes a unidirectional causality from economic growth to financialdevelopment. In this case, financial development plays only a minor role in economicgrowth and is merely a by-product or an outcome of economic growth in the real side ofthe economy (see, inter alia, Pradhan, Arvin, Bahmani, Hall and Norman, 2018; Liang andTeng, 2006). The idea is that as an economy grows, additional financial institutions andfinancial products and services emerge in the market in response to a higher demand forfinancial services. Hence, a lack of financial institutions in developing countries indicatesa lack of demand for financial services. Accordingly, as the real side of the economygrows, the financial system develops further, thereby increasing opportunities forfunding investment and the diversifying of risk (see, inter alia, Quartey and Prah, 2008).
5

Studies supporting the DFHA include those of Pradhan et al., Odhiambo (2010) andLiang and Teng (2006).
FBHA suggests that financial development and economic growth complement each other,lending credence to both the supply-leading and the demand-following hypotheses. Thestudies supporting this hypothesis are Pradhan, Arvin, Norman and Hall (2014), Pradhan,Arvin, Norman and Nishigaki (2014) and Craigwell et al. (2001).
NEHA suggests that there is no causal connection between financial development andeconomic growth. In this case, financial development is either too marginal or too saturatedand hence, it may not contribute to economic growth. Studies supporting this hypothesis arePradhan, Arvin, Norman and Hall (2014) and Al-Yousif (2002).
The second strand of literature examines the causal nexus between FDI and economicgrowth. Analogously to the first strand, four different hypotheses can be considered,namely SLHB – the supply-leading hypothesis of FDI and economic growth, DFHB – thedemand-following hypothesis of FDI and economic growth, FBHB – the feedbackhypotheses between FDI and economic growth, and NEHB – the neutrality hypothesesbetween FDI and economic growth.
SLHB suggests a unidirectional Granger causality from FDI to economic growth. In thiscase, FDI can promote long-run economic growth by augmenting the existing stock ofknowledge in the host economy through labor training and skill acquisition, on the onehand, and through the introduction of alternative management practices andorganizational arrangements on the other hand (see, inter alia, Herzer et al., 2008). Thestudies supporting SLHB are those of Sunde (2017), Lean and Tan (2011) andZhang (2001).
DFHB suggests a unidirectional causality from economic growth to FDI. In this case, thepre-condition is that economic growth has a positive impact on FDI. One can argue that thehigher growth rates of an economy stimulate the growth in demand, which implies greaterprofitability opportunities for inflowing capital. Hence, FDI sources may prefer faster-growing countries. On the other hand, opponents argue that slower-growing economies mayimply higher profitability opportunities for capital, given that these economies are capitalscarce and labor abundant. The studies supporting this hypothesis are those of Pradhan,Arvin, Bahmani, Hall and Norman (2018), Lean and Tan (2011), Choe (2003), Alguacil et al.(2002), Zhang (2001) and Liu et al. (2001).
FBHB proposes that FDI and economic growth complement each other. Here, the line ofreasoning is that economies that experience faster economic growth not only generate moredemand for FDI inflows, but also provide better opportunities for generating profits, andhence attracting more FDI inflows. In addition to this, FDI would cause faster economicgrowth and support the economic development of the host economy via direct effects as wellas indirect spillover effects. This implies that both FDI and economic growth, in such a case,are positively interdependent, leading to a bidirectional causality linkage or a “virtuouscircle” (see, inter alia, Zhang, 2001). The studies supporting the FBHB are those of Chan et al.(2014), Liu et al. (2001) and Duasa (2007).
The NEHB suggests that there is no causal connection between FDI and economicgrowth and there are at least two ways we can justify the lack of connection. First, FDImight simply be too marginal to have a serious economic growth impact. Second, it couldvery well be that the growth-limiting effects of FDI often limit the growth-enhancing effectsleading to small or no net effects. The studies supporting this hypothesis are those of Yalta(2013) and Herzer et al. (2008).
The third strand of literature concerns the causal nexus between financialdevelopment and FDI. Similar to the previous two strands of literature, the relationshipbetween financial development and FDI can be four types, namely a SLHC, where financialdevelopment leads to FDI; a DFHC, where FDI leads to financial development; a FBHC,
6

where both financial development and FDI cause each other; and a NEHC, claiming thatthere is no causal relationship between financial development and FDI. The studiessupporting these hypotheses are those of Adeinyi et al. (2012), Hermes and Lensink (2003)and Otchere et al. (2016).
Table I provides a brief summary of the three strands of the literature.Based on the results of studies in Table I, it is evident that the direction of causality
among the three variables is not uniform and therefore still open to question. In the presentstudy, we make an attempt to examine the simultaneous causal relationship amongfinancial development, FDI and economic growth. Clearly, the present analysis melds thethree strands of the literature.
Study Study areaDataperiod
Hypothesissupported
Case 1: financial development and economic growthHsueh et al. (2013) Ten Asian countries 1980–2007 SLHA
Menyah et al. (2014) 21 African countries 1965–2008 SLHA, DFHA
Pradhan, Arvin, Norman and Hall (2014) ASEAN countries 1961–2012 FBHA
Pradhan, Arvin, Hall and Nair (2016) Eurozone countries 1988–2013 FBHA
Pradhan, Arvin, Bahmani, Hall and Norman(2018)
49 European countries 1961–2014 FBHA, SLHA, DFHA
Case 2: foreign direct investment and economic growthAhmed et al. (2011) Sub-Sahara African
countries1991–2001 FBHB
Lean and Tan (2011) Malaysia 1970–2009 SLHB, DFHB
Lee (2009) Malaysia 1970–2000 DFHB
Lee (2010) Japan and World 1977–2006 SLHB, FBHB
Liu et al. (2001) China 1984–1998 DFHB
Pradhan, Arvin, Hall and Nair (2016) Eurozone countries 1988–2003 FBHB
Tang and Wong (2011) Cambodia 1994–2006 SLHB
Sunde (2017) South Africa SLHB
Case 3: financial development and foreign direct investmentAdeinyi et al. (2012) SODE countries 1970–2012 NEHC
Kholdy and Sohrabian (2005) 25 countries 1975–2002 FBHC
Lee and Chang (2009) 37 countries 1970–2002 DFHC, NEHC
Pradhan, Arvin, Hall and Nair (2016) Eurozone countries 1988–2003 NEHC
Notes: SLHA is the supply-leading hypothesis, indicating Granger causality from financial development toeconomic growth; DFHA is the demand-following hypothesis, indicating Granger causality from economicgrowth to financial development; FBHA is the feedback hypothesis, indicating bidirectional Granger causalitybetween economic growth and financial development; NEHA is the neutrality hypothesis, indicating noGranger causality between financial development and economic growth; SLHB is the supply-leadinghypothesis, indicating Granger causality from foreign direct investment to economic growth; DFHB is thedemand-following hypothesis, indicating Granger causality from economic growth to foreign direct invest-ment; FBHB is the feedback hypothesis, indicating bidirectional Granger causality between foreign directinvestment and economic growth; NEHB is the neutrality hypothesis, indicating no Granger causalitybetween foreign direct investment and economic growth; SLHC is the supply-leading hypothesis, indicatingGranger causality from financial development to foreign direct investment; DFHC is the demand-followinghypothesis, indicating Granger causality from foreign direct investment to financial development; FBHC is thefeedback hypothesis, indicating bidirectional Granger causality between financial development and foreigndirect investment; NEHC is the neutrality hypothesis, indicating no Granger causality between financialdevelopment and foreign direct investment. MENA is the Middle East and North Africa; ARF is ASEANRegional Forum; SODE is small open developing economiesSource: Authors’ compilation from papers cited
Table I. Summary of studies on the causal connection among financial development, foreign direct investment, and economic growth
7

4. Econometric methodologyWe use the following vector error-correction model (VECM) to consider the possibledirections of causality among financial development, FDI and economic growth:
DPEGit
DFDIitDFINit
264
375 ¼
a1ja2ja3j
264
375þ
Xn
k¼1
b11ik Lð Þb12ik Lð Þb13ik Lð Þb21ik Lð Þb22ik Lð Þb23ik Lð Þb31ik Lð Þb32ik Lð Þb33ik Lð Þ
264
375
DPEGit�k
DFDIit�k
DFINit�k
264
375þ
Z1iECTit�1
Z2iECTit�1
Z3iECTit�1
264
375þ
z1itz2itz3it
264
375; (1)
where Δ is the first difference operator; i is country specification in the panel; t is year; and ζis the random error term.
The ECTt−1s are the lagged error-correction terms. Statistical significance of thecoefficients on these terms would indicate the presence of a long-run relationship amongfinancial development, FDI and economic growth. The VECM[1] provides robust results ifthe variables are integrated of order one and cointegrated. The ECTs are removed in theestimation process if the variables used in the study are not cointegrated.
The null hypotheses are to test the following:
H 01A : b12ik ¼ 0; and Z1i ¼ 0; for k ¼ 1; 2; . . .; n;
H 01B : b21ik ¼ 0; and Z2i ¼ 0; for k ¼ 1; 2; . . .; n;
H 02A : b13ik ¼ 0; and Z1i ¼ 0; for k ¼ 1; 2; . . .; n;
H 02B : b31ik ¼ 0; and Z3i ¼ 0; for k ¼ 1; 2; . . .; n;
H 03A : b32ik ¼ 0; and Z3i ¼ 0; for k ¼ 1; 2; . . .; n;
H 03B : b23ik ¼ 0; and Z2i ¼ 0; for k ¼ 1; 2; . . .; n:
There are different possibilities with respect to the direction of causality among financialdevelopment, FDI and economic growth. For instance, if neither β12ik, β13ik, β21ik, nor β31ik issignificantly different from 0, we can infer that financial development, FDI and economicgrowth do not cause each other. If only β12ik is statistically different from 0, then onlyfinancial development Granger-causes economic growth. If only β13ik is statistically differentfrom 0, then only FDI Granger-causes economic growth. If all β12ik, β13ik, β21ik and β31ik arestatistically different from 0, then there is a feedback association among the variables.Figure 1 depicts the hypotheses that are tested in this empirical process.
We use annual time series data[2] from the World Development Indicators for the G-20countries over the period 1970–2016. The G-20 consists of 19-member countries plus theEuropean Union[3]. These are countries with different development strategies; they areadvanced, developing and emerging countries. These countries together represent around90 percent of the global domestic product, 80 percent of global trade and two-thirds of theworld’s population. The G-20 is a dynamic group of countries to study, one that has notreceived much attention before on the topic addressed in the present study.
Our study deploys per capita economic growth (PEG), FDI and 12 different indicators forfinancial development (FIN), the latter broadly grouped under three headings, namely,banking sector development (BAD), stock market development (STM) and bond marketdevelopment (BOM). Within each group, we consider four different financial indicators.
8

For BAD, the four financial indicators are domestic credit to the private sector (DCP), privatecredit by deposit money banks and other financial institutions (PCO), domestic creditprovided by the financial sector (DCF) and domestic credit to the private sector by banks(DCB). For STM, the four indicators are stock market capitalization (SMC), stock marketvalue traded stocks (SVT), stock turnover ratio (STR) and the number of listed companies inthe stock market (SNL). For BOM, the four financial indicators are domestic private bonds(DPR), domestic public bonds (DPU), international private bonds (IPR) and internationalpublic bonds (IPU). These proxies for financial development have previously been used, forexample, by Hassan et al. (2011) and Pradhan, Arvin and Ghoshray (2015). All the monetaryvariables are measured in constant US dollars.
We also construct[4] three composite indices of financial development, one for bankingsector development (denoted by BSD[5]), one for stock market development (denoted bySMD[6]) and one for bond market development (denoted by BMD[7]), using principalcomponent analysis.
A detailed description of all the variables is presented in Table II.We deploy three different specifications, depending on the inclusion of banking sector
development, stock market development or bond market development. In each specification,we have five cases, depending on the choice of different financial indicators that aredescribed in Table II. The sample size varies[8] from specification to specification,depending on available data for each financial development indicator. It can be noted thatthe estimation of the VECM framework requires the status of unit root and cointegrationamong financial development, FDI and economic growth. Panel unit root and panelcointegration tests are deployed for the same. A brief description of these two tests isavailable in Appendix 2.
H11A
H11B
H31A
H31B
H21B
H21A
FIN PEG FDI
Notes: FIN is financial development; PEG is per capita economic growth and FDI isforeign direct investment. FIN is used for BAD, STM and BOM. BAD is banking sectordevelopment, STM is stock market development and BOM is bond market development.The null hypotheses are stated below. Superscript 1 on H in this figure gives the alternative,with the direction of causality indicated by an arrow: H1
0A: Financial development does not
Granger-cause economic growth; H10B: Economic growth does not Granger-cause financial
development; H20A: Foreign direct investment does not Granger-cause economic growth;
H20B: Economic growth does not Granger-cause foreign direct investment; H3
0A: Financial
development does not Granger-cause foreign direct investment; H30B: Foreign direct
investment does not Granger-cause financial developmentFigure 1. A summary of the hypotheses
9

It can be further noted that the VECM estimation and its essentials, such as unit rootand cointegration among the variables, depend crucially upon the choice of lag lengths.We deploy both the Akaike information criterion (AIC) and the Schwarz–Bayesianinformation criterion (SBC) to determine the optimum lag length. Appendix 3 provides thedetailed results of our estimation with AIC and SBC statistics.
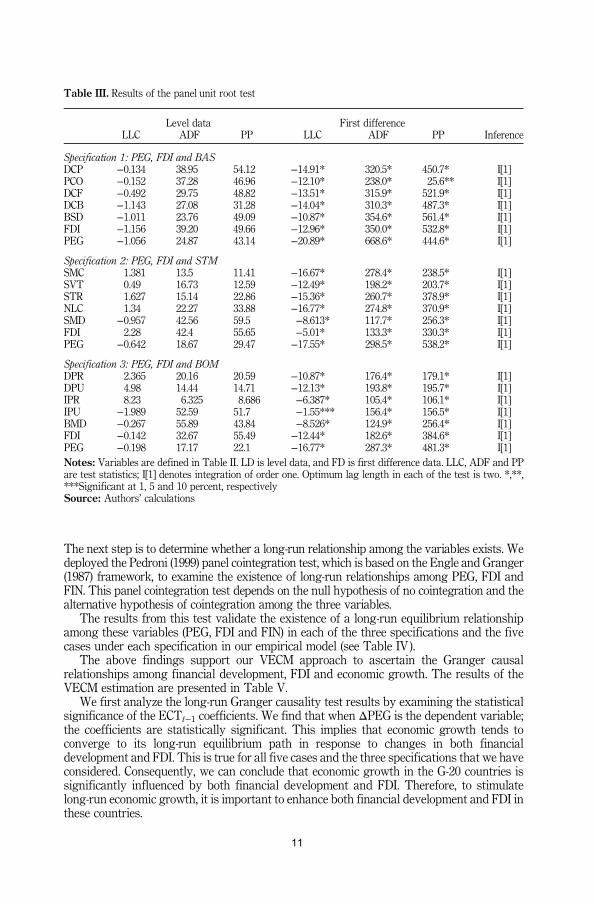
5. Results and discussionThe VECM framework is used to examine the possible Granger causal relationships amongfinancial development, FDI and economic growth. The econometric analysis begins with apanel unit root test[9] and a panel cointegration test among PEG, FDI and FIN, dependingupon the above-mentioned specification (Equation (1)) and the cases (1–5). The panel unitroot test is to examine the order of integration of each variable (PEG, FDI, DCP, PCO, DCF,DCB, BSD, SMC, SVT, STR, NLC, SMD, DPR, DPU, IPR, IPU and BMD). For robustness,three types of panel unit root tests were utilized, namely the Levin–Lin–Chu “t-stat” (Levinet al., 2002), the augmented Dickey–Fuller–Fisher “χ2” and the Phillips Perron–Fisher “χ2”panel unit root tests. These panel unit root tests work under the null hypothesis of a panelunit root (non-stationary variables) and the alternative hypothesis of no unit root (stationaryvariables). The test results are reported in Table III. The results specify that the nullhypothesis of a panel unit root at level data is not rejected by any of these three teststatistics. This indicates that the variables are not stationary at level data. However, the nullhypothesis of the panel unit root is rejected at the first difference because all the variablesare significant at the first difference level. This ensures that all variables are integrated oforder one [I (1)].
Variable Code definition
DCP Domestic credit to the private sector: the financial resources provided to the private sector byfinancial corporations, expressed as a percentage of the gross domestic product
PCO Private credit by deposit money banks and other financial institutions: expressed as a percentage ofthe gross domestic product
DCF Domestic credit provided by financial sector: all the credit to the various sectors on a gross basis,expressed as a percentage of the gross domestic product
DCB Domestic credit to the private sector by banks: financial resources provided by banks to the privatesector, expressed as a percentage of the gross domestic product
BSD Composite index of banking sector development: the weighted average of the four banking sectordevelopment indicators, namely DCP, PCO, DCF and DCB
SMC Stock market capitalization of listed companies: expressed as a percentage of the gross domestic productSVT Stocks traded (total value): expressed as the percentage of the gross domestic productSTR Stocks traded (turnover ratio): expressed as a percentage change in the turnover ratio in the stockmarketNLC Number of listed companies in the stock market: expressed per 10,000 populationSMD Composite index of stock market development: the weighted average of the four stock market
development indicators, namely SMC, SVT, STR and NLCDPR Domestic private debt securities: expressed as a percentage of the gross domestic productDPU Domestic public debt securities: expressed as a percentage of the gross domestic productIPR International private debt securities: expressed as a percentage of the gross domestic productIPU International public debt securities: expressed as a percentage of the gross domestic productBMD Composite index of bond market development: the weighted average of the four bond market
development indicators, namely DPR, DPU, IPR, and IPUFDI Foreign direct investment: total foreign direct investment inflows as a percentage of the gross
domestic productPEG Economic growth: percentage change in per capita gross domestic productNotes: The variables above are all defined in the World Development Indicators, published by the World Bank.All monetary variables are in real US dollars
Table II. Definition of variables
10
The next step is to determine whether a long-run relationship among the variables exists. Wedeployed the Pedroni (1999) panel cointegration test, which is based on the Engle and Granger(1987) framework, to examine the existence of long-run relationships among PEG, FDI andFIN. This panel cointegration test depends on the null hypothesis of no cointegration and thealternative hypothesis of cointegration among the three variables.
The results from this test validate the existence of a long-run equilibrium relationshipamong these variables (PEG, FDI and FIN) in each of the three specifications and the fivecases under each specification in our empirical model (see Table IV ).
The above findings support our VECM approach to ascertain the Granger causalrelationships among financial development, FDI and economic growth. The results of theVECM estimation are presented in Table V.
We first analyze the long-run Granger causality test results by examining the statisticalsignificance of the ECTt−1 coefficients. We find that when ΔPEG is the dependent variable;the coefficients are statistically significant. This implies that economic growth tends toconverge to its long-run equilibrium path in response to changes in both financialdevelopment and FDI. This is true for all five cases and the three specifications that we haveconsidered. Consequently, we can conclude that economic growth in the G-20 countries issignificantly influenced by both financial development and FDI. Therefore, to stimulatelong-run economic growth, it is important to enhance both financial development and FDI inthese countries.
Level data First differenceLLC ADF PP LLC ADF PP Inference
Specification 1: PEG, FDI and BASDCP −0.134 38.95 54.12 −14.91* 320.5* 450.7* I[1]PCO −0.152 37.28 46.96 −12.10* 238.0* 25.6** I[1]DCF −0.492 29.75 48.82 −13.51* 315.9* 521.9* I[1]DCB −1.143 27.08 31.28 −14.04* 310.3* 487.3* I[1]BSD −1.011 23.76 49.09 −10.87* 354.6* 561.4* I[1]FDI −1.156 39.20 49.66 −12.96* 350.0* 532.8* I[1]PEG −1.056 24.87 43.14 −20.89* 668.6* 444.6* I[1]
Specification 2: PEG, FDI and STMSMC 1.381 13.5 11.41 −16.67* 278.4* 238.5* I[1]SVT 0.49 16.73 12.59 −12.49* 198.2* 203.7* I[1]STR 1.627 15.14 22.86 −15.36* 260.7* 378.9* I[1]NLC 1.34 22.27 33.88 −16.77* 274.8* 370.9* I[1]SMD −0.957 42.56 59.5 −8.613* 117.7* 256.3* I[1]FDI 2.28 42.4 55.65 −5.01* 133.3* 330.3* I[1]PEG −0.642 18.67 29.47 −17.55* 298.5* 538.2* I[1]
Specification 3: PEG, FDI and BOMDPR 2.365 20.16 20.59 −10.87* 176.4* 179.1* I[1]DPU 4.98 14.44 14.71 −12.13* 193.8* 195.7* I[1]IPR 8.23 6.325 8.686 −6.387* 105.4* 106.1* I[1]IPU −1.989 52.59 51.7 −1.55*** 156.4* 156.5* I[1]BMD −0.267 55.89 43.84 −8.526* 124.9* 256.4* I[1]FDI −0.142 32.67 55.49 −12.44* 182.6* 384.6* I[1]PEG −0.198 17.17 22.1 −16.77* 287.3* 481.3* I[1]Notes: Variables are defined in Table II. LD is level data, and FD is first difference data. LLC, ADF and PPare test statistics; I[1] denotes integration of order one. Optimum lag length in each of the test is two. *,**,***Significant at 1, 5 and 10 percent, respectivelySource: Authors’ calculations
Table III. Results of the panel unit root test
11

In the short run, the results are mostly uniform, with only one exception. The uniformfinding is the bidirectional causality between financial development and economic growth(i.e. the support of FBH under each specification and in all cases). Moreover, we find non-uniform short-run Granger causality between FDI and economic growth, and between FDIand financial development. The results, summarized in Table VI, demonstrate that theshort-run adjustment dynamics vary across the five cases. In some cases, the existence ofunidirectional causality (supply-leading or demand-following) is supported, whilebidirectional causality ( feedback) and no causality (neutrality) are supported in othercases. These findings are in line with the findings of Adeinyi et al. (2012), Lee and Chang,and Pradhan, Arvin, Hall and Nair (2016).
We test for the robustness of our results through several avenues. First, we utilized fullymodified ordinary least squares and dynamic ordinary least squares. The estimates fromthese tests show that both financial development and FDI have a positive impact oneconomic growth, which is congruent with the findings of Adjasi et al. (2012), Alfaro et al.(2009), Choong (2011) and Pradhan, Arvin, Bahmani, Hall and Norman (2018). Second, weperformed a sensitivity analysis by varying the order of the VECM. The results do not
Specifications Cases
Specification 1: PEG, FDI and BASDCP PCO DCF DCB BSD
Panel v-statistics 3.941* 4.331* 2.269* 3.480* 4.636*Panel ρ-statistics −11.51* −10.05* −12.23* −11.48* −12.26*Panel PP-statistics −11.73* −10.75* −14.97* −11.91* −12.55*Panel ADF-statistics −8.411* −7.67* −9.93* −8.54* −9.011*Group ρ-statistics −10.23* −9.26* −9.25* −9.80* −10.29Group PP-statistics −15.96* −15.37* −16.22* −17.64* −17.80Group ADF-statistics −11.19* −11.02* −11.53* −11.56* −11.92*
Specification 2: PEG, FDI and STMSMC SVT STR NLC SMD
Panel v-statistics −0.436 −0.886 −0.545 2.125** 1.554***Panel ρ-statistics −6.414* −5.601* −4.991* −5.025* −5.206*Panel PP-statistics −10.05 −9.658* −9.606* −9.153* −9.319Panel ADF-statistics −6.384* −6.334* −6.705* −6.496* −6.866*Group ρ-statistics −3.089* −2.417* −1.147 −2.654* −2.041*Group PP-statistics −9.467* −10.25* −9.411* −11.06* −9.591*Group ADF-statistics −6.601* −7.237* −6.395* −6.301* −7.570*
Specification 3: PEG, FDI and BOMDPR DPU IPR IPU BMD
Panel v-statistics −1.177 −0.839 −0.647 −1.342 −0.51Panel ρ-statistics −3.679* −5.036* −4.121* −3.831* −6.380*Panel PP-statistics −9.364* −9.209* −9.307* −9.759* −11.02*Panel ADF-statistics −5.741* −5.426* −5.012* −6.019* −6.625*Group ρ-statistics −1.923*** −2.088** −1.451*** −0.587 −2.864*Group PP-statistics −12.55* −11.73* −11.26* −10.45* −12.39*Group ADF-statistics −6.847* −7.568* −6.131* −6.203* −7.01*Notes: Specification 1 deals with PEG, FDI and BAS (DCP/PCO/DCF/DCB/BSD); Specification 2 deals withPEG, FDI and STM (SMC/SVT/STR/NLC/SMD); and Specification 3 deals with PEG, FDI and BOM (DPR/DPU/IPR/IPU/BMD). BAS is banking sector development and stands for DCP, PCO, DCF, DCB or BSD; STMis stock market development and stands for SMC, SVT, STR, NLC or SMD; BOM is bond market developmentand stands for DPR, DPU, IPR, IPU or BMD. Variables are defined in Table II. Optimum lag length in eachcase is two. *,**,***Significant at 1, 5 and 10 percent, respectivelySource: Authors’ calculations
Table IV. Results of the cointegration test among FDI, financial development and economic growth
12

Dependent variable Independent variables
Specification 1: PEG, FDI and BASCase 1: DCP Case 2: PCO Case 3: DCF
ΔPEG ΔFDI ΔDCP ECT−1 ΔPEG ΔFDI ΔPCO ECT−1 ΔPEG ΔFDI ΔDCF ECT−1ΔPEG – 0.284 4.671 −0.94* – 0.787 5.127* −0.87* – 1.343 3.019*** −0.49*ΔFDI 1.219 – 0.178 −0.69 1.117 – 0.585 −0.94 4.095* – 1.054 −0.24ΔBAS 4.339** 1.015 – −0.24 8.26* 1.373 – −0.13 10.0* 0.55 – −0.12
Case 4: DCB Case 5: BSDΔPEG ΔFDI ΔDCB ECT−1 ΔPEG ΔFDI ΔBSD ECT−1
ΔPEG – 0.63 5.82* −0.50* – 0.538 3.482 −0.49*ΔFDI 0.24 – 2.38 −0.72 1.803 – 3.591*** −0.11ΔBAS 8.89* 3.49*** – −0.14 8.821* 2.471 – −0.19
Specification 2: PEG, FDI and STMCase 1: SMC Case 2: SVT Case 3: STR
ΔPEG ΔFDI ΔSMC ECT−1 ΔPEG ΔFDI ΔSVT ECT−1 ΔPEG ΔFDI ΔSTR ECT−1ΔPEG – 2.288 8.50* −0.39* – 1.901 4.377** −0.42* – 0.759 4.81** −0.55*ΔFDI 0.752 – 9.046* −0.43 0.66 – 0.84 −0.13 0.07 – 1.93 −0.74ΔSTM 5.034* 1.753 – −0.84 16.7* 3.04 – −0.21 6.67* 4.84** – −0.24
Case 4: NLC Case 5: SMDΔPEG ΔFDI ΔNLC ECT−1 ΔPEG ΔFDI ΔSMD ECT−1
ΔPEG – 3.09*** 12.98* −0.55* – 3.753*** 4.801** −0.36*ΔFDI 1.595 – 3.291*** −0.27 5.079* – 0.149 −0.156ΔSTM 5.01* 1.461 – −0.02 9.458* 8.300* – −0.16
Specification 3: PEG, FDI and BOMCase 1: DPR Case 2: DPU Case 3: IPR
ΔPEG ΔFDI ΔDPR ECT−1 ΔPEG ΔFDI ΔDPU ECT−1 ΔPEG ΔFDI ΔIPR ECT−1ΔPEG – 0.991 13.17* −0.43* – 0.738 5.435* −0.55* – 3.651*** 4.049** −0.56*ΔFDI 7.399* – 0.727 −0.79 5.854* – 0.162 −0.52 1.516 – 5.156* −0.21ΔBOM 4.899** 0.005 – −0.68 3.970*** 0.432 – −0.21 23.5* 1.67 – −0.012
Case 4: IPU Case 5: BMDΔPEG ΔFDI ΔIPU ECT−1 ΔPEG ΔFDI ΔBMD ECT−1
ΔPEG – 5.35** 5.43** −0.38* – 6.06* 18.6** −0.56*ΔFDI 10.8* – 3.59*** −0.26 1.898 – 3.045*** −0.26ΔBOM 4.818** 3.149*** – −0.01 9.03* 1.157 – −0.86Notes: Specification 1 deals with PEG, FDI and BAS (DCP/PCO/DCF/DCB/BSD); Specification 2 deals with PEG, FDI and STM (SMC/SVT/STR/NLC/SMD); and Specification 3deals with PEG, FDI and BOM (DPR/DPU/IPR/IPU/BMD). BAS is banking sector development and stands for DCP, PCO, DCF, DCB or BSD (Cases 1–5 in the table); STM is stockmarket development and stands for SMC, SVT, STR, NLC or SMD (Cases 1–5 in the table); BOM is bond market development and stands for DPR, DPU, IPR, IPU or BMD (Cases 1–5in the table). Variables are defined in Table II. ECT−1 is the lagged error-correction term. Optimum lag lengths in each case are derived on the basis of AIC and SBC statistics (seeAppendix 3). *,**,***Significant at 1, 5 and 10 percent, respectivelySource: Authors’ calculations
Table V. Results of panel granger causality test among foreign direct investment, financial development and economic growth
13

reveal any substantial change to our earlier findings. Third, we used generalized impulseresponse functions to trace the effect of a one-off shock to an innovation on the current andfuture values of the endogenous variables. The results provide supplementary insight intoour general approach. The results of these additional tests are not provided here for the sakeof brevity but are available from the authors upon request.
6. ConclusionThis study examines the causal relationship among financial development, FDI andeconomic growth in the G-20 countries over the period 1970–2016. The analysis was based onfour indicators of banking sector development, four indicators of stock market developmentand four indicators of bond market development. Since using all of these indicators
Cases/Specifications
Financial development and economicgrowth
FDI and economicgrowth
Financial developmentand FDI
Specification 1: PEG, FDI and BASCase 1 FBHA NEHB NEHC
Case 2 FBHA NEHB NEHC
Case 3 FBHA DFHB NEHC
Case 4 FBHA NEHB DFHC
Case 5 FBHA NEHB SLHC
Specification 2: PEG, FDI and STMCase 1 FBHB NEHB SLHB
Case 2 FBHB NEHB DFHB
Case 3 FBHB NEHB DFHB
Case 4 FBHB SLHB SLHB
Case 5 FBHB FBHB DFHB
Specification 3: PEG, FDI and BOMCase 1 FBHC DFHC NEHC
Case 2 FBHC DFHC NEHC
Case 3 FBHC SLHC SLHC
Case 4 FBHC FBHC FBHC
Case 5 FBHC SLHC SLHC
Notes: SLHA is the supply-leading hypothesis, indicating Granger causality from financial development to percapita economic growth; DFHA is the demand-following hypothesis, indicating Granger causality from per capitaeconomic growth to financial development; FBHA is the feedback hypothesis, indicating bidirectional Grangercausality between financial development and per capita economic growth; SLHB is the supply-leading hypothesis,indicating Granger causality from foreign direct investment to per capita economic growth; DFHB is the demand-following hypothesis, indicating Granger causality from per capita economic growth to foreign direct investment;FBHB is the feedback hypothesis, indicating bidirectional Granger causality between foreign direct investment andper capita economic growth; SLHC is the supply-leading hypothesis, indicating Granger causality from financialdevelopment to foreign direct investment; DFHC is the demand-following hypothesis, indicating Granger causalityfrom foreign direct investment to financial development; FBHC is the feedback hypothesis, indicating bidirectionalGranger causality between financial development and foreign direct investment; NEHA is the neutrality hypothesis,indicating no Granger causality between financial development and per capita economic growth; NEHB is theneutrality hypothesis, indicating no Granger causality between foreign direct investment and per capita economicgrowth; and NEHC is the neutrality hypothesis, indicating no Granger causality between foreign direct investmentand financial development. Financial development is used to denote all three aspects of financial development,namely BAS (captured by DCP/PCO/DCF/DCB/BSD), STM (captured by SMC/SVT/STR/NLC/SMD) and BOM(captured by DPR/DPU/IPR/IPU/BMD). BAS is banking sector development and stands for DCP, PCO, DCF, DCBor BSD (Cases 1–5 in the table); STM is stock market development and stands for SMC, SVT, STR, NLC or SMD(Cases 1–5 in the table); BOM is bond market development and stands for DPR, DPU, IPR, IPU or BMD (Cases 1–5in the table). Variables are defined in Table II. The findings are on the basis of the test results in Table VSource: Authors’ calculation
Table VI. Summary of short-run Granger causality results
14

simultaneously poses a multicollinearity problem, the study uses them individually along withcomposite indices.
Our key findings are that financial development, FDI and economic growth areintegrated of order one and cointegrated. Most importantly, there is clear evidence thatboth financial development and FDI matter in the determination of long-run economicgrowth. In the short run, the causal connection between the variables is bidirectional,unidirectional or neutral, depending on the type of financial indicators that we incorporatein the estimation process.
One drawback of our analysis is that the period under consideration includes a set ofcrises (the Brazilian crisis, the September 11 terror attacks, and the worldwide financialcrisis, including the debt crisis) that cause significant asymmetries. The classical VECMcannot capture these asymmetries. This implies that the causality among financialdevelopment, FDI and economic growth may be time-varying. Further investigation of thisissue is an open area for future research[10].
Our present study carries the following policy implications.
6.1 With respect to the financial development and economic growth nexusIn order to promote economic growth, attention must be paid to policies that promotefinancial development. This, in turn, calls for fostering incentives to guarantee continuedsupport to liberalize the economy, promote capital openness and focus on developing acountry’s infrastructure. Additionally, the level of financial infrastructure should beimproved in order to have more financial innovation and application in the economy(see, inter alia, Beck and Levine, 2004; Herwartz and Walle, 2014). Furthermore, given thepossibility of bidirectional causality, policies that increase economic growth would bedesirable in order to bring about further financial development.
6.2 With respect to the foreign direct investment and economic growth nexusTo promote economic growth, a well-developed market for FDI is needed for the G-20countries. This requires the development of a strategy by which FDI can adjust to themacroeconomic changes in order to enhance long-run economic growth. This can alsoinclude the relaxation of FDI restrictive policies wherever they exist. Policy makers ought toensure that the FDI ecosystem is robust and supports knowledge spillover in the hosteconomy to nurture entrepreneurship and next-generation enterprises that can contribute toeconomic growth. Countries without a sound institutional setup to improve the humancapital will not be able to sustain viable FDI (see, inter alia, Borensztein et al., 1998). Thismay hinder the development of start-up enterprises that have the potential to developnext-generation technologies and innovation that contribute to economic growth.Conversely, economic growth is likely to attract further FDIs.
6.3 With regard to the foreign direct investment and financial development nexusIn order to facilitate better financial development, a greater degree of FDI is desirable in theG-20 countries, and vice versa. The establishment of a well-developed financial market,including well-functioning banks and other financial institutions, can facilitate furtherinvestment and an easier means of raising capital to support the activities of FDI, which inturn could lead to better outcomes in the economy. On the flip side, improvements in FDI cansupport further development of the financial activities through increased organizational andoperational efficiencies (see, inter alia, Agbloyor et al., 2013).
Summing up, to stimulate long-term economic growth in the G-20 countries, policymakers should give priority to financial sector reforms, particularly with reference tobanking sector development, stock market development and bond market development.
15

Additionally, sustainable economic growth ought to be a goal in these countries, since itwould generate additional opportunities for banking sector development, stock marketdevelopment and bond market development, as well as FDI, at least in the short run.
Notes
1. The estimation of the VECM is very sensitive to the choice of lag length, as the causality testresults depend on the lag specification. The study uses the Akaike information criterion and theSchwarz–Bayesian information criterion to determine the optimum lag length for eachspecification and each case (see below for further discussion).
2. We have an unbalanced panel as dictated by data availability on the countries over the period1970–2016.
3. The countries are Argentina, Brazil, China, India, Indonesia, Mexico, the Russian Federation, SaudiArabia, South Africa, Turkey, Australia, Canada, France, Germany, Italy, Japan, the KoreanRepublic, the UK and the USA. The European Union is excluded to avoid double counting countries.
4. The procedural details are discussed in Pradhan, Arvin, Norman and Hall (2014) andPradhan et al.
5. BSD is the weighted average of the four banking sector development indicators, namely, DCP,PCO, DCF and DCB. The weights of this index are derived by PCA. Appendix 1 provides a briefdescription of these weights and the index construction (see Table A1).
6. SMD is the weighted average of the four stock market development indicators, namely, SMC,SVT, STR and SNL. The weights of this index are derived by PCA ( for details see Table A2).
7. BMD is the weighted average of the four bond market development indicators, namely, DPR,DPU, IPR and IPU. The weights of this index are derived by PCA ( for details see Table A3).
8. Variation is with respect to time series only, while country inclusion (19) remains the same undereach specification.
9. This is to determine whether a time series variable is non-stationary and possesses a unit root(Bierens, 2001).
10. The techniques like two-regime vector error-correction model (see, for instance, Hansen and Seo,2002) can be additionally used to trace the effects of these crises on the causality among financialdevelopment, foreign direct investment and economic growth in the G-20 countries.
References
Adeinyi, O., Omisakin, O., Egwaikh, F.O. and Oyinlola, A. (2012), “Foreign direct investment, economicgrowth and financial sector development in small open developing economies”, EconomicAnalysis and Policy, Vol. 42 No. 1, pp. 105-127.
Adjasi, C.K.D., Abor, J., Osei, K.A. and Nyavor-Foli, E.E. (2012), “FDI and economic activity in Africa: the roleof local financial markets”, Thunderbird International Business Review, Vol. 54 No. 4, pp. 429-439.
Agbloyor, E.K., Abor, J. and Adjasi, C.K.D. (2013), “Exploring the causality links between financialmarkets and foreign direct investment in Africa”, Research in International Business andFinance, Vol. 28 No. 2013, pp. 118-134.
Agbloyor, E.K., Abor, J., Adjasi, C.K. and Yawson, A. (2012), “Domestic banking sector developmentand cross border mergers and acquisitions in Africa”, Review of Development Finance, Vol. 2No. 1, pp. 32-42.
Ahmed, A.D. and Wahid, A.N.M. (2011), “Financial structure and economic growth link in Africancountries: a panel cointegration analysis”, Journal of Economic Studies, Vol. 38 No. 3, pp. 331-357.
Ahmed, A.D., Cheng, E. and Messinis, G. (2011), “The role of exports, FDI and imports indevelopment: evidence from Sub-Saharan African Countries”, Applied Economics, Vol. 43 No. 26,pp. 3719-3731.
16

Alfaro, L., Kalemli-Ozcan, S. and Sayek, S. (2009), “FDI, productivity and financial development”,The World Economy, Vol. 32 No. 1, pp. 111-135.
Alfaro, L., Chanda, A., Ozcan, S.K. and Sayek, S. (2004), “FDI and economic growth: the role of localfinancial markets”, Journal of International Economics, Vol. 64 No. 1, pp. 89-112.
Alguacil, M.T., Cuadros, A. and Orts, V. (2002), “Foreign direct investment, exports and domesticperformance in Mexico: a causality analysis”, Economic Letters, Vol. 77 No. 3, pp. 371-376.
Al-Yousif, Y.K. (2002), “Financial development and economic growth: another look at the evidence fromdeveloping countries”, Review of Financial Economics, Vol. 11 No. 2, pp. 131-150.
Arestis, P., Demetriades, P.O. and Luintel, K.B. (2001), “Financial development and economic growth:the role of stock markets”, Journal of Money, Credit and Banking, Vol. 33 No. 1, pp. 16-41.
Ayyagari, M., Demirgüç-Kunt, A. and Maksimovic, V. (2007), “Formal versus informal finance:evidence from China”, Review of Financial Studies, Vol. 23 No. 8, pp. 3048-3097.
Barro, R.J. and Sala-i-Martin, X. (1995), Economic Growth, McGraw Hill, New York, NY.
Beck, T. and Levine, R. (2004), “Stock markets, banks, and growth: panel evidence”, Journal of Bankingand Finance, Vol. 28 No. 3, pp. 423-442.
Beck, T., Levine, R. and Loayza, N. (2000), “Finance and the sources of growth”, Journal of FinancialEconomics, Vol. 58 No. 1, pp. 261-300.
Bianchi, J. (2010), “Credit externalities: macroeconomic effects and policy implications”, AmericanEconomic Review, Vol. 100 No. 2, pp. 398-402.
Bierens, H.J. (2001), “Unit roots”, Chapter 29 in Baltagi, B. (Ed.), A Companion to Econometric Theory,Blackwell Publishers, Oxford, pp. 610-633.
Borensztein, E., Gregorio, J.D. and Lee, J.W. (1998), “How does foreign direct investment affect economicgrowth?”, Journal of International Economics, Vol. 45 No. 1, pp. 115-135.
Chan, M.W., Hou, K., Li, X. and Mountain, D.C. (2014), “Foreign direct investment and its determinants:a regional panel causality analysis”, Quarterly Review of Economics and Finance, Vol. 54 No. 4,pp. 579-589.
Choe, J.I. (2003), “Do foreign direct investment and gross domestic investment promote economicgrowth?”, Review of Development Economics, Vol. 7 No. 1, pp. 44-57.
Choong, C. (2011), “Does domestic financial development enhance the linkages between foreign directinvestment and economic growth?”, Empirical Economics, Vol. 42 No. 3, pp. 819-834.
Choong, C.K., Yusop, Z. and Soo, S.C. (2004), “Foreign direct investment, economic growth, andfinancial sector development: a comparative analysis”, ASEAN Economic Bulletin, Vol. 21 No. 3,pp. 278-289.
Craigwell, R., Downes, D. and Howard, M. (2001), “The finance-growth nexus: a multivariate VARanalysis of a small open economy”, Savings and Development, Vol. 25 No. 2, pp. 209-223.
De Vita, G. and Kyaw, K.S. (2008), “Determinants of FDI and portfolio flows to developing countries: apanel cointegration analysis”, European Journal of Economics, Finance and AdministrativeSciences, Vol. 13 No. 13, pp. 161-168.
Desai, M.A., Foley, C.F. and Hines, J.R. Jr (2006), “Capital controls, liberalizations, and foreign directinvestment”, The Review of Financial Studies, Vol. 19 No. 4, pp. 1433-1464.
Desbordes, R. and Wei, S. (2017), “The effects of financial development on foreign direct investment”,Journal of Development Economics, Vol. 127, pp. 153-168.
Duasa, J. (2007), “Malaysian foreign direct investment and growth: does stability matter?”, Journal ofEconomic Cooperation, Vol. 28 No. 2, pp. 83-98.
Dwivedi, A. (2012), “Effect of FDI and trade on productivity in Indian electronics firms”, EconomicJournal, Vol. 60 No. 3, pp. 76-90.
Engle, R.F. and Granger, C.W.J. (1987), “Cointegration and error correction: representation, estimationand testing”, Econometrica, Vol. 55 No. 2, pp. 251-276.
17

Freckleton, M., Wright, A. and Craigwell, R. (2012), “Economic growth, foreign direct investment andcorruption in developed and developing countries”, Journal of Economic Studies, Vol. 39 No. 6,pp. 630-652.
Freytag, A. and Frickea, S. (2017), “Sectoral linkages of financial services as channels of economicdevelopment- an input-output analysis of the Nigerian and Kenyan economies”, Review ofDevelopment Finance, Vol. 7 No. 2017, pp. 36-44.
Greenwood, J. and Smith, B. (1997), “Financial markets in development, and the development offinancial markets”, Journal of Economic Dynamics and Control, Vol. 21 No. 1, pp. 145-181.
Hansen, B. and Seo, B. (2002), “Testing for two-regime threshold cointegration in vector error-correction models”, Journal of Econometrics, Vol. 110 No. 2, pp. 293-318.
Hassan, K.M., Sanchez, B. and Yu, J. (2011), “Financial development and economic growth: newevidence from panel data”, Quarterly Review of Economics and Finance, Vol. 51 No. 1, pp. 88-104.
Hermes, N. and Lensink, R. (2003), “Foreign direct investment, financial development and economicgrowth”, Journal of Development Studies, Vol. 40 No. 1, pp. 142-163.
Herwartz, H. and Walle, Y.M. (2014), “Determinants of the link between financial and economicdevelopment: evidence from a functional coefficient model”, Economic Modelling, Vol. 37 No. 2,pp. 417-427.
Herzer, D., Klasen, S. and Nowak-Lehmann, F.D. (2008), “In search of FDI-led growth in developingcountries: the way forward”, Economic Modelling, Vol. 25 No. 5, pp. 793-810.
Hsueh, S., Hu, Y. and Tu, C. (2013), “Economic growth and financial development in Asian countries: abootstrap panel Granger causality analysis”, Economic Modelling, Vol. 32 No. 3, pp. 294-301.
Jedidia, K.B., Boujelbene, T. and Helali, K. (2014), “Financial development and economic growth: newevidence from Tunisia”, Journal of Policy Modelling, Vol. 36 No. 5, pp. 883-898.
Kholdy, S. and Sohrabian, A. (2008), “Foreign direct investment, financial markets, and politicalcorruption”, Journal of Economic Studies, Vol. 35 No. 6, pp. 486-500.
Law, S.H. and Singh, N. (2014), “Does too much finance harm economic growth?”, Journal of Bankingand Finance, Vol. 41 No. 3, pp. 36-44.
Lean, H.H. and Tan, B.W. (2011), “Linkages between foreign direct investment, domestic investmentand economic growth in Malaysia”, Journal of Economic Cooperation and Development, Vol. 32No. 4, pp. 75-96.
Levin, A., Lin, C.F. and Chu, C.S.J. (2002), “Unit root tests in panel data: asymptotic and finite-sampleproperties”, Journal of Econometrics, Vol. 108 No. 1, pp. 1-24.
Levine, R. (1998), “The legal environment, banks, and long-run economic growth”, Journal of Money,Credit and Banking, Vol. 30 No. 3, pp. 596-613.
Levine, R. (2003), “More on finance and growth: more finance, more growth?”, Federal Reserve Bank ofSt Louis Review, Vol. 85 No. 6, pp. 31-46.
Liang, Q. and Teng, Z. (2006), “Financial development and economic growth: evidence from China”,China Economic Review, Vol. 17 No. 2, pp. 395-411.
Liu, X., Wang, C. and Wei, Y. (2001), “Casuals link between foreign direct investment and trade inChina”, China Economic Review, Vol. 12 No. 2, pp. 190-202.
Menyah, K., Nazlioglu, S. and Wolde-Rufael, Y. (2014), “Financial development, trade openness andeconomic growth in African countries: new insights from a panel causality approach”, EconomicModelling,, Vol. 37 No. 2, pp. 386-394.
Ngare, E., Nyamongo, E.M. and Misati, R.N. (2014), “Stock market development and economic growthin Africa”, Journal of Economics and Business, Vol. 74 No. 1, pp. 24-39.
Odhiambo, N.M. (2010), “Finance-investment-growth nexus in South Africa: an ARDL bounds testingprocedure”, Economic Change Restructuring, Vol. 43 No. 3, pp. 205-219.
Otchere, I., Soumaré, I. and Yourougou, P. (2016), “FDI and financial market development in Africa”,The World Economy, Vol. 39 No. 5, pp. 651-678.
18

Pedroni, P. (1999), “Critical values for cointegration tests in heterogeneous panels with multipleregressors”, Oxford Bulletin of Economics and Statistics, Vol. 61 No. S1, pp. 653-670.
Pradhan, R.P., Arvin, M.B. and Bahmani, S. (2015), “Causal nexus between economic growth, inflation,and stock market development: the case of OECD countries”, Global Finance Journal, Vol. 27,July, pp. 98-111.
Pradhan, R.P., Arvin, M.B. and Ghoshray, A. (2015), “The dynamics of economic growth, oil prices,stock market depth, and other macroeconomic variables: evidence from the G-20 countries”,International Review of Financial Analysis, Vol. 39, pp. 89-95, available at: https://doi.org/10.1016/j.irfa.2015.03.006
Pradhan, R.P., Arvin, M.B. and Hall, J.H. (2018), “The nexus between economic growth, stock marketdepth, trade openness, and foreign direct investment: the case of ASEAN countries”, SingaporeEconomic Review, Vol. 63 No. 1, pp. 1-33.
Pradhan, R.P., Arvin, M.B., Hall, J.H. and Nair, M. (2016), “Trade openness, foreign direct investment,and finance-growth nexus in the Eurozone countries”, Journal of International Trade andEconomic Development, Vol. 26 No. 3, pp. 336-360.
Pradhan, R.P., Arvin, M.B., Norman, N.R. and Hall, J.H. (2014), “The dynamics of banking sector andstock market maturity and the performance of Asian economies”, Journal of Economic andAdministrative Sciences, Vol. 30 No. 1, pp. 16-44.
Pradhan, R.P., Arvin, M.B., Norman, N.R. and Nishigaki, Y. (2014), “Does banking sector developmentaffect economic growth and inflation? A panel cointegration and causality approach”, AppliedFinancial Economics, Vol. 24 No. 7, pp. 465-480.
Pradhan, R.P., Arvin, M.B., Bahmani, S., Hall, J.H. and Norman, N.R. (2017), “Finance and growth:evidence from the ARF countries”, Quarterly Review of Economics and Finance, Vol. 66 No. 4,pp. 136-148.
Pradhan, R.P., Arvin, M.B., Bahmani, S., Hall, J.H. and Norman, N.R. (2018), “Are innovation andfinancial development causative factors in economic growth? Evidence from a panel Grangercausality test”, Technological Forecasting & Social Change, Vol. 132, July, pp. 130-142.
Pradhan, R.P., Arvin, M.B., Bennett, S.E., Nair, M. and Hall, J.H. (2016), “Bond market development,economic growth and other macroeconomic determinants: panel VAR evidence”, Asia-PacificFinancial Markets, Vol. 23 No. 2, pp. 175-201.
Pradhan, R.P., Arvin, M.B., Nair, M., Hall, J.H. and Gupta, A. (2017), “Is there a link between economicgrowth and insurance and banking sector activities in the G-20 countries?”, Review of FinancialEconomics, Vol. 33 No. 1, pp. 12-28.
Quartey, P. and Prah, F. (2008), “Financial development and economic growth in Ghana: is there acausal link?”, African Finance Journal, Vol. 10 No. 1, pp. 28-54.
Rousseau, P.L. and Wachtel, P. (2000), “Banks, stock markets and China’s great leap forward”,Emerging Markets Review, Vol. 8 No. 3, pp. 206-217.
Saini, N. and Singhania, M. (2018), “Determinants of FDI in developed and developing countries: aquantitative analysis using GMM”, Journal of Economic Studies, Vol. 45 No. 2, pp. 348-382.
Schumpeter, J.A. (1911), The Theory of Economic Development, Harvard University Press, Cambridge, MA.
Seetanah, B. and Ramessur, S.T. (2009), “Financial development and economic growth: new evidencefrom a sample of Island economies”, Journal of Economic Studies, Vol. 36 No. 2, pp. 124-134.
Sunde, T. (2017), “Foreign direct investment, exports and economic growth: ADRL and causality analysisfor South Africa”, Research in International Business and Finance, Vol. 41 No. C, pp. 434-444.
Tang, T.C. and Wong, K.N. (2011), “Foreign direct investment, merchandise and services trade in atransition economy: the case of Cambodia”, International Economic Journal, Vol. 25 No. 2,pp. 251-267.
Tsagkanos, A., Siriopoulos, C. and Vartholomatou, K. (2018), “Foreign direct investment and stockmarket development: evidence from a ‘new’ emerging market”, Journal of Economic Studies,Vol. 46, pp. 55-70, available at: https://doi.org/10.1108/JES-06-2017-0154
19
Wu, J., Hou, H. and Cheng, S. (2010), “The dynamic impacts of financial institutions on economic growth:evidence from the European union”, Journal of Macroeconomics, Vol. 32 No. 3, pp. 879-891.
Xiaohui, L., Burridge, P. and Sinclair, P.J.N. (2002), “Relationships between economic growth, foreigndirect investment and trade: evidence from China”, Applied Economics, Vol. 34 No. 11,pp. 1433-1440.
Yalta, A.Y. (2013), “Revisiting the FDI-led growth hypothesis: the case of China”, Economic Modelling,Vol. 31 No. 3, pp. 335-343.
Zhang, K.H. (2001), “Does foreign direct investment promote economic growth? Evidence from EastAsia and Latin America”, Contemporary Economic Policy, Vol. 19 No. 2, pp. 175-185.
Zhao, L., Wei, Z. and Andreosso-O’Callaghan, B. (2017), “FDI outflows, exports and financialdevelopment”, Journal of Economic Studies, Vol. 44 No. 6, pp. 987-1002.
Further reading
Ang, J.B. (2009), “Financial development and the FDI-growth nexus: the Malaysian experience”,AppliedEconomics, Vol. 41 No. 13, pp. 1595-1601.
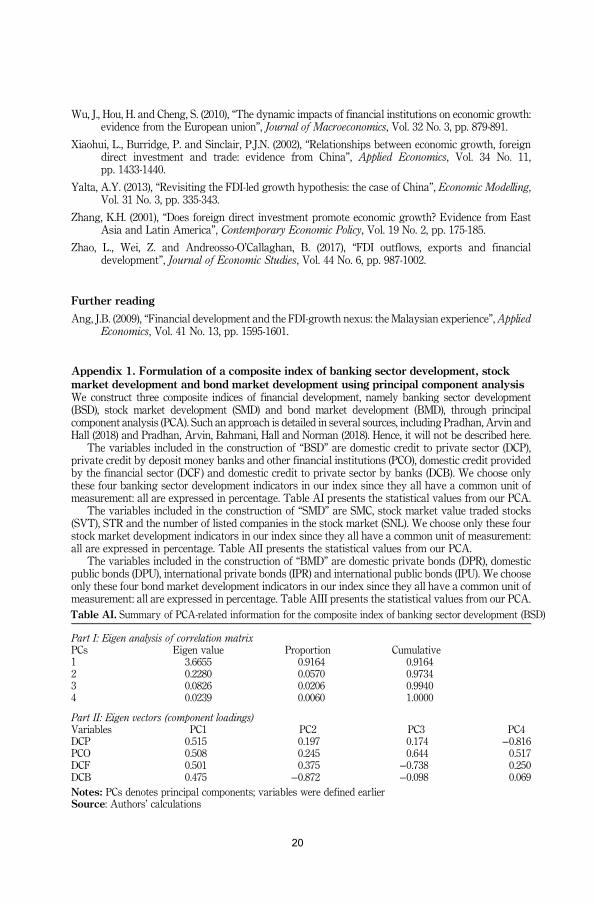
Appendix 1. Formulation of a composite index of banking sector development, stockmarket development and bond market development using principal component analysisWe construct three composite indices of financial development, namely banking sector development(BSD), stock market development (SMD) and bond market development (BMD), through principalcomponent analysis (PCA). Such an approach is detailed in several sources, including Pradhan, Arvin andHall (2018) and Pradhan, Arvin, Bahmani, Hall and Norman (2018). Hence, it will not be described here.
The variables included in the construction of “BSD” are domestic credit to private sector (DCP),private credit by deposit money banks and other financial institutions (PCO), domestic credit providedby the financial sector (DCF) and domestic credit to private sector by banks (DCB). We choose onlythese four banking sector development indicators in our index since they all have a common unit ofmeasurement: all are expressed in percentage. Table AI presents the statistical values from our PCA.
The variables included in the construction of “SMD” are SMC, stock market value traded stocks(SVT), STR and the number of listed companies in the stock market (SNL). We choose only these fourstock market development indicators in our index since they all have a common unit of measurement:all are expressed in percentage. Table AII presents the statistical values from our PCA.
The variables included in the construction of “BMD” are domestic private bonds (DPR), domesticpublic bonds (DPU), international private bonds (IPR) and international public bonds (IPU). We chooseonly these four bond market development indicators in our index since they all have a common unit ofmeasurement: all are expressed in percentage. Table AIII presents the statistical values from our PCA.
Part I: Eigen analysis of correlation matrixPCs Eigen value Proportion Cumulative1 3.6655 0.9164 0.91642 0.2280 0.0570 0.97343 0.0826 0.0206 0.99404 0.0239 0.0060 1.0000
Part II: Eigen vectors (component loadings)Variables PC1 PC2 PC3 PC4DCP 0.515 0.197 0.174 −0.816PCO 0.508 0.245 0.644 0.517DCF 0.501 0.375 −0.738 0.250DCB 0.475 −0.872 −0.098 0.069Notes: PCs denotes principal components; variables were defined earlierSource: Authors’ calculations
Table AI. Summary of PCA-related information for the composite index of banking sector development (BSD)
20

Appendix 2. A note on panel unit root test and panel cointegration test
Panel unit root testIt can be noted that data generating for many economic variables are characterized by stochastictrends that might result in spurious inference if the time series properties are not investigated. A timeseries is said to be stationary if the mean and autocovariance of the series do not depend on time. Anyseries that is not stationary has a unit root. The formal method to test the stationarity is the unit roottest. The panel unit root test is conducted to determine the stationarity of the series, i.e., to ascertain thedegree (or order) of integration for financial development, FDI and economic growth. Three-unit roottests are conducted in this paper. These tests are Levin–Lin–Chu, augmented Dickey–Fuller andPhillips and Perron. We do not present the details of these tests here as they are covered in most timeseries and/or econometric textbooks.
Panel cointegration testCointegration test is deployed to know whether there is a long-run relationship among financialdevelopment, FDI and economic growth. The available techniques for panel cointegration tests are, inessence, an application of the Engle and Granger (1987) cointegration analysis. As in the analysis of singletime series, these approaches test the residuals from the estimation for stationarity. Pedroni (1999)provide different statistics for this purpose, both of which assume homogenous slope coefficients acrossthe countries. These tests are adequately described in advanced econometric textbooks.
Part I: Eigen analysis of correlation matrixPCs Eigen value Proportion Cumulative1 2.2131 0.5533 0.55332 0.9732 0.2433 0.79663 0.6736 0.1684 0.96504 0.1402 0.0350 1.0000
Part II: Eigen vectors (component loadings)Variables PC1 PC2 PC3 PC4SMC 0.467 −0.605 0.442 0.471SVT 0.626 0.109 0.261 −0.726STR 0.435 0.749 0.033 0.499SNL 0.448 −0.250 −0.858 0.040Note: PCs denotes principal components; variables were defined earlierSource: Authors’ calculations
Table AII. Summary of PCA-related information for the composite index of stock market development (SMD)
Part I: Eigen analysis of correlation matrixPCs Eigen value Proportion Cumulative1 1.7510 0.4377 0.43772 0.9197 0.2299 0.66773 0.8735 0.2184 0.88614 0.4558 0.1139 1.0000
Part II: Eigen vectors (component loadings)Variables PC1 PC2 PC3 PC4DCP 0.633 0.182 −0.155 −0.736PCO 0.538 0.595 0.107 0.588DCF 0.363 −0.493 0.790 0.023DCB 0.422 0.608 0.583 −0.335Note: PCs denotes principal components; variables were defined earlierSource: Authors’ calculations
Table AIII. Summary of PCA-related Information for the composite index of bond market development (BMD)
21

Appendix 3. VECM estimation results and lag specification
About the authorsRudra Pradhan is SAP Fellow and Associate Professor at Indian institute of Technology Kharagpur,India, where he has been associated with Vinod Gupta School of Management and RCG School ofInfrastructure Design and Management. Pradhan is affiliated with various professional journals likeJournal of Economic Development (Associate Editor), Heliyon (Editorial Board Member), FinancialInnovation (Editorial Board Member), Emerald’s Emerging Market Case Studies (Editorial BoardMember), Journal of Corporate Finance, International Journal of Sustainable Transportation, IEEETransactions on Engineering Management, Technology Forecasting and Social Change, Futures,Telecommunications Policy, Cities, Empirica and Neural Computing and Applications. Dr Pradhan isVisiting Professor at Asian Institute of Technology, Thailand and Visiting Scholar at the University ofPretoria, South Africa. Dr Rudra Pradhan is the corresponding author and can be contacted at:[email protected]
Mak B. Arvin is Full Professor of Economics at Trent University, Peterborough, Ontario, Canada,where he has been a faculty member for the past 28 years. He is the author of 130 papers and reviews inrefereed journals as well as several books on many topics. Arvin is associated with over a dozenprofessional journals. He is the Editor-in-Chief of the International Journal of Happiness andDevelopment. In addition, he is on the editorial board of ten journals and the Associate Editor of threemore. He has been a visiting professor to Boston College and a consultant to IFO Institute for EconomicResearch, Germany.
Cases/Items Dependent variable specifications
Specification 1: VECM with PEG, FDI and BASPEG FDI BAS
Case 1.1: DCP −3.18 [−3.10] 0.46 [0.54] −0.84 [−0.70]Case 1.2: PCO −3.18 [−3.08] 0.46 [0.71] −3.48 [−3.39]Case 1.3: DCF −3.20 [−3.11] 0.51 [0.60] −3.32 [−3.23]Case 1.4: DCB −3.18 [−3.10] 0.47 [0.55] −2.72 [−2.63]Case 1.5: BSD −3.20 [−3.12] −0.49 [−0.57] −2.03 [−1.95]
Specification 2: VECM with PEG, FDI and STMPEG FDI BAS
Case 1.1: SMC −3.25 [−3.12] 0.36 [0.50] −1.78 [−1.64]Case 1.2: SVT −3.10 [−2.97] 0.26 [0.39] −1.44 [−1.30]Case 1.3: STR −3.11 [−2.98] 0.24 [0.37] −0.77 [−0.64]Case 1.4: NLC −3.29 [−3.21] 0.47 [0.56] −2.55 [−2.46]Case 1.5: SMD −3.21 [−3.12] 0.45 [0.54] −1.82 [−1.70]
Specification 3: VECM with PEG, FDI and BOMPEG FDI BAS
Case 1.1: DPR −3.30 [−3.20] 0.49 [0.59] −1.95 [−1.85]Case 1.2: DPU −3.23 [−3.14] 0.47 [0.56] −1.61 [−1.52]Case 1.3: IPR −3.17 [−3.06] 0.67 [0.78] −2.76 [−2.65]Case 1.4: IPU −3.12 [−3.01] 0.57 [0.68] −0.91 [−0.80]Case 1.5: BMD −3.25 [−3.16] 0.75 [0.84] −0.70 [−0.61]Notes: Variables are defined in Table II. LD is level data, and FD is first difference data. First figures relate toAIC statistics, while bracketed ones relate to SBC statistics. The lag lengths are selected on the basis of bothAIC and SBC statistics. Complete estimated results are not reported here due to space constraints and areavailable upon requestSource: Authors’ calculations
Table AIV. Lag specification for VECM estimation
22

Sahar Bahmani is Assistant Professor at the Department of Economics, University of Wisconsin atParkside, Kenosha, Wisconsin, USA. Her area of interest includes ICT infrastructure and technologymanagement. She has published extensively in monetary economics and was named a WisconsinTeaching Fellow for the 2013–2014 academic year.
John H. Hall is Professor in the Department of Financial Management at the University of Pretoriain the Republic of South Africa. He has published numerous articles in scholarly journals (some ofwhich have received best paper awards) and has presented research papers on a number of conferencesboth locally and internationally. He has supervised a number of doctoral and Master’s students.
23