ATTACHMENT E Interactive Map - MTC Communities of...
4
ATTACHMENT E Interactive Map - MTC Communities of Concern 1 The tract is identified as an MTC community of concern, meaning it has either (a) any four or more overlapping population concentrations or (b) concentrations of both low-income and minority populations. An interactive map can be found at: http://arcg.is/1U3dW9R to show individual tract information. Use the COC PBA 2040 layer only. Callout shows tract COC information.
Transcript of ATTACHMENT E Interactive Map - MTC Communities of...

ATTACHMENT E
Interactive Map - MTC Communities of Concern
1
The tract is identified as an MTC community of concern, meaning it has either (a) any four or more overlapping population concentrations or (b) concentrations of both low-income and minority populations. An interactive map can be found at: http://arcg.is/1U3dW9R to show individual tract information. Use the COC PBA 2040 layer only. Callout shows tract COC information.
ATTACHMENT E
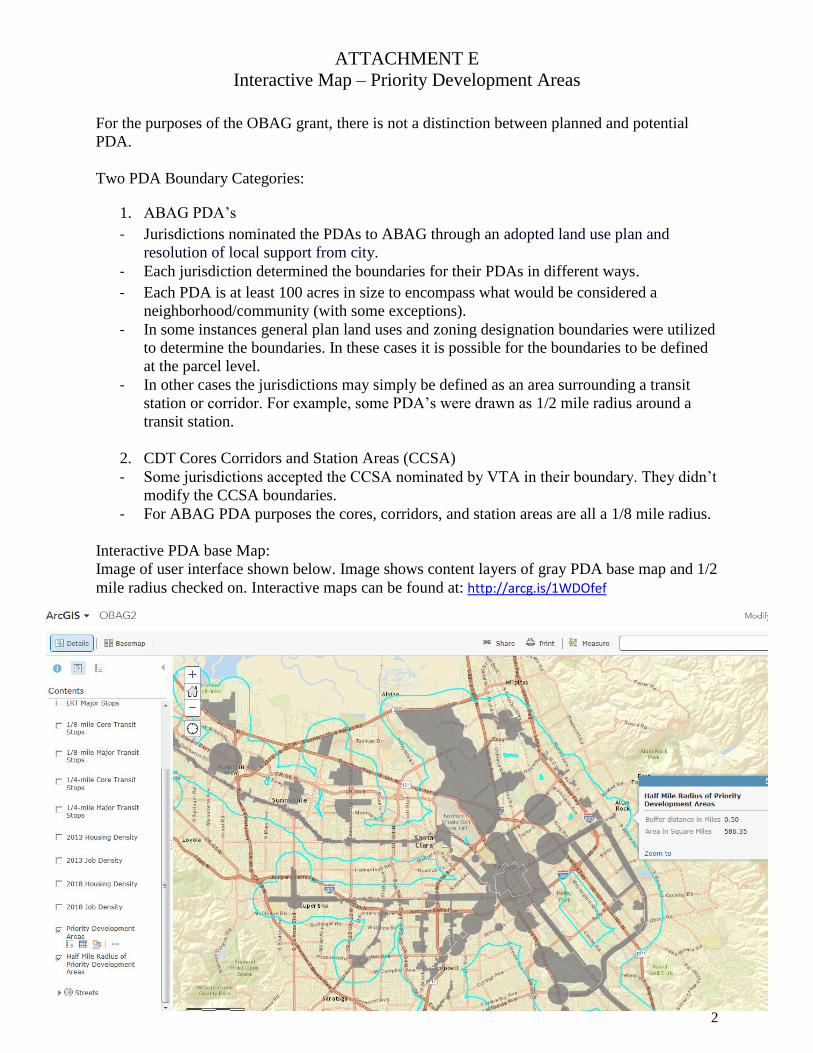
Interactive Map – Priority Development Areas
2
For the purposes of the OBAG grant, there is not a distinction between planned and potential
PDA.
Two PDA Boundary Categories:
1. ABAG PDA’s
- Jurisdictions nominated the PDAs to ABAG through an adopted land use plan and
resolution of local support from city.
- Each jurisdiction determined the boundaries for their PDAs in different ways.
- Each PDA is at least 100 acres in size to encompass what would be considered a
neighborhood/community (with some exceptions).
- In some instances general plan land uses and zoning designation boundaries were utilized
to determine the boundaries. In these cases it is possible for the boundaries to be defined
at the parcel level.
- In other cases the jurisdictions may simply be defined as an area surrounding a transit
station or corridor. For example, some PDA’s were drawn as 1/2 mile radius around a
transit station.
2. CDT Cores Corridors and Station Areas (CCSA)
- Some jurisdictions accepted the CCSA nominated by VTA in their boundary. They didn’t
modify the CCSA boundaries.
- For ABAG PDA purposes the cores, corridors, and station areas are all a 1/8 mile radius.
Interactive PDA base Map:
Image of user interface shown below. Image shows content layers of gray PDA base map and 1/2
mile radius checked on. Interactive maps can be found at: http://arcg.is/1WDOfef

ATTACHMENT E
Interactive Map – Criteria
Link to map: http://arcg.is/1WDOfef
User does not need ArcGIS to access map. There is a Print option to capture and submit map with
application.
Landing page with PDA shown as dark grey background layer
Turn Content layer on/off
Under Details, click on center box (in red) for content boxes to appear.
See next image for content layer options.
3

ATTACHMENT E
Interactive Map – Criteria
Content layer turned on for 2018 Housing Density. Table option under 2018 Housing Density is turned
on.
Additional options
Hover mouse pointer near activated content name (shown in blue) to show additional options: Legend,
Table, transparency, etc.
4