ATTACHMENT C: TESTING AND MONITORING PLAN Facility Information · ... TESTING AND MONITORING PLAN...
30
Testing and Monitoring Plan for ADM CCS#2 – Modified January 2017 Page C1 of 30 Permit Number: IL-115-6A-0001 ATTACHMENT C: TESTING AND MONITORING PLAN Facility Information Facility name: Archer Daniels Midland, CCS#2 Well IL-115-6A-0001 Facility contact: Mr. Steve Merritt, Plant Manager, 4666 Faries Parkway, Decatur, IL (217) 424-5750, [email protected] Well location: Decatur, Macon County, IL; 39º53’09.32835”, -88º53’16.68306” This Testing and Monitoring Plan describes how ADM will monitor the CCS#2 site pursuant to 40 CFR 146.90. In addition to demonstrating that the well is operating as planned, the carbon dioxide plume and pressure front are moving as predicted, and that there is no endangerment to USDWs, the monitoring data will be used to validate and adjust the geological models used to predict the distribution of the CO2 within the storage zone to support AoR reevaluations and a non-endangerment demonstration. Quality Assurance Procedures A quality assurance and surveillance plan (QASP) for all testing and monitoring activities pursuant to 40 CFR 146.90(k) is provided in the Appendix to this Testing and Monitoring Plan. Carbon Dioxide Stream Analysis ADM will analyze the CO2 stream during the operation period to yield data representative of its chemical and physical characteristics and to meet the requirements of 40 CFR 146.90(a). Sampling will take place quarterly, by the following dates each year: 3 months after the date of authorization of injection, 6 months after the date of authorization of injection, 9 months after the date of authorization of injection, and 12 months after the date of authorization of injection. ADM will sample and analyze the CO2 stream as described in Section 6A.1 of the permit application and presented below. Analytical Parameters ADM will analyze the CO2 for the constituents identified in Table 1 using the methods listed. Sampling will take place quarterly, by the following dates each year: 3 months after the date of authorization of injection, 6 months after the date of authorization of injection, 9 months after the date of authorization of injection, and 12 months after the date of authorization of injection.
Transcript of ATTACHMENT C: TESTING AND MONITORING PLAN Facility Information · ... TESTING AND MONITORING PLAN...
Testing and Monitoring Plan for ADM CCS#2 – Modified January 2017 Page C1 of 30
Permit Number: IL-115-6A-0001
ATTACHMENT C: TESTING AND MONITORING PLAN
Facility Information
Facility name: Archer Daniels Midland, CCS#2 Well
IL-115-6A-0001
Facility contact: Mr. Steve Merritt, Plant Manager,
4666 Faries Parkway, Decatur, IL
(217) 424-5750, [email protected]
Well location: Decatur, Macon County, IL;
39º53’09.32835”, -88º53’16.68306”
This Testing and Monitoring Plan describes how ADM will monitor the CCS#2 site pursuant to
40 CFR 146.90. In addition to demonstrating that the well is operating as planned, the carbon
dioxide plume and pressure front are moving as predicted, and that there is no endangerment to
USDWs, the monitoring data will be used to validate and adjust the geological models used to
predict the distribution of the CO2 within the storage zone to support AoR reevaluations and a
non-endangerment demonstration.
Quality Assurance Procedures
A quality assurance and surveillance plan (QASP) for all testing and monitoring activities
pursuant to 40 CFR 146.90(k) is provided in the Appendix to this Testing and Monitoring Plan.
Carbon Dioxide Stream Analysis
ADM will analyze the CO2 stream during the operation period to yield data representative of its
chemical and physical characteristics and to meet the requirements of 40 CFR 146.90(a).
Sampling will take place quarterly, by the following dates each year: 3 months after the date of
authorization of injection, 6 months after the date of authorization of injection, 9 months after the
date of authorization of injection, and 12 months after the date of authorization of injection.
ADM will sample and analyze the CO2 stream as described in Section 6A.1 of the permit
application and presented below.
Analytical Parameters
ADM will analyze the CO2 for the constituents identified in Table 1 using the methods listed.
Sampling will take place quarterly, by the following dates each year: 3 months after the date of
authorization of injection, 6 months after the date of authorization of injection, 9 months after the
date of authorization of injection, and 12 months after the date of authorization of injection.

Testing and Monitoring Plan for ADM CCS#2 – Modified January 2017 Page C2 of 30
Permit Number: IL-115-6A-0001
Table 1. Summary of analytical parameters for CO2 gas stream.
Parameters Analytical Methods (1)
Oxygen ISBT 4.0 (GC/DID)
GC/TCD
Nitrogen ISBT 4.0 GC/DID
GC/TCD
Carbon Monoxide ISBT 5.0 Colorimetric
ISBT 4.0 (GC/DID)
Oxides of Nitrogen ISBT 7.0 Colorimetric
Total Hydrocarbons ISBT 10.0 THA (FID)
Methane ISBT 10.1 GC/FID)
Acetaldehyde ISBT 11.0 (GC/FID)
Sulfur Dioxide ISBT 14.0 (GC/SCD)
Hydrogen Sulfide ISBT 14.0 (GC/SCD)
Ethanol ISBT 11.0 (GC/FID)
CO2 Purity ISBT 2.0 Caustic absorption Zahm-Nagel
ALI method SAM 4.1 subtraction method (GC/DID)
GC/TCD
Note 1: An equivalent method may be employed with the prior approval of the UIC Program Director.
Sampling Methods
CO2 stream sampling will occur in the compressor building after the last stage of compression. A
sampling station will be installed with the ability to purge and collect samples into a container
that will be sealed and sent to the authorized laboratory.
All sample containers will be labeled with durable labels and indelible markings. A unique
sample identification number and sampling date will be recorded on the sample containers.
Laboratory to be Used/Chain of Custody Procedures
Samples will be analyzed by a third party laboratory using standardized procedures for gas
chromatography, mass spectrometry, detector tubes, and photo ionization. The sample chain-of-
custody procedures described in Section B.3 of the QASP will be employed.
Continuous Recording of Injection Pressure, Rate, and Volume; Annulus Pressure
ADM will install and use continuous recording devices to monitor injection pressure, rate, and
volume, the pressure on the annulus between the tubing and the long string casing, and the
annulus fluid volume added.

Testing and Monitoring Plan for ADM CCS#2 – Modified January 2017 Page C3 of 30
Permit Number: IL-115-6A-0001
ADM will perform the activities identified in Table 2 to verify internal mechanical integrity of
the injection well and monitor injection pressure, rate, volume and annular pressure as required
at 40 CFR 146.88, 146.89, and 146.90(b). All monitoring will be continuous for the duration of
the operation period, and at the locations shown in the table. The injection well will have
pressure/temperature gauges at the surface and in the tubing at the packer. In addition there will
be distributed temperature sensing (DTS) fibers in the injection well.
Table 2. Sampling Locations for Continuous Monitoring.
Test Description Location
Annular Pressure Monitoring Surface
Injection Pressure Monitoring Surface
Injection Pressure Monitoring Reservoir - Proximate to packer
Injection Rate Monitoring Surface
Injection Volume Monitoring Surface
Temperature Monitoring Surface
Temperature Monitoring Reservoir - Proximate to packer
Temperature Monitoring Along wellbore to packer using DTS
Above-ground pressure and temperature instruments shall be calibrated over the full operational
range at least annually using ANSI or other recognized standards. In lieu of removing the
injection tubing, downhole gauges will demonstrate accuracy by using a second pressure gauge,
with current certified calibration, that will be lowered into the well to the same depth as the
permanent downhole gauge. Pressure transducers shall have a drift stability of less than 1 psi
over the operational period of the instrument and an accuracy of ± 5 psi. Sampling rates will be
at least once per 5 seconds. Temperature sensors will be accurate to within one degree Celsius.
DTS sampling rate will be once per 10 seconds.
Flow will be monitored with a Coriolis mass flowmeter at the compression facility. The
flowmeter will be calibrated using accepted standards and be accurate to within ± 0.1 percent.
The flowmeter will be calibrated for the entire expected range of flow rates.
Injection Rate and Pressure Monitoring
ADM will monitor injection operations using the distributive process control system, as
described in Section 6A.2.2.3 of the CCS#2 permit application and presented below.
The Surface Facility Equipment & Control System will limit maximum flow to 3,300 MT/day
and/or limit the well head pressure to 2,284 psig, which corresponds to the regulatory
requirement to not exceed 90% of the injection zone’s fracture pressure. All injection operations
will be continuously monitored and controlled by the ADM operations staff using the distributive
process control system. This system will continuously monitor, control, record, and will alarm
and shutdown if specified control parameters exceed their normal operating range.

Testing and Monitoring Plan for ADM CCS#2 – Modified January 2017 Page C4 of 30
Permit Number: IL-115-6A-0001
More specifically, all critical system parameters, e.g., pressure, temperature, and flow rate will
have continuous electronic monitoring with signals transmitted back to a master control system.
ADM supervisors and operators will have the capability to monitor the status of the entire system
from distributive control centers but mainly from two locations: the phase 1 compression control
room (near the CO2 collection and blower facility), and the phase 2 main compression control
room.
Calculation of Injection Volumes
Flow rate is measured on a mass basis (kg/hr). The downhole pressure and temperature data will
be used to perform the injectate density calculation.
The volume of carbon dioxide injected will be calculated from the mass flow rate obtained from
the mass flow meter installed on the injection line. The mass flow rate will be divided by density
and multiplied by injection time to determine the volume injected.
Density will be calculated using the correlation developed by Ouyang (2011). The correlation
uses the temperature and pressure data collected to determine the carbon dioxide density. The
density correlation is given by:
= A0 + A1*P + A2*P2 + A3*P3 + A4*P4
Where is the density, P is the pressure in psi, and A are coefficients determined by the
equations:
Ai = bi0 + bi1*T + bi2*T2 + bi3*T3 + bi4*T4
T is the temperature in degrees Celsius and the b coefficients are presented in Table 3 and Table
4 below.1
Table 3. Injection volume calculation b coefficients, pressure < 3000 psi.
bi0 bi1 bi2 bi3 bi4
i=0 -2.148322085348E+05 1.168116599408E+04 -2.302236659392E+02 1.967428940167E+00 -6.184842764145E-03
i=1 4.757146002428E+02 -2.619250287624E+01 5.215134206837E-01 -4.494511089838E-03 1.423058795982E-05
i=2 -3.713900186613E-01 2.072488876536E-02 -4.169082831078E-04 3.622975674137E-06 -1.155050860329E-08
i=3 1.228907393482E-04 -6.930063746226E-06 1.406317206628E-07 -1.230995287169E-09 3.948417428040E-12
i=4 -1.466408011784E-08 8.338008651366E-10 -1.704242447194E-11 1.500878861807E-13 -4.838826574173E-16
Table 4. Injection volume calculation b coefficients, pressure > 3000 psi.
bi0 bi1 bi2 bi3 bi4
i=0 6.897382693936E+02 2.730479206931E+00 -2.254102364542E-02 -4.651196146917E-03 3.439702234956E-05
i=1 2.213692462613E-01 -6.547268255814E-03 5.982258882656E-05 2.274997412526E-06 -1.888361337660E-08
1 Ouyang 2011, “New Correlations for Predicting the Density and Viscosity of Supercritical Carbon Dioxide Under
Conditions Expected in Carbon Capture and Sequestration Operations,” The Open Petroleum Engineering Journal,
2011, 4, 13-21.

Testing and Monitoring Plan for ADM CCS#2 – Modified January 2017 Page C5 of 30
Permit Number: IL-115-6A-0001
bi0 bi1 bi2 bi3 bi4
i=2 -5.118724890479E-05 2.019697017603E-06 -2.311332097185E-08 -4.079557404679E-10 3.893599641874E-12
i=3 5.517971126745E-09 -2.415814703211E-10 3.121603486524E-12 3.171271084870E-14 -3.560785550401E-16
i=4 -2.184152941323E-13 1.010703706059E-14 -1.406620681883E-16 -8.957731136447E-19 1.215810469539E-20
The final volume basis will be calculated as follows:
Volume basis (m3/hr) = Mass basis (kg/hr) / density (kg/m3)
Continuous Monitoring of Annular Pressure
ADM will use the procedures below to monitor annular pressure, as described in Section 6A.3.1
of the CCS #2 permit application.
The following procedures will be used to limit the potential for any unpermitted fluid movement
into or out of the annulus:
1. The annulus between the tubing and the long string of casing will be filled with brine. The
brine will have a specific gravity of 1.26 and a density of 10.5 lbs/gal. The hydrostatic
gradient is 0.546 psi/ft. The brine will contain a corrosion inhibitor.
2. The surface annulus pressure will be kept at a minimum of 400 pounds per square inch
(psi) during injection.
3. During periods of well shut down, the surface annulus pressure will be kept at a minimum
pressure to maintain a pressure differential of at least 100 psi between the annular fluid
directly above (higher pressure) and below (lower pressure) the injection tubing packer set
at 6,312 ft KB.
4. The pressure within the annular space, over the interval above the packer to the confining
layer, will be greater than the pressure of the injection zone formation at all times.
5. The pressure in the annular space directly above the packer will be maintained at least 100
psi higher than the adjacent tubing pressure during injection.
Figure 1 shows the process instrument diagram for the injection well annulus protection system.
The annular monitoring system consists of a continuous annular pressure gauge, a pressurized
annulus fluid reservoir (annulus head tank), pressure regulators, and tank fluid level indication.
The annulus system will maintain annulus pressure by controlling the pressure on the annulus
head tank using either compressed nitrogen or CO2 .
The annulus pressure will be maintained between approximately 425-525 psi and monitored by
the ADM control system gauges. The annulus head tank pressure will be controlled by pressure
regulators–one set of regulators to maintain pressure above 400 psi by adding compressed
nitrogen or CO2 and the other to relieve pressure above 525 psi by venting gas off the annulus
head tank.
Any changes to the composition of annular fluid will be reported in the next report submitted to
the permitting agency.

Testing and Monitoring Plan for ADM CCS#2 – Modified January 2017 Page C6 of 30
Permit Number: IL-115-6A-0001
Figure 1. The annular monitoring system general layout.
If system communication is lost for greater than 30 minutes, project personnel will perform field
monitoring of manual gauges every four hours or twice per shift for both wellhead surface
pressure and annulus pressure, and record hard copies of the data until communication is
restored.
Average annular pressure and annulus tank fluid level will be recorded daily. The volume of
fluid added or removed from the system will be recorded.
Casing-Tubing Pressure Monitoring
ADM will monitor the casing-tubing pressure as described in Appendix G of the CCS#2 permit
application and presented below.
During the injection timeframe of the project, the casing-tubing pressure will be monitored and
recorded in real time. Surface pressure of the casing-tubing annulus is anticipated to be from 425
to 525 psi. As detailed in the Emergency and Remedial Response Plan (Attachment F to this
permit), significant changes in the casing-tubing annular pressure attributed to well mechanical
integrity will be investigated.
Collection and recording of monitoring data will occur at the frequencies described in Table 5.

Testing and Monitoring Plan for ADM CCS#2 – Modified January 2017 Page C7 of 30
Permit Number: IL-115-6A-0001
Table 5. Sampling and Recording Frequencies for Continuous Monitoring.
Well Condition Minimum sampling
frequency: once every (1)(4)
Minimum recording
frequency: once every (2)(4)
For continuous monitoring of the injection well when
operating:
5 seconds 5 minutes (3)
For the injection well when shut-in: 4 hours 4 hours
Note 1: Sampling frequency refers to how often the monitoring device obtains data from the well for a particular
parameter. For example, a recording device might sample a pressure transducer monitoring injection pressure once
every two seconds and save this value in memory.
Note 2: Recording frequency refers to how often the sampled information gets recorded to digital format (such as a
computer hard drive). Following the same example above, the data from the injection pressure transducer might be
recorded to a hard drive once every minute.
Note 3: This can be an average of the sampled readings over the previous 5-minute recording interval, or the
maximum (or minimum, as appropriate) value identified over that recording interval.
Note 4: DTS sampling frequency is once every 10 seconds and recorded on an hourly basis.
Corrosion Monitoring
To meet the requirements of 40 CFR 146.90(c), ADM will monitor well materials during the
operation period for loss of mass, thickness, cracking, pitting, and other signs of corrosion to
ensure that the well components meet the minimum standards for material strength and
performance.
This monitoring will occur quarterly, by the following dates each year: 3 months after the date of
authorization of injection, 6 months after the date of authorization of injection, 9 months after the
date of authorization of injection, and 12 months after the date of authorization of injection.
ADM will monitor corrosion using the corrosion coupon method and collect samples according
to the description below and in Section 6A.3.5 of the CCS#2 permit application.
Sample Description
Samples of material used in the construction of the compression equipment, pipeline and
injection well which come into contact with the CO2 stream will be included in the corrosion
monitoring program either by using actual material and/or conventional corrosion coupons. The
samples consist of those items listed in Table 6 below. Each coupon will be weighed, measured,
and photographed prior to initial exposure (see “Sample Handling and Monitoring” below).
Table 6. List of Equipment Coupon with Material of Construction.
Equipment Coupon Material of Construction
Pipeline CS A106B
Long String Casing (Surface - 4,800’) Carbon Steel
Long String Casing (4,800’ – TD) Chrome Alloy
Injection Tubing Chrome alloy
Wellhead Chrome alloy

Testing and Monitoring Plan for ADM CCS#2 – Modified January 2017 Page C8 of 30
Permit Number: IL-115-6A-0001
Equipment Coupon Material of Construction
Packers 1 Chrome alloy
Sample Exposure
Each sample will be attached to an individual holder (Figure 2a) and then inserted in a flow-
through pipe arrangement (Figure 2b). The corrosion monitoring system will be located
downstream of all process compression/dehydration/pumping equipment (i.e., at the beginning of
the pipeline to the wellhead). To accomplish this, a parallel stream of high pressure CO2 will be
routed from the pipeline through the corrosion monitoring system and then back into a lower
pressure point upstream in the compression system. This loop will operate any time injection is
occurring. No other equipment will act on the CO2 past this point; therefore this location will
provide representative exposure of the samples to the CO2 composition, temperature, and
pressures that will be seen at the wellhead and injection tubing. The holders and location of the
system will be included in the pipeline design and will allow for continuation of injection during
sample removal.
Figure 2a. Coupon Holder. Figure 2b. Flow-through Pipe Arrangement.
Sample Handling and Monitoring
The coupons will be handled and assessed for corrosion using the American Society for Testing
and Materials (ASTM) G1-03, Standard Practice for Preparing, Cleaning, and Evaluating
Corrosion Test Specimens (ASTM 2011). The coupons will photographed, visually inspected
with a minimum of 10x power, dimensionally measured (to within 0.0001 inch), and weighed (to
within 0.0001 gm).
Groundwater Quality Monitoring
ADM will monitor groundwater quality and geochemical changes above the confining zone
during the operation period to meet the requirements of 40 CFR 146.90(d).
The groundwater monitoring plan focuses on the following zones:
Quaternary and/or Pennsylvanian strata – the source of local drinking water.

Testing and Monitoring Plan for ADM CCS#2 – Modified January 2017 Page C9 of 30
Permit Number: IL-115-6A-0001
The St. Peter Formation – the lowermost USDW.
The Ironton-Galesville Sandstone – the zone above the Eau Claire confining zone.
All of the monitoring locations are located on ADM property. Figure 3 shows the project area
and the location of existing shallow groundwater monitoring wells and planned deep monitoring
wells. Table 7 and Table 8 show the planned monitoring methods, locations, and frequencies for
groundwater quality monitoring above the confining zone. ADM will also monitor in the Mt.
Simon Sandstone (the injection zone). Monitoring in this layer will be to track the carbon dioxide
plume and is described under “Carbon Dioxide Plume and Pressure Front Tracking” below.
Figure 3. Location of shallow groundwater monitoring wells and deep monitoring wells.
Testing and Monitoring Plan for ADM CCS#2 – Modified January 2017 Page C10 of 30
Permit Number: IL-115-6A-0001
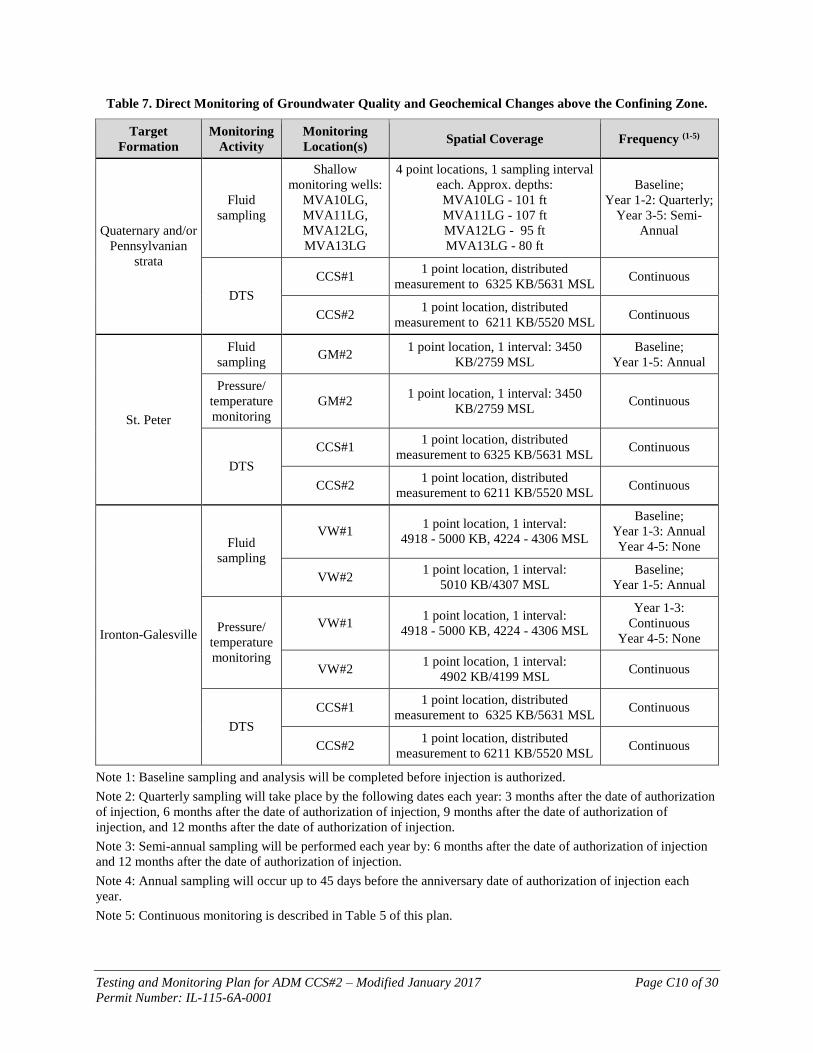
Table 7. Direct Monitoring of Groundwater Quality and Geochemical Changes above the Confining Zone.
Target
Formation
Monitoring
Activity
Monitoring
Location(s) Spatial Coverage Frequency (1-5)
Quaternary and/or
Pennsylvanian
strata
Fluid
sampling
Shallow
monitoring wells:
MVA10LG,
MVA11LG,
MVA12LG,
MVA13LG
4 point locations, 1 sampling interval
each. Approx. depths:
MVA10LG - 101 ft
MVA11LG - 107 ft
MVA12LG - 95 ft
MVA13LG - 80 ft
Baseline;
Year 1-2: Quarterly;
Year 3-5: Semi-
Annual
DTS
CCS#1 1 point location, distributed
measurement to 6325 KB/5631 MSL Continuous
CCS#2 1 point location, distributed
measurement to 6211 KB/5520 MSL Continuous
St. Peter
Fluid
sampling GM#2
1 point location, 1 interval: 3450
KB/2759 MSL
Baseline;
Year 1-5: Annual
Pressure/
temperature
monitoring
GM#2 1 point location, 1 interval: 3450
KB/2759 MSL Continuous
DTS
CCS#1 1 point location, distributed
measurement to 6325 KB/5631 MSL Continuous
CCS#2 1 point location, distributed
measurement to 6211 KB/5520 MSL Continuous
Ironton-Galesville
Fluid
sampling
VW#1 1 point location, 1 interval:
4918 - 5000 KB, 4224 - 4306 MSL
Baseline;
Year 1-3: Annual
Year 4-5: None
VW#2 1 point location, 1 interval:
5010 KB/4307 MSL
Baseline;
Year 1-5: Annual
Pressure/
temperature
monitoring
VW#1 1 point location, 1 interval:
4918 - 5000 KB, 4224 - 4306 MSL
Year 1-3:
Continuous
Year 4-5: None
VW#2 1 point location, 1 interval:
4902 KB/4199 MSL Continuous
DTS
CCS#1 1 point location, distributed
measurement to 6325 KB/5631 MSL Continuous
CCS#2 1 point location, distributed
measurement to 6211 KB/5520 MSL Continuous
Note 1: Baseline sampling and analysis will be completed before injection is authorized.
Note 2: Quarterly sampling will take place by the following dates each year: 3 months after the date of authorization
of injection, 6 months after the date of authorization of injection, 9 months after the date of authorization of
injection, and 12 months after the date of authorization of injection.
Note 3: Semi-annual sampling will be performed each year by: 6 months after the date of authorization of injection
and 12 months after the date of authorization of injection.
Note 4: Annual sampling will occur up to 45 days before the anniversary date of authorization of injection each
year.
Note 5: Continuous monitoring is described in Table 5 of this plan.

Testing and Monitoring Plan for ADM CCS#2 – Modified January 2017 Page C11 of 30
Permit Number: IL-115-6A-0001
Table 8. Indirect Monitoring of Groundwater Quality and Geochemical Changes above the Confining Zone
Target
Formation
Monitoring
Activity
Monitoring
Location(s) Spatial Coverage Frequency (1,2)
Quaternary
and/or
Pennsylvanian
strata
Pulse Neutron
Logging/ Reservoir
Saturation
Tool (RST)
logs
VW#1 1 point location (12 inches outside well
bore) & continuous to full well depth
Baseline,
Year 2, Year 4
VW#2
1 point location (6-12 inches outside
well bore) & continuous to full well
depth
Baseline,
Year 2, Year 4
CCS#1
1 point location (6-12 inches outside
well bore) & continuous to full well
depth
Baseline,
Year 2, Year 4
CCS#2
1 point location (6-12 inches outside
well bore) & continuous to full well
depth
Baseline,
Year 2, Year 4
St. Peter Pulse Neutron
Logging/RST
VW#1 1 point location (12 inches outside well
bore) & continuous to full well depth
Baseline,
Year 2, Year 4
VW#2
1 point location (6-12 inches outside
well bore) & continuous to full well
depth
Baseline,
Year 2, Year 4
CCS#1
1 point location (6-12 inches outside
well bore) & continuous to full well
depth
Baseline,
Year 2, Year 4
CCS#2
1 point location (6-12 inches outside
well bore) & continuous to full well
depth
Baseline,
Year 2, Year 4
Ironton-
Galesville
Pulse Neutron
Logging/RST
VW#1 1 point location (12 inches outside well
bore) & continuous to full well depth
Baseline,
Year 2, Year 4
VW#2
1 point location (6-12 inches outside
well bore) & continuous to full well
depth
Baseline,
Year 2, Year 4
CCS#1
1 point location (6-12 inches outside
well bore) & continuous to full well
depth
Baseline,
Year 2, Year 4
CCS#2
1 point location (6-12 inches outside
well bore) & continuous to full well
depth
Baseline,
Year 2, Year 4
Note 1: Baseline sampling and analysis will be completed before injection is authorized.
Note 2: Logging will take place up to 45 days before the anniversary date of authorization of injection each year or
will be alternatively scheduled with the prior approval of the UIC Program Director.

Testing and Monitoring Plan for ADM CCS#2 – Modified January 2017 Page C12 of 30
Permit Number: IL-115-6A-0001
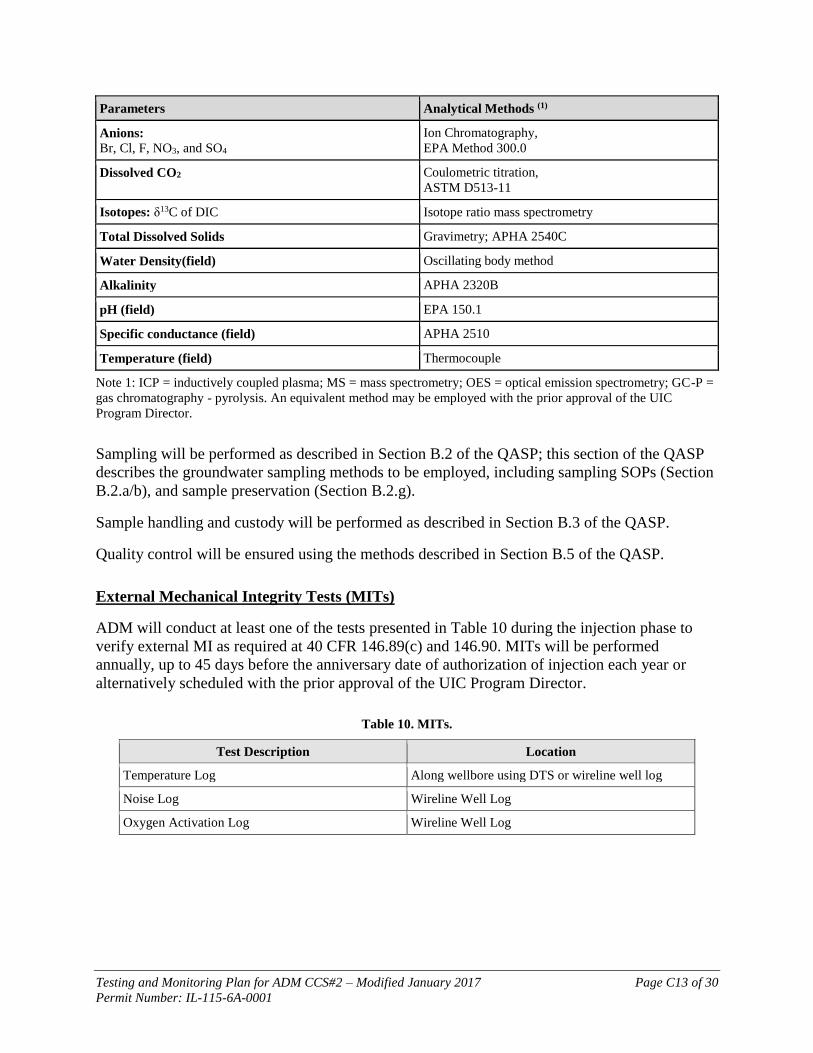
Table 9 identifies the parameters to be monitored and the analytical methods ADM will employ.
Table 9. Summary of analytical and field parameters for groundwater samples.
Parameters Analytical Methods (1)
Quaternary/Pennsylvanian
Cations: Al, Ba, Mn, As, Cd, Cr, Cu, Pb, Sb Se, and Tl
ICP-MS,
EPA Method 6020
Cations: Ca, Fe, K, Mg, Na, and Si
ICP-OES,
EPA Method 6010B
Anions: Br, Cl, F, NO3, and SO4
Ion Chromatography,
EPA Method 300.0
Dissolved CO2 Coulometric titration,
ASTM D513-11
Total Dissolved Solids Gravimetry; APHA 2540C
Alkalinity APHA 2320B
pH (field) EPA 150.1
Specific conductance (field) APHA 2510
Temperature (field) Thermocouple
St. Peter
Cations: Al, Ba, Mn, As, Cd, Cr, Cu, Pb, Sb Se, and Tl
ICP-MS,
EPA Method 6020
Cations: Ca, Fe, K, Mg, Na, and Si
ICP-OES,
EPA Method 6010B
Anions: Br, Cl, F, NO3, and SO4
Ion Chromatography,
EPA Method 300.0
Dissolved CO2 Coulometric titration,
ASTM D513-11
Isotopes: δ13C of DIC Isotope ratio mass spectrometry
Total Dissolved Solids Gravimetry; APHA 2540C
Water Density (field) Oscillating body method
Alkalinity APHA 2320B
pH (field) EPA 150.1
Specific conductance (field) APHA 2510
Temperature (field) Thermocouple
Ironton-Galesville
Cations: Al, Ba, Mn, As, Cd, Cr, Cu, Pb, Sb Se, and Tl
ICP-MS,
EPA Method 6020
Cations: Ca, Fe, K, Mg, Na, and Si
ICP-OES,
EPA Method 6010B
Testing and Monitoring Plan for ADM CCS#2 – Modified January 2017 Page C13 of 30
Permit Number: IL-115-6A-0001
Parameters Analytical Methods (1)
Anions: Br, Cl, F, NO3, and SO4
Ion Chromatography,
EPA Method 300.0
Dissolved CO2 Coulometric titration,
ASTM D513-11
Isotopes: δ13C of DIC Isotope ratio mass spectrometry
Total Dissolved Solids Gravimetry; APHA 2540C
Water Density(field) Oscillating body method
Alkalinity APHA 2320B
pH (field) EPA 150.1
Specific conductance (field) APHA 2510
Temperature (field) Thermocouple
Note 1: ICP = inductively coupled plasma; MS = mass spectrometry; OES = optical emission spectrometry; GC-P =
gas chromatography - pyrolysis. An equivalent method may be employed with the prior approval of the UIC
Program Director.
Sampling will be performed as described in Section B.2 of the QASP; this section of the QASP
describes the groundwater sampling methods to be employed, including sampling SOPs (Section
B.2.a/b), and sample preservation (Section B.2.g).
Sample handling and custody will be performed as described in Section B.3 of the QASP.
Quality control will be ensured using the methods described in Section B.5 of the QASP.
External Mechanical Integrity Tests (MITs)
ADM will conduct at least one of the tests presented in Table 10 during the injection phase to
verify external MI as required at 40 CFR 146.89(c) and 146.90. MITs will be performed
annually, up to 45 days before the anniversary date of authorization of injection each year or
alternatively scheduled with the prior approval of the UIC Program Director.
Table 10. MITs.
Test Description Location
Temperature Log Along wellbore using DTS or wireline well log
Noise Log Wireline Well Log
Oxygen Activation Log Wireline Well Log

Testing and Monitoring Plan for ADM CCS#2 – Modified January 2017 Page C14 of 30
Permit Number: IL-115-6A-0001
Description of MIT(s) That May be Employed
Temperature Logging Using Wireline
To ensure the mechanical integrity of the casing of the injection well, temperature data will be
recorded across the wellbore from surface down to primary caprock. Bottom hole pressure data
near the packer will also be provided. The following procedures, as described in Appendix G of
the CCS #2 permit application, will be employed for temperature logging:
The well should be in a state of injection for at least 6 hours prior to commencing operations in
order to cool injection zones.
1. Move in and rig up an electrical logging unit with lubricator.
2. Run a temperature survey from the Base of the Maquoketa Formation (or higher) to the
deepest point reachable in the Mt. Simon while injecting at a rate that allows for safe
operations.2
3. Stop injection, pull tool back to shallow depth, wait 1 hour.
4. Run a temperature survey over the same interval as step 2.
5. Pull tool back to shallow depth, wait 2 hours.
6. Run a temperature survey over the same interval as step 2.
7. Pull tool back to shallow depth, wait 2 hours.
8. Run a temperature survey over the same interval as step 2.
9. Evaluate data to determine if additional passes are needed for interpretation. Should CO2
migration be interpreted in the top most section of the log, additional logging runs over a
higher interval will be required to find the top of migration.
10. If additional passes are needed, repeat temperature surveys every 2 hours until 12 hours,
over the same interval as step 2.
11. Rig down the logging equipment.
12. Data interpretation involves comparing the time lapse well temperature profiles and
looking for temperature anomalies that may indicate a failure of well integrity; i.e. tubing
leak or movement of fluid behind the casing. As the well cools down the temperature
profile along the length of the tubing string is compared to the baseline. Any unplanned
fluid movement into the annulus or outside the casing creates a temperature anomaly
when compared to the baseline cooling profile.
Temperature Logging Using DTS Fiber Optic Line
CCS#2 is equipped with a DTS fiber optic temperature monitoring system that is capable of
monitoring the injection well’s annular temperature along the length of the tubing string. The
DTS line is used for real time temperature monitoring and, like a conventional temperature log,
2 Should operational constraints or safety concerns not allow for a logging pass while injecting, an acceptable,
alternate plan is to stop injecting immediately prior to the first logging pass.

Testing and Monitoring Plan for ADM CCS#2 – Modified January 2017 Page C15 of 30
Permit Number: IL-115-6A-0001
can be used for early detection of temperature changes that may indicate a loss of well
mechanical integrity. The procedure for using the DTS for well mechanical integrity is as
follows:
1. After the well is completed and prior to injection, a baseline temperature profile will be
established. This profile represents the natural temperature gradient for each stratigraphic
zone.
2. During injection operation, record the temperature profile for 6 hours prior to shutting in
well.
3. Stop injection and record temperature profile for 6 hours.
4. Evaluate data to determine if additional cooling time is needed for interpretation.
5. Start injection and record temperature profile for 6 hours.
6. Data interpretation involves comparing the time lapse well temperature profiles and
looking for temperature anomalies that may indicate a failure of well integrity; i.e. tubing
leak or movement of fluid behind the casing. The DTS system monitors and records the
well’s temperature profiles at a pre-set frequency in real time. As the well cools down
the temperature profile along the length of the tubing string is compared to the baseline.
Any unplanned fluid movement into the annulus or outside the casing creates a
temperature anomaly when compared to the baseline cooling profile. This data can be
continuously monitored to provide real time MIT surveillance making this technology
superior to wireline temperature logging.
Noise Logging
To ensure the mechanical integrity of the casing of the injection well, logging data will be
recorded across the wellbore from surface down to primary caprock. Bottom hole pressure data
near the packer will also be provided. Noise logging will be carried out while injection is
occurring. If ambient noise is greater than 10 mv, injection will be halted. The following
procedures will be employed:
1. Move in and rig up an electrical logging unit with lubricator.
2. Run a noise survey from the Base of the Maquoketa Formation (or higher) to the deepest
point reachable in the Mt. Simon while injecting at a rate that allows for safe operations.
3. Make noise measurements at intervals of 100 feet to create a log on a coarse grid.
4. If any anomalies are evident on the coarse log, construct a finer grid by making noise
measurements at intervals of 20 feet within the coarse intervals containing high noise
levels.
5. Make noise measurements at intervals of 10 feet through the first 50 feet above the
injection interval and at intervals of 20 feet within the 100-foot intervals containing:
a. The base of the lowermost bleed-off zone above the injection interval and
b. The base of the lowermost USDW (St. Peter).
6. Additional measurements may be made to pinpoint depths at which noise is produced.

Testing and Monitoring Plan for ADM CCS#2 – Modified January 2017 Page C16 of 30
Permit Number: IL-115-6A-0001
7. Use a vertical scale of 1 or 2 inches per 100 feet.
8. Rig down the logging equipment.
9. Interpret the data as follows: Determine the base noise level in the well (dead well level).
Identify departures from this level. An increase in noise near the surface due to
equipment operating at the surface is to be expected in many situations. Determine the
extent of any movement; flow into or between USDWs indicates a lack of mechanical
integrity; flow from the injection zone into or above the confining zone indicates a failure
of containment.
Oxygen Activation (OA) Logging
To ensure the mechanical integrity of the casing of the injection well, logging data will be
recorded across the wellbore from surface down to primary caprock. Bottom hole pressure data
near the packer will also be provided. OA logging will be carried out while injection is
occurring. The following procedures will be employed:
1. Move in and rig up an electrical logging unit with lubricator.
2. Conduct a baseline Gamma Ray Log and casing collar locator log from the top of the
injection zone to the surface prior to taking the stationary readings with the OA tool.3
3. The OA log shall be used only for casing diameters of greater than 1-11/16 inches and
less than 13- 3/8 inches.
4. All stationary readings should be taken with the well injecting fluid at the normal rate
with minimal rate and pressure fluctuations.
5. Prior to taking the stationary readings, the OA tool must be properly calibrated in a “no
vertical flow behind the casing” section of the well to ensure accurate, repeatable tool
response and for measuring background counts.
6. Take, at a minimum, a 15 minute stationary reading adjacent to the confining interval
located immediately above the injection interval. This must be at least 10 feet above the
injection interval so that turbulence does not affect the readings.
7. Take, at a minimum, a 15 minute stationary reading at a location approximately midway
between the base of the lowermost USDW and the confining interval located immediately
above the injection interval.
8. Take, at a minimum, a 15 minute stationary reading adjacent to the top of the confining
zone.
9. Take, at a minimum, a 15 minute stationary reading at the base of the lowermost USDW.
10. If flow is indicated by the OA log at a location, move uphole or downhole as necessary at
no more than 50 foot intervals and take stationary readings to determine the area of fluid
migration.
3 Gamma Ray Log is necessary to evaluate the contribution of naturally occurring background radiation to the total
gamma radiation count detected by the OA tool. There are different types of natural radiation emitted from various
geologic formations or zones and the natural radiation may change over time.
Testing and Monitoring Plan for ADM CCS#2 – Modified January 2017 Page C17 of 30
Permit Number: IL-115-6A-0001
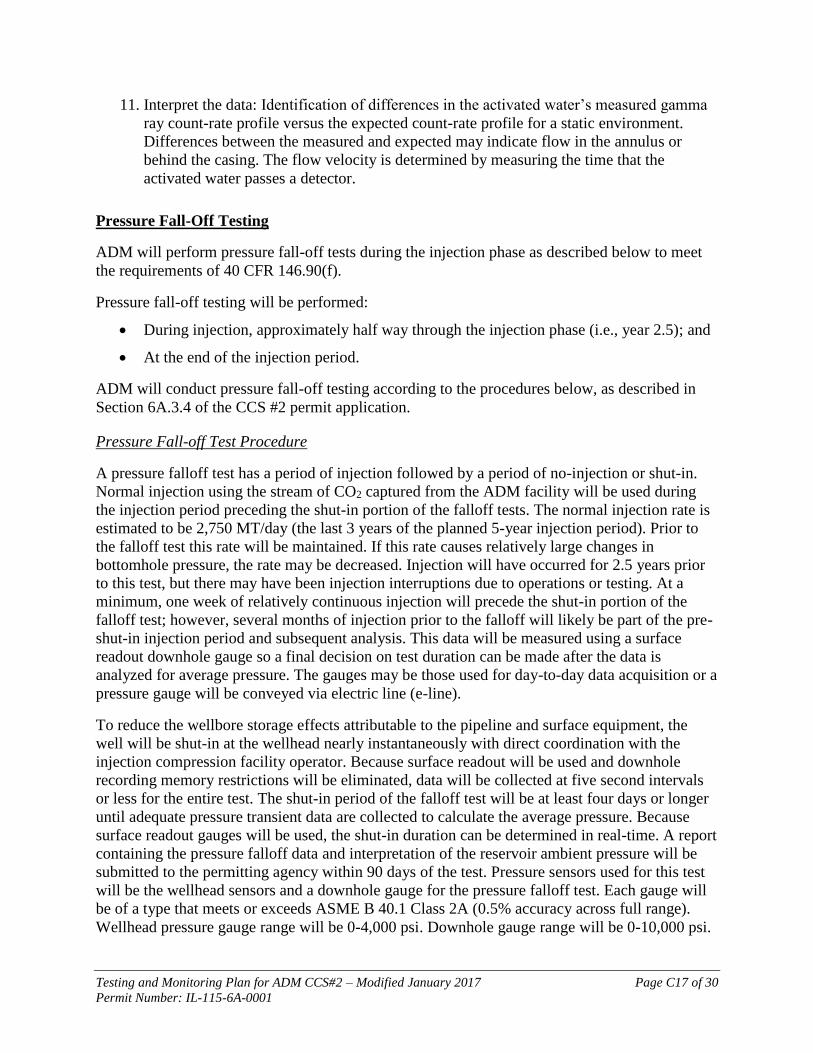
11. Interpret the data: Identification of differences in the activated water’s measured gamma
ray count-rate profile versus the expected count-rate profile for a static environment.
Differences between the measured and expected may indicate flow in the annulus or
behind the casing. The flow velocity is determined by measuring the time that the
activated water passes a detector.
Pressure Fall-Off Testing
ADM will perform pressure fall-off tests during the injection phase as described below to meet
the requirements of 40 CFR 146.90(f).
Pressure fall-off testing will be performed:
During injection, approximately half way through the injection phase (i.e., year 2.5); and
At the end of the injection period.
ADM will conduct pressure fall-off testing according to the procedures below, as described in
Section 6A.3.4 of the CCS #2 permit application.
Pressure Fall-off Test Procedure
A pressure falloff test has a period of injection followed by a period of no-injection or shut-in.
Normal injection using the stream of CO2 captured from the ADM facility will be used during
the injection period preceding the shut-in portion of the falloff tests. The normal injection rate is
estimated to be 2,750 MT/day (the last 3 years of the planned 5-year injection period). Prior to
the falloff test this rate will be maintained. If this rate causes relatively large changes in
bottomhole pressure, the rate may be decreased. Injection will have occurred for 2.5 years prior
to this test, but there may have been injection interruptions due to operations or testing. At a
minimum, one week of relatively continuous injection will precede the shut-in portion of the
falloff test; however, several months of injection prior to the falloff will likely be part of the pre-
shut-in injection period and subsequent analysis. This data will be measured using a surface
readout downhole gauge so a final decision on test duration can be made after the data is
analyzed for average pressure. The gauges may be those used for day-to-day data acquisition or a
pressure gauge will be conveyed via electric line (e-line).
To reduce the wellbore storage effects attributable to the pipeline and surface equipment, the
well will be shut-in at the wellhead nearly instantaneously with direct coordination with the
injection compression facility operator. Because surface readout will be used and downhole
recording memory restrictions will be eliminated, data will be collected at five second intervals
or less for the entire test. The shut-in period of the falloff test will be at least four days or longer
until adequate pressure transient data are collected to calculate the average pressure. Because
surface readout gauges will be used, the shut-in duration can be determined in real-time. A report
containing the pressure falloff data and interpretation of the reservoir ambient pressure will be
submitted to the permitting agency within 90 days of the test. Pressure sensors used for this test
will be the wellhead sensors and a downhole gauge for the pressure falloff test. Each gauge will
be of a type that meets or exceeds ASME B 40.1 Class 2A (0.5% accuracy across full range).
Wellhead pressure gauge range will be 0-4,000 psi. Downhole gauge range will be 0-10,000 psi.

Testing and Monitoring Plan for ADM CCS#2 – Modified January 2017 Page C18 of 30
Permit Number: IL-115-6A-0001
Carbon Dioxide Plume and Pressure Front Tracking
ADM will employ direct and indirect methods to track the extent of the carbon dioxide plume
and the presence or absence of elevated pressure during the operation period to meet the
requirements of 40 CFR 146.90(g).
Table 11 and Table 12 present the direct and indirect methods that ADM will use to monitor the
position of the CO2 plume and pressure front, including the activities, locations, and frequencies
ADM will employ.
ADM will conduct fluid sampling and analysis to detect changes in groundwater in order to directly monitor the carbon dioxide plume. The parameters to be analyzed as part of fluid
sampling in the Mt. Simon (i.e., the injection zone) and analytical methods are presented in
Figure 10. Predicted pressure profile at the top of the CCS#2 injection interval,
simulated for 50 years after the commencement of injection.

Testing and Monitoring Plan for ADM CCS#2 – Modified January 2017 Page C19 of 30
Permit Number: IL-115-6A-0001
Figure 11. Predicted CCS#2 bottom-hole pressure profile,
simulated for 50 years after the commencement of injection.
Figure 12. Predicted CO2 phase distribution, simulated for 50 years after the commencement of injection.

Testing and Monitoring Plan for ADM CCS#2 – Modified January 2017 Page C20 of 30
Permit Number: IL-115-6A-0001
. ADM will deploy pressure/temperature monitors and DTS to directly monitor the position of
the pressure front.
Indirect plume monitoring will be employed using pulsed neutron capture/RST logs to monitor
CO2 saturation. Time-lapse 3D vertical seismic profiles (VSPs) will be used to image the
developing CO2 plume for indirect plume monitoring. Passive seismic monitoring combination
of borehole and surface seismic stations to detect local events over M 1.0 within the AoR will
also be performed. Quality assurance procedures for seismic monitoring methods are presented
in Section B.9 of the QASP.
Table 11. Plume Monitoring Activities.
Target
Formation
Monitoring
Activity
Monitoring
Location(s) Spatial Coverage Frequency(1-4)
Direct Plume Monitoring
Mt. Simon Fluid sampling
VW#1 1 point location, 1 interval:
6837 - 6632 KB, 6148 - 5938 MSL
Baseline;
Year 1-3: Annual
VW#2
1 point location, 3 intervals:
6710, 6500, 5810 KB;
6007, 5797, 5107 MSL
Annual
Indirect Plume Monitoring
Mt. Simon Pulse Neutron
Logging/RST
VW#1 1 point location (12" outside wellbore)
& continuous to full well depth
Baseline,
Year 2, Year 4
VW#2 1 point location (12" outside wellbore)
& continuous to full well depth
Baseline,
Year 2, Year 4
CCS#1 1 point location (12" outside wellbore)
& continuous to full well depth
Baseline,
Year 2, Year 4
CCS#2 1 point location (12" outside wellbore)
& continuous to full well depth
Baseline,
Year 2, Year 4
Mt Simon
Time-lapse
VSP survey GM#1 Fold Image Coverage ~ 30 acres In 2013, 2014, 2015
3D surface
seismic survey
Full coverage
focusing on the
northern extent
of plume area
Fold Image Coverage ~ 2,000 acres Baseline,
Year 2 (2019)
Note 1: Baseline monitoring will be completed before injection is authorized.
Note 2: Annual monitoring will be performed up to 45 days before the anniversary date of authorization of injection
each year or alternatively scheduled with the prior approval of the UIC Program Director.
Note 3: Logging surveys will take place up to 45 days before the anniversary date of authorization of injection each
year or alternatively scheduled with the prior approval of the UIC Program Director.
Note 4: Seismic surveys will be performed in the 4th quarter before or the 1st quarter of the calendar year shown or
alternatively scheduled with the prior approval of the UIC Program Director.

Testing and Monitoring Plan for ADM CCS#2 – Modified January 2017 Page C21 of 30
Permit Number: IL-115-6A-0001
Table 12. Pressure-Front Monitoring Activities
Target
Formation
Monitoring
Activity
Monitoring
Location(s) Spatial Coverage Frequency
Direct Pressure-Front Monitoring
Mt. Simon
Pressure/
temperature
monitoring
VW#1 1 point location, 1 interval:
6945 - 5654 KB, 6251 - 4960 MSL
Year 1-3: Continuous;
Year 4-5: None
VW#2
1 point location, 4 intervals:
7041, 6681, 6524, 5848 KB;
6338, 5978, 5821, 5145 MSL
Continuous
CCS#1
1 point location, 1 interval: PT @
6325 KB/5631 MSL; Perfs @ 6982 -
7050 KB, 6288 - 6356 MSL
Continuous
CCS#2
1 point location, 1 interval: PT @
6270 KB/5579 MSL; Perfs @ 6630 -
6825 KB, 5939 - 6134 MSL
Continuous
DTS
CCS#1 1 point location, distributed
measurement to 6325 KB/5631 MSL. Continuous
CCS#2 1 point location, distributed
measurement to 6211 KB/5520 MSL. Continuous
Other Plume/Pressure-Front Monitoring
Multiple Passive
seismic
A combination
of borehole and
surface seismic
stations located
within the AoR.
The passive seismic monitoring
system has the ability to detect seismic
events over M1.0 within the AoR.
Continuous
Table 13. Summary of analytical and field parameters for fluid sampling in the Mt. Simon.
Parameters Analytical Methods (1)
Cations:
Al, Ba, Mn, As, Cd, Cr, Cu, Pb, Sb Se, and Tl
ICP-MS,
EPA Method 6020
Cations:
Ca, Fe, K, Mg, Na, and Si
ICP-OES,
EPA Method 6010B
Anions:
Br, Cl, F, NO3, and SO4
Ion Chromatography,
EPA Method 300.0
Dissolved CO2 Coulometric titration,
ASTM D513-11
Isotopes: δ13C of DIC Isotope ratio mass spectrometry
Total Dissolved Solids Gravimetry; APHA 2540C
Water Density (field) Oscillating body method
Alkalinity APHA 2320B
pH (field) EPA 150.1
Testing and Monitoring Plan for ADM CCS#2 – Modified January 2017 Page C22 of 30
Permit Number: IL-115-6A-0001
Parameters Analytical Methods (1)
Specific conductance (field) APHA 2510
Temperature (field) Thermocouple
Note 1: ICP = inductively coupled plasma; MS = mass spectrometry; OES = optical emission spectrometry; GC-P =
gas chromatography - pyrolysis. An equivalent method may be employed with the prior approval of the UIC
Program Director.
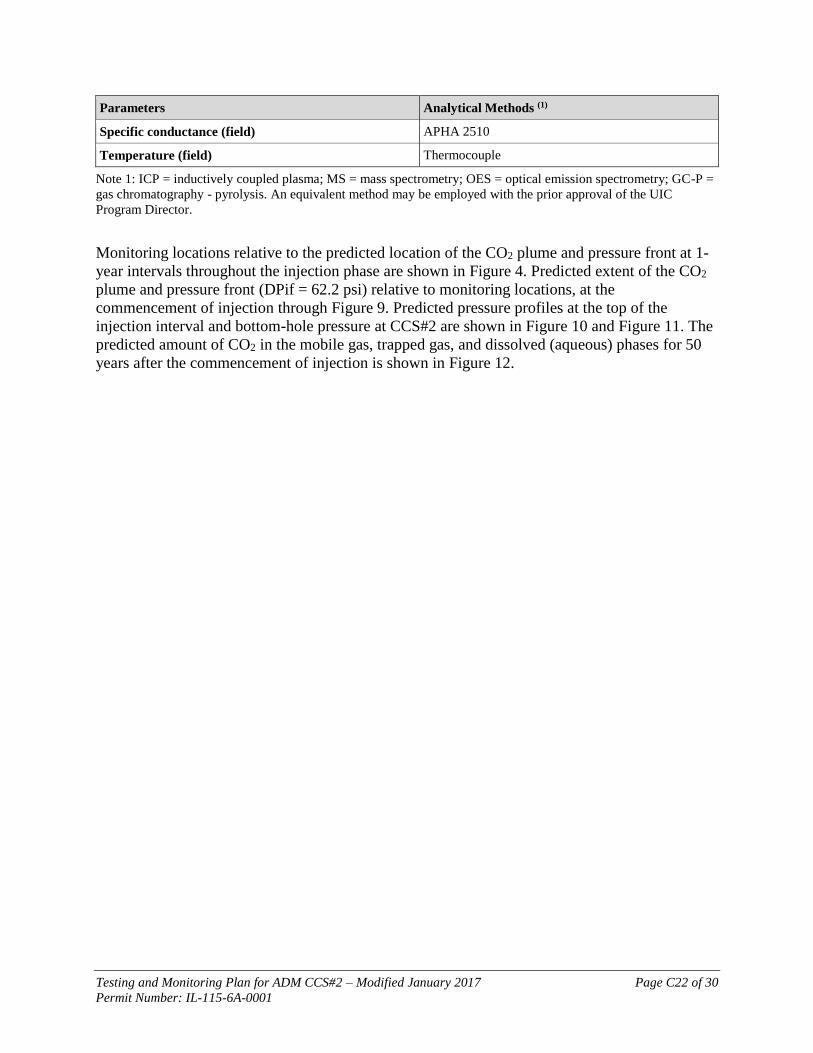
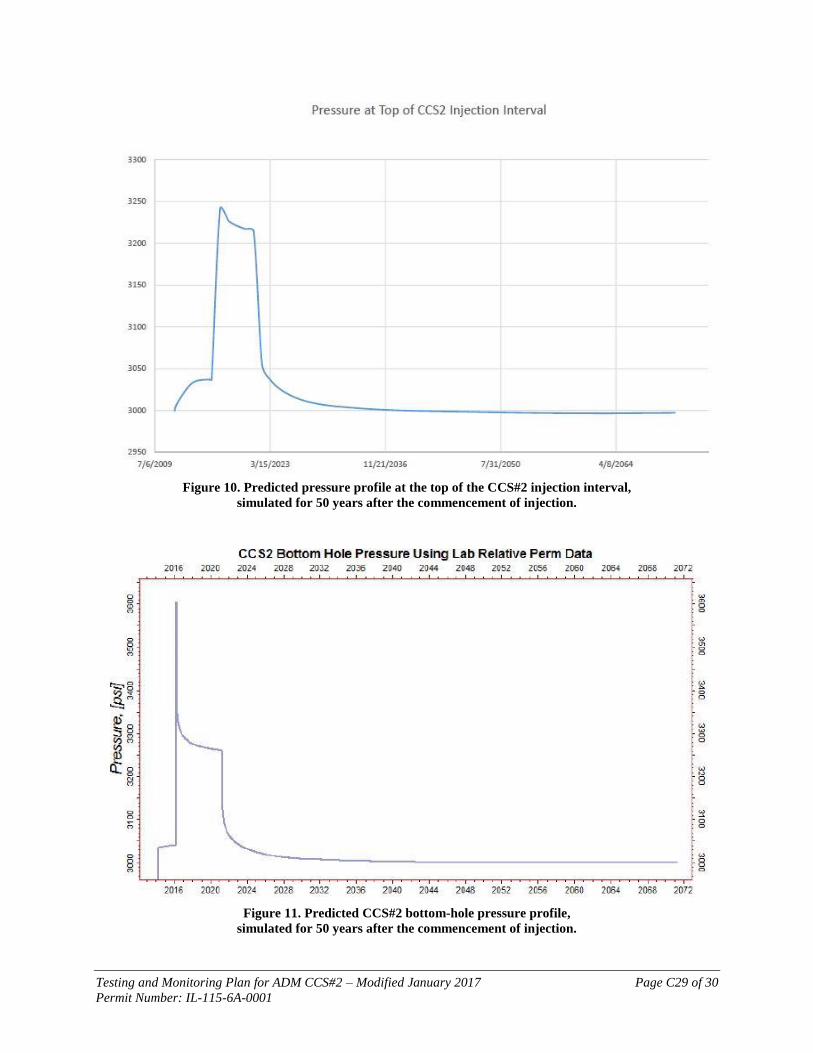
Monitoring locations relative to the predicted location of the CO2 plume and pressure front at 1-
year intervals throughout the injection phase are shown in Figure 4. Predicted extent of the CO2
plume and pressure front (DPif = 62.2 psi) relative to monitoring locations, at the
commencement of injection through Figure 9. Predicted pressure profiles at the top of the
injection interval and bottom-hole pressure at CCS#2 are shown in Figure 10 and Figure 11. The
predicted amount of CO2 in the mobile gas, trapped gas, and dissolved (aqueous) phases for 50
years after the commencement of injection is shown in Figure 12.

Testing and Monitoring Plan for ADM CCS#2 – Modified January 2017 Page C23 of 30
Permit Number: IL-115-6A-0001
Figure 4. Predicted extent of the CO2 plume and pressure front (DPif = 62.2 psi) relative to monitoring
locations, at the commencement of injection for CCS #2.

Testing and Monitoring Plan for ADM CCS#2 – Modified January 2017 Page C24 of 30
Permit Number: IL-115-6A-0001
Figure 5. Predicted extent of the CO2 plume and pressure front (DPif = 62.2 psi) relative to monitoring
locations, after 1 year of injection at CCS #2.

Testing and Monitoring Plan for ADM CCS#2 – Modified January 2017 Page C25 of 30
Permit Number: IL-115-6A-0001
Figure 6. Predicted extent of the CO2 plume and pressure front (DPif = 62.2 psi) relative to monitoring
locations, after 2 years of injection at CCS #2.

Testing and Monitoring Plan for ADM CCS#2 – Modified January 2017 Page C26 of 30
Permit Number: IL-115-6A-0001
Figure 7. Predicted extent of the CO2 plume and pressure front (DPif = 62.2 psi) relative to monitoring
locations, after 3 years of injection at CCS #2.

Testing and Monitoring Plan for ADM CCS#2 – Modified January 2017 Page C27 of 30
Permit Number: IL-115-6A-0001
Figure 8. Predicted extent of the CO2 plume and pressure front (DPif = 62.2 psi) relative to monitoring
locations, after 4 years of injection at CCS #2.

Testing and Monitoring Plan for ADM CCS#2 – Modified January 2017 Page C28 of 30
Permit Number: IL-115-6A-0001
Figure 9. Predicted extent of the CO2 plume and pressure front (DPif = 62.2 psi) relative to monitoring
locations, after 5 years of injection at CCS #2.
Testing and Monitoring Plan for ADM CCS#2 – Modified January 2017 Page C29 of 30
Permit Number: IL-115-6A-0001
Figure 10. Predicted pressure profile at the top of the CCS#2 injection interval,
simulated for 50 years after the commencement of injection.
Figure 11. Predicted CCS#2 bottom-hole pressure profile,
simulated for 50 years after the commencement of injection.

Testing and Monitoring Plan for ADM CCS#2 – Modified January 2017 Page C30 of 30
Permit Number: IL-115-6A-0001
Figure 12. Predicted CO2 phase distribution, simulated for 50 years after the commencement of injection.
Appendix
Quality Assurance and Surveillance Plan.