OFF-Stagnation point testing in plasma facility
10
OFF-STAGNATION POINT TESTING IN PLASMA FACILITY A. Viladegut and O. Chazot Von Karman Institute (VKI) 72 Chauss‚ ee de Waterloo, Rhode-Saint-Gen` ese 1640, Belgium Reentry space vehicles face extreme conditions of heat §ux when inter- acting with the atmosphere at hypersonic velocities. Stagnation point heat §ux is normally used as a reference for Thermal Protection Ma- terial (TPS) design; however, many critical phenomena also occur at o¨-stagnation point. This paper adresses the implementation of an o¨- stagnation point methodology able to duplicate in ground facility the hypersonic boundary layer over a §at plate model. The ¦rst analysis using two-dimensional (2D) computational §uid dynamics (CFD) simu- lations is carried out to understand the limitations of this methodology when applying it in plasma wind tunnel. The results from the testing campaign at VKI Plasmatron are also presented. 1 INTRODUCTION Reentry space vehicles face severe heat §ux conditions when interacting with the atmosphere at hypersonic velocities. The strong shock wave in front of the vehicle dissociates air molecules into atoms and the gas becomes a mixture of species [1]. A nonequilibrium boundary layer develops surrounding the vehicle after the shock. Within this boundary layer, atom recombination can take place and a di¨usive heat §ux term should be added to the heat §ux balance equation at the wall. Stagnation point is normally considered as the most critical region due to its higher stagnation properties. This is the reason why it is typically used as a reference for TPS design. However, extreme heat §ux conditions could also occur at o¨-stagation point. Thus, it is of interest to develop a methodology able to reproduce these §ight environments in ground facility. The ground simulation of reentry conditions is carried out through the so- called high enthalpy facilities. The lack of capability to reproduce the complete in-§ight phenomena in only one facility urges to operate in di¨erent types of wind tunnel: shock-tunnel facilities and plasma facilities. While the formers are used to reproduce high Mach numbers for only few milliseconds, the latters can deal with relatively low velocities and very high static enthalpies during Progress in Flight Physics 7 (2015) 113-122 DOI: 10.1051/eucass/201507113 © Owned by the authors, published by EDP Sciences, 2015 This is an Open Access article distributed under the terms of the Creative Commons Attribution License 4.0, which permits unrestricted use, distribution, and reproduction in any medium, provided the original work is properly cited. Article available at http://www.eucass-proceedings.eu or http://dx.doi.org/10.1051/eucass/201507113
Transcript of OFF-Stagnation point testing in plasma facility
OFF-STAGNATION POINT TESTINGIN PLASMA FACILITY
A. Viladegut and O. Chazot
Von Karman Institute (VKI)72 Chauss‚ee de Waterloo, Rhode-Saint-Genese 1640, Belgium
Reentry space vehicles face extreme conditions of heat §ux when inter-acting with the atmosphere at hypersonic velocities. Stagnation pointheat §ux is normally used as a reference for Thermal Protection Ma-terial (TPS) design; however, many critical phenomena also occur ato¨-stagnation point. This paper adresses the implementation of an o¨-stagnation point methodology able to duplicate in ground facility thehypersonic boundary layer over a §at plate model. The ¦rst analysisusing two-dimensional (2D) computational §uid dynamics (CFD) simu-lations is carried out to understand the limitations of this methodologywhen applying it in plasma wind tunnel. The results from the testingcampaign at VKI Plasmatron are also presented.
1 INTRODUCTION
Reentry space vehicles face severe heat §ux conditions when interacting withthe atmosphere at hypersonic velocities. The strong shock wave in front of thevehicle dissociates air molecules into atoms and the gas becomes a mixture ofspecies [1]. A nonequilibrium boundary layer develops surrounding the vehicleafter the shock. Within this boundary layer, atom recombination can take placeand a di¨usive heat §ux term should be added to the heat §ux balance equationat the wall. Stagnation point is normally considered as the most critical regiondue to its higher stagnation properties. This is the reason why it is typicallyused as a reference for TPS design. However, extreme heat §ux conditions couldalso occur at o¨-stagation point. Thus, it is of interest to develop a methodologyable to reproduce these §ight environments in ground facility.The ground simulation of reentry conditions is carried out through the so-
called high enthalpy facilities. The lack of capability to reproduce the completein-§ight phenomena in only one facility urges to operate in di¨erent types ofwind tunnel: shock-tunnel facilities and plasma facilities. While the formersare used to reproduce high Mach numbers for only few milliseconds, the latterscan deal with relatively low velocities and very high static enthalpies during
Progress in Flight Physics 7 (2015) 113-122 DOI: 10.1051/eucass/201507113 © Owned by the authors, published by EDP Sciences, 2015
This is an Open Access article distributed under the terms of the Creative Commons Attribution License 4.0, which permits unrestricted use, distribution, and reproduction in any medium, provided the original work is properly cited.
Article available at http://www.eucass-proceedings.eu or http://dx.doi.org/10.1051/eucass/201507113

PROGRESS IN FLIGHT PHYSICS
several minutes. For TPM characterization, two types of plasma facilities areextensively used. Arc-jet plasma facilites, which can reach high power plasma(several megawatt) through an electrical discharge between two electrodes, andInduced Coupled Plasma (ICP) facilities, which are less powerful than arc-jetsbut they achieve a very pure plasma torch in terms of chemical composition [2].The experimental campaign that will be presented afterwards is carried out atthe ICP-Plasmatron facility located at the VKI.The purpose of this paper is the implementation of an o¨-stagnation point
methodology able to duplicate the in-§ight nonequilibrium boundary layer inplasma facility. Despite, it is normally said that real-scale models should be usedfor ground testing in order to reproduce many of the hypersonic phenomena, themethodology presented below overcomes this limitation for the boundary layer.Indeed, thickness, gradients, and chemical reactions can be the same as in §ightbut applied over reduced scale models. In the sections below, the o¨-stagnationpoint methodology is presented followed by a brief introduction to the involvedfacilities at VKI. Then, a CFD assessment focused on its implementation at VKI-Plasmatron is described. The results coming from the experimental campaignare also discussed.
2 THE OFF-STAGNATION POINT METHODOLOGY
It is known that the heat §ux requirements at o¨-stagnation point are not asdemanding as the ones at stagnation point. However, most heat shield designsare still based on this maximum heat §ux condition throughout the wall of thevehicle. Since this is a very conservative assumption, it is of interest for a moree©cient design to develop a methodology that allows the §ight extrapolation ato¨-stagnation point con¦guration, thus reducing both costs and weight.This paper is based on the o¨-stagnation point duplication methodology pre-
sented by Barbante [3]. He states that the following parameters should be re-produced in ground testing for further §ight extrapolation: total enthalpy He,density ρe, velocity Ue, Damk�ohler number Da (ratio between chemistry and§ow characteristic times), and the parameter x/Ue where subindex e refers toboundary layer outer edge properties. From the Ue and x/Ue requirement, theconclusion that a real-scale model sould be introduced in ground facility is im-posed. In order to overcome this limitation, one could restrict the applicationof this methodology to low enough Eckert numbers, i. e., U2∞/h∞ ≪ 1. Thisassumption implies that most of the §ow energy is stored in internal energy and,as a consequence, the o¨-stagnation point boundary layer has to be close enoughto the stagnation point of the vehicle. Now, Ue does not need to be respectedanymore and, what is important, is the static enthalpy duplication he.A CFD analysis of the methodology is published by Chazot et al. [4] for two
di¨erent velocity conditions. The nonequilibrium boundary layer is solved over
114

EXPERIMENTAL FACILITIES
a §at plate at di¨erent Mach numbers, showing that the supersonic heat §uxover the x-coordinate is much higher than the subsonic one. By imposing thesame equilibrium freestream conditions for all simulations (i. e., P and he), itis expected that chemical reactions within both boundary layers are the same.This means that the characteristic time of the chemistry is always respected.Then, considering the variable x/Ue as a characteristic time of the §ow for o¨-stagnation point con¦guration, Da is automatically reproduded. The same pub-lication shows how the heat §ux curves for di¨erent Mach numbers convergeover the x/Ue variable, which means the boundary layer development is thesame for two di¨erent velocities. Indeed, the conservation of the boundary layerthickness δ, if the convective time x/Ue is the same, is shown by
δ = f
(x
Ue
)=
x√Rex
=
√νx
Ue
where Rex is the Reynolds number based on x and ν is the kinematic viscosity.
3 VKI FACILITIES
3.1 The VKI-Plasmatron
Induced coupled plasma generation uses a cooled quartz tube surrounded bya coil to heat up the gas. If high voltage and high power are applied to the coil,primary currents produce an electromagnetic ¦eld coaxial to the coil itself. Thetime-varying ¦eld induces an electromagnetic discharge that leads to dissociationof the gas molecules. Eddy currents within the ionized gas increase the rate ofcollisions, the gas heats up by Joule e¨ect, and plasma is generated. In addition,to enhance stability and provide a better thermal management of the plasmatorch, an annular injection of gas is realized. Once the plasma is generated, it isdischarged through a torch into the test chamber.
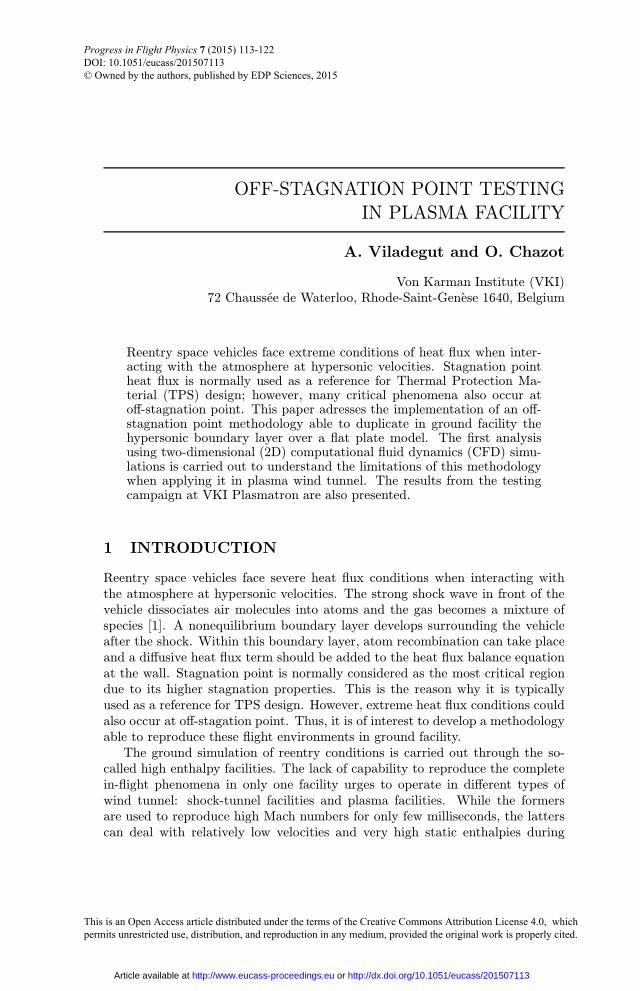
Plasmatron is able to operate at 1.2 MW of power and 2 kV at 400 kHz,to create the plasma, and to expand it into a 2.5-meter long and 1.4-meterdiameter test chamber through a 160-millimeter diameter torch. A schematic ofthe facility is shown in Fig. 1. The control parameters are mainly three: mass§ow of gas, static pressure P inside the test chamber, and power applied to thecoil. The mass §ow is regulated with a rotameter, while P is controlled withvacuum pumps located under the test facility and an atmospheric air by-pass.Despite the power is a control parameter, the one that is normally used to targettesting conditions is the stagnation point heat §ux which can be measured inreal time with the stagnation heat §ux probe. References [5,6] are recommendedfor further details about VKI-Plasmatron facility.
115
PROGRESS IN FLIGHT PHYSICS
Figure 1 VKI-Plasmatron facility
3.2 The Flat Plate Model
The §at plate model [7,8] used during the testing campaign consists of two mainelements. On one hand, a copper §at plate holder with two cooling systemscontaining a water mass §ow that keeps the surface temperature at 350 K. On theother hand, a §at plate calorimeter that measures the heat §ux at o¨-stagnationpoint (Fig. 2). The holder has a groove where the calorimeter (or TPM samples)can be ¦xed for testing at o¨-stagnation point con¦guration.
Eight isolated copper sensors are distributed along the §at plate calorimeterto obtain the heat §ux distribution. The insulation issue is very importantbecause energy cannot be lost between sensors or towards the holder. Eachsensor is made of a small part of the copper plate that is cooled by a water pipe.It is assumed that all the energy of the copper plate is transmited to the water.Then, type-E thermocouples are used to measure the water temperature (T )increment within each sensor so the heat §ux ( ‘Q) distribution can be obtainedwith
‘Q =‘mH2Ocpd
∂T
∂x.
116

EXPERIMENTAL FACILITIES
Figure 2 The §at plate calorimeter. Dimensions are in millimeters
Mass §ow of water and its speci¦c heat at constant pressure are ‘mH2O and cp,respectively, while d is the width of the sensor (30 mm).
4 COMPUTATIONAL FLUID DYNAMICS ANALYSIS
The implementation of the o¨-
Figure 3 Flat plate model geometry forCFD analysis
stagnation point methology de-scribed above at the VKI Plasma-tron facility is the major concern ofthis paper. A 2D CFD analysis try-ing to reproduce as close as possiblethe conditions in the facility is car-ried out before testing. The maingoal of the analysis is the applica-bility of the methodology over a ¦-nite §at plate model with a roundednose. The §at plate model is re-produced in Fig. 3 for numerical analysis. It is of particular interest to knowwhich variables a¨ect the methodology, especially, the free-stream velocity U∞,pressure P , and perpendicular-to-the-§ow direction gradients due to nonuniformfree-stream conditions of the torch.For the analysis, the numerical code CFD++ version 11.1 from Metacomp
Technologies is used. It solves the nonequilibrium Navier�Stokes equations fora 7-species air model. As the methodology is only applicable to laminar boundarylayers, no transition is considered. The software allows the de¦nition of eithernoncatalytic or full-catalytic conditions at the wall.
117
PROGRESS IN FLIGHT PHYSICS
4.1 Applicability of the Methodology over Finite Flat Plate
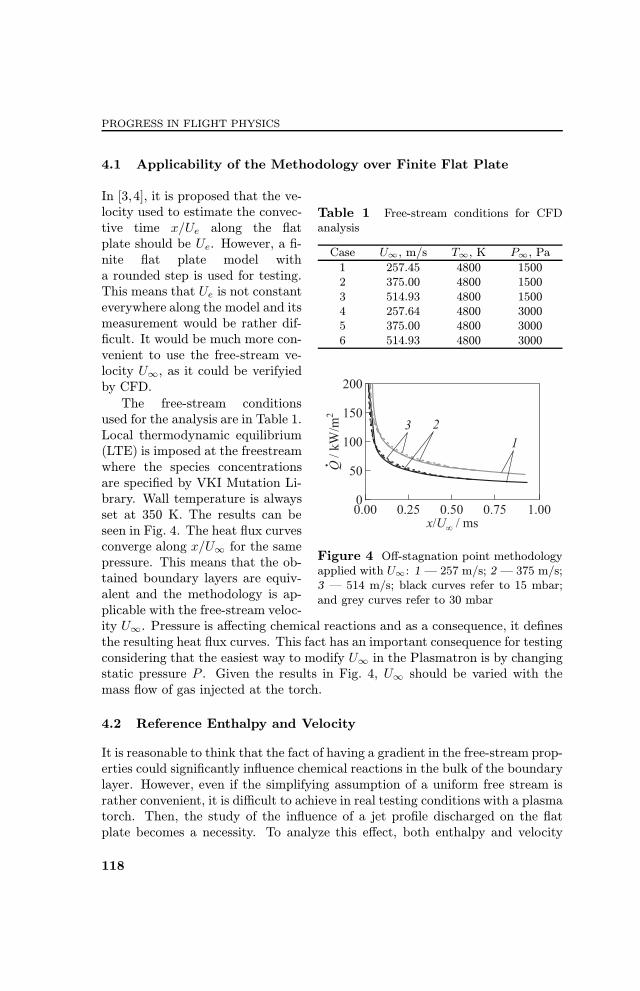
In [3,4], it is proposed that the ve-
Table 1 Free-stream conditions for CFDanalysis
Case U∞, m/s T∞, K P∞, Pa
1 257.45 4800 15002 375.00 4800 15003 514.93 4800 15004 257.64 4800 30005 375.00 4800 30006 514.93 4800 3000
Figure 4 O¨-stagnation point methodologyapplied with U∞: 1 ¡ 257 m/s; 2 ¡ 375 m/s;3 ¡ 514 m/s; black curves refer to 15 mbar;and grey curves refer to 30 mbar
locity used to estimate the convec-tive time x/Ue along the §atplate should be Ue. However, a ¦-nite §at plate model witha rounded step is used for testing.This means that Ue is not constanteverywhere along the model and itsmeasurement would be rather dif-¦cult. It would be much more con-venient to use the free-stream ve-locity U∞, as it could be verifyiedby CFD.
The free-stream conditionsused for the analysis are in Table 1.Local thermodynamic equilibrium(LTE) is imposed at the freestreamwhere the species concentrationsare speci¦ed by VKI Mutation Li-brary. Wall temperature is alwaysset at 350 K. The results can beseen in Fig. 4. The heat §ux curvesconverge along x/U∞ for the samepressure. This means that the ob-tained boundary layers are equiv-alent and the methodology is ap-plicable with the free-stream veloc-ity U∞. Pressure is a¨ecting chemical reactions and as a consequence, it de¦nesthe resulting heat §ux curves. This fact has an important consequence for testingconsidering that the easiest way to modify U∞ in the Plasmatron is by changingstatic pressure P . Given the results in Fig. 4, U∞ should be varied with themass §ow of gas injected at the torch.
4.2 Reference Enthalpy and Velocity
It is reasonable to think that the fact of having a gradient in the free-stream prop-erties could signi¦cantly in§uence chemical reactions in the bulk of the boundarylayer. However, even if the simplifying assumption of a uniform free stream israther convenient, it is di©cult to achieve in real testing conditions with a plasmatorch. Then, the study of the in§uence of a jet pro¦le discharged on the §atplate becomes a necessity. To analyze this e¨ect, both enthalpy and velocity
118

EXPERIMENTAL FACILITIES
Figure 5 Uniform and jet enthalpypro¦les comparison (evaluation at 20 cmfrom the leading edge): 1 ¡ jet freestream; 2 ¡ boundary layer from jetat 20 cm from the leading edge; 3 ¡uniform free stream; and 4 ¡ boundarylayer from uniform at 20 cm from theleading edge
Figure 6 E¨ect of varying U∞ on Ue
(evaluation at 20 cm from the leadingedge): 1 ¡ U∞ = 105 m/s; 2 ¡ boudarylayer for U∞ = 105 m/s; 3 ¡ U∞
= 210 m/s; and 4 ¡ boundary layer forU∞ = 210 m/s
pro¦les are rebuilt from experimental measurements [9, 10] across the plasmatorch. These pro¦les, together with species concentrations under equilibrium,have been introduced as input boundary conditions in the simulations. The re-sults are shown in Fig. 5 where the enthalpy pro¦le at 20 cm from the leadingedge is compared to the one obtained under uniform conditions. Free-streampro¦les are plotted too. It appears reasonable to de¦ne the outer edge as thepoint where enthalpy reaches its free-stream value. In the pro¦le correspondingto the free-stream jet, the enthalpy at the outer edge is not the same as theone located at the axis of the plasma torch. Then, free-stream enthalpy on theaxis should be considered as a reference and not as the one really present at theouter edge. Another conclusion from Fig. 5 is that enthalpy gradients are not sig-ni¦cantly di¨erent between the two boundary layers. Hence, the assumption ofuniform free-stream conditions during the tests should not be a limitation for themethodology. The same conclusions apply at di¨erent locations of the §at plate.In addition, the assurance that a variation in U∞ leads to the same variation
at the outer edge Ue is required. This has also been veri¦ed and it is shown inFig. 6. Under the same h∞ and P conditions, if U∞ is varied from 210 to 105 m/s,Ue is also halved at 20 cm from the leading edge of the §at plate model. Thesame result is checked at di¨erent x-coordinates over the model.
5 TESTING CAMPAIGN
The o¨-stagnation point methodology has been applied at the VKI-Plasmatronfacility. The experimental setup is shown in Fig. 7. A copper calorimeter (called
119

PROGRESS IN FLIGHT PHYSICS
Figure 7 Schematics of VKI-Plasmatron con¦guration for o¨-stagnation point testing
Standard Probe at VKI) and a Pitot probe are injected ¦rst into the plasma torchto de¦ne the testing conditions of heat §ux and pressure at stagnation point,respectively. They are used to rebuild the free-stream conditions U∞ and h∞together with the in-house boundary layer code [11] and ICP simulations [12].Then, the §at plate model is introduced into the plasma jet and the temperaturecoming from the themocouoples is stored using the data acquisition system.
The Plasmatron test chamber is equipped with an absolute pressure trans-ducer Memberanovac DM12, Leybold Vacuum, OC Oerlikon Corporation AG,Pf�a©kon, Switzerland able to measure static pressure with ± 2% of uncertainty.For the Pitot line, a variable reluctance pressure transducer Validyne DP-15Validyne Engineering Corp., Northridge, CA, USA is used. Its output is ampli-¦ed and corrected through a voltage demodulator CD-15 Valydine EngineeringCorp., Northridge, CA, USA. Both pressure transducer and demodulator arecalibrated by means of a Betz water manometer and their uncertainty is ± 10%due to plasma torch §uctuations. The thermocouples used in the §at platecalorimenter are type-E with an uncertainty of ± 0.2 K.
5.1 O¨-Stagnation Point Results
The testing procedure described above is repeated for 16 and 8 g/s of air-plasma for several values of stagnation point heat §ux and at constant pressure(P = 1500 Pa). The o¨-stagnation heat §ux distributions with the same staticenthalpy are selected. The change of the gas mass §ow leads to a variation inthe free-stream velocity U∞. The testing conditions considered are presented inTable 2. The o¨-stagnation point methodology is applied and the results areshown in Fig. 8. Since the di¨erence in h∞ is only 1%, it is reasonable to assumethat chemical composition of the plasma is kept constant between the two cases.The di¨erence in U∞ leads to the conclusion that a 32 percent boundary layerreduction is achieved when passing from 16 to 8 g/s air §ow.
120

EXPERIMENTAL FACILITIES
Table 2 Testing conditions considered for o¨-stagnation point methodology application
‘m, g/s he, MJ/kg U∞, m/s P , Pa
16 11.73 839.93 15008 11.61 572.21 1500
Figure 8 O¨-stagnation point methodology applied at VKI-Plasmatron facility:(a) ‘Q over x and (b) ‘Q over x/U∞: 1 ¡ 16 g/s: h∞ = 11.73 MJ/kg and U∞
= 839.93 m/s; and 2 ¡ 8 g/s: h∞ = 11.61 MJ/kg and U∞ = 572.21 m/s
Uncertainty analysis studies can be found in [6] for the stagnation point heat§ux Standard Probe. Same levels of uncertainty are expected at the §at platecalorimeter since both are based on the same measurement principles. Heat §uxaccuracy is assumed to be ±10% following
δ ‘Q‘Q=
√(δ ‘m
‘m
)2+
(δcpcp
)2+
(δ(Tout − Tin)
Tout − Tin
)2+
(δA
A
)2
where ¢in£ and ¢out£ refer to input and output conditions at the sensor and A isthe corresponding sensing area. Static pressure P and dynamic pressure Pdynaccuracies are ±10% and ±20%, respectively: the former due to §uctuactionsof the vacuum pumps and the latter due to plasma torch instability. Propa-gation error through the rebuilding boundary layer code leads to ±10 percentuncertainty on h∞.
6 CONCLUDING REMARKS
An o¨-stagnation point methodology that overcomes the model size limitationfor high enthalpy facilities has been assessed. After a 2D CFD analysis, it is sug-
121

PROGRESS IN FLIGHT PHYSICS
gested that VKI-Plasmatron is suitable to apply this methodology. Care shouldbe taken when changing the U∞ since h∞ and P determine chemical reactionsin the bulk of the boundary layer. It is shown that applying the methodologywith U∞ instead of Ue remains acceptable as well as the assumption of uni-form free-stream conditions. Finally, the methodology is successfully applied forthe Plasmatron testing conditions considered in Table 2 obtaining a 32 percentreduced scale boundary layer over the §at plate model.
REFERENCES
1. Anderson, Jr., J.D. 1989. Hypersonic and high temperature gas dynamics. AIAAeducation ser. McGraw Hill.
2. Chazot, O. 2009. Plasma wind tunnel: Design, operation and applications. VonKarman Institute for Fluid Dynamics. Course note 211.
3. Barbante, P. F. 2009. Heat §ux duplication between ground facility and hypersonic§ight. J. Thermophys. Heat Transfer 23:684�692.
4. Chazot, O., F. Panerai, and V. van der Haegen. 2011. Aerothermochemistry test-ing for lifting reentry vehicles. 7th European Symposium on AerothermodynamicsProceedings. Ed. L. Ouwehand. Noordwijk. Netherlands: European Space Agency.Id. 48.
5. Bottin, B., O. Chazot, M. Carbonaro, V. van der Haegen, and S. Paris. 1999. TheVKI plasmatron characteristics and performance. RTO-AVT Course on measure-ment techniques for high enthalpy and plasma §ows. Rhode-Saint-Genese, Belgium.
6. Panerai, F. 2011. Aerothermochemistry characterization of thermal protection sys-tems. Von Karman Institute for Fluid Dynamics, Universit‚a degli Studi di Perugia.Ph.D. Thesis.
7. Vanaerschot, A. 2009�2010. Development of a §at plate probe for o¨-stagnationtesting of space reentry vehicles. Faculteit Ingenieurswetenschappen ¡ KatholiekeUniversiteit Leuven. Final year project.
8. Braun, A. 2011. Validation of a methodology for o¨-stagnation point testing. VonKarman Institute; Institute for Space Systems, Stuttgart University. Study Thesis.
9. Baldani, F. 2009. VKI Plasmatron jet investigation for o¨-stagnation point testing.Von Karman Institute for Fluid Dynamics. Project Report 2009-21.
10. Cipullo, A. 2010. Plasma §ow characterization by means of optical emission diag-nostics. Von Karman Institute for Fluid Dynamics. Project Report 2010-05.
11. Barbante, P. F. 2001. Accurate and e©cient modelling of high temperature nonequi-librium air §ows. Von Karman Institute for Fluid Dynamics; Universit‚e Libre deBruxelles. Ph.D. Thesis.
12. Degrez, G., D. Vanden Abeele, P. F. Barbante, and B. Bottin. 2004. Numericalsimulation of inductively coupled plasma §ows under chemical non-equilibrium.Int. J. Numer. Meth. Heat Fluid Flow 14:538�558.
122