ATTACHED-GROWTH SYSTEM FOR NITRIFICATION AT LOW …
88
Purdue University Purdue e-Pubs Open Access eses eses and Dissertations Spring 2014 AACHED-GROWTH SYSTEM FOR NITRIFICATION AT LOW TEMPETURE Zhe Sun Purdue University Follow this and additional works at: hps://docs.lib.purdue.edu/open_access_theses Part of the Civil Engineering Commons , and the Environmental Engineering Commons is document has been made available through Purdue e-Pubs, a service of the Purdue University Libraries. Please contact [email protected] for additional information. Recommended Citation Sun, Zhe, "AACHED-GROWTH SYSTEM FOR NITRIFICATION AT LOW TEMPETURE" (2014). Open Access eses. 268. hps://docs.lib.purdue.edu/open_access_theses/268
Transcript of ATTACHED-GROWTH SYSTEM FOR NITRIFICATION AT LOW …

Purdue UniversityPurdue e-Pubs
Open Access Theses Theses and Dissertations
Spring 2014
ATTACHED-GROWTH SYSTEM FORNITRIFICATION AT LOW TEMPERATUREZhe SunPurdue University
Follow this and additional works at: https://docs.lib.purdue.edu/open_access_theses
Part of the Civil Engineering Commons, and the Environmental Engineering Commons
This document has been made available through Purdue e-Pubs, a service of the Purdue University Libraries. Please contact [email protected] foradditional information.
Recommended CitationSun, Zhe, "ATTACHED-GROWTH SYSTEM FOR NITRIFICATION AT LOW TEMPERATURE" (2014). Open Access Theses. 268.https://docs.lib.purdue.edu/open_access_theses/268


ATTACHED-GROWTH SYSTEM FOR NITRIFICATION AT LOW TEMPERATURE
A Thesis
Submitted to the Faculty
of
Purdue University
by
Zhe Sun
In Partial Fulfillment of the
Requirements for the Degree
of
Master of Science in Engineering
May, 2014
Purdue University
West Lafayette, Indiana

ii
ACKNOWLEDGEMENTS
I would like to express my sincere gratitude to my parents and my family for all the
sacrifices and support they made during my master study.
I would like to thank Professor Ernest R. Blatchley III, who guided me through my
Master’s study, for all his help throughout the completion of my degree. I am really
fascinated by his research attitude and his profound knowledge. I would also like to show
my appreciation to Professor Ronald Turco for his comments and suggestions on my
research and thesis. Finally, I want to thank Professor Loring F. Nies for all his guidance
and suggestions on my research and thesis.
I would also show my appreciation to those who helped me during my research,
and to those who have supported me throughout my master’s study. I want to thank Shih-
Chi Weng, Mehrnaz Afifi, Zhangxin Wang, Yanni Mao, and Yang He, for your help in my
research.
Finally I want to thank US Geological Survey (through the Indiana Water Resources
Research Center) and Bradely Environmental, who have provided the financial and
technical support for this research.

iii
TABLE OF CONTENTS
LIST OF TABLES v
LIST OF FIGURES ........................................................................................................... vi
ABSTRACT ......................................................................................................... viii
CHAPTER 1. LITERATURE REVIEW ....................................................................1
1.1 Nitrogen in the Environment ...................................................................1
1.1.1 Nitrogen Cycle .....................................................................................1
1.1.2 Ammonia-N in the Environment .........................................................2
1.1.3 Ammonia-N as a Pollutant in Environment .........................................3
1.2 Biochemical Nitrification.........................................................................4
1.2.1 Nitrifying Bacteria ...............................................................................4
1.2.2 Nitrification Kinetics ...........................................................................5
1.2.3 Factors Affecting Nitrification .............................................................8
1.3 Suspended-growth and Attached-growth Treatment Systems ...............13
1.3.1 Suspended-growth Treatment Systems ..............................................13
1.3.2 Attached-growth Treatment System ..................................................15
CHAPTER 2. PROJECT INTRODUCTION ...........................................................17
2.1 Treatment Lagoon System at Wingate ...................................................17
2.2 Research Objective ................................................................................23
CHAPTER 3. METHODS AND MATERIALS ......................................................25
3.1 Experimental Design and Procedures ....................................................25
3.1.1 Mini BOBBER Experiments..............................................................25
3.1.2 Attached-growth Batch Experiments .................................................28
3.2 MATERIALS AND ANALYTICAL METHODS ................................30
3.2.1 Synthetic Wastewater (SWW) ...........................................................30
3.2.2 Analytical Methods ............................................................................31
CHAPTER 4. RESULTS AND DISCUSSION ........................................................32
4.1 Mini BOBBER Experiments..................................................................32
4.1.1 pH .......................................................................................................32
4.1.2 Temperature .......................................................................................33
4.1.3 DO ......................................................................................................34
4.1.4 Ammonia-N .......................................................................................36
4.1.5 Nitrite-N and Nitrate-N ......................................................................39
4.1.6 Nitrogen Balance ...............................................................................41

iv
4.2 Nitrification at Wingate Lagoon System ...............................................46
4.2.1 Improvement on Ammonia-N Removal by Application
of BOBBER Reactors ........................................................................47
4.2.2 Nitrification at Low Temperatures with BOBBER Reactors ............48
4.3 Attached-growth Batch Experiments .....................................................49
4.3.1 Attached-growth Batch Experiments at 20 °C ...................................50
4.3.2 Attached-growth Batch Experiments at 5 °C .....................................54
4.3.3 Specific Ammonia-N Removal Rate in Attached-growth
Batch Experiments .............................................................................57
4.4 Comparison between Mini BOBBER System and Real
BOBBER System ...................................................................................58
4.5 Comparison between Mini BOBBER Experiments and Attached-
Growth Batch Experiment .....................................................................60
4.6 Temperature Impacts on Attached-Growth Ammonia-N
Removal Rate .........................................................................................61
CHAPTER 5. CONCLUSIONS AND FUTURE WORK ........................................63
5.1 Conclusions ............................................................................................63
5.2 Future work ............................................................................................64
REFERENCES ...........................................................................................................66
APPENDIX A 72
APPENDIX B 74
APPENDIX C 76

v
LIST OF TABLES
Table 1.1. Monod Equation parameters for Mixed Cultures Oxidizing
Ammonia and Nitrite Nitrogen at 20 °C. .........................................................7
Table 3.1. Composition of Purdue Tap Water with respect to common inorganic
constituents. .....................................................................................................30
Table 4.1. Average Measured DO and Equilibrium DO at different temperature. ...........35
Table 4.2. Average ammonia-N concentration in both mini BOBBER tanks. .................38
Table 4.3. Average specific ammonia-N removal rate at different temperatures. ............44
Table 4.4. Ammonia-N removal fractions before and after installation of BOBBER
reactors. ...........................................................................................................48
Table 4.5. Specific ammonia-N removal rate at Wingate second lagoon. ........................49
Table 4.6. Specific ammonia-N removal rate in attached-growth batch
experiments. ....................................................................................................57
vi
LIST OF FIGURES
Figure 1.1. The nitrogen cycle. ..........................................................................................2
Figure 1.2. Equilibrium dissolved oxygen concentration as a function of
temperature. ....................................................................................................9
Figure 2.1. Lagoon system at Wingate. Inset photo is a zoomed aerial image of
the Wingate lagoons, in their original configuration. .....................................18
Figure 2.3. Digital image of “BOBBER” reactor (Left) and on-site “BOBBER”
reactor at Wingate Wastewater Treatment Plant (Right). ..............................22
Figure 2.4. Kaldnes K1 and RK media, provided by Bradley Environmental. ................23
Figure 3.1. Schematic of mini BOBBER experiments.....................................................26
Figure 3.2. Image of experiment design (a) Left, image of lab-scale lagoon system;
(b) Right, image of mini BOBBER reactor. ...................................................27
Figure 3.3. Schematic of attached-growth batch experiment. ..........................................29
Figure 4.1. Time-course measurements of pH in the mini BOBBER experiments.
Also included is the average water temperature during each stage of the
experiment; the vertical, dashed lines indicate dates at which room
temperature was changed. ..............................................................................33
Figure 4.2. Time-course measurements of temperature during the mini BOBBER
experiments. Also included is the average water temperature during
each stage of the experiment; the vertical, dashed lines indicate dates
at which room temperature was changed. ......................................................34
Figure 4.3. Time-course measurements of DO in the mini BOBBER experiments.
Also included are equilibrium DO concentrations corresponding to
average water temperature in each stage of the experiment. ..........................36
Figure 4.4. Ammonia-N data of mini BOBBER experiments. Also included are
daily ammonia-N concentrations of both mini BOBBER systems
corresponding to average water temperature in each stage of the
experiment. .....................................................................................................39
Figure 4.5. Nitrite-N and nitrate-N data of mini BOBBER experiments.
Also included are daily nitrite-N and nitrate-N concentrations of both
mini BOBBER systems corresponding to average water temperature
in each stage of the experiment. .....................................................................40
Figure 4.6. Nitrogen balance: (a) upper panel, nitrogen balance of the system using
Kaldnes K1 media; (b) lower panel, nitrogen balance of the system using
RK media. .......................................................................................................42
Figure 4.7. Specific ammonia-N removal rate of mini BOBBER experiments. ..............45

vii
Figure 4.8. Time-course pH (upper) and DO (lower) measurements of attached-
growth batch experiments at 20 °C without nitrogen balance. Two
sets of experiment with 400 mL media and the other two sets with
200 mL media. ..............................................................................................51
Figure 4.9. Time-course ammonia-N concentration measurements of attached-growth
batch experiments at 20 °C without nitrogen balance. Two sets of
experiment with 400 mL media and the other two sets with 200 mL
media. ...........................................................................................................52
Figure 4.10. Time-course pH and DO measurements of attached-growth batch
experiments at 20 °C with nitrogen balance.................................................53
Figure 4.11. Time-course behavior of measured forms of N in attached-growth
batch experiments at 20 °C. .........................................................................54
Figure 4.12. pH and DO to time relationships for attached-growth batch
experiments at 5 °C. .....................................................................................55
Figure 4.13. Substrate concentration to time relationship for attached-growth batch
experiments at 5 °C with nitrogen balance...................................................56
Figure 5.1. Km to exposure time relationship at 4 °C. ......................................................62

viii
ABSTRACT
Sun, Zhe. M.S.E., Purdue University, May 2014. Attached-Growth System for Nitrification
at Low Temperature. Major Professor: Ernest R. Blatchley III.
Lagoon systems are commonly used in small communities for domestic wastewater
treatment. These systems are simple and economical to operate, and are often appropriate
for use in areas where land costs are low. Lagoons are effective in removing conventional
pollutants under warm-weather conditions; however, biochemical nitrification is hindered
in suspended-growth lagoons during periods of extended cold weather. Attached-growth
nitrification systems, as compared to suspended-growth systems, have been reported to
yield improved biochemical nitrification under cold-weather conditions. In this work we
investigated a new type of biochemical nitrification reactor (i.e., BOBBER) that includes
increased surface areas to promote development of attached-growth nitrifying communities
has applied to an aerobic lagoon system at Wingate, IN. Results of monitoring of this
system have indicated improvements in oxidation of ammonia-N, especially during winter
months.
To examine the behavior of this system in a more controlled setting, two laboratory-
scale mini-BOBBER systems were installed in a temperature-controlled room. The
systems were treated with an ammonium chloride feed solution, and allowed to approach
steady-state conditions at 20 °C, 15 °C, 10 °C, and 5 °C. In addition, a series of batch

ix
experiments were conducted at temperatures of 20 °C and 5 °C to investigate the
relationship between nitrification rate and ammonia-N concentration. Concentrations of
nitrate, nitrite, pH and other process variables were measured daily during these
experiments. These results were analyzed to quantify ammonia-N removal rates. Similar
calculations were applied to the data from the full-scale lagoon system at Wingate.
Ammonia-N removal in the laboratory-scale lagoon system always exceeded 95%,
even when at temperatures of 4.6 °C. However, the full-scale lagoon system was not as
effective, with ammonia-N removal of approximately 74% at the same temperature.
Possible explanations for these differences in behavior include: competition from
heterotrophs, relatively low influent ammonia-loading into Wingate second lagoon, and a
relatively small population of nitrifying bacteria at Wingate.
At 20 °C, the results from batch experiments indicated ammonia-N removal rates
of approximately 157 mg/m2/hour, while the removal rate at 5 °C was roughly 37
mg/m2/hour. Results from the batch experiments indicated that the ammonia-N removal
rate was zero-order with respect to ammonia-N concentration and was highly temperature-
dependent.
Collectively, these findings suggest that it is possible to maintain effective
biochemical nitrification in attached-growth systems even under cold-weather conditions.
Satisfactory performance of these systems will depend on hydraulic design and N loading
rates of the systems.
1
CHAPTER 1. LITERATURE REVIEW
1.1 Nitrogen in the Environment
1.1.1 Nitrogen cycle
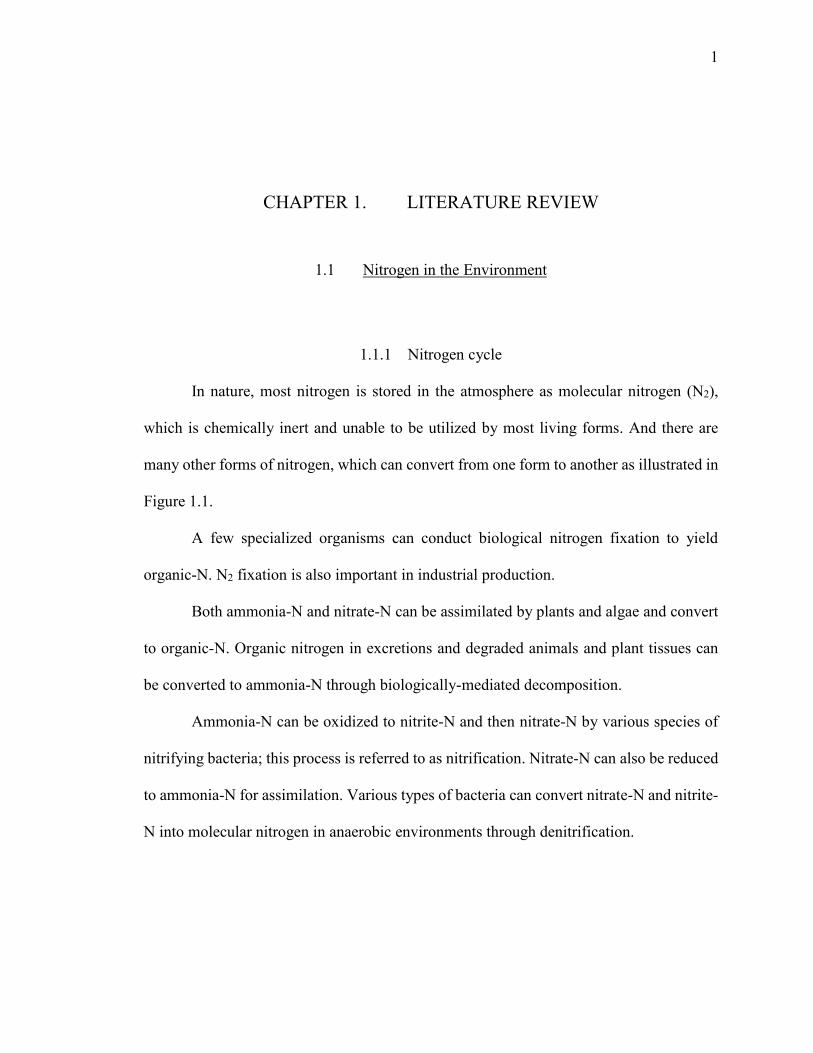
In nature, most nitrogen is stored in the atmosphere as molecular nitrogen (N2),
which is chemically inert and unable to be utilized by most living forms. And there are
many other forms of nitrogen, which can convert from one form to another as illustrated in
Figure 1.1.
A few specialized organisms can conduct biological nitrogen fixation to yield
organic-N. N2 fixation is also important in industrial production.
Both ammonia-N and nitrate-N can be assimilated by plants and algae and convert
to organic-N. Organic nitrogen in excretions and degraded animals and plant tissues can
be converted to ammonia-N through biologically-mediated decomposition.
Ammonia-N can be oxidized to nitrite-N and then nitrate-N by various species of
nitrifying bacteria; this process is referred to as nitrification. Nitrate-N can also be reduced
to ammonia-N for assimilation. Various types of bacteria can convert nitrate-N and nitrite-
N into molecular nitrogen in anaerobic environments through denitrification.

2
Figure 1.1. The nitrogen cycle (adapted from [1]).
1.1.2 Ammonia-N in the Environment
Ammonia-N sources in nature can be divided into two major types: natural sources
and artificial sources. Natural sources of ammonia-N include the decomposition of organic
matter, animal waste, and nitrogen fixation [2]. Artificial sources can be agricultural and
industrial related. Roughly 87% of U.S. domestic ammonia produced is used as fertilizer,

3
and includes anhydrous ammonia, ammonium phosphates, urea, ammonium nitrates, and
other nitrogen compounds [3]. In industry, ammonia is used to produce chemical
compounds directly and indirectly, such as the production of plastics and fibers,
manufacture of organic nitrogen compounds and inorganic compounds [4].
1.1.3 Ammonia-N as a pollutant in environment
In the environment, ammonia-N is an important pollutant, both because it expresses
toxicity toward aquatic organisms, and because of its ability to contribute to the
eutrophication and hypoxia.
Several mechanisms of toxicity expression by unionized ammonia on aquatic
animals have been identified and include: (1) damage to gill epithelium and gill tissues; (2)
reduction of blood oxygen-carrying capacity; (3) inhibition of adenosine triphosphate
(ATP) production; (4) depletion of ATP; and (5) disruption of liver and kidney function
[2].
Besides toxicity, eutrophication in surface water systems is also an issue caused by
nitrogen. Phosphorus and nitrogen often represent growth-limiting nutrients for algae. As
such, addition of P or N to surface waters can promote eutrophication [5]. If excess amounts
of these nutrients enter a surface water system, algal blooms could result, thereby leading
to dissolved oxygen depletion and accumulation of organic materials in the surface water
system [6]. As a result, eutrophication may change ecosystem structure, and wipe out the
species that are intolerant of low oxygen concentration [6]. Hypoxia, which may be viewed
as an extension of eutrophication, has been observed in the Gulf of Mexico; it is caused by

4
the mass production of algae due to introduction of nutrients, including P and N in the
aquatic environment [7]. Consequently, control of nitrogen discharge into aquatic systems
has become an important mission of wastewater treatment and its regulation [2], including
discharges from small facilities.
1.2 Biochemical Nitrification
Biochemical nitrification (hereafter referred to as nitrification) converts NH3 to
NO3 and is the most commonly applied method for control of ammonia-N. Nitrification is
a two-step process in which ammonia is first oxidized to nitrite, then nitrate through a series
of biochemical reactions. Nitrification is an important part of contemporary wastewater
treatment processes.
1.2.1 Nitrifying Bacteria
In spite of the fact that nitrification can be accomplished by many species of
heterotrophic and autotrophic bacteria, the major nitrifiers in wastewater treatment systems
are considered to be Nitrosomonas and Nitrobacter, which are autotrophic bacteria [8].
Nitrosomonas takes the first step to convert ammonium to nitrite through a relatively
complex series of reactions; Eq. (1) shows a proposed stoichiometric equation for this
process. The second step, which results in oxidation of nitrite to nitrate, is performed by
Nitrobacter as shown by the stoichiometric relationship in Eq. (2) [1].
55NH4++76O2+109HCO3
- Nitrosomonas→ C5H7O2N+54NO2
-+57H2O+104H2CO3 (1)

5
400NO2-+NH4
++4H2CO3+HCO3-+195O2
Nitrobacter→ 400NO3
-+C5H7O2N+3H2O (2)
According to the two equations above, alkalinity and oxygen are consumed in the
nitrification process, and inorganic carbon is used as carbon source for growth. In addition,
Nitrosomonas and Nitrobacter can also use small amounts of exogenous organic material
as a carbon source [9]. Besides the need of energy, the demand for the biomass synthesis
will also consume a portion of the ammonia-N. Ammonia-N required for cell synthesis has
been reported to be less than 2% of the total ammonia-N processed by nitrifiers [10].
Therefore, the stoichiometric relationships provided in Eq. (1) and Eq. (2) provide a
representative description of the chemical changes that accompany nitrification.
1.2.2 Nitrification Kinetics
Eq. (3) (Monod Equation) is widely accepted as a mathematical model for
describing the dependence of microbial growth rate on the concentration of a growth-
limiting substrate [1]:
μ=μmax
S
S+KS (3)
Where: S = the growth limiting substrate concentration (mg/L), μ = the specific
microorganism growth rate (day-1), KS = half velocity constant (mg/L), μmax = the
maximum specific microorganism growth rate (day-1).
In an aquatic environment with sufficient oxygen and trace nutrients, the growth-
limiting substrates for Nitrosomonas and Nitrobacter are NH4+ and NO2
-, respectively. The
maximum specific microorganism growth rate describes the maximum growth rate, which

6
would be achieved when the substrate concentration is high, relative to KS. In suspended-
growth systems, μmax will also determine the minimum mean residence time for which
washout of the nitrifying bacteria will occur. The maximum growth rate is an important
parameter which will affect the designed nitrification capacity of a wastewater treatment
plant, as well as the simulation of a nitrifying process using the Monod Equation. The half
velocity constant (KS) represents the growth-limiting substrate concentration that
corresponds to a specific growth rate that is half of the maximum growth rate. When KS is
small, relative to the substrate concentration S, the specific growth rate will be independent
of S and become zero-order. On the other hand, when the substrate concentration is small
relative to KS, the growth rate will be first-order with respect to S. Table 1.1 gives reported
values for μmax and KS for reduced-N [1].
7
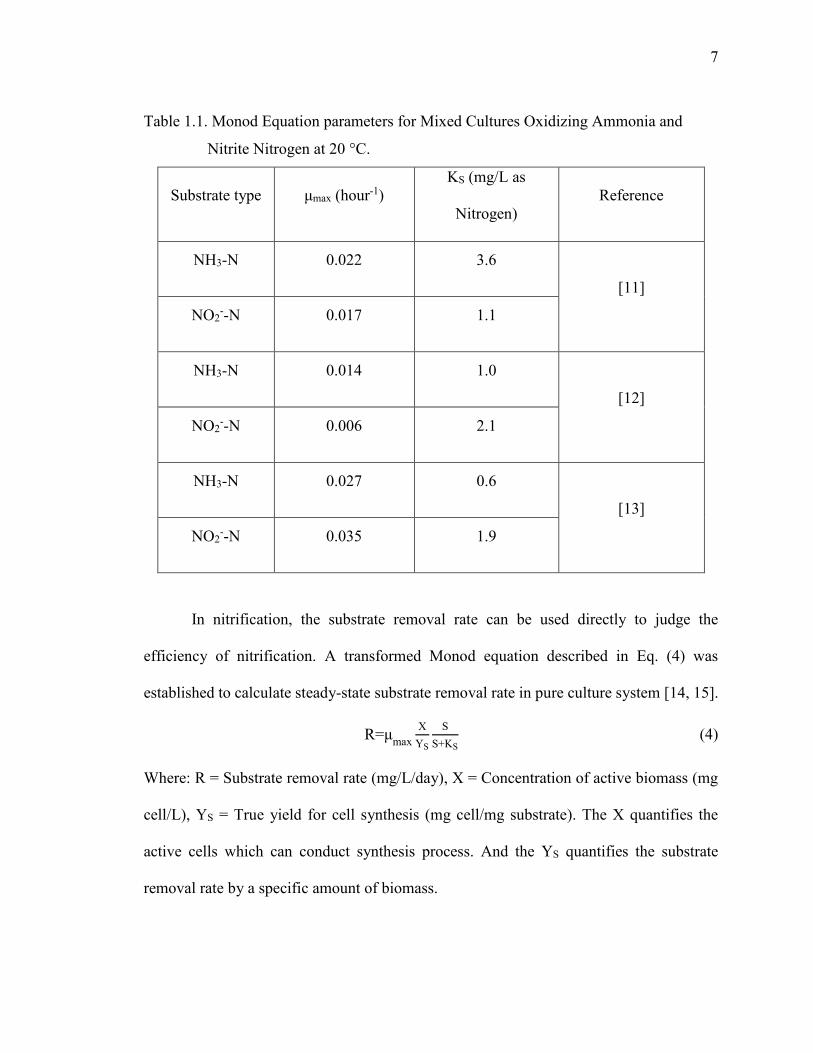
Table 1.1. Monod Equation parameters for Mixed Cultures Oxidizing Ammonia and
Nitrite Nitrogen at 20 °C.
Substrate type μmax (hour-1)
KS (mg/L as
Nitrogen)
Reference
NH3-N 0.022 3.6
[11]
NO2--N 0.017 1.1
NH3-N 0.014 1.0
[12]
NO2--N 0.006 2.1
NH3-N 0.027 0.6
[13]
NO2--N 0.035 1.9
In nitrification, the substrate removal rate can be used directly to judge the
efficiency of nitrification. A transformed Monod equation described in Eq. (4) was
established to calculate steady-state substrate removal rate in pure culture system [14, 15].
R=μmax
X
YS
S
S+KS (4)
Where: R = Substrate removal rate (mg/L/day), X = Concentration of active biomass (mg
cell/L), YS = True yield for cell synthesis (mg cell/mg substrate). The X quantifies the
active cells which can conduct synthesis process. And the YS quantifies the substrate
removal rate by a specific amount of biomass.

8
1.2.3 Factors Affecting Nitrification
Nitrifying bacteria tend to be easily influenced by various environmental factors
including dissolved oxygen concentration, temperature, pH, and presence of inhibitors [1].
This heightened sensitivity, relative to heterotrophic bacteria, has important implications
with respect to nitrification systems for wastewater treatment.
Effect of dissolved oxygen (DO)
Since nitrification is an oxygen demanding process, dissolved oxygen must be
provided to support it. According to Eq. (1) and Eq. (2), the oxygen requirement is 3.16
mg O2/mg NH3-N and 1.11 mg O2/mg NO2--N, resulting a total oxygen requirement of 4.27
mg O2/mg N. Therefore, DO can become a growth-limiting substrate, rather than ammonia-
N, if the DO concentration is sufficiently low [16]. The conventional Monod equation can
be modified to Eq. (5) to account for the effects of low dissolved oxygen concentration:
μ=μmax
S
S+KS
SO
SO+KO (5)
Where: KO = the half saturation constant of dissolved oxygen (mg/L), SO = dissolved
oxygen concentration (mg/L).
Unlike ammonia-N, which can exist in water in an ionic form and can be present at
a sufficiently high concentration to inhibit nitrification, dissolved oxygen has limited
solubility and will not inhibit nitrification, even under conditions of saturation [17].
Saturation (equilibrium) dissolved oxygen concentration is temperature dependent;
equilibrium dissolved oxygen concentration decreases as temperature increases, as shown
in Figure 1.2 [18].

9
Figure 1.2. Equilibrium dissolved oxygen concentration as a function of temperature.
In order to define how low dissolved oxygen will influence nitrification rate, some
researchers explored the nitrification rate under low dissolved oxygen concentration and
found that dissolved oxygen as low as 0.5 mg/L does not affect nitrification in a pure
culture suspended-growth nitrification system [16] [19].
Effect of pH
According to Eq. (1) and Eq. (2), pH should decrease as a result of nitrification.
However, nitrifiers from enrichment cultures are very sensitive to pH. Nitrosomonas
achieves the fastest ammonia oxidization rate for pH 7.0 - 8.0, while Nitrobacter
accomplishes its most efficient nitrate oxidation in the pH range of 7.3 - 8.2 [20]. In mixed
5
7
9
11
13
15
17
0 5 10 15 20 25 30 35 40 45 50
Saturated DOD
O (
mg O
2/L
)
Temperature (°C)

10
cultures, the effect of pH on nitrification is less crucial [1]. Though a wide range of pH
conditions under which nitrification occurs have been reported, most researchers agree that
the nitrification rate decreases as pH drops from the best pH range [21]. The high sensitivity
of nitrification to pH can be explained by the dependence of free ammonia on pH.
Ammonia mono-oxygenase was proposed to catalyze the nitrification in Nitrosomonas
strains and free ammonia is the main reactant [22]. And the acid-base reaction for ammonia
is depicted by Eq. (6):
𝑁𝐻4+ ↔ 𝑁𝐻3 + 𝐻
+ (6)
As an acid-base reactions, equilibrium conditions are established instantaneously, and are
governed by pH. When pH drops, the equilibrium in Eq. (6) moves left and the amount of
free ammonia reduces. As a consequence, the nitrification rate decreases.
Effect of temperature
Nitrifying bacteria are strongly affected by temperature for the range of conditions
that are representative of summer to winter in areas with temperate climates. A general
equation for maximum growth rate at different temperatures was established by
Stankewich [23], as depicted in Eq. (7):
μmax, T
=μmax,15
∙exp[Km(T-15)] (7)
Where: μmax,T = the maximum specific growth rate at temperature T (day-1), Km = constant
of temperature change for maximum growth rate ( °C-1). The reported values of Km for
Nitrosomonas range from 0.095 to 0.12 °C-1, while the reported range for Nitrobacter is
0.056 to 0.069 °C-1.

11
Furthermore, Eq. (8) describes the change of half velocity constant KS caused by
temperature changes [24]:
KS, T=KS,15∙exp[Khalf(T-15)] (8)
Where: KS,T = half velocity constant for growth limiting substrate S at temperature T
(mg/L), Khalf = constant of temperature change for half velocity constant ( °C-1). The KS,15
value has been reported to be 0.405 mg/L for Nitrosomonas and 0.625 mg/L for Nitrobacter,
while the Khalf value was reported to be 0.118 °C-1 for Nitrosomonas and 0.146 °C-1 for
Nitrobacter.
Unlike heterotrophic microorganisms, which will shift to a more psychrophilic
population that has only slightly longer generation time, nitrifying bacteria shows no
analogous population shift [25]. Therefore, essentially the same organisms are responsible
for nitrification both at 30 °C and 5 °C [25]. The minimum generation time for nitrifying
bacteria at 5 °C is more than 10 times of the same population at 30 °C [26].
Past studies of suspended-growth treatment systems have shown that little growth
of nitrifying bacteria occurs below 5 °C [27]. However, some researchers have found good
nitrification rates with suspended-growth system under 5 °C [28]. According to Rittmann
& Snoeyink’s work, the above inconsistency in the ammonia removal rate at low
temperatures is based on the capacity of nitrification system, which has different ammonia
loadings and different retention time [29].
Ammonia removal by immobilized nitrifiers has been demonstrated to be less
sensitive to temperature changes than suspended-growth nitrifying bacteria due to lower
activation energy required by immobilized nitrifiers [25]. Compared to suspended-growth

12
systems, attached-growth nitrifiers have greater potential for ammonia removal in cold
climate regions.
Effects of inhibitors
The composition of typical municipal wastewater tends to be complex. Some of the
compounds in wastewater can inhibit nitrification. Inhibitors can include substrates or
products of the nitrification process, and studies have shown that the substrates or the
products at high concentration will decrease the activity of nitrifiers, both in pure culture
and mixed culture systems [1].
Heavy metals have been found to have great effect on pure culture nitrifiers [30],
while their effects can decrease in mixed-culture systems because some metals can form
complexes with organic matter, thereby making them less bioavailable. On the other hand,
nitrification can be inhibited by metal-chelating compounds since some metals are required
in the activation of enzymes [31].
Effects of organic loading
Organics can also affect the behavior of nitrifiers. Some organic compounds display
direct inhibition of nitrifiers, such as methyl isothiocyanate, which can inhibit activated
sludge nitrification at a concentration of 0.8 mg/L, sodium methyl dithiocarbamate at 0.9
mg/L, thioacetamide at 0.53 mg/L, etc. [31].
More generally, organic matter can inhibit nitrification indirectly, such as through
a decrease in dissolved oxygen concentration. The oxidation of organic matter by
heterotrophic bacteria consumes dissolved oxygen, which will result in oxygen depletion,

13
especially in a biofilm, and reduction of nitrification rate [32].
Increases of organic loading can allow heterotrophic bacteria to flourish, and
competition will appear between nitrifiers and heterotrophic bacteria for nutrients and
growing space, especially in attached-growth systems. Ohashi et al found the proportion of
nitrifiers in a population to decrease with increasing carbon to nitrogen (C/N) ratio [33]. A
reduction of nitrifying bacteria accumulation was observed as a result of high C/N ratio
influent, which implies that nitrifiers need a longer time to grow before they are present in
sufficient numbers to perform nitrification [34].
1.3 Suspended-growth and Attached-growth Treatment Systems
1.3.1 Suspended-growth Treatment Systems
Suspended-growth treatment systems depend on suspended, mobile
microorganisms to accomplish substrate uptake and utilization. Generally, there are two
types of conventional suspended-growth treatment systems: lagoon systems (facultative
and aerated) and activated sludge systems.
Lagoon systems
Treatment lagoons are often used for wastewater treatment in rural areas, in part
because lagoons have a relatively large footprint, and land tends to be available and
inexpensive in these areas. Aerated lagoons are operated under continuous influent and
discharge conditions, and DO is maintained sufficiently with aeration systems. Aerated

14
lagoon systems are simple to operate, as compared to “mechanical” systems (less control
is required, i.e., no sludge recycle is required compared to activated sludge). Lagoon
systems tend to do a good job dealing with removal of conventional pollutants such as
suspended solids (TSS) and carbonaceous biochemical oxygen demand (CBOD), even in
cold climates. However, nitrification in lagoons has been reported to be slow and less
reliable than in conventional suspended-growth (mechanical) systems during periods of
extended cold weather [27, 35, 36]. Similar observations have also been reported at the
Wingate treatment lagoon [37].
Activated sludge systems
Compared to lagoon systems, activated sludge systems are more frequently applied
by wastewater treatment facilities in urban areas. Many examples of suspended-growth
systems exist; among these are single-stage and two-stage activated sludge systems. The
major difference between them is whether to remove CBOD and ammonia-N separately.
A single-stage system (including aeration tank, clarifier, and sludge recycle)
removes CBOD and ammonia-N in the same stage. Sludge recycle is used to promote
accumulation of slow-growing nitrifying bacteria in the system.
Two-stage activated sludge systems remove CBOD and ammonia-N separately.
CBOD is treated in the first stage with a high carbon oxidation rate, and ammonia-N is
treated in the second stage with a relatively low ammonia-N oxidation rate. The relatively
low rate of ammonia-N oxidation is contributable to the low growth rate and growth yield
of nitrifying bacteria compared to carbon oxidizing bacteria [38]. A strength of the two-
stage process is less competition between heterotrophs dealing with CBOD and autotrophs

15
dealing with ammonia-N [32-34]. However, the more complicated techniques always
accompany with higher expense and more human operation, as compared to one-stage
activated sludge systems.
1.3.2 Attached-growth Treatment System
Attached-growth systems, just as their name implies, are systems in which
microorganisms are growing and colonizing on attached media surfaces. Attachment can
provide protection from predation and harmful compounds in the aquatic environment
providing a competitive advantage over the unprotected suspended bacteria [39]. Since
nitrifiers in attached-growth systems are protected, attached-growth systems have been
applied under many tough conditions. For example, attached-growth nitrification has been
proven to have better ammonia-N removal rate under low temperatures, as discussed in
1.2.3.3. Attached-growth systems have also been proven to perform nitrification efficiently
under low pH conditions [40].
However, attached-growth systems are affected by the inner biofilm competition
with heterotrophs. When a biofilm is fully established, competition for substrates and
spaces between different species will start [39]. In attached-growth nitrification systems,
the existence of heterotrophs and organic matter can help nitrifying bacteria to attach to
surfaces [41]. On the other hand, when the organic loading is too high, the high C/N ratio
can cause a decrease of nitrifying bacteria population and lead to poor nitrification (refer
to 1.2.3.5).

16
Several attached-growth technologies have been applied so far, such as: trickling
filters; rotating biological contactors (RBC); biological aerated filtration (BAF); moving-
bed biofilm reactors (MBBR) [1, 42, 43]. MBBRs and BAFs have been reported to be more
efficient than RBCs and trickling filters [43]. Furthermore, MBBRs are more popular in
small communities [43].

17
CHAPTER 2. PROJECT INTRODUCTION
2.1 Treatment Lagoon System at Wingate
The wastewater treatment system for the town of Wingate, IN was built in 1984
with the support of a construction grant. The system is located roughly 1.2 miles northeast
of the town (see Figure 2.1, modified from google map). The wastewater system involves
a three-cell aerated lagoon, with discharge of treated water to Charles Ludlow Ditch. The
influent of this facility is mainly from residential and commercial septic wastewater in
Wingate.

18
Figure 2.1. Lagoon system at Wingate. Inset photo is a zoomed aerial image of the
Wingate lagoons, in their original configuration.
The Wingate facility, in its original configuration, accomplished effective removal
of CBOD and TSS [37]. However, as treatment of non-conventional pollutant, ammonia-
N treatment has started to be required by EPA and state regulatory agencies in small
wastewater treatment facilities, many of which are similar to the Wingate facility [44].
According to the latest NPDES permit, the discharge limitation of Wingate facility on
ammonia-N is 5.9 mg/L in summer and 10.8 mg/L in winter [45]. However, nitrification at

19
Wingate was irregular and poor, particularly during periods of extended cold weather (see
Figure 2.2).
To accomplish the ammonia-N removal requirement, construction of a new
mechanical plant or upgrade of existing facilities are the two most likely options for these
small WWTPs. However, the large capital investment required for a new mechanical plant
is outside budgets of most small communities. As a result, upgrading existing facilities
represents a promising solution because of comparatively low costs associated with
construction, operation, and energy consumption. As discussed in Chapter 1, attached-
growth nitrification has been reported to be less temperature sensitive than suspended-
growth nitrification systems [25, 46, 47]. As such, the development of attached-growth
systems for nitrification represents a potentially viable alternative for small WWTPs such
as Wingate wastewater treatment facility. Therefore, in 2011, six floating biochemical
reactors (“BOBBER,” provided by Bradley Environmental, see Figure 2.3) were installed.
In each BOBBER, water is drawn from the lagoon through an “8” port using a 1-HP pump.
Water is circulated aggressively within the spherical BOBBER to promote mixing and
growth of attached-growth community on a high specific surface area medium that is
packed into the BOBBER cavity. Water is then discharged back into the lagoon through 8
radially-oriented PVC pipes (see Figure 2.3).
BOBBERs are filled with a media (see Figure 2.4) that has high specific surface
area for microorganisms to attach to. Kaldnes K1 media, produced by Evolution Aqua, is
the default medium for use in these systems. This medium has a specific surface area of
300 m2/m3. An alternative medium is RK media, produced by RKPLAST, which has a
20
specific surface area of 750 m2/m3 (see Figure 2.4).
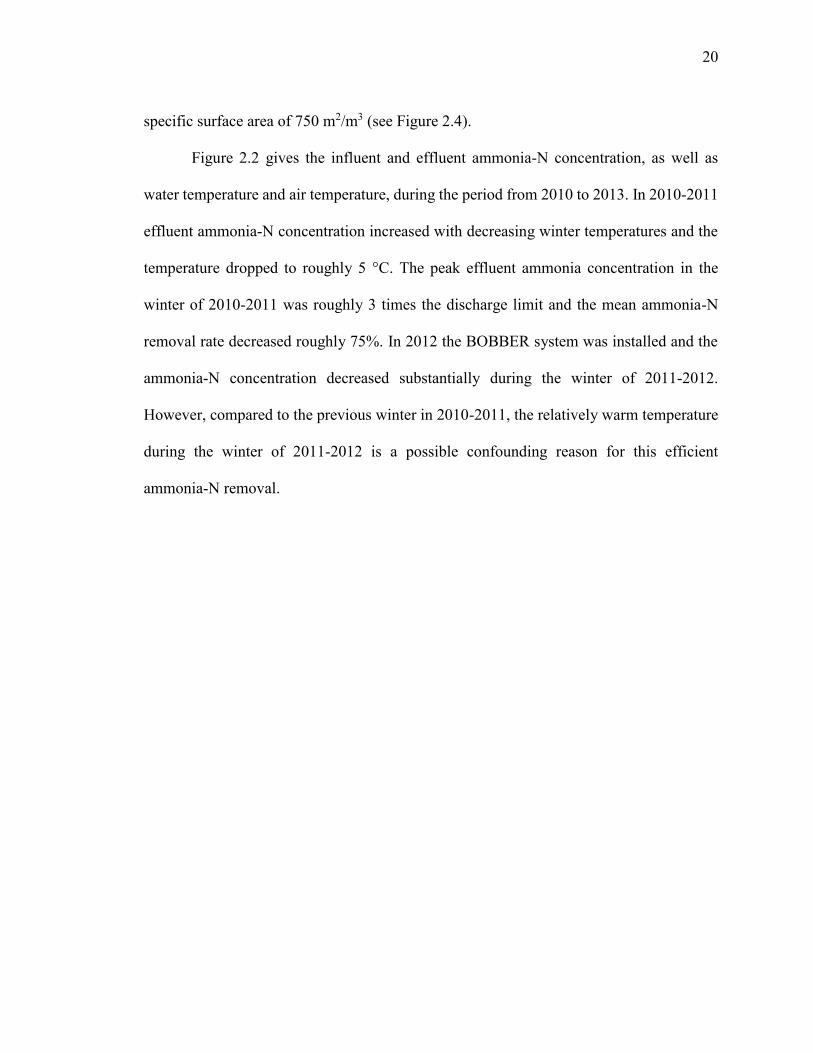
Figure 2.2 gives the influent and effluent ammonia-N concentration, as well as
water temperature and air temperature, during the period from 2010 to 2013. In 2010-2011
effluent ammonia-N concentration increased with decreasing winter temperatures and the
temperature dropped to roughly 5 °C. The peak effluent ammonia concentration in the
winter of 2010-2011 was roughly 3 times the discharge limit and the mean ammonia-N
removal rate decreased roughly 75%. In 2012 the BOBBER system was installed and the
ammonia-N concentration decreased substantially during the winter of 2011-2012.
However, compared to the previous winter in 2010-2011, the relatively warm temperature
during the winter of 2011-2012 is a possible confounding reason for this efficient
ammonia-N removal.

21
Figure 2.2. Influent and effluent ammonia-N (left vertical axis) at the Wingate WWTP as
a function of time (top panel). Superimposed on the top panel are onsite data of air and
water temperature (right vertical axis). Bottom panel illustrates the difference between
influent and effluent ammonia-N (NH3-N) as a function of time.

22
Figure 2.3. Digital image of “BOBBER” reactor (Left) and on-site “BOBBER” reactor at
Wingate Wastewater Treatment Plant (Right).

23
Figure 2.4. Kaldnes K1 and RK media, provided by Bradley Environmental.
2.2 Research Objective
Attached-growth systems appear to be less sensitive to cold weather conditions than
suspended-growth systems. As such, these systems may represent a viable alternative for
ammonia-N control in small wastewater treatment facilities. Therefore, in order to have a
better understanding of attached-growth nitrification in lagoon systems, a laboratory-scale
lagoon system was installed in the Environmental Engineering Laboratories at Purdue
University. In addition, a series of attached-growth batch experiments were conducted. The
objectives of this study were to:
Kaldnes K1 media RK media
24
i. Compare nitrification behavior at low temperature in real lagoon system using
full-scale BOBBER reactors with a laboratory-scale lagoon system using mini
BOBBER reactors.
ii. Investigate nitrification behavior under pure ammonia-N feeding without
carbon sources.
iii. Investigate the relationships between ammonia-N removal rate and ammonia-
N concentration in attached-growth systems at different temperatures.

25
CHAPTER 3. METHODS AND MATERIALS
3.1 Experimental Design and Procedures
In this research, a series of mini BOBBER experiments and attached-growth batch
experiments were carried out. The mini BOBBER systems were operated to simulate the
nitrification process at the Wingate lagoon system, and the attached-growth batch
experiments were designed to investigate the attached-growth ammonia-N removal rate
based on substrate concentration at different temperatures. Both types of media used in
these experiments were suspended at Wingate second lagoon for 2 weeks to establish the
nitrifier attached communities.
3.1.1 Mini BOBBER Experiments
In order to simulate the nitrification process at Wingate, two mini BOBBER
systems provided by Bradley Environmental were installed in a temperature controlled
room. Temperature in the room could be controlled in the range of 0 °C – 25 °C with the
variability controlled in 0.5 °C. The reactors were operated under the identical conditions,
in terms of reactor volume, temperature, influent composition, influent flow rate and
discharge rate, aeration rate, etc. BOBBER system 1 was operated with Kaldnes K1 media
with a specific surface area of 300 m2/m3 while the BOBBER system 2 was operated with
RK media with a specific attach area of 750 m2/m3. The two BOBBER reactors were

26
operated for 101 days with 4 temperature stages (20 °C, 15 °C, 10 °C, and 5 °C). For each
temperature stage, the performance of the system was allowed to approach a steady-state
condition. Figure 3.1 is a schematic illustration of the setup of the mini BOBBER
experiments.
Figure 3.1. Schematic of mini BOBBER experiments.
Synthetic wastewater (SWW) from the influent tank was pumped into two tanks
that included BOBBER reactors (See Figure 3.2 (a)) at a fixed flow rate (24.5 mL/min).
This flow rate was chosen to provide a hydraulic retention time of 14 days, which is
representative of the operation of the Wingate lagoon system. In order to keep influent and
discharge flow rate the same, the treated water was designed to overflow through a PVC
pipe (See Figure 3.2 (a)) to a floor drain.

27
The mini BOBBER reactor is pictured in Figure 3.2 (b). There were two air supplies:
air supply #1 provided aeration and drew water into the circulating part from the inlet at
the bottom; air supply #2 promoted circulation of water and media in the mini BOBBER
reactor. Both air supplies promoted O2 transfer, which was needed to offset O2 demand that
was attributable to the influent ammonia-N. Water was designed to spray out from outlet
on the top of mini BOBBER reactor.
Figure 3.2. Image of experiment design (a) Left, image of lab-scale lagoon system; (b)
Right, image of mini BOBBER reactor.
Experiments with the mini-BOBBER systems were conducted as follows:
1. Each tank was filled with 500 L synthetic wastewater (SWW, composition defined
below) and placed in a temperature-controlled room at an initial temperature of 20 °C.
Influent tank

28
2. Both types of media were inoculated with a mixed culture of bacteria from the
Wingate secondary lagoon, and subsequently the inoculated media (3.78 Liters of
media per tank) were placed in the two BOBBER reactors.
3. The influent tank was filled with SWW (Roughly 70 L per day) for a whole day before
service, and the peristaltic pump was set at the flow rate of 24.5 mL/min. Water
samples in influent tank and both mini BOBBER tanks were taken periodically to
measure pH, temperature, DO, ammonia-N, nitrite-N, and nitrate-N.
4. When the system had been operated under steady-state at 20 °C for 2 weeks, the
temperature was decreased to 15 °C. Then, following similar steps, the system was
subsequently decreased to 10 °C and 5 °C, respectively.
5. The system was operated at 5 °C for 46 days.
3.1.2 Attached-growth Batch Experiments
The schematic design of batch experiments was quite simple (See Figure 3.3). 6 L
SWW was added to each pail along with a specific volume of inoculated media. A magnetic
stir bar was put at the bottom of each pail to promote mixing. Additionally, air was pumped
into the systems at a fixed flow rate (1L air/min) from a compressed air supply. In these
experiments, only Kaldnes K1 media were applied.
Five sets of attached-growth batch experiments were conducted at 20 °C and two
sets were conducted at 5 °C. All experiments were operated as follows:
1. Cultivation of attached-growth media. In this step, 800 mL attached-growth media
were placed in a 2 L beaker. The floating attach medium was fed with SWW at a flow

29
rate of 9 mL/min. This system was kept at the target temperature for at least one week
to allow the microorganisms to adjust to their surroundings.
2. Preparation for attached-growth batch experiments. In this step, 6 L SWW was added
to each pail. Aeration and mixture were initiated 12 hours before adding the attached-
growth medium to allow temperature and DO to get to steady state.
3. Attached-growth experiments. A specific volume of attached-growth media was
transferred from the beaker to each pail. Samples were collected twice a day and were
analyzed for pH, temperature, DO, ammonia-N, nitrite-N, and nitrate-N
measurements.
Figure 3.3. Schematic of attached-growth batch experiment.

30
3.2 Materials and Analytical Methods
3.2.1 Synthetic Wastewater (SWW)
SWW was used for all experiments in this study. SWW containing roughly 40 mg/L
ammonia-N was prepared by dissolving ammonia chloride in dechlorinated tap water. This
ammonia-N loading was determined based on the average influent ammonia-N
concentration at Wingate lagoon system (See Figure 2.2). No organic carbon was included
in the SWW. The composition of Purdue tap water, as reported by the Purdue water utility
for some metals and other inorganic constituents, is included in Table 3.1 [48, 49].
Table 3.1. Composition of Purdue Tap Water with respect to common inorganic
constituents.
pH Alkalinity Calcium hardness Magnesium hardness Fe Mn Cu
N/A (mg/L as
CaCO3) (mg/L as CaCO3) (mg/L as CaCO3) (mg/L) (mg/L) (mg/L)
7 320 300 120 0.49 0.154 0.57
According to the Consumer Confidence Report provided by Purdue University
West Lafayette Campus Water Works, most nutrients required for nitrifiers growth are
included in Purdue tap water [48]. Furthermore, tap water was dechlorinated by sodium
bisulfite prior to use to minimize the influence of chlorine on microorganisms [50]. During
dechlorination, sodium bisulfite was added at a concentration of 10 mg/L to tap water to
create a stock solution. Sodium bisulfite was added in slight stoichiometric excess of

31
residual chlorine concentration to ensure complete dechlorination. Free chlorine and total
chlorine were measured by the DPD/KI Colorimetric Method [51]. Details of
dechlorination are provided in Appendix A.
3.2.2 Analytical Methods
Samples were collected for measurements of pH, DO, temperature, ammonia-N,
nitrite-N, and nitrate-N.
pH was measured by an Accumet model 50 pH/ion/conductivity meter (Fisher
Scientific) connected to a ROSS Ultra combination pH electrode (ORION). DO and
temperature were measured by a YSI 550A DO meter. Ammonia-N was measured by an
Accumet model 50 pH/ion/conductivity meter (Fisher Scientific) connected to a 95-12
ammonia electrode (ORION). The measurements and standards for ammonia-N are
described in Appendix B. Nitrite-N and nitrate-N were measured by an Ion
Chromatography (DIONEX) using an IonPac AS19 4*25 mm Analytical column (RFIC)
and the detail is depicted in Appendix C.

32
CHAPTER 4. RESULTS AND DISCUSSION
4.1 Mini BOBBER Experiments
The mini BOBBER experiments were conducted over a period of 101 days, during
which time the performance of each system was monitored using daily measurements of
influent and effluent quality. Operating parameters including pH, DO, and temperature
were measured daily, and remained stable during the entire experiment.
4.1.1 pH
Figure 4.1 illustrates time-course pH measurements from the mini BOBBER
experiments. The pH decreased from an initial value of roughly 8.5 to a range of 7.0 to 7.5
within roughly 10 days of initiation of the experiment, which was appropriate for nitrifier
growth.
Equations (1) and (2) indicate consumption of alkalinity of 7.1 mg/L as CaCO3 for
every 1 mg/L of ammonia-N. Therefore, with an average ammonia-N loading at 40 mg/L
as ammonia-N, the alkalinity consumption would be 283 mg/L as CaCO3. The alkalinity
in tap water received in these experiments was reported to be 320 mg/L as CaCO3 [49].
Therefore, much of alkalinity in tap water was consumed by the nitrification process. The
product water yielded a near-neutral, stable pH condition

33
Figure 4.1. Time-course measurements of pH in the mini BOBBER experiments. Also
included is the average water temperature during each stage of the
experiment; the vertical, dashed lines indicate dates at which room
temperature was changed.
4.1.2 Temperature
Time-course measurements of air and water temperature in the constant
temperature room during the mini BOBBER experiments are illustrated in Figure 4.2. Over
the course of this experiment, temperature was decreased step by step from 19.6 °C to
4.6 °C, in roughly 5 °C increments. In the first stage, average air temperature was roughly
1.5 °C higher than average water temperature (19.6 °C). As temperature decreased, the
difference between air temperature and water temperature started to decrease. However, as
temperature decreased, air temperature in the temperature controlled room was more
vulnerable to heat exchange when the door to the room was opened, which led to more
6
6.5
7
7.5
8
8.5
9
0 20 40 60 80 100 120
feeding tank
Kaldnes K1media
RK media
pH
Time (days)
19.7°C 14.3°C
9.6°C
4.6°C
34
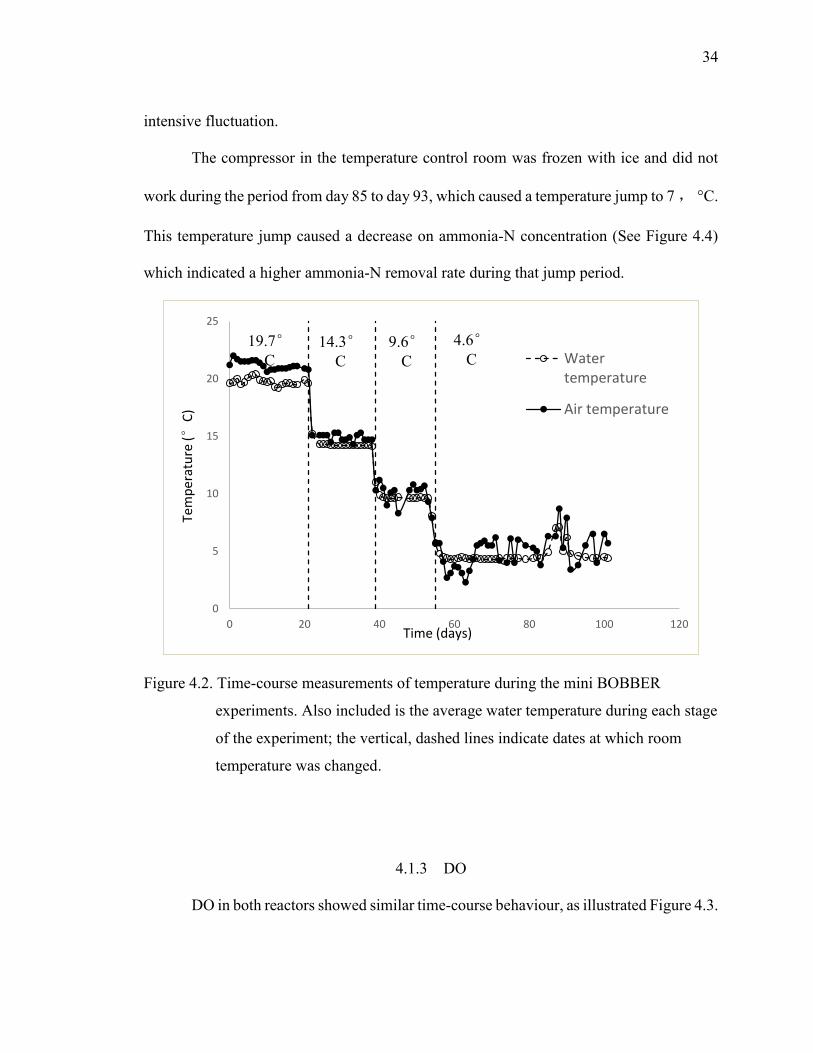
intensive fluctuation.
The compressor in the temperature control room was frozen with ice and did not
work during the period from day 85 to day 93, which caused a temperature jump to 7 , °C.
This temperature jump caused a decrease on ammonia-N concentration (See Figure 4.4)
which indicated a higher ammonia-N removal rate during that jump period.
Figure 4.2. Time-course measurements of temperature during the mini BOBBER
experiments. Also included is the average water temperature during each stage
of the experiment; the vertical, dashed lines indicate dates at which room
temperature was changed.
4.1.3 DO
DO in both reactors showed similar time-course behaviour, as illustrated Figure 4.3.
0
5
10
15
20
25
0 20 40 60 80 100 120
Watertemperature
Air temperature
Tem
per
atu
re (°
C)
Time (days)
19.7°C
14.3°C
9.6°C
4.6°C

35
So the impact on DO by both types of media should be same.
In general, the DO concentration in the two mini BOBBER systems were quite
uniform, and close to the equilibrium DO concentration corresponding to each water
temperature condition. Equilibrium dissolved oxygen concentration for each of the four
temperature conditions are included in Figure 4.3 for comparison. However, a sink in DO
was observed in first 10 days of the experiment (Figure 4.3). The primary reason for DO
depletion during this stage of the experiment is believed to be the rapid changes in the
nitrifier population, which was attributable to the high initial ammonia-N concentration in
the mini BOBBER tanks. Therefore, DO measurements from the first 10 days of the
experiment were not included in the calculation for average DO for each stage.
Similar to Figure 4.2, DO in Figure 4.3 also had 4 stages respected to temperature
change. As discussed in 1.2.3.1, saturated DO increases when temperature decreases. As a
result, saturated DO in mini BOBBER experiments should also experience 4 stages. The
average real DO and equilibrium DO (calculated from Figure 1.2) under 4 temperature
conditions were listed in Table 4.1.
Table 4.1. Average Measured DO and Equilibrium DO at different temperature.
Temperature ( °C) Real DO (mg/L) Equilibrium DO
(mg/L)
19.7 8.72 9.15
14.3 10.54 10.24
9.6 12.06 11.40
4.6 12.59 12.90
According to Eq. (1) and Eq. (2), the consumption of DO by 1 mg/L as ammonia-
N was 4.27 mg/L. So with an average ammonia-N loading at 40 mg/L as ammonia-N, the

36
total DO demand for a single BOBBER reactor should be 1411.2 mg/day. However, no
distinct discrepancy between measured DO and equilibrium DO was observed from Figure
4.3 and Table 4.1. This implies that O2 transfer for the aeration system was sufficient to
meet the O2 demand expressed by the nitrifying bacteria. Therefore, DO is not growth
limiting in the mini BOBBERs experiment. Additionally, the DO concentration in the tank
with Kaldnes K1 media started to be consistently lower than in the tank with the RK media
during the lowest temperature period. The possible reason for this is the difference in
mixing behaviour caused by the size and shape diversity between two types of media.
Figure 4.3. Time-course measurements of DO in the mini BOBBER experiments. Also
included are equilibrium DO concentrations corresponding to average water
temperature in each stage of the experiment.
4.1.4 Ammonia-N
Figure 4.4 illustrates time-course measurements of ammonia-N concentration for
the mini BOBBER experiments. Ammonia-N concentration showed a rapid decline during
5
6
7
8
9
10
11
12
13
14
15
0 20 40 60 80 100 120
Kaldnes K1media
RK media
Equilibrium DODis
solv
ed
oxy
gen
(m
g/L)
Time (days)
19.7
°C
14.3
°C
9.6
°C
4.6
°C

37
the first 10 days of the experiment. Then ammonia-N concentration reached steady-state
roughly at first temperature stage. Comparatively small changes of ammonia-N
concentration were observed during the three subsequent temperature stages (See Figure
4.4).
The rapid ammonia-N concentration decrease during the first 10 days of the
experiment was probably due to a rapid increase of the concentration of nitrifiers, which
was promoted by a high initial ammonia-N concentration (roughly 45 mg/L as ammonia-
N). As described above, this period was also characterized by a rapid decrease of DO. For
reasons similar to the description provided above, average ammonia-N concentration in the
effluent was calculated without data from the first 10 days of the experiment.
The average ammonia-N concentration in both mini BOBBER tanks during the four
stages of the experiment are listed in Table 4.2. As temperature decreased, the average
ammonia-N concentration increased slightly. However, effluent ammonia-N concentration
was consistently well below the permit limitation values that are imposed on most
municipal WWTPs.

38
Table 4.2. Average ammonia-N concentration in both mini BOBBER tanks.
Ammonia-N (mg/L)
Temperature ( °C) Kaldnes K1 media RK media
19.7 0.76 0.81
14.3 0.80 0.77
9.6 0.91 0.98
4.6 1.50 1.43
0.00
10.00
20.00
30.00
40.00
50.00
60.00
0 20 40 60 80 100 120
Feeding tank
Kaldnes K1 media
RK media
Am
mo
nia
co
cnet
rati
on
(mg/
L as
N)
time (days)
19.7
°C
14.3
°C
9.6
°C
4.6
°C

39
Figure 4.4. Ammonia-N data of mini BOBBER experiments. Also included are daily
ammonia-N concentrations of both mini BOBBER systems corresponding to
average water temperature in each stage of the experiment. Upper panel gives
the general ammonia-N concentration in both feeding tank and reactor, while
the lower panel gives a more detailed ammonia-N concentration in the reactor
with small vertical scale.
4.1.5 Nitrite-N and Nitrate-N
Time-course measurements of Nitrite-N and nitrate-N for the mini BOBBER
experiments are illustrated in Figure 4.5. The nitrite-N and nitrate-N concentrations in the
reactor with Kaldnes K1 media achieved equilibrium faster than the reactor with RK media.
The possible reason for this is the different media type used. Since Kaldnes K1 media is
0.00
0.50
1.00
1.50
2.00
2.50
3.00
3.50
4.00
0 20 40 60 80 100 120
Kaldnes K1 media
RK mediaA
mm
on
ia c
ocn
etra
tio
n (m
g/L
as N
)
time (days)
19.7°C
14.3°C
9.6°C
4.6°C

40
smaller in size, the mixing for Kaldnes K1 media could be more efficient, which could lead
to faster consumption of ammonia-N.
However, as the initial ammonia-N in both reactors were depleted, nitrite-N and
nitrate-N in both reactors achieved steady-state concentration. Additionally, merely all
nitrite-N in both reactors were converted to nitrate-N. In this case, ammonia-N loading
seemed to be the growth limiting factor and the surface area for both types of media were
not fully utilized. Therefore, in spite of the difference in specific surface area for both types
of media, the steady-state nitrite-N and nitrate-N concentrations in both media are very
close.
Figure 4.5. Nitrite-N and nitrate-N data of mini BOBBER experiments. Also included are
daily nitrite-N and nitrate-N concentrations of both mini BOBBER systems
corresponding to average water temperature in each stage of the experiment.
0.00
5.00
10.00
15.00
20.00
25.00
30.00
35.00
40.00
45.00
50.00
0 20 40 60 80 100 120
nitrate-N KaldnesK1 media
nitrate-N RK media
nitrite-N Kaldnes K1media
nitrite-N RK media
Co
nce
ntr
atio
n (m
g/L
as N
)
Time (days)
19.7°C
14.3°C
9.6°C
4.6°C

41
4.1.6 Nitrogen Balance
Nitrogen balances were conducted for both mini BOBBER reactors based on the
assumptions that all nitrogen in the system existed as ammonia-N, nitrite-N, and nitrate-N.
Therefore, the nitrogen balance calculations were conducted under the assumption that no
molecular nitrogen (N2) or other forms of nitrogen (e.g., N2O) were present in the system.
No measurements of N2 or N2O were included in this research. Therefore, formation of N2
or N2O in the liquid phase, or escape of these compounds from the liquid phase to the gas
phase was not accounted for in this model. Based on these assumptions, a nitrogen balance
was developed as shown in Eq. (9):
Ctotal,N=Cammonia,N+Cnitirite,N+Cnitrate,N (9)
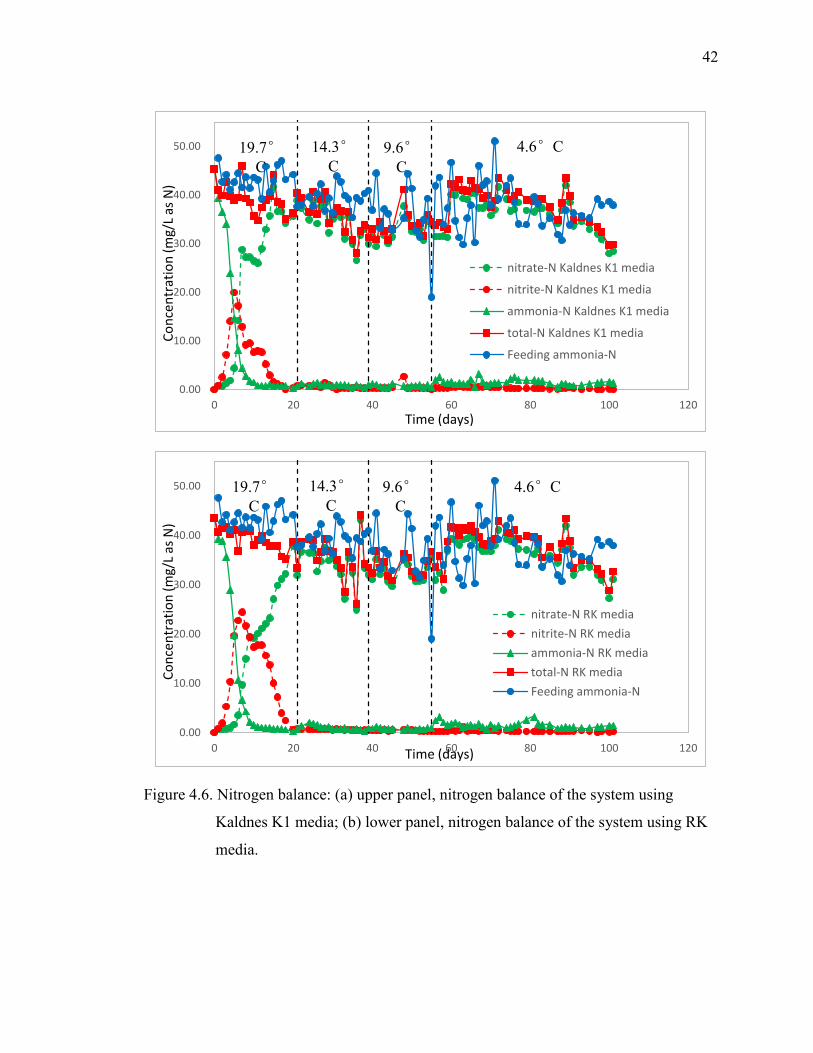
Figure 4.6 illustrates the time-course behavior of Ctotal,N from these nitrogen balance
calculations for both reactors. The total nitrogen for both systems was dominated by
nitrate-N for the majority of the period of these experiments, exclusive of the induction
period (first 10-15 days), even after the temperature was reduced to 4.6 °C. This indicates
that the BOBBER reactors with both types of media were able to convert most ammonia-
N to nitrate-N at this ammonia-N loading, even under low temperature conditions.
42
Figure 4.6. Nitrogen balance: (a) upper panel, nitrogen balance of the system using
Kaldnes K1 media; (b) lower panel, nitrogen balance of the system using RK
media.
0.00
10.00
20.00
30.00
40.00
50.00
0 20 40 60 80 100 120
nitrate-N Kaldnes K1 media
nitrite-N Kaldnes K1 media
ammonia-N Kaldnes K1 media
total-N Kaldnes K1 media
Feeding ammonia-N
Co
nce
ntr
atio
n (m
g/L
as N
)
Time (days)
19.7°C
14.3°C
9.6°C
4.6°C
0.00
10.00
20.00
30.00
40.00
50.00
0 20 40 60 80 100 120
nitrate-N RK media
nitrite-N RK media
ammonia-N RK media
total-N RK media
Feeding ammonia-N
Co
nce
ntr
atio
n (m
g/L
as N
)
Time (days)
19.7°C
14.3°C
9.6°C
4.6°C

43
4.1.7 Specific Ammonia-N Removal Rate
Calculations of ammonia removal rate were conducted by application of the
principles of mass balance, using the same assumptions described in 4.1.6. In addition, the
reactor systems were each assumed to be well-mixed and only the media surface were
counted in the calculation. For these calculations, each BOBBER reactor system was
treated as a control volume. Eq. (10) describes the dynamic behaviour of ammonia-N in
each reactor system:
∀dS
dt=QS
f-QS-q (10)
Where: S = substrate (NH3-N) concentration in the reactor (mg/L as N), Q = volumetric
flow rate of the system (L/day), Sf = substrate concentration in the feed tank (mg/L as N),
q = substrate removal rate (mg N/day).
The change of substrate concentration from t to t+Δt day was approximated by a
finite-difference approximation, as described in Eq. (11). The substrate concentration at a
given time was calculated as the average of successive values, as described by Eq. (12):
dS
dt≈(St+∆t-St)
∆t (11)
S≈St+∆t+St
2 (12)
Where: St = substrate concentration at t days (mg/L as N), Δt = time interval (1 day, in
this case).
Substituting Eq. (11) and Eq. (12) into Eq. (10) and rearranging allows development
that yields an estimate of the substrate removal rate as a function of time (Eq. (13)):
q=Q (Sf-St+∆t+St
2) -∀ (
(St+∆t-St)
∆t) (13)

44
The specific ammonia-N removal rate was estimated by dividing the ammonia-N
removal rate by specific surface area of the media in the control volume.
Figure 4.7 illustrates the specific ammonia-N removal rate as a function of time for
both reactor systems over the course of this experiment. Table 4.3 provides a summary of
the mean and standard deviation of the specific ammonia-N removal rate for both systems
in all four phases of the experiment. Collectively, these summaries indicate that the two
systems achieved similar ammonia-N removal rates after the initial period of acclimation.
Temperature did not appear to alter the rate of ammonia-N removal substantially under this
operating condition.
Table 4.3. Average specific ammonia-N removal rate at different temperatures.
Specific ammonia-N removal rate (g/day/m2)
Temperature Kaldnes K1 media RK media
19.7 C 1.41+0.23 0.59+0.13
14.3 C 1.14+0.17 0.46+0.07
9.6 C 1.07+0.20 0.43+0.06
4.6 C 1.07+0.32 0.42+0.12
Media surface area
(m2) 1.14 2.85

45
Figure 4.7. Specific ammonia-N removal rate of mini BOBBER experiments. Also
included the average specific ammonia-N removal rate during each
temperature stage.
According to Table 4.1 and Figure 4.7, the discrepancy on specific ammonia-N
removal rate between Kaldnes K1 media and RK media was caused by the different specific
area they have. RK media had a larger specific surface area than Kaldnes K1 media.
However, the ammonia-N removal rate for both media types were observed to be
essentially identical. As a result, the specific ammonia-N removal rate of RK media should
be smaller since the same ammonia-N removal rate as Kaldnes K1 media was divided by
a relatively larger specific surface area. Also recall from 4.1.5 and 4.1.6 that the surface
area of both types of media were not fully utilized during this experiment. Therefore, in
0.00
0.50
1.00
1.50
2.00
2.50
3.00
3.50
4.00
4.50
5.00
0 20 40 60 80 100 120
KaldnesK1 mediaRK media
Spec
ific
am
mo
nia
-Nre
mo
val r
ate
(g/d
ay/m
2)
Time (days)
19.7°C
14.3°C
9.6°C
4.6°C

46
the future application, attached-growth media could be utilized more efficiently if they are
applied with proper volume with regard to the specific ammonia-N loading.
4.2 Nitrification at Wingate Lagoon System
Installation of the BOBBER reactors in the second lagoon at the Wingate was
completed in October 2011. Water quality data for the influent and effluent of the Wingate
lagoon system was collected once every two weeks by Bradley Environmental. Included
in this data set were measurements of influent and effluent ammonia-N (see Figure 2.2).
The specific ammonia-N removal rate (for each measurement) at Wingate was
calculated using a mass balance approach, and analogous assumptions to those described
above for the laboratory experiments with the mini BOBBER systems. These assumptions
included: the lagoon system was at steady-state during each sample interval; nitrogen only
existed in forms of ammonia-N, nitrite-N, nitrate-N; no loss of nitrogen in other forms to
air nor other phases; and the lagoons were each well-mixed. The specific ammonia-N
removal rate at the Wingate lagoon system was calculated using Eq. (14).
q=Q(Sin-Sout)
AV (14)
The ammonia-N removal fraction was calculated by Eq. (15).
removal fraction=Sin-Sout
Sin (15)
Where: Sin= influent substrate concentration (mg/L as N), Sout = influent substrate
concentration (mg/L as N), Q = volumetric flow rate of the system (L/day), A = specific

47
surface area of the attached media (m2 /m3 media), q = substrate removal rate (mg/day as
ammonia-N), V= volume of attached media (m3 media).
4.2.1 Improvement on Ammonia-N Removal by Application of BOBBER Reactors
As described above, the BOBBER reactors were installed in October 2011 in the
Wingate second lagoon, so only influent and effluent ammonia-N concentration for the
second lagoon were used to calculate specific ammonia-N removal rate. Furthermore, only
the data collected at low temperatures were presented to illustrate the improvement on low
temperature nitrification. Table 4.4 provides a summary of average influent and effluent
ammonia-N concentrations, temperatures, and ammonia-N removal fractions (calculated
from each set of measurement) before and after the installation of BOBBER reactors.
Clearly, ammonia-N removal improved under low temperature conditions after the
BOBBERs were installed. The observed average ammonia-N removal rate at low
temperatures was improved from 27% to 74% with the application of BOBBER reactors.

48
Table 4.4. Ammonia-N removal fractions before and after installation of BOBBER
reactors.
Temperature
( °C)
Sin
(mg/L as N)
Sout
(mg/L as N)
Removal
(%)
Without
BOBBER
reactors
4.7 16.7 9.12 45%
6.5 20.9 13.1 37%
6 21.5 20.6 4%
5.7 24.7 19.3 22%
With
BOBBER
reactors
7 3.2 0.17 95%
4.5 17.94 3.1 83%
3.5 25 6.3 75%
3.7 23 9.4 59%
5.2 19 7.6 60%
4.3 24.5 7.1 71%
4.4 26.3 7.5 71%
5.4 24.6 5.4 78%
5.5 20 5.3 74%
4.2.2 Nitrification at Low Temperatures with BOBBER Reactors
The specific ammonia-N removal rate at the Wingate lagoon system under low
temperature conditions is summarized in Table 4.5. Data collected during warm periods
were not included since most of ammonia-N were removed in Wingate first lagoon when
temperature was mild. And Kaldnes K1 media was assumed to be the only surface that
nitrifiers would attach on.
The second column in Table 4.5 lists the bulk ammonia-N concentration in second
lagoon at Wingate. As compared to the bulk ammonia-N concentration in mini BOBBER

49
experiments at 5 °C (1.5 mg/L), the bulk ammonia-N concentration in Wingate second
lagoon at 5 °C (11.1 mg/L) was much higher. Possible explanations for this will be
presented in 4.4.
From Table 4.3 and Table 4.5, specific ammonia removal rate at 5 °C observed at
the Wingate second lagoon (approximately 74%) was smaller than the specific ammonia
removal rate at 5 °C observed from mini BOBBER experiments (Over 95%). One possible
reason is that the ammonia-N loading at the Wingate is less than the ammonia-N loading
used in the mini-BOBBER experiment.
Table 4.5. Specific ammonia-N removal rate at Wingate second lagoon.
Temperature
( °C)
Ammonia-N concentration
(mg/L)
Removal
(%)
removal rate
(g/day/m2)
4.5 7.01 82.7% 0.54
3.5 12.1 74.8% 0.56
3.7 14.7 59.1% 0.79
5.2 11.5 60.0% 0.37
4.3 12.3 71.0% 0.47
4.4 13.5 71.5% 0.70
5.4 11.5 78.0% 0.86
5.5 6.1 73.5% 1.01
4.3 Attached-Growth Batch Experiment
Attached-growth batch experiments were conducted at 20 °C and 5 °C.
Experiments at both temperatures showed a zero-order relationship between ammonia-N
concentration and ammonia-N removal rate. However, different removal rates were
50
observed under different temperatures.
4.3.1 Attached-growth Batch Experiments at 20 °C
Attached-growth batch experiments at 20 °C without nitrogen balance
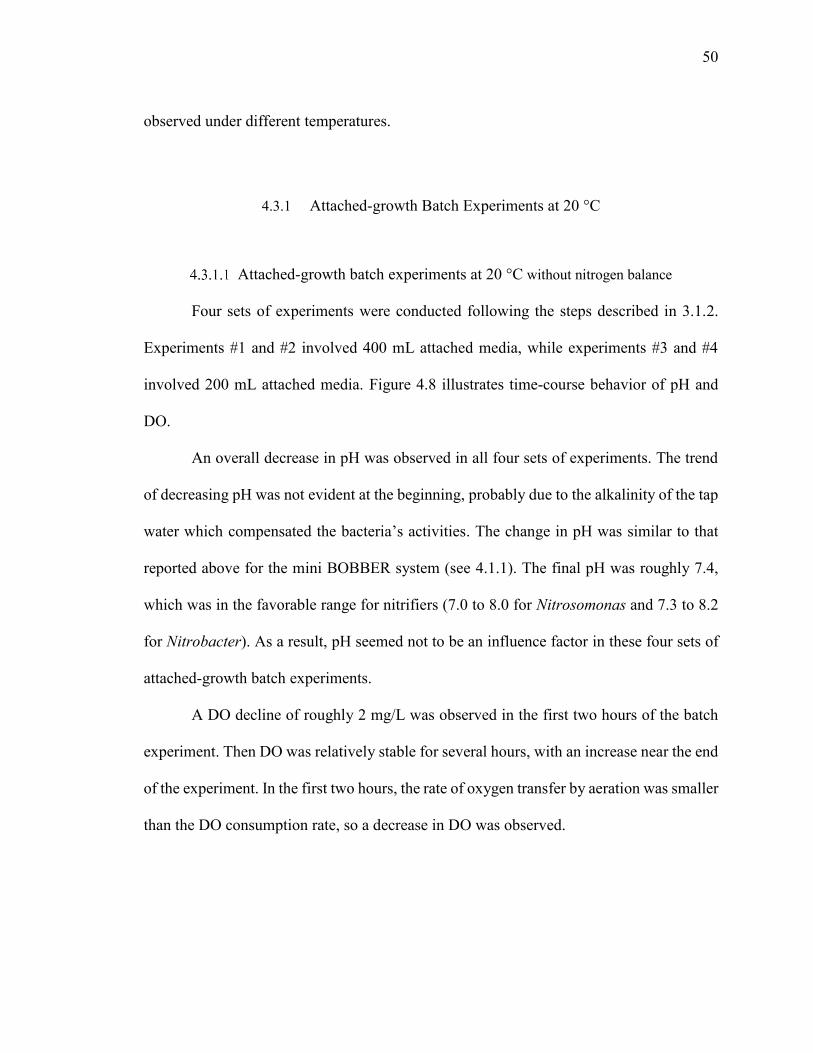
Four sets of experiments were conducted following the steps described in 3.1.2.
Experiments #1 and #2 involved 400 mL attached media, while experiments #3 and #4
involved 200 mL attached media. Figure 4.8 illustrates time-course behavior of pH and
DO.
An overall decrease in pH was observed in all four sets of experiments. The trend
of decreasing pH was not evident at the beginning, probably due to the alkalinity of the tap
water which compensated the bacteria’s activities. The change in pH was similar to that
reported above for the mini BOBBER system (see 4.1.1). The final pH was roughly 7.4,
which was in the favorable range for nitrifiers (7.0 to 8.0 for Nitrosomonas and 7.3 to 8.2
for Nitrobacter). As a result, pH seemed not to be an influence factor in these four sets of
attached-growth batch experiments.
A DO decline of roughly 2 mg/L was observed in the first two hours of the batch
experiment. Then DO was relatively stable for several hours, with an increase near the end
of the experiment. In the first two hours, the rate of oxygen transfer by aeration was smaller
than the DO consumption rate, so a decrease in DO was observed.

51
Figure 4.8. Time-course pH (upper) and DO (lower) measurements of attached-growth
batch experiments at 20 °C without nitrogen balance. Two sets of experiment
with 400 mL media and the other two sets with 200 mL media.
Figure 4.9 illustrates the time-course behavior of ammonia-N concentration. The
derivative of ammonia-N concentration with respect to time gave the substrate removal
7
7.2
7.4
7.6
7.8
8
8.2
8.4
0 5 10 15 20 25 30
#1 400 mL medium
#2 400 mL medium
#3 200 mL medium
#4 200 mL medium
pH
Time (hours)
4
4.5
5
5.5
6
6.5
7
7.5
8
8.5
9
0 5 10 15 20 25 30
#1 400 mL medium
#2 400 mL medium
#3 200 mL medium
#4 200 mL medium
Time (hours)
Dis
solv
ed
oxy
gen
(m
g/L)

52
rate. According to Figure 4.9, it was evident that ammonia-N concentration had linear
relationship with ammonia-N concentration even when the ammonia-N concentration
decreased to 2% initial concentration. This linear relationship indicated that ammonia-N
removal rate was independent of ammonia-N concentration. As a result, the nitrification
process could be treated as zero-order process for the range of ammonia-N concentrations
(mg/L as N) used in this study: 45 mg/L to as low as 1 mg/L.
Figure 4.9. Time-course ammonia-N concentration measurements of attached-growth
batch experiments at 20 °C without nitrogen balance. Two sets of experiment
with 400 mL media and the other two sets with 200 mL media.
Attached-growth batch experiments at 20 °C with nitrogen balance
This experiment was conducted following the procedures described in 3.1.2.
Changes of pH and DO over time are illustrated in Figure 4.10. Changes in pH were similar
y = -3.3676x + 43.793R² = 0.9984
y = -2.7555x + 40.717R² = 0.9992
y = -1.7393x + 40.508R² = 0.9985
y = -1.5574x + 40.021R² = 0.9989
0
5
10
15
20
25
30
35
40
45
50
0 5 10 15 20 25 30
#1 400 mL medium
#2 400 mL medium
#3 200 mL medium
#4 200 mL medium
Am
mo
nia
-N c
on
cen
trat
ion
(mg/
L as
N)
Time (hour)

53
to those observed and discussed in 4.3.1.1. As to DO, the decrease in DO was not observed
at the beginning of this experiment since the initial DO was not at saturated level
(According to Figure 1.2, the saturated DO concentration at 20 °C should be 9.07 mg/L).
However, the behavior of DO in the rest of experiment time was similar to the discussion
in 4.3.1.1.
Figure 4.10. Time-course pH and DO measurements of attached-growth batch
experiments at 20 °C with nitrogen balance.
Figure 4.11 illustrates the time-course behavior of the concentration of various
forms of N, including ammonia-N, nitrite-N, nitrate-N, and total-N (the sum of ammonia-
N, nitrite-N, and nitrate-N). The ammonia-N removal rate was essentially constant (zero-
order), as with the experiment discussed in 4.3.1.1. Slow but steady accumulation of nitrite-
N was observed, which indicates the nitrite oxidizing process was the rate limiting process
at 20 °C. As to total-N, the slow decrease of total-nitrogen indicated that there might be
5
5.5
6
6.5
7
7.5
8
8.5
6
6.2
6.4
6.6
6.8
7
7.2
7.4
7.6
7.8
8
0 5 10 15 20 25 30
pH
DO
pH
Time (hours)
Disso
lved
oxygen
(mg/L
)

54
other pathways for nitrogen, such as ammonia volatilization and assimilation by
microorganisms.
Figure 4.11. Time-course behavior of measured forms of N in attached-growth batch
experiments at 20 °C.
4.3.2 Attached-growth Batch Experiments at 5 °C
Two sets of attached-growth batch experiments were conducted at 5 °C. Figure 4.12
illustrates time-course changes of DO and pH for these experiments. pH change showed
similar behavior as what was observed and discussed in attached-growth batch experiments
at 20 °C.
y = -1.4678x + 43.074R² = 0.9964
0.00
5.00
10.00
15.00
20.00
25.00
30.00
35.00
40.00
45.00
50.00
0 5 10 15 20 25 30
Ammonia-N
nitrite-N
nitrate-N
Total-N
Subst
rate
conce
ntr
atio
n(m
g/L
as
N)
Time (hour)

55
Changes in DO concentration were smaller in this experiment than in the
experiment at 20 C, and the DO concentration was substantially higher in the low-
temperature experiment, which could be contributable to the greater solubility of O2 in
water at low temperature. The equilibrium DO concentration at the average temperature of
this experiment (4.6 °C) is 12.92 mg/L (Obtained from Figure 1.2). The observed average
DO in the 5 °C attached-growth batch experiments was 12.89 mg/L. Therefore, the DO
concentration was essentially at the equilibrium condition for this experiment. One factor
that may have contributed to this was the relatively slow DO consumption rate by nitrifying
bacteria at 4.6 °C.
Figure 4.12. pH and DO to time relationships for attached-growth batch experiments at
5 °C.
0
2
4
6
8
10
12
14
6
6.5
7
7.5
8
8.5
9
0 20 40 60 80 100 120 140
pH #1
pH #2
DO#1
DO #2
pH
Time (hours)
Disso
lved
oxygen
(mg/L
)

56
Figure 4.13 illustrates time-course measurements of N (ammonia-N, nitrite-N,
nitrate-N, and total-N) concentration. The pattern of ammonia-N concentration was
consistent with a zero-order process, but the rate dropped to roughly 20% of the rate at
20 °C. This was reasonable because nitrifiers were highly temperature sensitive as
discussed in 1.2.3.3. Furthermore, there was no detectable nitrite-N during these
experiments at 5 °C, so nitrite oxidizing process should not be the rate limiting process at
5 °C as compared to the observation in 4.3.1.2, which indicating that the Nitrobacter are
less sensitive to temperature change. Slow decrease in total-nitrogen was also observed in
the experiments at 5 °C, however, the observed decrease rate was halved.
Figure 4.13. Substrate concentration to time relationship for attached-growth batch
experiments at 5 °C with nitrogen balance.
y = -0.3583x + 45.934R² = 0.9886
y = -0.3772x + 46.643R² = 0.9957
0.00
5.00
10.00
15.00
20.00
25.00
30.00
35.00
40.00
45.00
50.00
0 20 40 60 80 100 120 140
ammonia-N #1
ammonia-N #2
nitrate-N #1
nitrate-N #2
total-N #1
total-N #2
Su
bst
rate
conce
ntr
atio
n(m
g/L
as
N)
Time (hour)

57
4.3.3 Specific Ammonia-N Removal Rate in Attached-growth Batch Experiments
Table 4.6 presents a summary of the results of the seven attached-growth batch
experiments. The specific ammonia removal rate was calculated by the Eq. (16):
𝑞 =𝑅𝑉
𝐴𝑉𝑚 (16)
Where: A = specific surface area of the attached media (m2/mL media), R = ammonia-N
removal rate (mg/hour/L as ammonia-N), Vm= the volume of attached media (mL media),
V = the volume of SWW in batch reactor, q = specific ammonia-N removal rate
(mg/hour/m2 as ammonia-N). R was calculated as the negative of slope of ammonia-N
concentration as function of time from Figure 4.9, Figure 4.11, and Figure 4.13.
Table 4.6. Specific ammonia-N removal rate in attached-growth batch experiments.
experiment number 20 °C
#1
20 °C
#2
20 °C
#3
20 °C
#4
20 °C
#5
5 °C
#1
5 °C
#2
Temperature ( °C) 23.1 23.1 22.7 22.6 22.6 4.6 4.5
medium volume (mL) 400 400 200 200 200 200 200
Media surface area
(m2) 0.12 0.12 0.06 0.06 0.06 0.06 0.06
Substrate removal rate
(mg/L/hour) 3.37 2.76 1.74 1.56 1.47 0.36 0.38
Specific removal rate
(mg/m2/hour) 168 138 174 156 147 36 38

58
4.4 Comparison Between Mini BOBBER System and Real BOBBER System
In the mini BOBBER experiments, efficient ammonia-N removal were achieved at
various temperatures from 4.6 °C to 19.6 °C. The observed ammonia-N removal was over
95%, even at 4.6 °C. However, ammonia-N removal at the Wingate second lagoon where
the BOBBERs were installed was less efficient (approximately 71%). The average specific
ammonia-N removal rate (at temperature 5 °C) at Wingate second lagoon was 0.66
g/day/m2. And the average specific ammonia-N removal rate (at temperature 5 °C level)
observed from mini BOBBER experiments was 1.07 g/day/m2.
Possible reasons for the discrepancy between observations from mini BOBBER
experiments and Wingate second lagoon are as following:
The mini BOBBER system was fed with pure ammonia solution without
organic carbon. However, the existence of organic carbon and heterotrophs in
real lagoon systems could hinder nitrification.
According to Table 4.4, the influent ammonia-N concentration into the second
lagoon at Wingate was roughly 20 mg/L as N in cold-weather periods (During
warm periods, the influent ammonia-N concentration into the second lagoon
was round 2 mg/L as N). However, the feeding concentration used in mini
BOBBER experiments was around 40 mg/L as ammonia-N. The lower
ammonia-N loading could contribute to the lower ammonia-N removal rate at
Wingate. For example, if the ammonia loading is lower than the nitrification
rate, the nitrifiers will consume most of the ammonia-N, and the effluent
ammonia-N will be low.

59
Nitrifiers in the mini BOBBER experiments were fed with a relatively stable
ammonia-N loading. However, the ammonia-N loading at Wingate second
lagoon was not so stable. During warm periods, almost all ammonia-N was
oxidized in lagoon 1 and the influent ammonia-N concentration into the second
lagoon was only around 2 mg/L (ammonia-N loading for mini BOBBER
experiments was 40 mg/L). So the accumulation of nitrifiers was much slower
and the nitrifying bacteria population stayed at relatively low level, as
compared to mini BOBBER system. When temperature decreased, the
ammonia-N loading in the Wingate second lagoon increased, possibly because
there were not enough nitrifiers to deal with the large ammonia-N loading. As
a result, the ammonia-N removal rate would decrease.
As rapid growth of nitrifying bacteria in a short period of time is not possible
even with sufficient ammonia-N. The average bulk ammonia-N concentration
in Wingate second lagoon (at temperature 5 °C level) was 11.1 mg/L, while the
average bulk ammonia-N concentration in mini BOBBER system (at
temperature 5 °C level) was approximately 1.5 mg/L. According to the
relatively low ammonia-N removal rate with a higher bulk ammonia-N
concentration observed at Wingate second lagoon, the main cause of this
should be lack of nitrifying bacteria.
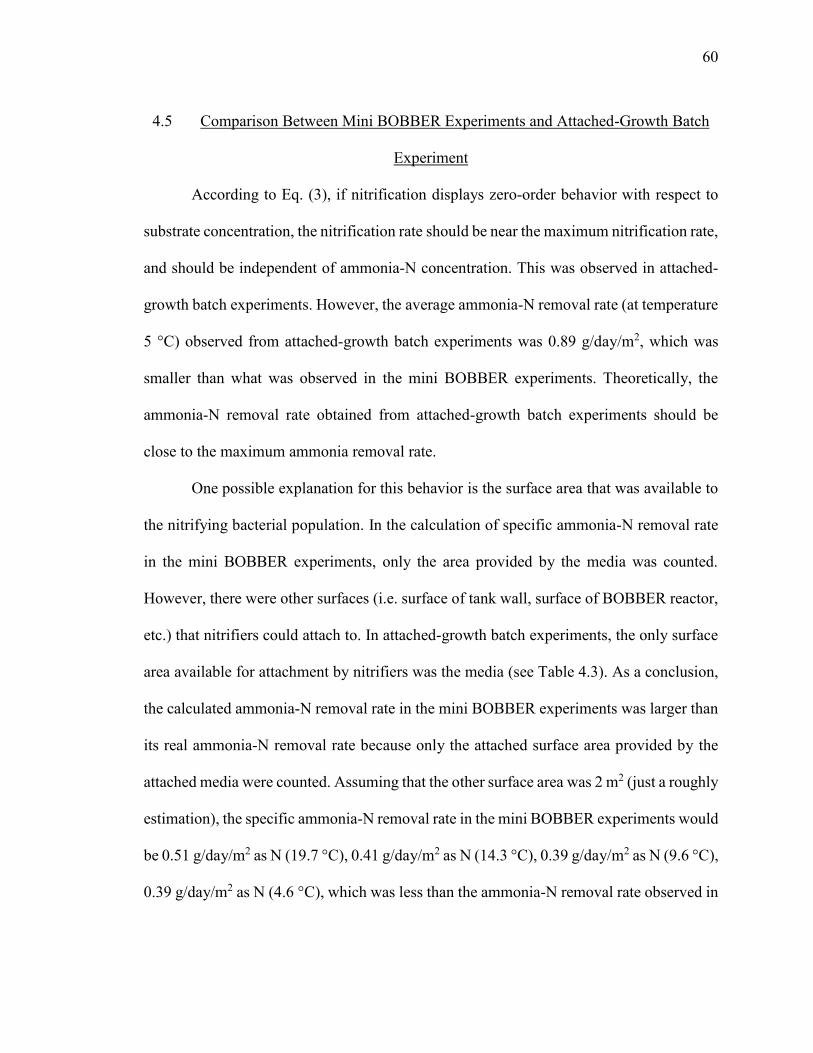
60
4.5 Comparison Between Mini BOBBER Experiments and Attached-Growth Batch
Experiment
According to Eq. (3), if nitrification displays zero-order behavior with respect to
substrate concentration, the nitrification rate should be near the maximum nitrification rate,
and should be independent of ammonia-N concentration. This was observed in attached-
growth batch experiments. However, the average ammonia-N removal rate (at temperature
5 °C) observed from attached-growth batch experiments was 0.89 g/day/m2, which was
smaller than what was observed in the mini BOBBER experiments. Theoretically, the
ammonia-N removal rate obtained from attached-growth batch experiments should be
close to the maximum ammonia removal rate.
One possible explanation for this behavior is the surface area that was available to
the nitrifying bacterial population. In the calculation of specific ammonia-N removal rate
in the mini BOBBER experiments, only the area provided by the media was counted.
However, there were other surfaces (i.e. surface of tank wall, surface of BOBBER reactor,
etc.) that nitrifiers could attach to. In attached-growth batch experiments, the only surface
area available for attachment by nitrifiers was the media (see Table 4.3). As a conclusion,
the calculated ammonia-N removal rate in the mini BOBBER experiments was larger than
its real ammonia-N removal rate because only the attached surface area provided by the
attached media were counted. Assuming that the other surface area was 2 m2 (just a roughly
estimation), the specific ammonia-N removal rate in the mini BOBBER experiments would
be 0.51 g/day/m2 as N (19.7 °C), 0.41 g/day/m2 as N (14.3 °C), 0.39 g/day/m2 as N (9.6 °C),
0.39 g/day/m2 as N (4.6 °C), which was less than the ammonia-N removal rate observed in

61
the attached-growth batch experiments (Maximum ammonia-N removal rate under specific
temperature was observed in these experiments). Additionally, attach surface area at
Wingate second lagoon is difficult to estimate, but there will be surfaces other than the
media for the nitrifiers to attach to (including suspended growth nitrifiers). Ammonia-N
removal efficiency for nitrifiers attached to the media may have been promoted by vigorous
mixing within the BOBBER system, as compared to the nitrifiers that grew on surfaces
outside the BOBBERs.
4.6 Temperature Impacts on Attached-Growth Ammonia-N Removal Rate
In the mini BOBBER experiments, no obvious change in ammonia-N removal rate
was observed to result from temperature changes. This may have been caused by low
ammonia loading. As shown in Figure 4.4, most ammonia-N was oxidized to nitrate in the
mini BOBBER experiments, even at 5 °C. This suggests that the ammonia-N removal rate
might have increased if the ammonia-N loading were increased during these experiments.
In contrast, evident dependence of ammonia-N removal rate on temperature was
observed in the attached-growth batch experiments. According to Table 4.6, the average
ammonia-N removal rate at 22.8 °C was 157 mg/m2/hour, and the average ammonia-N
removal rate at 4.55 °C was 37 mg/m2/hour.
Rearrangement of Eq. (7) allows calculation of the maximum growth rate Km, based
on measurements of could be calculated using Eq. (17) which is converted from Eq. (7):
𝜇𝑚𝑎𝑥,𝑇1𝜇𝑚𝑎𝑥,𝑇2
= exp[𝐾𝑚(𝑇1 − 𝑇2)]

62
𝐾𝑚 = 𝑙𝑛 (𝜇𝑚𝑎𝑥,𝑇1
𝜇𝑚𝑎𝑥,𝑇2) (𝑇1 − 𝑇2)−1 (17)
The calculated Km using the data from attached-growth batch experiments was 0.079 K-1
while the value reported by Stankewich for suspended/-growth nitrification is from 0.095
K-1 to 0.12 K-1 [23]. Since attached-growth nitrification is less sensitive to temperature
change than suspended-growth nitrification, a smaller Km value is expected, just as what
was observed from the attached-growth batch experiments. And according to the research
done by Delatolla, time-course attached-growth Km is given (see Figure 5.1) [52], which
agreed with the observation from the attached-growth batch experiments.
Figure 4.14. Km to exposure time relationship at 4 °C (adapted from [52]).
0
0.02
0.04
0.06
0.08
0.1
0.12
0.14
0 20 40 60 80 100 120 140
Delatolla's
results
Batch
experiments
Const
ant
of
tem
per
ature
chan
ge
Km
(K-1
)
Exposure time to 4°C (days)

63
CHAPTER 5. CONCLUSIONS AND FUTURE WORK
5.1 Conclusions
According to the mini BOBBER experiments, attached-growth nitrification with
mini BOBBER reactors was demonstrated to have efficient ammonia-N removal rate
(>95%) under a large temperature variation (from 4.6 °C to 19.7 °C). However, the
influence from organic carbon loading and nitrifiers growing on other surface (including
suspended growing nitrifiers) were not explored.
According to the data from Wingate lagoon system, the real ammonia-N removal
rate was increased greatly after the installation of the BOBBER reactors. However, the
improvement still needs to be validated under conditions of extended cold temperature.
Attached-growth nitrification was observed to be less temperature sensitive than
suspended-growth nitrifcation, which supports the application of attached-growth
nitrification during cold periods. Additionally, the maximum ammonia-N removal rate
under 4.7 °C and 22.6 °C were measured with SSW. However, these results were observed
with simple ammonia-N loading, the performance with real wastewater still needs to be
tested.
Attached-growth nitrification (such as BOBBER reactors) has great potential to
deal with ammonia-N under low temperature range. This could be applied in many small
communities with winter nitrification problems at relatively low cost (compared to

64
mechanical wastewater treatment plant). Additionally, pre-attached BOBBER reactors
could be added to new constructed wastewater treatment systems, the pre-attached
BOBBER reactors are easy to transport and install, and they are able to perform
nitrification immediately after installation.
5.2 Future Work
SWW with organic carbon should be used in the future, for both mini-BOBBER
experiments and attached-growth batch experiments. Both organic carbon sources and
ammonia-N source should be added to make the SWW which should provide stable and
sufficient carbon and ammonia-N loading. Therefore, the competition from heterotrophs
could be addressed
Furthermore, the results from the mini-BOBBER experiments and attached-growth
batch experiments could be used to quantify the ammonia-N removal rate brought by the
nitrifiers growing suspended or on surface other than attach media. A conversion factor
could be determined so that the ammonia-N removal rate in a real BOBBER system could
be estimated by given the running condition and system dimension.
According to the previous data, ammonia-N removal was efficient in first lagoon
during warm periods, which lead to less ammonia-N introduction to the second lagoon and
less nitrifier accumulation in the BOBBER reactors. One possible solution to this problem
is to run the first lagoon and second lagoon in parallel during warm periods to allow
accumulation of nitrifiers in BOBBER reactors. As the temperature drops, the first and

65
second lagoon could then be arranged in series if enough nitrifiers are present in the second
lagoon to deal with ammonia-N.

66
REFERENCES
1. Grady, C.P.L.L., Henry C., Biological wastewater treatment : theory and
applications. 1980.
2. EPA, U.S., Aquatic Life Ambient Water Quality Criteria For Ammonia -
Freshwater. 2013.
3. USGS, U.S.G.S., Nitrogen (fixed) - Ammonia. Mineral commodity summaries.
2004.
4. Appl, M., Chemical Reactions and Uses of Ammonia, in Ammonia. 2007, Wiley-
VCH Verlag GmbH. p. 231-234.
5. Conley, D.J., et al., Controlling Eutrophication: Nitrogen and Phosphorus. Science,
2009. 323(5917): p. 1014-1015.
6. O'Sullivan, P.E., Eutrophication. International Journal of Environmental Studies,
1995. 47(3-4): p. 173-195.
7. Bianchi, T.S., et al., The science of hypoxia in the Northern Gulf of Mexico: A
review. Science of The Total Environment, 2010. 408(7): p. 1471-1484.
8. Focht, D.D.C., A.C., Nitrification and Denitrification Processes Related to Waste
Water Treatment. Advances in Applied Microbiology, 1975. 19: p. 153-186.
9. Kelly, D.P., Autotrophy: Concepts of Lithotrophic Bacteria and their Organic
Metabolism. Annual review of microbiology, 1971. 25: p. 177-210.

67
10. A. C. Van Haandel, G.V.M., Nitrification and denitrification kinetics in the
activated sludge process. 1981.
11. Joyner, T., et al., Prediction of nitrification effects of the dissolved oxygen balance
of streams. Environmental Science & Technology, 1967. 1(5): p. 405-410.
12. A. L. Downing, e.a., Nitrification in the activated sludge process. Journal of the
Institute of Sewage and Industrial Wastes, 1964: p. 130-158.
13. Knowles, G.D., A L ; Barrett, M J, Determination of Kinetic Constants for
Nitrifying Bacteria in Mixed Culture, with the Aid of an Electronic Computer.
ournal of General Microbiology, 1965. 38(2): p. 263-278.
14. Rittmann, B.E. and P.L. McCarty, Model of steady-state-biofilm kinetics.
Biotechnology and Bioengineering, 1980. 22(11): p. 2343-2357.
15. Drtil, M., P. Németh, and I. Bodík, Kinetic constants of nitrification. Water
Research, 1993. 27(1): p. 35-39.
16. Hanaki, K., C. Wantawin, and S. Ohgaki, Nitrification at low levels of dissolved
oxygen with and without organic loading in a suspended-growth reactor. Water
Research, 1990. 24(3): p. 297-302.
17. EPA, U.S., Nitrogen Control Manual. 1993: Technomic Publishing Company Inc.,
Lancaster, PA, USA.
18. EPA, U.S. Dissolved Oxygen and Biochemical Oxygen Demand. 2013; Available
from: http://water.epa.gov/type/rsl/monitoring/vms52.cfm.
68
19. N. Bernet, D.P., J.P. Delgenès, R. Moletta, Nitrification at low oxygen
concentration in biofilm reactor. Journal of Environmental Engineering, 2001. 127:
p. 266-271.
20. Embar G. Srinath, T.B.S.P., Raymond C. Loehr, Nitrifying organism concentration
and activity. Journal of the Environmental Engineering Division, 1976. 102: p. 449-
463.
21. EPA, U.S., Process design manual for nitrogen control. 1975.
22. De Boer, W. and G.A. Kowalchuk, Nitrification in acid soils: micro-organisms and
mechanisms. Soil Biology and Biochemistry, 2001. 33(7–8): p. 853-866.
23. Stankewich, M.J., Biological nitrification with the high purity oxygenation process.
1972.
24. Knowles, G., A.L. Downing, and M.J. Barrett, Determination of Kinetic Constants
for Nitrifying Bacteria in Mixed Culture, with the Aid of an Electronic Computer.
Journal of General Microbiology, 1965. 38(2): p. 263-278.
25. Wijffels, R.H., et al., Effects of diffusion limitation on immobilized nitrifying
microorganisms at low temperatures. Biotechnology and Bioengineering, 1995.
45(1): p. 1-9.
26. Kors, L.J., et al., Nitrification and low temperature in a raw water reservoir and
rapid sand filters. Water Science and Technology, 1998. 37(2): p. 169-176.
27. Painter, H.A. and J.E. Loveless, Effect of temperature and pH value on the growth-
rate constants of nitrifying bacteria in the activated-sludge process. Water
Research, 1983. 17(3): p. 237-248.

69
28. Oleszkiewicz, J.A. and S.A. Berquist, Low temperature nitrogen removal in
sequencing batch reactors. Water Research, 1988. 22(9): p. 1163-1171.
29. Rittmann, B.E. and L.S. Vernon, Achieving Biologically Stable Drinking Water.
Journal (American Water Works Association), 1984. 76(10): p. 106-114.
30. Rovita, D. and R. Killorn, Heavy‐Metal Inhibition of Nitrification in Selected
Iowa Soils Treated with Stay‐N 2000. Communications in Soil Science and Plant
Analysis, 2008. 39(7-8): p. 972-982.
31. Tomlinson, T.G.B., A. G. ; Trotman, C. N. A., Inhibition of Nitrification in the
Activated Sludge Process of Sewage Disposal. Journal of Applied Bacteriology,
1966. 29(2): p. 266-291.
32. Zhang, T.C., Y.-C. Fu, and P.L. Bishop, Competition for substrate and space in
biofilms. Water Environment Research, 1995. 67(6): p. 992-1003.
33. Ohashi, A., et al., Influence of substrate C/N ratio on the structure of multi-species
biofilms consisting of nitrifiers and heterotrophs. Water Science and Technology,
1995. 32(8): p. 75-84.
34. Okabe, S., et al., Relationship between population dynamics of nitrifiers in biofilms
and reactor performance at various C:N ratios. Water Research, 1996. 30(7): p.
1563-1572.
35. Dyke, S.V., Jones, S. & Ong, S. K. , Cold weather nitrogen removal deficiencies of
aerated lagoons. Environmental Technology, 2003. 24(6): p. 767-777.

70
36. McCartney, D.M. and J.A. Oleszkiewicz, Carbon and Nutrient Removal in a
Sequencing Batch Reactor at Low-Temperatures. Environmental Technology,
1990. 11(2): p. 99-112.
37. Ernest R. Blatchley III., Effects of Inclusion of Modified Mixing Devices on Effluent
Quality in Aerated Lagoons: Case Study at Wingate, IN WWTP. 2012.
38. Rittmann, B.E.M., Perry L., Environmental biotechnology : principles and
applications. 2001.
39. Dunne, W.M., Bacterial adhesion: seen any good biofilms lately? Clinical
microbiology reviews, 2002. 15(2): p. 155-166.
40. Allison, S.M. and J.I. Prosser, Ammonia oxidation at low pH by attached
populations of nitrifying bacteria. Soil Biology and Biochemistry, 1993. 25(7): p.
935-941.
41. Bassin, J.P., et al., Effect of Different Operational Conditions on Biofilm
Development, Nitrification, and Nitrifying Microbial Population in Moving-Bed
Biofilm Reactors. Environmental Science & Technology, 2012. 46(3): p. 1546-
1555.
42. Eddy, M.a., Wastewater Engineering: Treatment and Reuse. 4th ed. 2003, New
York, NY: McGraw-Hill.
43. Oleszkiewicz, J.A.B., James L., Nutrient Removal Technology in North America
and the European Union: A Review. Water Quality Research Journal of Canada,
2006. 41(4): p. 449-462.

71
44. EPA, U.S., Water Permitting 101. National Pollutant Discharge Elimination
System (NPDES), 2013.
45. (IDEM), I.D.o.E.M., Final Modification of NPDES Permit No. IN0040771 for the
Town of Wingate Wastewater Treatment Plant Montgomery County. 2012.
46. Payraudeau, M., Paffoni, C. & Gousailles, M., Tertiary nitrification in an up flow
biofilter on floating media: influence of temperature and COD load. Water Science
& Technology, 2000. 41(4-5): p. 21-27.
47. Aravinthan, V., et al., Factors affecting nitrogen removal from domestic
wastewater using immobilized bacteria. Water Science and Technology, 1998.
38(1): p. 193-201.
48. Consumer Confidence Report. Purdue University West Lafayette Campus Water
Works, 2012.
49. Field Service Report, 2007, WATER SOLUTIONS UNLIMITED, INC.
50. EPA, U.S., Wastewater Technology Fact Sheet: Dechlorination. 2000. 832F00022:
p. 7.
51. Lenore S. Clesceri, e.a., Standard Methods For the Examination of Water and
Wastewater, 20th Edition. 1998.
52. Delatolla, R.T., N ; Comeau, Y ; Gadbois, A ; Lamarre, D ; Berk, D, Kinetic
analysis of attached growth nitrification in cold climates. Water science and
technology, 2009. 60(5): p. 1173-1184.
53. Corporation, T.E., Orion Ammonia Electrode Instruction Manual. 2003.

72
Appendix A. Dechlorination of tap water
Tap water was dechlorinated by sodium bisulfite and sodium bisulfite was added
excessively (0.01 g/L) to insure the fully dechlorination. And after dechlorination the free
and total chlorine were measured by a Photometer 7500 (Palintest Instruments) using the
DPD/KI method.
During the measurement, a ground DPD-1 pill was added to a 10 mL water sample
to measure free chlorine. Then a ground DPD-3 pill was added to the same sample, the
total chlorine was measured after 2 minutes. Table A.1 shows 35 measurements of free and
total chlorine, which indicates that the chlorine were removed efficiently and could not
influence the growth of nitrifiers.
Table A. 1 Dechlorination of tap water
Sample time time Free chlorine
(mg/L as Cl2)
Total chlorine
(mg/L as Cl2)
2013/6/12 0.02 0.02
2013/6/13 0.01 0
2013/6/14 0 0
2013/6/15 0.01 0.03
2013/6/16 0 0.04
2013/6/17 0 0
2013/6/18 0 0
2013/6/19 0.01 0.02
2013/6/20 0 0
2013/6/21 0 0
2013/6/22 0.01 0.02
2013/6/23 0 0.01

73
2013/6/24 0.01 0.02
2013/6/25 0 0.01
2013/6/26 0 0
2013/6/27 0.01 0.02
2013/6/28 0 0
2013/6/29 0 0.01
2013/7/1 0 0.01
2013/7/2 0 0
2013/7/3 0 0
2013/7/5 0 0
2013/7/6 0 0.02
2013/7/8 0 0.01
2013/7/9 0 0
2013/7/11 0 0
2013/7/12 0 0
2013/7/13 0 0
2013/7/14 0 0.01
2013/7/15 n/a n/a
2013/7/16 0 0.02
2013/7/17 0 0.01
2013/7/18 n/a n/a
2013/7/19 0 0.02
2013/7/20 0.01 0.02
Average 0.00 0.01

74
Appendix B. Measurement of Ammonia-N
Ammonia-N was measured by an Accumet model 50 pH/ion/conductivity meter
(Fisher Scientific) connected with a 95-12 ammonia electrode (ORION).
The relationship between ammonia concentration and electrode potential is [53]:
E = 𝐸0 − 𝑆 ∙ 𝑙𝑜𝑔[𝑁𝐻3] (B-1)
Where: E = measured electrode potential (mV), E0 = reference potential (mV), NH3 =
ammonia concentration in solution (mg/L), S = electrode slope (mV/decade)
For each measurement, a 100 mL sample was collected. Then 2 mL pH adjuster (10
N sodium hydroxide) was added to the solution. After electrode potential reached a stable
value (Decided by the pH meter), ammonia concentration was calculated using equation
B-1. Standards were made by gravimetric addition of ammonium chloride to DI water at
the concentration of 1 mg/L as N, 10 mg/L as N, and 100 mg/L. Figure B.1 is an example
for the ammonia standard.

75
Figure B. 1 Ammonia standard curve for 2013/9/9.
Temperature is known to affect the slope of the ammonia electrode response curve.
At a concentration of 10-3 M, a 1 °C temperature change could result in 2% error [53]. To
reduce error, standards were made and the standard curve was developed at the temperature
corresponding to the water temperature of the experiment at the time of the measurement.
y = -55.95x + 119.73R² = 0.9996
0
20
40
60
80
100
120
140
0 0.5 1 1.5 2 2.5
log (ammonia concentration)
elec
tro
de
po
ten
tial
(m
V)

76
Appendix C. Measure of nitrite-N and nitrate-N
Nitrite-N and nitrate-N were measured by Ion Chromatography (IC).
Each sample collected was first filtered by a 25mm Syringe Filter with 0.45 μm
PTFE membrane filter. Then the samples were diluted from 2 mL to 10 mL using DI water.
After that 2 mL of each diluted sample were transferred to a HPLC vial for analysis by an
Ion Chromatography (DIONEX) equipped with IonPac AS19 4*250 mm Analytical
column (RFIC) and IonPac AG19 4*50mm guard column. The eluent hydroxide
concentration was set at 20 mM.
The relation between negative ion concentration (mg/L as N) and peak area
(μS*min) at the respect retention time is depicted as bellowing:
A = 𝑆 ∙ C (C-1)
Where: A = peak area at the retention time respect to the target ion (μS*min), S = slope, C
= negative ion concentration (mg/L as N). S could be acquired from a series of standard
solutions.
And nitrite-N standard was made by diluting sodium nitrite with nano-pure water
at the concentration of 2 mg/L as N, 4 mg/L as N, 6 mg/L, 8 mg/L, and 12 mg/L (This
range was decided in order to have a clear linearization between peak area and anion
concentration without any adverse impact on IC). Figure C.1 is an example for the nitrite-
N standard. Nitrate-N standard was prepared as same as nitrite-N standard using sodium
nitrate. Figure C.2 is an example for the nitrate-N standard.

77
Figure C. 1 nitrite-N standard on 2013/9/8
Figure C. 2 nitrate-N standard on 2013/9/8
y = 0.28xR² = 0.9981
0
0.5
1
1.5
2
2.5
3
3.5
4
0 2 4 6 8 10 12 14
Concentration (mg/L as nitrite-N)
Are
a (μ
S*m
in
)
y = 0.2867xR² = 0.9979
0
0.5
1
1.5
2
2.5
3
3.5
4
0 2 4 6 8 10 12 14
Concentration (mg/L as nitrate-N)
Are
a (μ
S*m
in
)