Atrial Fibrillation Project, SSNAP July to September 2013 and QOF Indicators 2012/2013 Crawley CCG.
17
Atrial Fibrillation Project, SSNAP July to September 2013 and QOF Indicators 2012/2013 Crawley CCG
-
Upload
bryan-heath -
Category
Documents
-
view
218 -
download
1
Transcript of Atrial Fibrillation Project, SSNAP July to September 2013 and QOF Indicators 2012/2013 Crawley CCG.

Atrial Fibrillation Project, SSNAP July to September 2013 and QOF Indicators 2012/2013
Crawley CCG

South East Coast SCN -Atrial Fibrillation Project
• Earlier detection and anticoagulation optimisation of patients with atrial fibrillation
• First step will be agreement on recommendation of NICE anticoagulation guidelines as best practice. New NICE Guidance will be published on the 11th June 2014
• Task to Finish Group being established to implement the NICE guidance• Will be followed by the development of a best practice model for earlier
detection and management • SSNAP Data – July to September 2013 most up to date• QOF Data from 2012/13 most up to date• Uses CHADS2 scoring. This will be replaced by CHADSVASC in NICE
Guidance

SSNAP Data – July to September 2013
• Nationally 19.8% of Stroke patients had previous AF. SEC is 20.5 %.Range in SEC is 12.7 to 35.5%
• Best practice is anticoagulant prescribing for AF• Nationally 24.5% of Stroke patients with AF were not
previously prescribed anticoagulants or anti-platelets. SEC is 26.8%. Range is 7.7 % to 40%
• Nationally 32.5 % of Stroke patients with AF were previously prescribed anticoagulants only. SEC is 31.4%. Range is 0 – 70%

SSNAP Data – July to September 2013
National
St Pete
r's Hosp
ital
Princes
s Roya
l Hosp
ital H
ayward
s Hea
th
Royal S
ussex C
ounty Hosp
ital
Darent V
alley
Hospita
l
Kent a
nd Canter
bury Hosp
ital
Queen El
izabeth
the Q
ueen M
other Hosp
ital
Willi
am Harv
ey Hosp
ital
Conquest Hosp
ital
Eastb
ourne D
istric
t Gen
eral H
ospita
l
Epso
m Hospita
l
Frimley
Park Hosp
ital
Maidsto
ne Dist
rict G
enera
l Hosp
ital
Tunbrid
ge W
ells H
ospita
l
Medway
Mari
time Hosp
ital
Royal S
urrey C
ounty Hosp
ital
East
Surre
y Hosp
ital
St Rich
ards H
ospita
l
Worth
ing Hosp
ital
05
10152025303540
Admitted Stroke Patients with Previous AFSSNAP - July to September 2013
AF Strokes = 306
%

National
St Pete
r's Hosp
ital
Princes
s Roya
l Hosp
ital H
ayward
s Hea
th
Royal S
ussex C
ounty Hosp
ital
Darent V
alley
Hospita
l
Kent a
nd Canter
bury Hosp
ital
Queen El
izabeth
the Q
ueen M
other Hosp
ital
Willi
am Harv
ey Hosp
ital
Conquest Hosp
ital
Eastb
ourne D
istric
t Gen
eral H
ospita
l
Epso
m Hospita
l
Frimley
Park Hosp
ital
Maidsto
ne Dist
rict G
enera
l Hosp
ital
Tunbrid
ge W
ells H
ospita
l
Medway
Mari
time Hosp
ital
Royal S
urrey C
ounty Hosp
ital
East
Surre
y Hosp
ital
St Rich
ards H
ospita
l
Worth
ing Hosp
ital
0
5
10
15
20
25
30
35
40
45
Stroke Patients with Previous AF on no anticoagulant or anti-platelet medication
SSNAP - July - September 2013AF Strokes = 306
%

National
St Peter's Hospital
Princess Royal Hospital Haywards Heath
Royal Sussex County Hospital
Darent Valley Hospital
Kent and Canterbury Hospital
Queen Elizabeth the Queen Mother Hospital
William Harvey Hospital
Conquest Hospital
Eastbourne District General Hospital
Epsom Hospital
Frimley Park Hospital
Maidstone District General Hospital
Tunbridge Wells Hospital
Medway Maritime Hospital
Royal Surrey County Hospital
East Surrey Hospital
St Richards Hospital
Worthing Hospital
0 10 20 30 40 50 60 70 80
Stroke Patients with Previous AF- Prescribing prior to admissionSSNAP July to September 2013
AF Strokes = 306
Anti-platelet onlyAnticoagulant OnlyBoth
%

QOF Atrial Fibrillation Indicators – 2012/13 by CCG
• Four Indicators– Prevalence (percentage on QOF AF Register/practice population)– AF05 – Percentage on AF register who have had a CHADS2 score in the previous 15
months (except those whose previous score was greater than 1)– AF06 – In those with a CHADS2 score higher than 1 in last 15 months– those who are on
anti-coagulants or anti-platelets (minus exceptions)– AF07 – In those with a CHADS2 score higher than 1 in last 15 months – those who are on
anti-coagulants (minus exceptions)
• Any correlation between QOF CCG indicator results and AF stroke admissions and prescribing? E.g. High stroke admissions with AF in local hospitals and low anticoagulant prescribing for those admissions and low prevalence and low anticoagulant prescribing (for the known AF’s) in CCG data

AF Prevalence by CCG in Sussex
Brighton & Hove Coastal West Sussex Crawley Eastbourne, Hailsham &
Seaford
Hastings & Rother High Weald Lewes Havens
Horsham & Mid Sussex
SUSSEX
0.0%
0.5%
1.0%
1.5%
2.0%
2.5%
3.0%
Practice KSS England
SUSSEX
Percentage of people on practice list on atrial fibrillation register
Source: QOF 2012/13

AF05 by CCG in Sussex
Brighton & Hove Coastal West Sussex Crawley Eastbourne, Hailsham &
Seaford
Hastings & Rother High Weald Lewes Havens
Horsham & Mid Sussex
SUSSEX
95.0%
95.5%
96.0%
96.5%
97.0%
97.5%
98.0%
Practice KSS England
SUSSEXAF05 The percentage of patients with Atrial Fibrillation in whom stroke risk has been assessed using the CHADS2 risk stratification scoring system in the preceding 15 months (excluding those whose previous CHADS2 score is greater than 1)
Source: QOF 2012/13

AF06 by CCG in Sussex
Brighton & Hove Coastal West Sussex Crawley Eastbourne, Hailsham &
Seaford
Hastings & Rother High Weald Lewes Havens
Horsham & Mid Sussex
SUSSEX
91.0%
92.0%
93.0%
94.0%
95.0%
96.0%
97.0%
Practice KSS England
SUSSEXAF06 In those patients with Atrial Fibrillation in whom there is a record of a CHADS2 score of 1 (latest in the preceding 15 months), the percentage of patients who are currently treated with anti-coagulation drug therapy or an anti-platelet therapy.
Source: QOF 2012/13

AF07 by CCG in Sussex
Brighton & Hove Coastal West Sussex Crawley Eastbourne, Hailsham &
Seaford
Hastings & Rother High Weald Lewes Havens
Horsham & Mid Sussex
SUSSEX
74.0%
76.0%
78.0%
80.0%
82.0%
84.0%
86.0%
SUSSEXAF07 In those patients with Atrial Fibrillation whose latest record of a CHADS2 score is greater than 1, the percentage of patients who are currently treated with anti-coagulation drug therapy
Source: QOF 2012/13
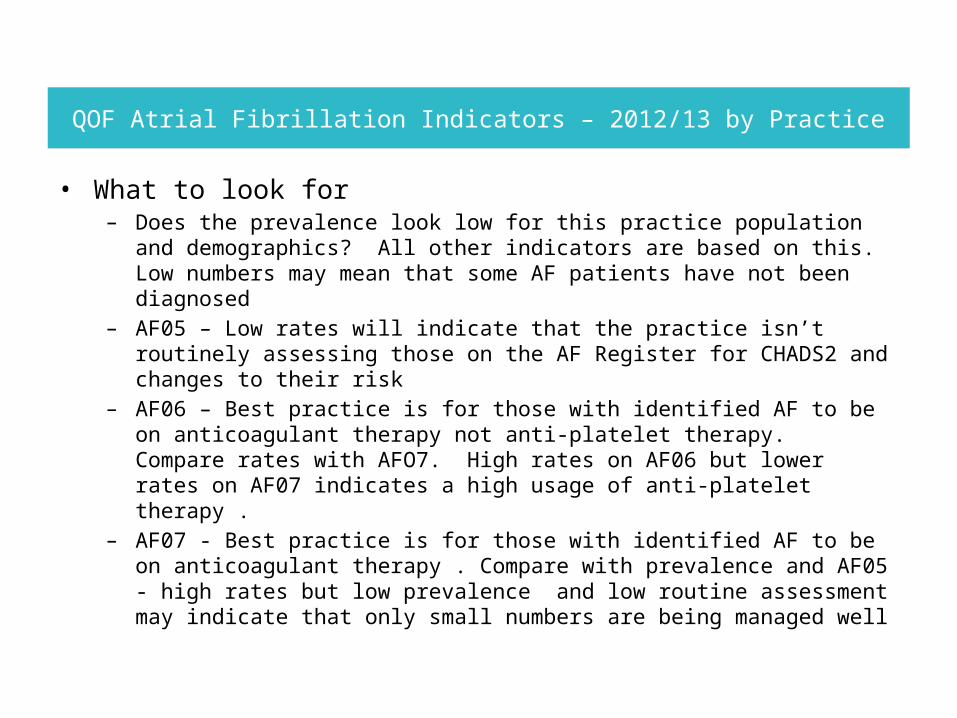
QOF Atrial Fibrillation Indicators – 2012/13 by Practice
• What to look for– Does the prevalence look low for this practice population and demographics? All other
indicators are based on this. Low numbers may mean that some AF patients have not been diagnosed
– AF05 – Low rates will indicate that the practice isn’t routinely assessing those on the AF Register for CHADS2 and changes to their risk
– AF06 – Best practice is for those with identified AF to be on anticoagulant therapy not anti-platelet therapy. Compare rates with AFO7. High rates on AF06 but lower rates on AF07 indicates a high usage of anti-platelet therapy .
– AF07 - Best practice is for those with identified AF to be on anticoagulant therapy . Compare with prevalence and AF05 - high rates but low prevalence and low routine assessment may indicate that only small numbers are being managed well

Prevalence by Practice compared to KSS (Red line) and England (Green Line)
H82088 Bewbrush Medical CentreH82047 Bridge Medical CentreH82098 Coachmans Medical PracticeH82053 Furnace Green SurgeryH82033 Gossops Green Medical CentreY02531 Health4CrawleyH82050 Ifield Drive PracticeY00351 Langley Corner SurgeryH82012 Leacroft PracticeH82052 Pound Hill SurgeryH82026 Saxonbrook Medical CentreH82064 Southgate Medical GroupH82025 Woodlands Clerklands Practice
H82088H82047H82098H82053H82033Y02531H82050Y00351H82012H82052H82026H82064H82025
0.0%
0.5%
1.0%
1.5%
2.0%
2.5%
Practice
NHS CRAWLEY CCG
Percentage of people on practice list on atrial fibrillation register
Source: QOF 2012/13

AFO5 by Practice compared to KSS (Red line) and England (Green Line)
H82012 Leacroft PracticeH82025 Woodlands Clerklands PracticeH82026 Saxonbrook Medical CentreH82033 Gossops Green Medical CentreH82047 Bridge Medical CentreH82050 Ifield Drive PracticeH82052 Pound Hill SurgeryH82053 Furnace Green SurgeryH82064 Southgate Medical GroupH82088 Bewbrush Medical CentreH82098 Coachmans Medical PracticeY00351 Langley Corner SurgeryY02531 Health4Crawley
H82012H82025H82026H82033H82047H82050H82052H82053H82064H82088H82098Y00351 Y02531
0%
20%
40%
60%
80%
100%
120%
Practice
NHS CRAWLEY CCG
AF05 The percentage of patients with Atrial Fibrillation in whom stroke risk has been assessed using the CHADS2 risk stratification scoring system in the pre-ceding 15 months (excluding those whose previous CHADS2 score is greater than 1)
Source: QOF 2012/13

AFO6 by Practice compared to KSS (Red line) and England (Green Line)
H82012 Leacroft PracticeH82025 Woodlands Clerklands PracticeH82026 Saxonbrook Medical CentreH82033 Gossops Green Medical CentreH82047 Bridge Medical CentreH82050 Ifield Drive PracticeH82052 Pound Hill SurgeryH82053 Furnace Green SurgeryH82064 Southgate Medical GroupH82088 Bewbrush Medical CentreH82098 Coachmans Medical PracticeY00351 Langley Corner SurgeryY02531 Health4Crawley
H82012H82025H82026H82033H82047H82050H82052H82053H82064H82088H82098Y00351 Y02531
0%
20%
40%
60%
80%
100%
120%
Practice
NHS CRAWLEY CCGAF06 In those patients with Atrial Fibrillation in whom there is a record of a CHADS2 score of 1 (latest in the preceding 15 months), the percentage of patients who are currently treated with anti-co-agulation drug therapy or an anti-platelet therapy.
Source: QOF 2012/13

AFO7 by Practice compared to KSS (Red line) and England (Green Line)
H82012 H82025 H82026 H82033 H82047 H82050 H82052 H82053 H82064 H82088 H82098 Y00351 Y02531
0%
20%
40%
60%
80%
100%
120%
Practice
NHS CRAWLEY CCGAF07 In those patients with Atrial Fibrillation whose latest record of a CHADS2 score is greater than 1, the percentage of patients who are cur-rently treated with anti-coagulation drug therapy
Source: QOF 2012/13
H82012 Leacroft PracticeH82025 Woodlands Clerklands PracticeH82026 Saxonbrook Medical CentreH82033 Gossops Green Medical CentreH82047 Bridge Medical CentreH82050 Ifield Drive PracticeH82052 Pound Hill SurgeryH82053 Furnace Green SurgeryH82064 Southgate Medical GroupH82088 Bewbrush Medical CentreH82098 Coachmans Medical PracticeY00351 Langley Corner SurgeryY02531 Health4Crawley

Exception Rates by GP Practice
BEWBUSH
MED
ICAL CEN
TRE
BRIDGE MED
ICAL CEN
TRE
COACHMANS MED
ICAL PRACTIC
E
FURNACE G
REEN SU
RGERY
GOSSOPS G
REEN M
EDICAL C
ENTR
E
HEALTH
4CRAWLEY
IFIELD
DRIVE PRACTIC
E
LANGLEY
CORNER SU
RGERY
LEACROFT
PRACTICE
POUND HILL SU
RGERY
SAXONBROOK M
EDICAL C
ENTR
E
SOUTH
GATE M
EDICAL G
ROUP
WOODLA
NDS CLER
KLANDS P
RACTICE
0.0
10.0
20.0
30.0
40.0
50.0
60.0
70.0
Crawley CCG - Exception Rates for AF06 and AF07 2012/2013 QOF Indicators by GP Practice
Exception Rate A06Exception Rate A07
%