
Atomization and Combustion of Liquids and Combustion of Liquids Caio Nunes Pereira ... tions were...
80
Atomization and Combustion of Liquids Caio Nunes Pereira Thesis to obtain the Master of Science Degree in Mechanical Engineering Examination Committee Chairperson: Professor Jo ˜ ao Rog ´ erio Caldas Pinto Supervisor: Professor M ´ ario Manuel Gonc ¸alves da Costa Member of the Committee: Professor Jo˜ ao Lu´ ıs Toste Azevedo November 2012
Transcript of Atomization and Combustion of Liquids and Combustion of Liquids Caio Nunes Pereira ... tions were...
Atomization and Combustion of Liquids
Caio Nunes Pereira
Thesis to obtain the Master of Science Degree in
Mechanical Engineering
Examination Committee
Chairperson: Professor Joao Rogerio Caldas PintoSupervisor: Professor Mario Manuel Goncalves da Costa
Member of the Committee: Professor Joao Luıs Toste Azevedo
November 2012


Acknowledgments
Firstly and foremost, I wish to thank my supervisor, Professor Mario Costa, for his support and
orientation throughout the course of this project.
The current investigation was performed in the scope of an European collaborative project, in
which IST is one of the partners. I wish to express my gratitude to the coordinator of this project in
IST, Professor Toste Azevedo, for his guidance and support during the course of the project. I would
also like to thank other partner institutions of this European project for the provision of the liquid fuels
used in this investigation, Abengoa Bioenergıa and Hygear B.V., for the provision of biodiesel and
diesel, as well as their analysis, respectively.
I wish to thank the teams of IN+ research center under the supervision of Professors Luıs
Moreira and Professor Edgar Fernandes for their support and availability to help me with the spray
visualization study.
I would also like to thank all my colleagues and friends of the combustion lab for their support
and assistance during all stages of this work, namely Dr. Anton Verıssimo, Dr. Ana Rocha, Gongliang
Wang, Manuel Barbas, Manuel Pratas, Maria Ines Pestana, Miriam Rabacal, Miguel Graca, Pedro
Barata, Rene Zander and Ulisses Fernandes. I also want to express my gratitude to my friends
and colleagues Antonio Mosca and Pedro Costa for their continuous help and support during the
elaboration of this dissertation.
I wish to thank my friends Alexandre Alcantara and Frederico Lopes for their unconditional
support, fellowship and willing assistance throughout this past year.
Still regarding my best friends, I am grateful to everyone that has somehow provided support
and affection along the course of this thesis.
Last but not the least, I wish to express my deepest gratitude to my parents and my sister for
their love, guidance and encouragement throughout my entire life.
i


Abstract
The present study focuses on atomization and combustion of liquids. Firstly, the performance
of a plain-jet airblast atomizer running on water has been investigated. Sauter mean diameter (SMD)
was assessed through a light scattering technique. In addition, spray quality was evaluated using a
Phantom V4.2 high speed camera. The results showed a decrease of SMD with increasing values
of the atomizing air to fuel ratio (AFR) up to a given value, beyond which spray quality improved
marginally. The spray quality revealed an increase with increasing values of AFR. Finally, correla-
tions were derived to predict SMD for sprays produced under similar conditions to the present ones.
Subsequently, combustion and co-combustion tests of diesel and biodiesel with NG (natural gas) have
been carried out in a large-scale furnace. Exhaust major gas species were obtained, quantifying the
effects of atomization quality, excess air and liquid fuel to NG thermal input ratio. In addition, particu-
late matter (PM) were collected for some of the furnace operating conditions, and their concentration,
morphology and chemical composition assessed. In general, the concentration of gas pollutants in
flue gas decreases with increasing atomization quality. The chemical analysis of PM revealed consid-
erable concentrations of Si, S, Cu and Cl.
Keywords
Atomization; combustion; biodiesel; dual fuel burner; large-scale furnace; particulate matter.
iii


Resumo
O presente estudo centrou-se na atomizacao e combustao de lıquidos. Inicialmente, o desem-
penho de um atomizador de jato plano assistido a ar foi avaliado. O diametro medio de Sauter (SMD)
foi estudado atraves de uma tecnica de difracao otica. Adicionalmente, a qualidade do spray foi avali-
ada recorrendo a uma camara de vıdeo de alta velocidade, Phantom V4.2. Os resultados revelaram
uma diminuicao do SMD com o aumento da razao massica ar de atomizacao/lıquido (AFR) ate um
certo valor de AFR, a partir do qual a qualidade da atomizacao era pouco afetada com o aumento do
valor deste parametro. Verificou-se tambem que a qualidade do spray aumenta com o aumento do
valor de AFR. Por fim, foram deduzidas duas expressoes com o intuito de prever o SMD para sprays
obtidos em condicoes semelhantes aquelas analisadas no presente trabalho. Numa segunda fase
do trabalho realizaram-se testes de combustao de diesel, biodiesel e gas natural. Foram medidas as
concentracoes das principais especies quımicas na exaustao da fornalha e avaliada a influencia da
qualidade da atomizacao, coeficiente de excesso de ar e razao termica combustıvel lıquido/gas nat-
ural, na emissao de poluentes. Adicionalmente, foram recolhidas partıculas para algumas condicoes
de operacao especıficas da fornalha, e a sua morfologia, concentracao e analise quımica avaliadas.
Em geral, a concentracao de poluentes nos gases de escape diminui com o aumento da qualidade
da atomizacao. A analise quımica das partıculas revelou a presenca de elementos como Si, S, Cu e
Cl.
Palavras Chave
Atomizacao; combustao; biodiesel; queimador dual; fornalha semi-industrial; partıculas.
v


Contents
1 Introduction 1
1.1 Motivation and objectives . . . . . . . . . . . . . . . . . . . . . . . . . . . . . . . . . . . 2
1.2 Literature survey . . . . . . . . . . . . . . . . . . . . . . . . . . . . . . . . . . . . . . . . 2
1.2.1 Atomization and sprays . . . . . . . . . . . . . . . . . . . . . . . . . . . . . . . . 2
1.2.2 Combustion . . . . . . . . . . . . . . . . . . . . . . . . . . . . . . . . . . . . . . . 4
1.3 Present contribution . . . . . . . . . . . . . . . . . . . . . . . . . . . . . . . . . . . . . . 8
1.4 Thesis outline . . . . . . . . . . . . . . . . . . . . . . . . . . . . . . . . . . . . . . . . . . 8
2 Experimental Facilities 11
2.1 Introduction . . . . . . . . . . . . . . . . . . . . . . . . . . . . . . . . . . . . . . . . . . . 12
2.2 Spray chamber . . . . . . . . . . . . . . . . . . . . . . . . . . . . . . . . . . . . . . . . . 12
2.3 Large-scale furnace . . . . . . . . . . . . . . . . . . . . . . . . . . . . . . . . . . . . . . 14
3 Experimental Techniques and Uncertainties 19
3.1 Introduction . . . . . . . . . . . . . . . . . . . . . . . . . . . . . . . . . . . . . . . . . . . 20
3.2 Atomization . . . . . . . . . . . . . . . . . . . . . . . . . . . . . . . . . . . . . . . . . . . 20
3.3 Combustion . . . . . . . . . . . . . . . . . . . . . . . . . . . . . . . . . . . . . . . . . . . 25
4 Atomization 27
4.1 Introduction . . . . . . . . . . . . . . . . . . . . . . . . . . . . . . . . . . . . . . . . . . . 28
4.2 Test conditions . . . . . . . . . . . . . . . . . . . . . . . . . . . . . . . . . . . . . . . . . 28
4.3 Spray imaging . . . . . . . . . . . . . . . . . . . . . . . . . . . . . . . . . . . . . . . . . 28
4.3.1 Jet disintegration . . . . . . . . . . . . . . . . . . . . . . . . . . . . . . . . . . . . 28
4.3.2 Spray quality . . . . . . . . . . . . . . . . . . . . . . . . . . . . . . . . . . . . . . 32
4.4 Mean droplet size . . . . . . . . . . . . . . . . . . . . . . . . . . . . . . . . . . . . . . . 35
4.4.1 Influence of radial and axial position . . . . . . . . . . . . . . . . . . . . . . . . . 35
4.4.2 Influence of AFR and mf . . . . . . . . . . . . . . . . . . . . . . . . . . . . . . . 35
4.4.3 Correlation derived for SMD prediction . . . . . . . . . . . . . . . . . . . . . . . . 37
5 Combustion 43
5.1 Introduction . . . . . . . . . . . . . . . . . . . . . . . . . . . . . . . . . . . . . . . . . . . 44
5.2 Test conditions . . . . . . . . . . . . . . . . . . . . . . . . . . . . . . . . . . . . . . . . . 44
5.3 Near burner region flow aerodynamics . . . . . . . . . . . . . . . . . . . . . . . . . . . . 45
vii

5.4 CO and NOx emissions . . . . . . . . . . . . . . . . . . . . . . . . . . . . . . . . . . . . 46
5.4.1 Effect of atomization quality . . . . . . . . . . . . . . . . . . . . . . . . . . . . . . 46
5.4.2 Effect of excess air coefficient . . . . . . . . . . . . . . . . . . . . . . . . . . . . . 46
5.4.3 Effect of liquid fuel to NG thermal input ratio . . . . . . . . . . . . . . . . . . . . . 47
5.5 Particulate matter emissions . . . . . . . . . . . . . . . . . . . . . . . . . . . . . . . . . 51
6 Closure 55
6.1 Conclusions . . . . . . . . . . . . . . . . . . . . . . . . . . . . . . . . . . . . . . . . . . . 56
6.2 Future work . . . . . . . . . . . . . . . . . . . . . . . . . . . . . . . . . . . . . . . . . . . 58
References 59
viii

List of Figures
1.1 Dual fuel burner used by Colson et al. (1999). . . . . . . . . . . . . . . . . . . . . . . . . 6
1.2 Dual fuel burner used by Hwang et al. (2009). . . . . . . . . . . . . . . . . . . . . . . . . 7
1.3 Dual fuel burners used by Derudi and Rota (2011) (a) Single nozzle gas-fuel feed; (b)
Dual nozzle liquid and gas-fuels feed; (c) Dual nozzle liquid-fuel feed. A1: primary air;
A2: secondary air. . . . . . . . . . . . . . . . . . . . . . . . . . . . . . . . . . . . . . . . 7
1.4 Dual fuel burner used by Lee et al. (2011). . . . . . . . . . . . . . . . . . . . . . . . . . . 8
2.1 Spray chamber. . . . . . . . . . . . . . . . . . . . . . . . . . . . . . . . . . . . . . . . . . 13
2.2 Atomizer. . . . . . . . . . . . . . . . . . . . . . . . . . . . . . . . . . . . . . . . . . . . . 13
2.3 Schematic of the large-scale furnace and its auxiliary equipment. . . . . . . . . . . . . . 16
2.4 Photograph of the large-scale furnace and its auxiliary equipment. . . . . . . . . . . . . 16
2.5 Schematic of the top of the furnace, burner gun and atomizer. . . . . . . . . . . . . . . . 17
2.6 Schematic of the exhaust system of the large-scale furnace. . . . . . . . . . . . . . . . . 17
3.1 Schematic of the Malvern Particle Size Analyzer and of its working principle. . . . . . . 21
3.2 Phantom V4.2 HSC and its acquisition system mounted in the spray chamber . . . . . . 22
3.3 Schematics of three setups and respective images captured by them. . . . . . . . . . . 23
3.4 Schematic of the probe used for the gas species concentration measurements. . . . . . 26
3.5 Schematic of the probe used for PM concentration measurements. . . . . . . . . . . . . 26
4.1 Comparison of (a) idealized jet breakup with (b) actual breakup. . . . . . . . . . . . . . . 29
4.2 Sequence of images for mf = 6 kg/h, (a) AFR = 0.7, (b) AFR = 1.5, (c) AFR = 2. . . . 30
4.3 Sequence of images for AFR = 0.7, (a) mf = 6 kg/h, (b) mf = 9 kg/h, (c) mf = 12 kg/h. 31
4.4 Images for mf = 6.0kg/h and various AFRs. The lines in blue represent half of the
spray cone angle. . . . . . . . . . . . . . . . . . . . . . . . . . . . . . . . . . . . . . . . . 33
4.5 Images for mf = 9.4kg/h and various AFRs. The lines in blue represent half of the
spray cone angle. . . . . . . . . . . . . . . . . . . . . . . . . . . . . . . . . . . . . . . . . 33
4.6 Image for mf = 12.3kg/h and various AFRs. The lines in blue represent half of the
spray cone angle. . . . . . . . . . . . . . . . . . . . . . . . . . . . . . . . . . . . . . . . . 34
4.7 Spray cone angle as a function of AFR, for three different values of mf . . . . . . . . . . 34
4.8 SMD as a function of the axial position. . . . . . . . . . . . . . . . . . . . . . . . . . . . 36
4.9 SMD as a function of the radial position. . . . . . . . . . . . . . . . . . . . . . . . . . . 36
ix

4.10 SMD as a function of AFR for two values of mf . . . . . . . . . . . . . . . . . . . . . . . 37
4.11 Comparison between the measured data and the SMD values calculated by equa-
tion 4.2. . . . . . . . . . . . . . . . . . . . . . . . . . . . . . . . . . . . . . . . . . . . . . 40
4.12 Comparison between the measured data and the SMD values calculated by equa-
tion 4.3. . . . . . . . . . . . . . . . . . . . . . . . . . . . . . . . . . . . . . . . . . . . . . 41
4.13 Comparison between the measured data and the SMD values calculated by equa-
tion 4.2, in a limited range of SMD. . . . . . . . . . . . . . . . . . . . . . . . . . . . . . 41
4.14 Comparison between the measured data and the SMD values calculated by equa-
tion 4.3, in a limited range of SMD. . . . . . . . . . . . . . . . . . . . . . . . . . . . . . 42
5.1 Effect of AFR on pollutant emissions. For all conditions: flue gas O2 = 2% and liquid
fuel thermal input = 120 kW. a) diesel; b) biodiesel. . . . . . . . . . . . . . . . . . . . . . 48
5.2 Effect of excess air on pollutant emissions. For all conditions: AFR = 2 and liquid fuel
thermal input = 120 kW. a) diesel; b) biodiesel. . . . . . . . . . . . . . . . . . . . . . . . 49
5.3 Effect of the liquid fuel to NG thermal input ratio on pollutant emissions. For all con-
ditions: AFR = 2, flue gas O2 = 2% and Total thermal input = 120 kW. a) diesel; b)
biodiesel. . . . . . . . . . . . . . . . . . . . . . . . . . . . . . . . . . . . . . . . . . . . . 50
5.4 Morphology of typical PM for the 4 samples at two magnifications, X4000 and X20000. . 52
5.5 Carbon and oxygen present in the PM. a) Carbon; b) Oxygen. . . . . . . . . . . . . . . . 53
5.6 Minor elements present in the PM. . . . . . . . . . . . . . . . . . . . . . . . . . . . . . . 53
x

List of Tables
1.1 Summary of equations for SMD calculation and their conditions of applicability. . . . . . 9
3.1 Lens focal distances versus droplet range. . . . . . . . . . . . . . . . . . . . . . . . . . . 21
3.2 Comparison of SMD measured using the RR and the independent models. . . . . . . . 21
3.3 HSC acquisition parameters used to record the images obtained. . . . . . . . . . . . . . 24
4.1 Water and air physical properties at ambient conditions. . . . . . . . . . . . . . . . . . . 28
4.2 Summary of test conditions used in the atomization experiments. . . . . . . . . . . . . . 28
4.3 Summary of statistic parameters regarding both curve fits. . . . . . . . . . . . . . . . . . 39
4.4 SMD values for water, diesel and biodiesel for four values of AFR, mf = 12.7 kg/h. . . 40
5.1 Fatty acids composition of the biodiesel. . . . . . . . . . . . . . . . . . . . . . . . . . . . 44
5.2 Properties of the diesel and biodiesel. . . . . . . . . . . . . . . . . . . . . . . . . . . . . 44
5.3 Properties of the natural gas. . . . . . . . . . . . . . . . . . . . . . . . . . . . . . . . . . 45
5.4 Furnace operating conditions. For all tests: total thermal input = 120 kW and inlet liquid
fuel temperature = 25 ◦C. . . . . . . . . . . . . . . . . . . . . . . . . . . . . . . . . . . . 45
5.5 Operating conditions for which PM have been collected and their concentration in the
flue gases. For all conditions: flue gas O2 = 2%. . . . . . . . . . . . . . . . . . . . . . . 51
xi


Abbreviations
FAME Fatty acids methyl esters
PM Particulate matter
NG Natural gas
SMD Sauter mean diameter
AFR Atomizing air to fuel ratio
HSC High speed camera
RR Rosin-Rammler
HOME Hazelnut oil methyl ester
SME Soybean methyl ether
POME Palm oil methyl ester
ER Equivalence ratio
SEM Scanning electron microscope
EDS Energy dispersive X-ray spectroscopy
IRZ Internal recirculation zone
ERZ External recirculation zone
xiii


List of Symbols
d0 tube inner diameter
ma air mass flow rate
mf liquid mass flow rate
S2 sum of squared deviations
R2 coefficient of determination
Ua air velocity
Ul liquid velocity
Ur relative velocity
Re Reynolds number
We Weber number
Oh Ohnesorge number
µl liquid absolute viscosity
ρa air density
ρl liquid density
σl liquid surface tension
σ standard deviation
xv


1Introduction
Contents1.1 Motivation and objectives . . . . . . . . . . . . . . . . . . . . . . . . . . . . . . . . 21.2 Literature survey . . . . . . . . . . . . . . . . . . . . . . . . . . . . . . . . . . . . . 21.3 Present contribution . . . . . . . . . . . . . . . . . . . . . . . . . . . . . . . . . . . 81.4 Thesis outline . . . . . . . . . . . . . . . . . . . . . . . . . . . . . . . . . . . . . . . 8
1

1.1 Motivation and objectives
Intense research is being carried out on the combustion of biodiesel, one of the main alterna-
tive fuels available in the world market. Biodiesel is mainly produced by transesterification, a process
that transforms different kinds of vegetable oils in fatty acids methyl esters (FAME), used as a fuel
in various industrial applications. Current concerns are centered on the emissions of gaseous pol-
lutants, such as CO, NOx and HC. More recently, also in particulate matter (PM) emissions, which
can present harmful and non reversible effects on human health. Against this background, it is im-
portant to continue developing strategies to minimize both gaseous and PM pollutant emissions from
combustion systems.
This work uses an existing dual fuel burner previously designed and tested by Queiros et al.
(2012). This burner was installed in a large-scale furnace, which provides a more realistic approach
to industrial applications. Combustion tests were then carried out to assess the feasibility of using
biodiesel as a fuel in industrial furnaces, and to investigate its compliance with the existing stringent
laws regarding the emission of pollutants. For comparison purposes, petroleum-based diesel was also
used as a fuel in this project. In addition, biodiesel is also being investigated as a secondary fuel in
flexible hydrogen generation prototypes. To evaluate this, co-combustion of biodiesel with low calorific
gases should be studied. In this work, co-combustion tests of biodiesel with natural gas (NG) were
performed, as a first and cheaper approach to these type of applications. Finally, in order to properly
assess the combustion characteristics of liquid fuels, the spray features were initially evaluated.
1.2 Literature survey
Section 1.2.1 is dedicated to atomization and sprays and section 1.2.2 reviews the combustion
of liquid and gaseous fuels, particularly the co-combustion of diesel and biodiesel with NG using dual
fuel burners.
1.2.1 Atomization and sprays
The spray visualization with the aid of a high speed camera (HSC) allows to globally evaluate
the quality of the spray. During the last decade, more emphasis has been given to these visualization
techniques as a result of the progress in technology. In addition to a spray imaging study, an investiga-
tion of the mean droplet size can provide adequate information to a complete characterization of the
spray. In most combustion systems, proper atomization provides a more efficient and cleaner burn-
ing. The time that a single droplet takes to evaporate is directly proportional to its diameter squared,
whether in the presence of combustion or not, see, for example, Coelho and Costa (2007). The mean
droplet size is typified by various diameters, being the Sauter mean diameter (SMD) the most used.
SMD, also known as D32, defines the diameter of the droplet whose ratio of volume to surface if
the same of that of the entire spray. Facing this strong dependence of combustion on the quality of
atomization, sprays were minutely studied by several researchers. Excellent reviews of many mean
2

droplet size studies are present in Lefebvre (1989) and Costa (1992), among others.
The SMD is strongly influenced by the atomizer type and the flow characteristics, mainly the
atomizing air to fuel ratio (AFR). A major difficulty concerning air assist and airblast atomizers is
that of differentiating between them, since both types of devices employ a high air velocity and their
geometric properties are nearly the same. The most usual criteria to differentiate them is the air
velocity, air assist nozzles employ greater velocities. Nevertheless, as most of the studies carried out
on air atomization have covered wide ranges of air velocity, the decision to describe a given atomizer
as air assist or airblast is mostly arbitrary. Concerning air assist atomizers, they are divided in two
categories, internal and external mixing. The atomizer used in the present study can be classified
as both a plain jet airblast atomizer and an external mixing air assist atomizer, since the air stream
impinges the liquid jet outside the atomizer. For these reasons, SMD correlations for both kinds of
devices are presented here.
The performance of plain jet airblast atomizers was investigated in detail by Lorenzetto and
Lefebvre (1977), water and kerosine were used as model fluids. Several parameters, including AFR,
atomizer dimensions and liquid physical properties were examined over wide ranges to provide infor-
mation about their effects on the mean droplet diameter. Results showed that the quality of atomiza-
tion worsens with increases in viscosity and surface tension. For liquids of low viscosity, the SMD
was found to be inversely proportional to Ur. Regarding the atomizer dimensions, it was found that
the d0 has little influence on SMD for liquids of low viscosity.
Further studies on plain jet atomization were conducted by Jasuja (1982). The author used
residual fuel oils as fluids, he also used a single nozzle configuration, in which the liquid flows through
a number of radial circular holes, from which it comes out in the form of single jets that enter a swirling
airstream. These jets then undergo disintegration. Results showed that the SMD increases with the
increase of both viscosity and surface tension. Moreover, the SMD decreases with increasing AFR.
Elkotb et al. (1982) examined 40 different nozzle configurations of external-mixing air assist
atomizers to assess their effects on the characteristics of kerosine sprays. Of special interest in this
study are the data obtained on the influence of ambient air pressure on SMD. Results showed that
the SMD decreases significantly with increasing ambient air pressure.
Rizk and Lefebvre (1984) investigated the effects Ur and ambient temperature on mean drop
size for a plain-jet airblast atomizer using kerosine and blended oils. The results showed that the
SMD decreases strongly with increasing Ur and also with the air ambient pressure.
Imamura and Nagai (1985) studied the performance of an external mixing air assist atomizer
using water. By using various values of AFR and ma, the authors were able to examine the effects of
these parameters on mean drop size. For the lower values of ma, the SMD decreases monotonously
with AFR and for higher values of ma, the SMD exhibits a decrease until AFR around 3, beyond
which it remains constant.
3

Costa (1992) examined the performance of a plain jet airblast atomizer using heavy fuel oils.
Results showed that the SMD decreases until the break-up point. After the liquid break-up process
is completed, the mean drop size tends to increase due to the evaporation of the smaller droplets as
well as to their coalescence. SMD exhibited a rapid decrease with the increase on AFR, agreeing
with the results obtained by Imamura and Nagai (1985), Lorenzetto and Lefebvre (1977) and Rizk and
Lefebvre (1984).
More recently, Park et al. (2009) used bioethanol and blended bioethanol with gasoline as
model fluids in a gasoline injector to assess spray properties. In particular, the authors found that
the spray width and the spray cone angle of ethanol were slightly larger than those of other fuels.
Regarding atomization performance, the pure ethanol fuel exhibited the largest droplet size due to its
higher kinematic viscosity and surface tension. Choi and Oh (2012) conducted experiments with a
blended fuel containing diesel and unrefined biodiesel. The main goal of their study was to determine
the spray characteristics of the blended mixtures and compare them with pure diesel. The study
focused mainly on the determination of the droplet diameter as a function of the injection pressure
and kinematic viscosity. Results showed that increasing the injection pressure results in a SMD
decrease. Conversely, increasing the mixing ratio, the SMD increases. The kinematic viscosity of
biodiesel was found to be greater than that of diesel. Therefore, biodiesel’s SMD is slightly larger
than that of diesel. As the kinematic viscosity increases, small droplets become smaller and large
droplets become larger, therefore the uniformity worsens. Petroleum-based diesel fuel is more easily
atomized than biodiesel fuel due to its lower viscosity.
Many of these studies led to expressions to calculate SMD for a well defined range of ap-
plicability. Table 1.1 is presented at the end of the present chapter and shows the summary of the
correlations derived to calculate SMD and their respective conditions of applicability.
1.2.2 Combustion
Diesel and biodiesel combustion:
Biodiesel is mainly produced by transesterification, a process that transforms different kinds of
vegetable oils in FAME. The chemical reaction is catalyzed by the addition of a base catalyst, normally
potassium hydroxide or sodium hydroxide. Biodiesel is then formed by removing the glycerol molecule
from the vegetable oils. The biodiesel is used as a fuel mainly in industrial installations and internal
combustion engines.
Tashtoush et al. (2003) investigated the combustion characteristics and emissions of the ethyl
ester of used palm oil and petroleum-based diesel fuel in a water-cooled furnace. The common
pollutant emissions were tested over a wide range of AFR. The results showed that biodiesel emitted
less pollutants than diesel over the whole range of AFR considered. The authors also found that
the CO emissions decreased with increasing AFR because of the higher availability of oxygen at the
higher AFR. For low thermal inputs, diesel showed higher CO emissions, which can be explained
4

by its higher carbon content. As for the NOx emissions, biodiesel showed lower emissions because
biomass-based fuels contain less nitrogen.
Basha et al. (2009) presented a literature review on biodiesel. The review contains informa-
tion about production, combustion and emissions for several types of biodiesel. Biodiesel is con-
stantly compared with diesel throughout the article. Some important conclusions drawn were: as
the proportion of biodiesel increases in the blend, deposits on the injector increase; the biodiesel
mass-based heating value is lower than that of diesel; the emission of pollutants depend on the type
of biodiesel; the best mixture (in terms of emissions and combustion performance) was found to be
80/13/7 (diesel/methyl tallowate/ethanol).
Ng and Gan (2010) examined the combustion of palm oil methyl ester (POME) and its blends
with diesel in a non pressurized, water-cooled combustion chamber. The emission of pollutants were
assessed over a range of equivalence ratios (ER). CO was found to be minimal when ER is within the
0.75 - 0.85 range. Conversely, in this region, NOx emissions were found to be maximum. Exhaust
CO improved across the tested ER range with increasing POME proportion in the fuel blends.
Jose et al. (2011) evaluated the use of biodiesel in a boiler with a pressure operated pulver-
ization burner. They concluded that: combustion efficiency decreases as the excess air increases
and that CO emissions are higher when firing pure biodiesel instead of blend mixtures of diesel with
biodiesel. Moreover, due to the biodiesel higher kinematic viscosity when compared with diesel, the
combustion efficiency is higher for higher values of liquid injection pressure as atomization process of
the biodiesel improves.
Bazooyar et al. (2011) performed a study on combustion of vegetable oils in a non-pressurized,
water-cooled semi-industrial furnace. According to the experimental data, biodiesels emitted higher
amounts of NOx and CO than petrol diesel at lower pressures. At higher pressure the trends changed
and diesel showed larger pollutant concentrations. This study revealed a similar overall behavior of
the CO emissions with the fuel pressure and AFR for all the fuels tested. CO emissions increased
with AFR and NOx emissions decreased with increasing AFR, since the overall temperature inside
the furnace decreased (less NO formation via the thermal mechanism).
Ghorbani et al. (2011) studied the combustion of biodiesel in a medium-scale experimental
boiler. The authors compared several biodiesel blends with petroleum diesel in terms of combus-
tion efficiency and flue gas emissions for several excess air levels. In general, pollutant emissions
from biodiesel blends were lower than those from petroleum-based diesel. The data also revealed a
reduction in the NOx emissions when firing biodiesel. The formation of NO depends mainly on the
availability of oxygen and on the local combustion temperature. The oxygen and temperature increase
cause more NOx to be produced. The temperature inside the boiler decreases with increasing excess
air. On the other hand, oxygen content increases. According to experimental data, NOx emissions
were dominated by the temperature effect. CO emissions were found to be slightly larger, probably
due to its higher carbon content.
5

Dual fuel burners:
Over the past years several dual fuel burner configurations were used to combust several com-
binations of both liquid and gaseous fuels, see, for example,Colson et al. (1999) and Queiros et al.
(2012).
Colson et al. (1999) developed a dual fuel burner which intended to be a low NOx burner, which
is represented in figure 1.1. Oil and natural gas were used as fuels. The authors concluded that the
aerodynamic structure of the flame close to the burner determines the structure of the flame as a
whole and the formation of NOx. Moreover, the authors found zones where the production of prompt
NOx may be important for this type of dual fuel burner configuration.
Figure 1.1: Dual fuel burner used by Colson et al. (1999).
Queiros et al. (2012) investigated the simultaneous combustion of atomized glycerin and natural
gas enriched with hydrogen using a dual fuel burner similar to the one used in the present study, this
burner was installed in a large-scale laboratory furnace. The authors concluded that CO and HC
emissions are always higher than those from pure gaseous firing and that NOx emissions increase
with increasing values of AFR, being, however, generally lower than those from pure gaseous fuel
firing.
Other dual fuel burner configurations somehow more complex, including those of Hwang et al.
(2009), Derudi and Rota (2011) and Lee et al. (2011), are also presented here. Hwang et al. (2009)
used the dual fuel burner configuration represented in figure 1.2, which uses a combination of swirling
premixed and jet diffusion flames. The burner was tested in two different modes, the diffusion combus-
tion mode (swirling air flow and jet diffusion flames) and hybrid combustion mode (swirling premixed
and jet diffusion flames). The conclusions drawn by the authors were related to pollutant emissions
and flame stability for the hybrid combustion mode. Note that this dual fuel burner uses two gaseous
fuels.
6

Figure 1.2: Dual fuel burner used by Hwang et al. (2009).
Derudi and Rota (2011) developed a dual fuel burner whose main intent was to achieve mild
combustion, which is represented in figure 1.3. Initially the burner was developed to combust gaseous
fuels and it was further adapted to work also with liquids. A dual nozzle configuration was then devel-
oped to allow the combustion of liquid octane. Since firing the burner with dual nozzle configuration is
difficult, the burner has always been fired with a gaseous fuel in the single nozzle configuration. Dur-
ing the transition from single nozzle configuration (gas fuel feeding) to dual nozzle mode (liquid fuel
feeding), the two fuels are fed contemporarily to the burner, a gas from the bottom of the nozzle and
a liquid injected from the lateral. Dual nozzle configuration allows sustaining mild combustion condi-
tions by directly injecting different liquid hydrocarbons in a mild combustion environment previously
attained using a gaseous fuel.
Figure 1.3: Dual fuel burners used by Derudi and Rota (2011) (a) Single nozzle gas-fuel feed; (b) Dual nozzleliquid and gas-fuels feed; (c) Dual nozzle liquid-fuel feed. A1: primary air; A2: secondary air.
Finally, Lee et al. (2011) designed a dual fuel burner for installation in a fuel processing system
which converts hydrocarbon fuel into hydrogen rich gas, which is represented in 1.4. For the reac-
tion to take place high temperature environment is needed. Thus, heat must be provided through a
heating source. In the conversion reaction anode off-gases are released, which are used as input
to the reformer to be further burned and then provide heat to the reaction. However, the anode off-
gases input alone is not enough to satisfy the reaction heating needs. Therefore, an additional fuel is
necessary, NG was used for that purpose. Hydrocarbon fuel + anode off-gases are injected from the
bottom to provide heat to the system. NG + steam are injected from the top. The combustion takes
place in a porous burner in order to assure greater flame stability. The hydrogen exits the upper part
7

of the reformers and feeds the fuel cell. As the proportion of NG in the mixture of anode off-gas + NG
is increased, the burning velocity decreases and the adiabatic temperature increases. It was possible
to establish a flat flame using the porous burner.
Figure 1.4: Dual fuel burner used by Lee et al. (2011).
1.3 Present contribution
The main contributions of this dissertation can be divided in two parts:
Atomization. Detailed spray characterization data were obtained for a commercial atomizer
using water, as a function of AFR and mf . The characterization includes spray images and droplet
size measurements. In addition, a correlation to predict the mean drop size has also been developed.
Combustion. Detailed flue gas composition data, namely, CO, NOx and PM emissions, were
obtained from a biodiesel-fired large-scale furnace as a function of the atomization quality and excess
air. For comparison purposes, tests were conducted also with diesel under equivalent firing condi-
tions. In addition, co-combustion tests of diesel and biodiesel with NG were also peformed in the
same laboratory furnace as a function of the liquid fuel to NG thermal input ratio. Finally, selected
samples of the PM collected were morphologically and chemically analized in a scanning electron
microscope (SEM) equipped with an energy dispersive X-ray spectroscopy (EDS) detector.
1.4 Thesis outline
This thesis is organized in six chapters, of which the present one constitutes the introduction
that includes a literature survey and establishes the main objectives of the work. Chapter 2 describes
the experimental facilities used throughout the study and chapter 3 presents the experimental tech-
niques used to collect the data reported in this thesis. Chapters 4 and 5 present and discuss the
atomization and combustion results, respectively. Finally, chapter 6 lists the main conclusions of this
study and provides guidelines for future work.
8

Tabl
e1.
1:S
umm
ary
ofeq
uatio
nsfo
rSM
Dca
lcul
atio
nan
dth
eirc
ondi
tions
ofap
plic
abili
ty.
Ref
eren
ceA
tom
izer
Flui
dAFR
ρl
(kg/m
3)
103µl
(Ns/m
2)
103σl
(N/m
)E
quat
ion
forSMD
calc
ulat
ion
(µm
)
Lore
nzet
toan
dLe
febv
re(1
977)
Pla
inje
tairb
last
atom
izer
Wat
eran
dke
rosi
ne1
-16
794
-218
01
-76
26-7
6SMD
=0.95(σ
lmf)0
.33
Urρ0.37
lρ0.30
a
( 1+
1
AFR
) 1.70+
0.13
( µ2 ld0
σlρ
l
) 0.5(1+
1
AFR
) 1.70(1
.1)
Jasu
ja(1
982)
Pla
inje
tairb
last
atom
izer
Res
idua
lfue
loi
ls2
-18
784
-100
01
-53
21-7
4SMD
=0.022
( σl
ρsU
2 s
) 0.45( 1
+1
AFR
) 0.5 +
0.00143( µ2 l
σlρ
l
) 0.4(1+
1
AFR
) 0.8(1
.2)
Elk
otb
etal
.(1
982)
Ext
erna
lmix
ing
aira
ssis
tat
omiz
erK
eros
ine
0.5
-280
03.
3530
SMD
=51d
0Re−
0.39We−
0.18
( m f ma
) 0.29(1
.3)
Riz
kan
dLe
febv
re(1
984)
Pla
inje
tairb
last
atom
izer
Ker
osin
ean
dbl
ende
doi
ls2
-878
0-8
401.
3-3
.027
-29
SMD
d0
=0.48
(σ
ρaU
2 rd0
) 0.4(1+
1
AFR
) 0.4 +
0.15
( µ2 l
σlρ
ld0
) 0.5(1+
1
AFR
)(1
.4)
Imam
ura
and
Nag
ai(1
985)
Ext
erna
lmix
ing
aira
ssis
tat
omiz
erW
ater
1-1
010
001
73SMD
t=
[ 1+
16850Oh0.5
We(ρl/ρa)
][ 1+
0.065
(ma/m
l)2
](1
.5)
Cos
ta(1
992)
Pla
inje
tairb
last
atom
izer
Hea
vyfu
eloi
l0.
25-2
988
51-1
1228
.4
SMD
d0
=0.045
(σl
ρaU
2 ad0
) 0.3(1+
1
AFR
) 0.6 +
0.015
( µ2 l
σlρ
ld0
) 0.5(1+
1
AFR
) 0.6(1
.6)
9

10

2Experimental Facilities
Contents2.1 Introduction . . . . . . . . . . . . . . . . . . . . . . . . . . . . . . . . . . . . . . . . 122.2 Spray chamber . . . . . . . . . . . . . . . . . . . . . . . . . . . . . . . . . . . . . . . 122.3 Large-scale furnace . . . . . . . . . . . . . . . . . . . . . . . . . . . . . . . . . . . . 14
11
2.1 Introduction
The current chapter describes the spray chamber used to perform the non-reacting spray char-
acterization, as well as the large-scale furnace used to carry out the combustion tests. All the auxiliary
equipment are herein presented as well.
2.2 Spray chamber
Figure 2.1 presents the overall scheme of the test section used to perform the non-reacting
spray characterization experiments. The spray chamber consists of an aluminum cubic platform,
which ends in a convergent tube that allows the connection to an extraction system. The latter aims
to expel the vapor produced during the atomization process out of the measuring zone in order to
increase the quality of the measurements. An optical measurement system is mounted above the
platform, and it consists of an emitter (laser) which yields a monochromatic beam, and a receptor
which detects the light distribution in a plane perpendicular to the initial non diffracted light. The
received information is then processed by the acquisition system installed in a computer (figure 2.1).
As the atomization tests were carried out using only water as the model fluid, the supply sys-
tems are quite simple. Tap water is supplied to the spray chamber, flowing through a rotameter which
assures proper mass flow rate. Air is supplied from a compressor installed in the laboratory and flows
through a calibrated rotameter.
Figure 2.2 shows the atomizer, including all the relevant dimensions. It has an inner section
with a diameter of 1.8 mm through where the liquid flows. An annular section, with inner and outer
diameters of 3 and 5 mm respectively, allows the air to be fed to the nozzle. It should be noted that the
formed spray is axisymmetric. Moreover, in the current atomizer it is possible to adjust the distance
between the air and fluid exits, see figure 2.2. Nevertheless, tests have only been carried out with the
atomizer fixed in its standard position, i.e., the water and air outlets in the same plane.
12
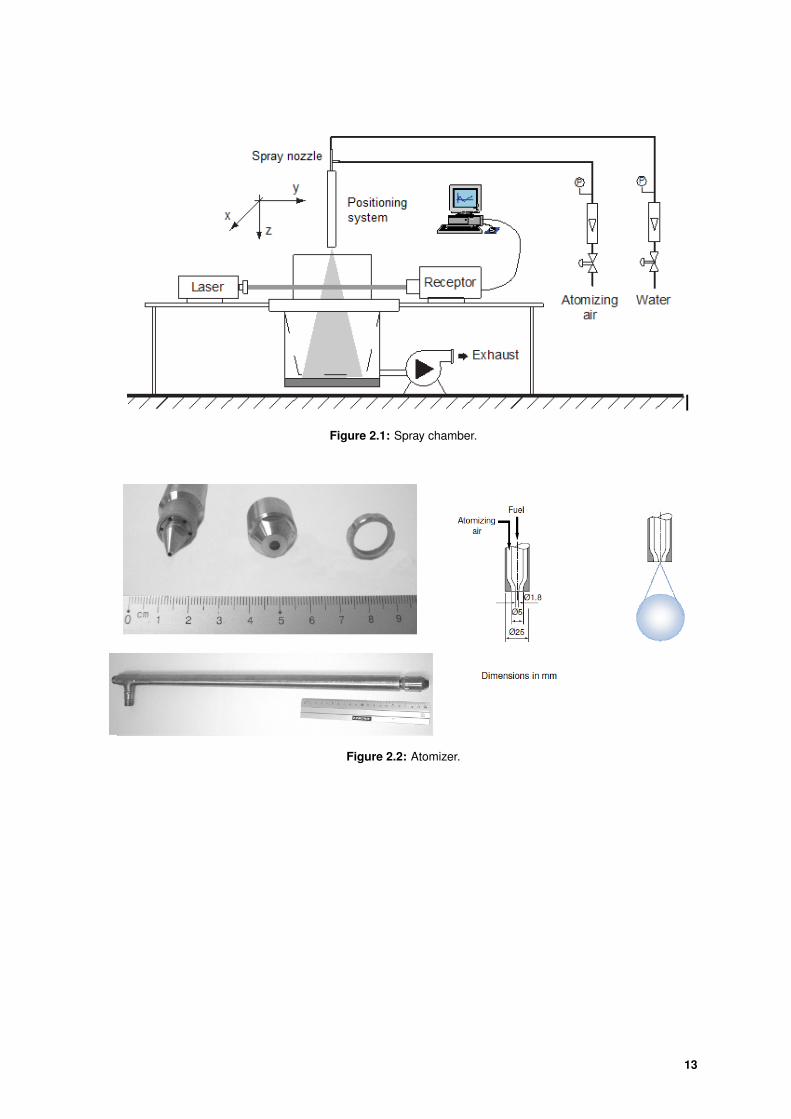
Figure 2.1: Spray chamber.
Figure 2.2: Atomizer.
13
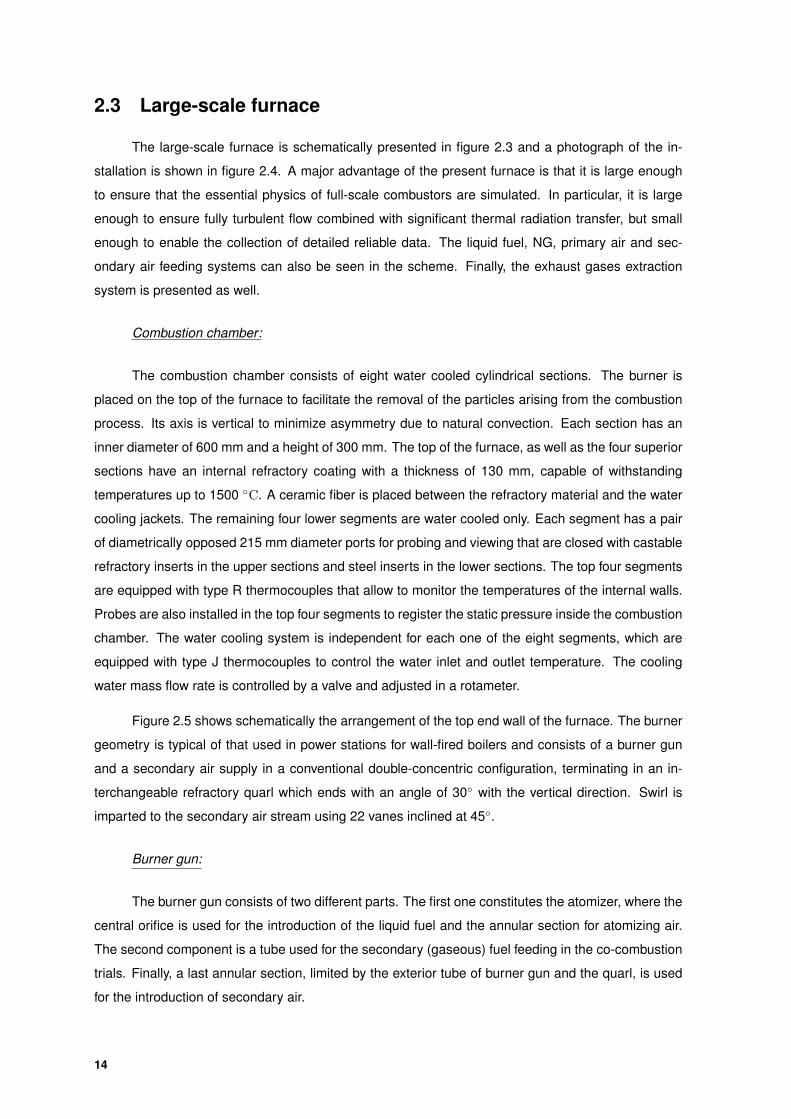
2.3 Large-scale furnace
The large-scale furnace is schematically presented in figure 2.3 and a photograph of the in-
stallation is shown in figure 2.4. A major advantage of the present furnace is that it is large enough
to ensure that the essential physics of full-scale combustors are simulated. In particular, it is large
enough to ensure fully turbulent flow combined with significant thermal radiation transfer, but small
enough to enable the collection of detailed reliable data. The liquid fuel, NG, primary air and sec-
ondary air feeding systems can also be seen in the scheme. Finally, the exhaust gases extraction
system is presented as well.
Combustion chamber:
The combustion chamber consists of eight water cooled cylindrical sections. The burner is
placed on the top of the furnace to facilitate the removal of the particles arising from the combustion
process. Its axis is vertical to minimize asymmetry due to natural convection. Each section has an
inner diameter of 600 mm and a height of 300 mm. The top of the furnace, as well as the four superior
sections have an internal refractory coating with a thickness of 130 mm, capable of withstanding
temperatures up to 1500 ◦C. A ceramic fiber is placed between the refractory material and the water
cooling jackets. The remaining four lower segments are water cooled only. Each segment has a pair
of diametrically opposed 215 mm diameter ports for probing and viewing that are closed with castable
refractory inserts in the upper sections and steel inserts in the lower sections. The top four segments
are equipped with type R thermocouples that allow to monitor the temperatures of the internal walls.
Probes are also installed in the top four segments to register the static pressure inside the combustion
chamber. The water cooling system is independent for each one of the eight segments, which are
equipped with type J thermocouples to control the water inlet and outlet temperature. The cooling
water mass flow rate is controlled by a valve and adjusted in a rotameter.
Figure 2.5 shows schematically the arrangement of the top end wall of the furnace. The burner
geometry is typical of that used in power stations for wall-fired boilers and consists of a burner gun
and a secondary air supply in a conventional double-concentric configuration, terminating in an in-
terchangeable refractory quarl which ends with an angle of 30◦ with the vertical direction. Swirl is
imparted to the secondary air stream using 22 vanes inclined at 45◦.
Burner gun:
The burner gun consists of two different parts. The first one constitutes the atomizer, where the
central orifice is used for the introduction of the liquid fuel and the annular section for atomizing air.
The second component is a tube used for the secondary (gaseous) fuel feeding in the co-combustion
trials. Finally, a last annular section, limited by the exterior tube of burner gun and the quarl, is used
for the introduction of secondary air.
14

Liquid fuels feeding system:
A pressure tank is used for this purpose, being the liquid fuel (biodiesel or diesel) placed in its
bottom. An industrial nitrogen bottle is connected to the top of the reservoir to pressurize it, allowing
the liquid fuel to exit through the bottom. The pressure inside the tank is measured by a gauge and
the fluid mass flow rate is monitored in a calibrated rotameter.
Natural gas feeding system:
The NG is supplied independently to the burner and ignition system (see below). The NG is
fed continuously from the IST grid at a pressure of 22 mbar and a maximum flow rate of 40 Nm3/h.
Primary and secondary air feeding systems:
The atomizing air is supplied by a compressor (10 bar) and its flow rate is measured using a
calibrated rotameter. The secondary air is supplied by a fan of variable speed and its flow rate is
adjusted measuring the oxygen concentration at the exit of the combustion chamber, allowing to de-
termine the excess air coefficient assuming complete conversion and therefore to know the secondary
air mass flow rate.
Ignition system:
A small NG burner placed on the top of the furnace provides a pilot flame to ignite the main
flame (figure 2.5). The combustion air is supplied by a ventilator used only for this purpose. The igni-
tion of the pilot flame is attained by the means of a high voltage electrical discharge. Once established
the main flame, the pilot flame is turned off.
Exhaust system:
The exhaust system is schematically represented in figure 2.6. It was designed to minimize
the emission of particles and to decrease the temperature of the exhaust gases.
On the first part of the system, inside the combustion chamber, a central shower is placed inside
a convergent tube which is followed by a constant section tube, with two plain water jets situated in its
interior. Finally, a separator is located at the tube’s exit. The exhaust is performed tangentially in such
a way that the centrifugal force projects the larger particles towards the separator. These particles
end up being dragged by the water coming from the showers to the container’s interior. During the
tests, the water level in the container is kept constant to avoid flow disturbances in the combustion
chamber’s interior.
The second part of the exhaust system connects the separator to the chimney. The latter is
equipped with an adjustable opening to regulate the pressure inside the combustion chamber. A
15
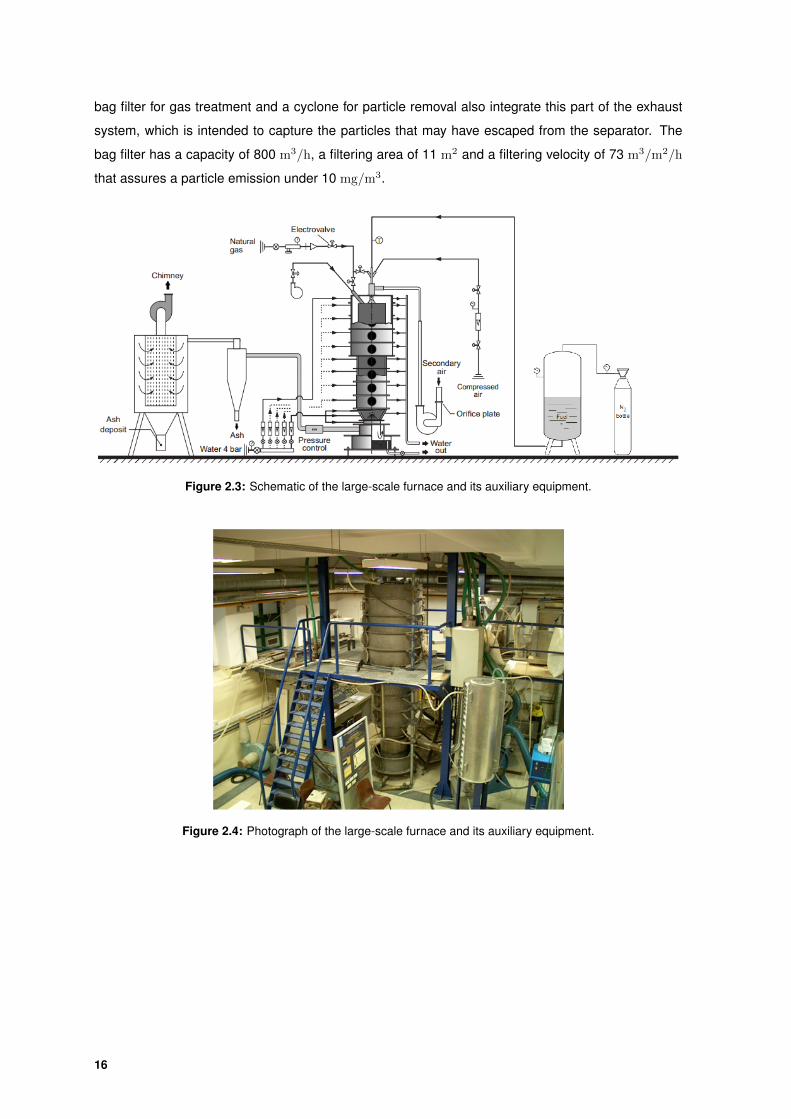
bag filter for gas treatment and a cyclone for particle removal also integrate this part of the exhaust
system, which is intended to capture the particles that may have escaped from the separator. The
bag filter has a capacity of 800 m3/h, a filtering area of 11 m2 and a filtering velocity of 73 m3/m2/h
that assures a particle emission under 10 mg/m3.
Figure 2.3: Schematic of the large-scale furnace and its auxiliary equipment.
Figure 2.4: Photograph of the large-scale furnace and its auxiliary equipment.
16
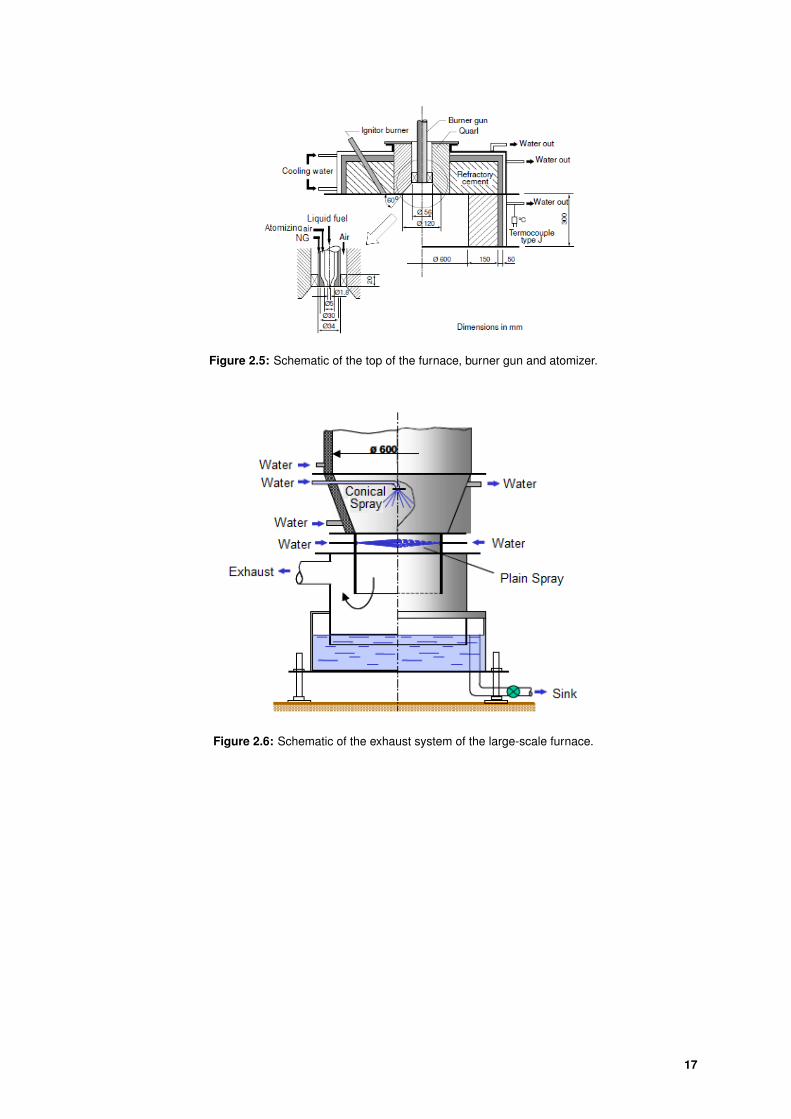
Figure 2.5: Schematic of the top of the furnace, burner gun and atomizer.
Figure 2.6: Schematic of the exhaust system of the large-scale furnace.
17

18

3Experimental Techniques and
Uncertainties
Contents3.1 Introduction . . . . . . . . . . . . . . . . . . . . . . . . . . . . . . . . . . . . . . . . 203.2 Atomization . . . . . . . . . . . . . . . . . . . . . . . . . . . . . . . . . . . . . . . . 203.3 Combustion . . . . . . . . . . . . . . . . . . . . . . . . . . . . . . . . . . . . . . . . 25
19

3.1 Introduction
This chapter describes the experimental techniques and the procedures adopted throughout
the present study, namely during the non-reacting characterization of the sprays and during the com-
bustion and co-combustion of diesel and biodiesel with NG. Furthermore, it also provides information
about the uncertainties associated to the measurements.
3.2 Atomization
Droplet size distribution:
An optical, non-imaging technique, based on the Fraunhofer principle was used to perform
measurements of mean droplet size and droplet size distribution. This technique relies on the diffrac-
tion of a parallel beam of monochromatic light by moving droplets. A commercial system based on this
technique was used - the Malvern Particle Size Analyzer (series 2600). The working principle of the
instrument is well described in the literature, see, for example, Meyer and Chigier (1986). Therefore,
only a brief description of the technique is presented here.
The instrument comprises a low power 10 mW He-Ne laser (λ = 0.6328 µm) emitter and a
receiver unit. The schematics of the system and of its working principle is presented in figure 3.1. The
collimated 9 mm diameter beam passes across the spray, perpendicularly to its axis. The receiver
contains a Fourier lens comprising 31 semi-circular diodes placed concentrically to the beam. This
lens is sensitive to the diffraction angle. The light beams cross the droplets and the diffracted light
reaches a specific diode according to the angle of diffraction. Droplets of different sizes provide
different angles of diffraction. Furthermore, different light beams with the same angle of diffraction
are directed to the same diode, regardless of the droplet position within the lens focal length. This
property makes the droplet size analysis to be dependent solely on the droplet diameter.
Various lenses can be assembled in the optical system according to the expected droplet size
range (see table 3.1). In the present project, a 300 mm lens was used, capable of detecting droplets
with a diameter ranging from 5.8 to 564 µm. The Malvern system with this lens indicates a percentage
of the volume of droplets smaller than 5.8 µm. In the tests carried out, for some values of AFR, this
percentage was quite high, reaching up to 65%. In these cases, the 100 mm lens would have been
more appropriate. However, the mean drop size was found to be smaller than 5.8 µm only for about
5% of the tests. Moreover, the values appear to be a good estimation since they follow the normal
course of the results and they adjust very well to the trend of the measurements.
20

Figure 3.1: Schematic of the Malvern Particle Size Analyzer and of its working principle.
Table 3.1: Lens focal distances versus droplet range.
Lens focal distance (mm) Droplet range (µm)63 1.2 - 118
100 1.9 - 188300 5.8 - 564600 11.6 - 1128800 15.5 - 15031000 19.4 - 1880
The software available in the Malvern System offers four droplet size distribution functions. The
independent model and the Rosin-Rammler (RR) model are the most commonly used in this type
of studies. In the RR case, the volume distribution is constrained to have a single peak, which can
be completely specified by two parameters of a characterizing equation. Instead, in the independent
model no assumptions are made about the form of the droplet size distribution. In order to perform an
adequate choice of the model, preliminary tests were carried out. A SMD axial profile was measured
for AFR = 0.5 using both the RR and the independent model. Table 3.2 shows the comparison of
SMD measured using the RR and the independent model. The table reveals that the mean droplet
size values are slightly larger when using the independent model. In all tests, the obscuration, i.e., the
fraction of light that is diffracted in each measurement, was found to be lower than 0.5, and therefore
no corrections were needed, see, for example, Queiros et al. (2012). Moreover, the residues of the
fitting using the independent model, 2.58, was about 48% lower than those using the RR model, 4.98.
For a detailed explanation about this topic, see Meyer and Chigier (1986). For the reasons stated
above, in this project, all the experimental tests were carried out using the independent model.
Table 3.2: Comparison of SMD measured using the RR and the independent models.
z (axial distance from the nozzle) (mm) SMD (RR) ( µm ) SMD (Independent) (µm )10 41.12 50.3420 27.22 35.7030 24.10 32.3040 22.43 31.4850 21.25 29.6560 23.63 33.64
21

As a final remark, it should be addressed that high values of obscuration cause multiple diffrac-
tion/scattering. This can be a source of major errors and even misleading results. As the spray
becomes more dense and opaque, the light beams face a strong difficulty to pass across the spray
and end up undergoing multiple diffraction/scattering phenomena, causing erroneous interpretation of
the results. In this case, a certain droplet diameter cannot be interpreted as the correct one, since in
reality, the light beam has been diffracted by more than just one droplet, therefore providing a smaller
SMD than the real one. As a result, when the obscuration values are higher than 0.5, the Malvern
system provides mean droplet size values smaller than the real ones. As stated above, in the present
study all the obscuration values were found to be smaller than 0.5. Thus the uncertainty connected
with the spray’s obscuration can be disregarded.
Phantom V4.2 high speed camera:
Spray images were obtained with the aid of a high speed imaging system comprising sev-
eral components (figure 3.2) a Phantom V4.2 HSC; an acquisition system installed in a dedicated
computer; an adjustable stroboscopic light, three continuous illumination sources and a background
whose objective was to diffuse the light coming from the light sources. All the images were recorded
directly in the computer’s internal hard drive.
Figure 3.2: Phantom V4.2 HSC and its acquisition system mounted in the spray chamber
Several setups for the images collection were assessed, varying many parameters and compo-
nents, such as: the distance between the camera lens and the spray; the distance between the light
sources and the spray and, also, the illumination conditions (power) and the background. For each
setup, schematically represented in figure 3.3, one image was recorded under the same acquisition
parameters and flow conditions (AFR = 0.5 and mf = 6 kg/h) in order to decide the arrangement that
should be used in this work. For comparison purposes, the experimental facilities of various previous
studies that have used HSCs were consulted, namely, Delacourt et al. (2005), Klein-Douwel et al.
(2007), Zhou and Yu (2011) and Park et al. (2012).
22

Figure 3.3: Schematics of three setups and respective images captured by them.
23

Visual analysis was the decision criterion for choosing the best setup. Setup number 3 (fig-
ure 3.3) was the one that provided the clearest image, with clearer droplet images and best contrast.
As shown in figure 3.3, three similar continuous light sources with a power of 40, 150 and 500 W were
used.
The Phantom V4.2 can record up to 2100 fps using 512 x 512 pixel (maximum resolution).
Other acquisition parameters were also varied. Several values of resolution, acquisition frame rate,
exposure time and diaphragm aperture were tested to allow the choice of the best combination of
these parameters. All the images presented in chapter 4 were recorded with the parameters pre-
sented in table 3.3.
Table 3.3: HSC acquisition parameters used to record the images obtained.
Resolution (pixel) Acquisition rate (fps) Exposure time ( µs ) Diaphragm aperture384 x 384 3800 10 4
24

3.3 Combustion
Gas species concentrations:
Flue gas composition data were obtained with the aid of a stainless steel water-cooled probe
placed at the furnace exit. The probe has a inner diameter of 1.3 mm through which the quenched
samples flow. The central tube is surrounded by two concentric tubes for water cooling. The gas
sample was evacuated through the probe with the aid of an oil-free diaphragm pump. A condenser
removed the main particulate matter excess and the main condensate. A filter and a dryer remove any
residual particles and moisture so that a constant supply of clean dry combustion is delivered to the
analyzers. The measured species are therefore obtained under dry basis conditions. The analytical
instrumentation comprise a magnetic pressure analyzer for O2 measurements, a non-dispersive infra-
red gas analyzer for CO2 and CO measurements, a flame ionization detector for HC measurements
and finally a chemiluminescent analyzer for NOx measurements. The uncertainties associated with
these measuring techniques relate mainly to the aerodynamic perturbations of the flow by the probe
and to the insufficient quenching of the chemical reactions. The data repeatability, which is a good
indicator of the data quality, was within 5% of the mean value. A more detailed description of these
techniques can be found in Queiros (2011).
Particulate matter concentration:
PM sampling was accomplished with the aid of a water-cooled probe specifically designed for
the present study, which is represented in figure 3.5. The cooling system of this probe is similar to
the one used for flue gas composition measurements. The diameter of the probe’s orifice is such that
ensures the mean velocity of the gas entering the probe is the same as that of the gases flowing inside
the furnace, allowing isokinetic sampling of the particles present in the combustion gases. On leaving
the probe, the gases (10 Nl/min) flow through a Tecora total filter holder where the PM are captured
in a quartz microfiber placed in the filter holder. To avoid condensation in the filter, PM collection
system was heated up to 120 ◦C with the aid of a resistance. After PM collection, the quartz filter was
weighted and the PM concentration calculated.
Subsequently, the morphology and chemical composition of the PM samples were examined
in a scanning electron microscope (SEM) - JEOL, model JSM-7001F - equipped with an energy
dispersive X-ray spectroscopy (EDS) detector that allows quantifying the chemical composition of a
PM sample with a resolution of about 1 µm2. For each sample, the PM chemical composition data
were obtained considering five different areas of 50 x 50 µm2.
25

Figure 3.4: Schematic of the probe used for the gas species concentration measurements.
Figure 3.5: Schematic of the probe used for PM concentration measurements.
26

4Atomization
Contents4.1 Introduction . . . . . . . . . . . . . . . . . . . . . . . . . . . . . . . . . . . . . . . . 284.2 Test conditions . . . . . . . . . . . . . . . . . . . . . . . . . . . . . . . . . . . . . . 284.3 Spray imaging . . . . . . . . . . . . . . . . . . . . . . . . . . . . . . . . . . . . . . . 284.4 Mean droplet size . . . . . . . . . . . . . . . . . . . . . . . . . . . . . . . . . . . . . 35
27

4.1 Introduction
This chapter presents the atomization results and is divided in three sections. The first one
contains a summary of the experimental conditions used in all the tests. Section 2 concentrates on
spray imaging, firstly describing the jet disintegration process, followed by the imaging results of the
present sprays, where the influence of AFR and mf on atomization quality is discussed. Finally,
the last section discusses all the results regarding droplet size distribution, including radial and axial
SMD profiles, the influence of AFR and mf on SMD and correlations that have been derived from
the experimental data to predict SMD under similar conditions to the ones used in the present tests.
4.2 Test conditions
The atomizer used to perform all tests is described in chapter 2. All tests have been carried out
at ambient conditions (300 K and 1 atm) in the spray chamber described in chapter 2, using water as
the fluid and air as the atomizing fluid, see table 4.1. Table 4.2 summarizes the test conditions used
in the experiments.
Table 4.1: Water and air physical properties at ambient conditions.
Property ValueWater density (ρl) (kg/m3) 997
Water surface tension (σl) (N/m) 0.0717Water dynamic viscosity (µl) (Ns/m2) 0.000855
Air density (ρa) (kg/m3) 1.161
Table 4.2: Summary of test conditions used in the atomization experiments.
Experiment mf (kg/h) ma(kg/h) AFRSpray imaging 6.0 - 12.3 2.0 - 24.4 0.34 - 0.99
Droplet size measurements 9.2 - 12.7 2.0 - 27.2 0.17 - 2.33
In this study, the effect of mf and AFR on atomization characteristics were studied. It should
be noted that it is not possible to assess the separate effects of (mf ) and AFR, since both an increase
in AFR for a constant mf and an increase in mf for a constant AFR lead to an increase in ρaU2a .
The velocities were estimated by the mf and the air cross section area.
4.3 Spray imaging
4.3.1 Jet disintegration
When a liquid jet is impinged by an air stream, interaction between cohesive and disruptive
forces starts to take place. Under certain ranges of atomizing air to fuel ratio the oscillations are
amplified and the liquid disintegrates into drops. This process is known as primary atomization. Larger
droplets usually disintegrate into smaller droplets, a process referred as secondary atomization.
28

Figure 4.1 shows two different ways of breakup, one idealized by Rayleigh and the other as it
actually occurs, as observed from high speed imaging studies. The formation and growth of axisym-
metric disturbance occur and as the air stream reaches the jet, the aerodynamic forces can no longer
be disregarded.
Figure 4.1: Comparison of (a) idealized jet breakup with (b) actual breakup.
Figures 4.2 and 4.3 show a sequence of images for six experimental conditions. The images
were obtained with the Phantom V4.2 HSC described in chapter 3. In each sequence of images, the
initial instant (t = 0) is defined as the one immediately prior to the occurrence of the first perturbations
on the liquid jet. Images are presented with equal time spacing to allow direct comparisons. Three
stages of jet disintegration are easily identified in figures 4.2 and 4.3. The liquid column begins to
undergo wavy disturbances at about 2 to 3 µs after air impingement. For most cases, the liquid jet
starts to disintegrate into ligaments after 8 to 10 µs. Subsequently, these ligaments disintegrate into
droplets at around 13 µs after the first perturbation.
29

Figure 4.2: Sequence of images for mf = 6 kg/h, (a) AFR = 0.7, (b) AFR = 1.5, (c) AFR = 2.
30

Figure 4.3: Sequence of images for AFR = 0.7, (a) mf = 6 kg/h, (b) mf = 9 kg/h, (c) mf = 12 kg/h.
31

4.3.2 Spray quality
Besides the droplet size distributions, important parameters used to characterize the spray
quality are the spray cone angle and the spray uniformity. A good spray uniformity is crucial to effective
droplet evaporation and subsequent combustion. The better the spray the more stable the flame. The
analysis made in the present chapter is of the utmost importance for the combustion tests described
in chapter 5.
Figures 4.4 to 4.6 show spray images for various experimental conditions. The quality of atom-
ization seems to depend strongly on both AFR and mf . For the lowest water mass flow rate tested
(figure 4.4), the quality of atomization appeared to be very poor, with the exception of AFR = 2. It
is noticeable that the water droplets are not uniformly distributed, being the largest droplets generally
concentrated in the center of the jet. Moreover, a huge discrepancy between the size of the smallest
and largest droplets is evident.
For the other values of liquid mass flow rate (figures 4.5 and 4.6), the atomization starts to
uniformize for lower values of AFR; specifically for AFR = 1 for mf = 9.4 kg/h and AFR = 0.9 for mf
= 12.3 kg/h. As AFR increases, the sprays show a globally better atomization quality, it is evident
that not only the droplets are quite smaller but also the difference between the largest and smallest
droplets decrease significantly. In fact, for highest values of AFR shown in figures figures 4.5 and 4.6,
there is no difference between the droplet size of the entire spray, when using visual criterion.
Besides the droplet size distribution, the spray cone angle is also important to characterize
sprays. Figure 4.7 show the spray cone angle as a function of AFR for three values of mf . It is seen
that the spray cone angle ranges from 15◦ to 73◦. For values of AFR close to 0.5, the spray cone
angle for three values of mf is always larger than 50◦. In the region where AFR is between 1 and
2, the values of the spray cone angle are much smaller for mf = 9.4 kg/h and mf = 12.3 kg/h than
those for mf = 6 kg/h. Summarizing, the spray cone angle and the spray uniformity are two spray
characteristics that have similar behavior. For higher values of AFR and mf the sprays are narrower,
more uniform and comprise a smaller droplet size.
32
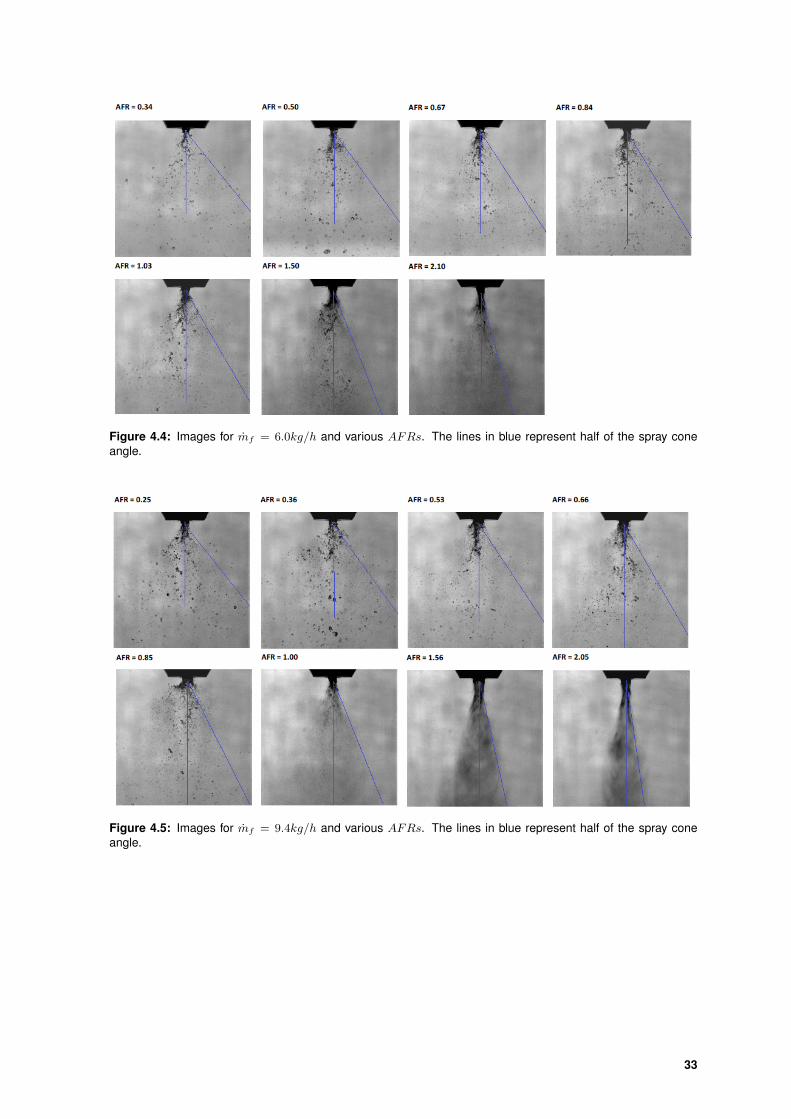
Figure 4.4: Images for mf = 6.0kg/h and various AFRs. The lines in blue represent half of the spray coneangle.
Figure 4.5: Images for mf = 9.4kg/h and various AFRs. The lines in blue represent half of the spray coneangle.
33

Figure 4.6: Image for mf = 12.3kg/h and various AFRs. The lines in blue represent half of the spray coneangle.
Figure 4.7: Spray cone angle as a function of AFR, for three different values of mf .
34

4.4 Mean droplet size
4.4.1 Influence of radial and axial position
Figures 4.8 and 4.9 show the axial and radial variation of SMD for four values of AFR and mf
= 9.4 kg/h.
The results show good agreement with the jet disintegration fundamentals. A decrease in SMD
with the axial position is noticed until z = 55 mm for AFR = 0.5 and around z = 40 mm for the other
values of AFR (figure 4.8). Until these z-positions, primary and secondary breakup take place, the jet
disintegrates into ligaments and these into droplets. After the minimum value of SMD being reached,
an increase in the mean droplet diameter takes place, which is also in accordance with the theoretical
fundamentals. This SMD increase results from two physical phenomena: i) as droplets become
smaller they are more susceptible to evaporate, thus decreasing the number of smallest droplets, and
ii) smaller droplets are liable to coalescence, reducing then the number of smallest droplets. These
two phenomena contribute to the increase of SMD. The axial position in which the SMD presents
the lowest value coincides with the end of the atomization.
The data presented in figure 4.9 were obtained at the axial position where the minimum SMD
value was measured. The lowest SMD value in radial distribution is always located in the vicinity of
r = 0. As AFR increases, the radial distribution of SMD not only becomes more uniform, but also
narrower, since the spray cone angle reduces drastically, from 66◦ for AFR = 0.5 to 16◦ for AFR = 2
(figure 4.7). A good symmetry is observed for the whole range of AFRs.
4.4.2 Influence of AFR and mf
This section discusses the influence of AFR and mf on mean droplet size. Figure 4.10 shows
the SMD as a function of AFR, for two values of mf . All the measurements were obtained in
the center of the spray (r = 0) at 40 mm from the nozzle tip. Figure 4.10 reveals that the spray
quality, as typified by SMD, increases significantly as AFR increases up to around 0.5, beyond
which the improvements in spray quality are marginal, regardless of mf . At low values of AFR, the
kinetic energy of the atomizing air is insufficient to overcome the viscous and surface tension forces
which oppose the disintegration of the liquid. As the AFR increases, the ma and ρaU2a increase and
consequently more energy is available to shatter the fuel jet into droplets. The ’levelling off’ of the
curves beyond a certain value of AFR suggests that above this value the additional atomizing air
does not effectively interact with the fuel jet, see Costa (1992). Figure 4.10 also reveals that SMD
values for mf = 9.4 kg/h are consistently 20% to 30% lower than those for mf = 12 kg/h, for each
value of AFR. This is consistent with the results of Costa (1992). The decrease of SMD with mf at
a constant AFR is due to the increase in ρaU2a .
35
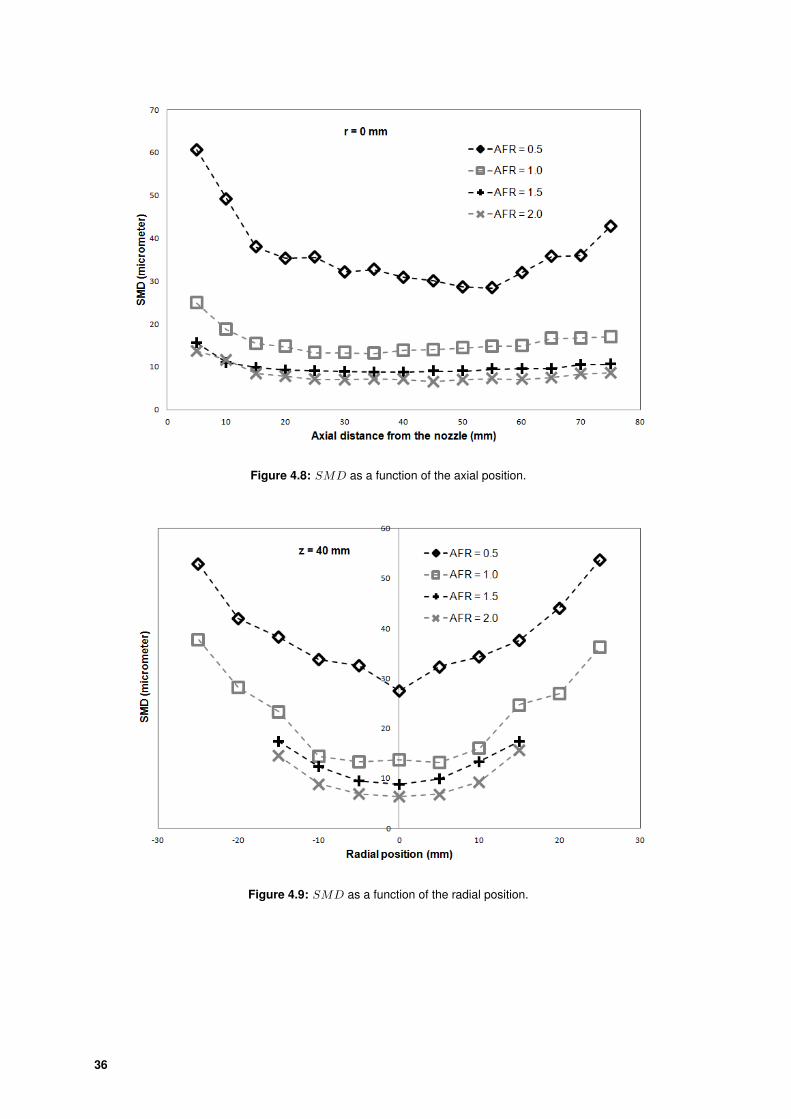
Figure 4.8: SMD as a function of the axial position.
Figure 4.9: SMD as a function of the radial position.
36

Figure 4.10: SMD as a function of AFR for two values of mf .
4.4.3 Correlation derived for SMD prediction
In order to derive an expression able to predict the measured data, a process of quantitatively
estimating the trend of the experimental data becomes necessary. This process is known as regres-
sion or curve fitting.
For a given set of data, the fitting curves are generally not unique. Several types of adjusting
curves, such as linear, polynomial of higher order, exponential, or even a pre-conceived function with
open constants can be applied. Previous studies carried out by Elkotb et al. (1982), Rizk and Lefebvre
(1984) and Costa (1992), among others, have yielded expressions used to predict the SMD for a well
defined range of flow conditions, fluid properties and atomizer geometrical features. In this study,
two similar fittings were assessed, based on equations 1.3, 1.4 and 1.6, developed by the authors
referenced above.
One should note that using this pre-conceived expressions to perform the adjustment to the
experimental data constitutes an initial constraint. The method of least squares is the most common
one to solve these kind of problems. If applied with no constrains, the output of this method could be
any function. However, in the present study, its output is an expression similar to equations 1.3, 1.4
37

and 1.6, comprising different constants.
The method of least squares assumes that the best fit curve of a given type is the one exhibiting
the minimal sum of squared deviations from a given set of measured data, calculated as follows:
S2 =
n∑i=1
(SMDcalci − SMDmeasi)2 (4.1)
where n is the number of measured values, SMDcalc are the values out-coming from the correlation
for the constants derived and finally, SMDmeas are the values measured directly from the Malvern
Particle Size Analyzer, described in chapter 2.
As stated previously, the decision criterion for the best fit curve was the value of S2. For the
expression based on the work developed by Rizk and Lefebvre (1984) and Costa (1992) S2 was
found to be 703 µm2 while for the expression derived by Elkotb et al. (1982), S2 was 944 µm2.
Therefore, according to the method of least squares, the expression based on that developed by Rizk
and Lefebvre (1984) and Costa (1992) is the one that provides the best overall curve fitting. The
relative difference between the two quadratic errors is around 25%.
The equations derived in this study are:
SMD
d0= 0.3
(σl
ρaU2ad0
)0.67(1 +
1
AFR
)0.91
+ 1.55
(µ2l
σlρld0
)0.6(1 +
1
AFR
)0.3
(4.2)
SMD
d0= 19.2Re−0.15We−0.45
(mf
ma
)0.83
(4.3)
The parameter S2 provides a measure of the quality of the agreement between the experi-
mental data and the fitted curve, hence it provides a measure of the adequacy of the fitted model.
However, its value is not very perceptive since it is shown in µm2 and it is a sum of all quadratic
deviations. A measure that provides a better perception is the standard deviation, whose units are
µm and it takes the number of data points into account:
σ =
√S2
n(4.4)
A value of σ small relatively to the average measured SMD indicates that the observed values
are tightly clustered around the fitted curve. However, these previous parameters are dimensional.
The necessity for a non-dimensional parameter leads to the coefficient of variation, defined as follows:
38

C.V. =σ
SMDmeas
(4.5)
Another representative non-dimensional parameter is the coefficient of determination:
R2 = 1− S2
T 2(4.6)
where:
T 2 =
n∑i=1
(SMDcalci − SMDmeas)2 (4.7)
The parameter R2 varies between 0 and 1, the closer it is to the upper bound, the better is the
curve fit.
Table 4.3: Summary of statistic parameters regarding both curve fits.
S2(µm2) σ(µm) SMDmeas(µm) C.V. R2
Equation 4.2 703 3.95 27.25 0.14 0.994Equation 4.3 944 4.58 26.18 0.17 0.992
Given this, it is clear that the terms of equation 4.2 representing the Reynolds and Weber
number do not depend exclusively of 1/AFR, but also exhibit an independent component, since in
this equation these terms are multiplied by (1 + 1/AFR)C . Another conclusion that can be drawn is
that the separation of the contribution of Reynolds and Weber number provides a better adjustment.
Figures 4.11 and 4.12 represent the comparison of the collected data with the calculated val-
ues, for the whole range of SMD and figures 4.13 and 4.14 show the same content for a limited range
of SMD, since for AFR higher than 0.7 the SMD value drops significantly, therefore concentrating
the results in the range [5; 20 µm].
Despite the overall differences between the errors of the two equations, it is noteworthy that
equation 4.2 provides a significantly better adjustment for the smallest values of SMD. This deviations
are not reflected in the relative difference of S2 since the SMD values are very small and therefore
the square of the difference between SMDmeas and SMDcalc is also very small when compared to
higher values of SMD.
The term that concerns the viscosity in the equation developed in this study shows a higher
sensibility to AFR when compared with the expressions derived by Rizk and Lefebvre (1984) and
Costa (1992). This comparison enhances the idea that any derived correlation adjusts quite well to
39

a given set of measured data for some specific conditions. As the range of application for a certain
equation increases, the deviations from the initial trend increase significantly.
Analyzing equation 4.3 derived in this project, it is evident that the dependence on some pa-
rameters is more pronounced than in the expression derived by Elkotb et al. (1982).
Following the development of these correlations, it is important to use them to predict the SMD
for other liquids, namely those ones to be used in subsequent combustion tests. Table 4.4 shows
the SMD for water, diesel and biodiesel, predicted by the equation 4.2. It is noteworthy that the
differences are significant and this has direct consequences on the emission of pollutants.
Table 4.4: SMD values for water, diesel and biodiesel for four values of AFR, mf = 12.7 kg/h.
AFR water SMD (µm) diesel SMD (µm) biodiesel SMD (µm)0.5 28.4 30.3 45.91 9 18.8 32
1.5 5.8 16.5 28.82 4.9 15.6 27.6
Figure 4.11: Comparison between the measured data and the SMD values calculated by equation 4.2.
40

Figure 4.12: Comparison between the measured data and the SMD values calculated by equation 4.3.
Figure 4.13: Comparison between the measured data and the SMD values calculated by equation 4.2, in alimited range of SMD.
41

Figure 4.14: Comparison between the measured data and the SMD values calculated by equation 4.3, in alimited range of SMD.
42

5Combustion
Contents5.1 Introduction . . . . . . . . . . . . . . . . . . . . . . . . . . . . . . . . . . . . . . . . 445.2 Test conditions . . . . . . . . . . . . . . . . . . . . . . . . . . . . . . . . . . . . . . 445.3 Near burner region flow aerodynamics . . . . . . . . . . . . . . . . . . . . . . . . . 455.4 CO and NOx emissions . . . . . . . . . . . . . . . . . . . . . . . . . . . . . . . . . 465.5 Particulate matter emissions . . . . . . . . . . . . . . . . . . . . . . . . . . . . . . . 51
43

5.1 Introduction
This chapter describes the results of the combustion of diesel and biodiesel and their co-
combustion with NG tests in the large-scale furnace. Pollutant emissions, such as NOx, CO and
PM, are presented and discussed. A brief description of the near burner flow aerodynamics based on
the work of Queiros et al. (2012) is also included in the present chapter.
5.2 Test conditions
Tables 5.1 to 5.3 show the properties of the NG, diesel and biodiesel and table 5.4 lists the
furnace operating conditions. The first series of tests aims to evaluate the effect of the quality atom-
ization on CO and NOx emissions. The series number II evaluates the excess air coefficient effect on
emissions. Finally, the last series assesses the effect of liquid fuel (diesel and biodiesel) to NG ther-
mal input ratio on the emission of common pollutants . All the pollutant concentrations were corrected
to 6% of oxygen in the combustion products to eliminate the effect of dilution and provide a consistent
basis for comparisons.
Note that the specific operating conditions for which particles have been collected and posteri-
orly analyzed are presented in section 5.5.
Table 5.1: Fatty acids composition of the biodiesel.
Fatty acid Composition (wt%)Myristic (C 14:0) 1.0Palmitic (C 16:0) 43.8
Palmitoleic (C 16:1) 0.2Stearic (C 18:0) 4.4Oleic (C 18:1) 39.2
Linoleic (C 18:2) 10.4Linolenic (C 18:3) 0.3Arachidic (C 20:0) 0.4
Eicosenoic (C 20:1) 0.1Behenic (C 22:0) 0.1
Lignoceric (C 24:0) 0.1
Table 5.2: Properties of the diesel and biodiesel.
Property Diesel BiodieselChemical formula C13.3H24.7O<0.01 C18.3H34.8O2
C (wt%) 86.49 76.68H (wt%) 13.48 12.15O (wt%) 0.03 11.17
Density @ 15 ◦C (kg/m3) 836 875Viscosity @ 40 ◦C (mm2/s) 2.59 4.43
Surface tension @ 40 ◦C (N/m) 0.025 0.028Low heating value (MJ/kg) 42.93 37.79
Flash point (◦C) 58 135Sulphur content (mg/kg) 5.9 < 3
FAME (vol%) 0.3 99.4Nitrogen content (mg/kg) 28 -
44

Table 5.3: Properties of the natural gas.
CH4 (vol%) 92.4C2H6 (vol%) 4.95N2 (vol%) 0.1
C3H8 (vol%) 1.96C4H10 (vol%) 0.52C5H14 (vol%) 0.01CO2 (vol%) 0.05
Low heating value (MJ/Nm3) 38.78
Table 5.4: Furnace operating conditions. For all tests: total thermal input = 120 kW and inlet liquid fuel tempera-ture = 25 ◦C.
Series number I (Effect of atomizationquality) II (Effect of excess air)
III (Effect of liquidfuel/NG thermal input
ratio)Liquid fuel (kW) 120 120 0 - 120
NG (kW) 0 0 120 - 0Spray: AFR 0.5 - 2.5 2 2
Flue gas O2 (dryvolume%) 2 1 - 5 2
5.3 Near burner region flow aerodynamics
Queiros et al. (2012) presented a qualitative description of the flow structure of the near burner
region. Due to the burner’s geometry, two recirculation regions are established. An internal recircula-
tion zone (IRZ) created by the swirl motion generated through the vains placed at the exit of secondary
air annular section, and an external recirculation zone (ERZ) caused by flow separation at the quarl
exit. The IRZ has a crucial role in the flame stabilization process of the present flames. The fuel
droplets in the primary jet are directly introduced into the IRZ. If the recirculation intensity is strong
enough to withstand the jet momentum, the flame is stable and good combustion characteristics are
attained. On the other hand, if the swirl is not sufficient, the central jet passes across the IRZ and the
combustion begins to deteriorate and the flame to destabilize.
45

5.4 CO and NOx emissions
5.4.1 Effect of atomization quality
As discussed in chapter 1, the quality of atomization plays a crucial role on combustion. The
combustion characteristics are intrinsically linked with the atomization quality, namely AFR, droplet
size distribution and, specially, SMD. It is noteworthy that as AFR increases, not only the SMD
decreases (see chapter 4), but also jet momentum increases. The latter may have an important role
in the flame stabilization process of spray flames. During the tests to study the impact of the quality
of the atomization on combustion performance, the oxygen concentration in the flue gas was fixed at
around 2% and the liquid fuel thermal input was 120 kW, and therefore no NG was utilized to evaluate
the effect of atomization.
Figure 5.1 shows the effect of the AFR on pollutant emissions, which reveals that the NOx
emissions from biodiesel combustion are always lower than those from diesel combustion. Two rea-
sons support this evidence: i) fuel bound nitrogen is present in the diesel, and therefore, the formation
of NO via the fuel mechanism can occur, and ii) biodiesel presents a high oxygen content in its com-
position, which can lead to lower in-flame temperatures, therefore reducing the formation of NO via
the thermal mechanism.
Figure 5.1 also shows that the CO emissions resulting from biodiesel combustion decrease
with the increase of AFR, from 60 to 30 ppm, whereas for diesel, the CO emissions remain constant
around 20 ppm. As for biodiesel, the higher CO concentration at lower AFR values may be the
result of poorer atomization, since the predicted SMD for biodiesel is considerably larger than that
for diesel, as shown in chapter 4. For low values of AFR, the droplets mean diameter is larger,
allowing them to penetrate farther in the IRZ, which combined with the low jet momentum reduces the
overall mixing conditions and deteriorates combustion, increasing the CO emissions. In the case of
the diesel combustion, the constant CO emissions may be explained by the better atomization quality
when compared to the biodiesel, nullifying the effect of atomization for the emission of this pollutant.
5.4.2 Effect of excess air coefficient
Figure 5.2 shows the effect of the excess air on pollutant emissions. In this tests the AFR was
kept constant and equal to 2, and the liquid fuel thermal input was fixed at around 120 kW. The results
reveal that the NOx emissions increase slightly with increasing excess air level. Increasing the excess
of air will enhance mixing conditions and combustion intensity, resulting in higher flame temperatures,
which promotes NO formation via the thermal mechanism.
The combustion of both liquid fuels exhibit similar trends concerning the emissions of CO and
NOx (figure 5.2). CO emissions rapidly decrease until O2 = 2%, beyond which they remain un-
changed. The high CO emissions observed a low excess air levels is a direct consequence of the low
oxygen availability, which presumably establishes fuel rich zones in the central region of the spray,
46

leading to incomplete combustion and, therefore, higher emissions of CO. As the excess of air in-
creases, more O2 becomes available and, thus, the CO emissions decrease significantly.
5.4.3 Effect of liquid fuel to NG thermal input ratio
To evaluate the feasibility of the co-combustion of diesel or biodiesel with NG, the emission of
pollutants was evaluated under co-firing conditions. During these tests the total thermal input was
kept constant around 120 kW, varying the liquid fuel to NG thermal input ratio. The NG thermal input
varied from 0 to 120 kW, in steps of 30 kW. The remaining thermal input was then provided by the
liquid fuel. This series of experiments comprised 5 different furnace operating conditions for each one
of the liquid fuels (diesel or biodiesel). Furthermore, to allow a fair comparison between both liquid
fuels, the AFR was kept constant and equal to 2, while oxygen percentage in the flue gas was fixed
around 2%, providing an excess of air coefficient of approximately 10%.
Figure 5.3 shows the effect of the liquid fuel no NG thermal input ratio on pollutant emissions.
NOx emissions present a similar overall behavior for the co-combustion of diesel and biodiesel with
NG. The concentration of NOx rises from 20 ppm for pure NG firing to around 35 ppm for pure
biodiesel firing. Similarly, for diesel, NOx emissions increase from 15 to around 45 ppm. These
trends may be related with the increase in the in-flame temperature when increasing the liquid fuel
thermal input, therefore promoting the formation of NO via thermal mechanism. One should note
that the formation of NO arising from the combustion of biodiesel with NG is exclusively due to the
oxidation of the molecular nitrogen contained in the combustion air, since the biodiesel has no bound
nitrogen in its composition. On the other hand, bound nitrogen is present in the diesel used (see
table 5.2), and, therefore, the formation of NO via fuel mechanism may also take place. The latter can
help to explain the slightly higher NOx emissions from the combustion of diesel when comparing to
biodiesel combustion. These results are consistent with the ones obtained by Tashtoush et al. (2003),
that has also reported larger NOx emissions for petroleum-based diesel due to its higher nitrogen
content.
Figure 5.3 also shows that the CO emissions in the case of diesel combustion are quite con-
stant at around 20 ppm, regardless of the diesel thermal input. Conversely, in the case of biodiesel
combustion, CO emissions increase from 20 to 40 ppm as the biodiesel thermal input increases. This
fact may be explained by the oxygen content of the biodiesel used in the experiments. The formation
of CO in local lean mixture zones is inherent to diffusion flames, and since the oxygen content is
higher, the local mixtures may become even poorer, therefore increasing the local CO concentration.
Another reasonable explanation is the atomization itself, that has revealed to be generally poorer for
biodiesel when comparing to diesel, for the same values of AFR. Local poor atomization can also
lead to an increase in CO emissions, as referred by Coelho and Costa (2007).
47

Figure 5.1: Effect of AFR on pollutant emissions. For all conditions: flue gas O2 = 2% and liquid fuel thermalinput = 120 kW. a) diesel; b) biodiesel.
48

Figure 5.2: Effect of excess air on pollutant emissions. For all conditions: AFR = 2 and liquid fuel thermal input= 120 kW. a) diesel; b) biodiesel.
49

Figure 5.3: Effect of the liquid fuel to NG thermal input ratio on pollutant emissions. For all conditions: AFR =2, flue gas O2 = 2% and Total thermal input = 120 kW. a) diesel; b) biodiesel.
50

5.5 Particulate matter emissions
The investigation of PM emissions during combustion processes is currently of the utmost
importance on nowadays affairs, since they can be quite harmful to human health and some laws are
becoming more and more stringent for what concerns the emission of particulate matter.
Table 5.5 shows the operating conditions for which PM have been collected and their concen-
tration in the flue gases. Diesel combustion showed a significantly higher concentration of PM when
compared to biodiesel’s at the same thermal input and AFR.
When the liquid fuel input decreases and NG is introduced, PM emissions decrease. As for the
effect of atomization quality studied for biodiesel, it is clear that atomization has a strong influence on
PM emissions. Poor atomization leads to significantly higher emissions of PM, resulting from richer
local zones lacking oxygen to complete combustion.
Figure 5.4 shows the PM morphology for typical PM samples. The morphology of the particles
is shown for two amplifications. It is clear that PM are mainly soot aggregates, which are composed
by a large number of carbon particles connected in an irregular way, arising from the cracking of the
gaseous phase.
Figures 5.5 and 5.6 show the chemical composition for typical PM collected. As expected, all
the samples of PM are mainly composed by carbon (soot). Apart from the two main constituents,
minor elements potentially harmful to the human health were found in the PM chemical analysis,
namely F, Cl, K, Na, Si and S in the PM samples from diesel combustion, and Al, Cu, Fe, Na, Si, S
and Cl in the PM samples resulting from biodiesel. These results are consistent with previous studies,
such as that of Agarwal et al. (2011). They reported PM emissions around 60 mg/Nm3 and found
that the PM from diesel and biodiesel present elements such as Cu, Pb, Cr, Ni and Na (diesel) and
Ca, Mg, Fe and Zn (biodiesel).
Table 5.5: Operating conditions for which PM have been collected and their concentration in the flue gases. Forall conditions: flue gas O2 = 2%.
Test conditions PM (mg/Nm3) Sample numberDiesel (kW) Biodiesel (kW) NG (kW) AFR60 - 60 2 74.72 1120 - - 2 90.15 2
- 120 - 2 22.8 3- 120 - 0.5 153.16 4
51

Figure 5.4: Morphology of typical PM for the 4 samples at two magnifications, X4000 and X20000.
52

Figure 5.5: Carbon and oxygen present in the PM. a) Carbon; b) Oxygen.
Figure 5.6: Minor elements present in the PM.
53

54

6Closure
Contents6.1 Conclusions . . . . . . . . . . . . . . . . . . . . . . . . . . . . . . . . . . . . . . . . 566.2 Future work . . . . . . . . . . . . . . . . . . . . . . . . . . . . . . . . . . . . . . . . 58
55
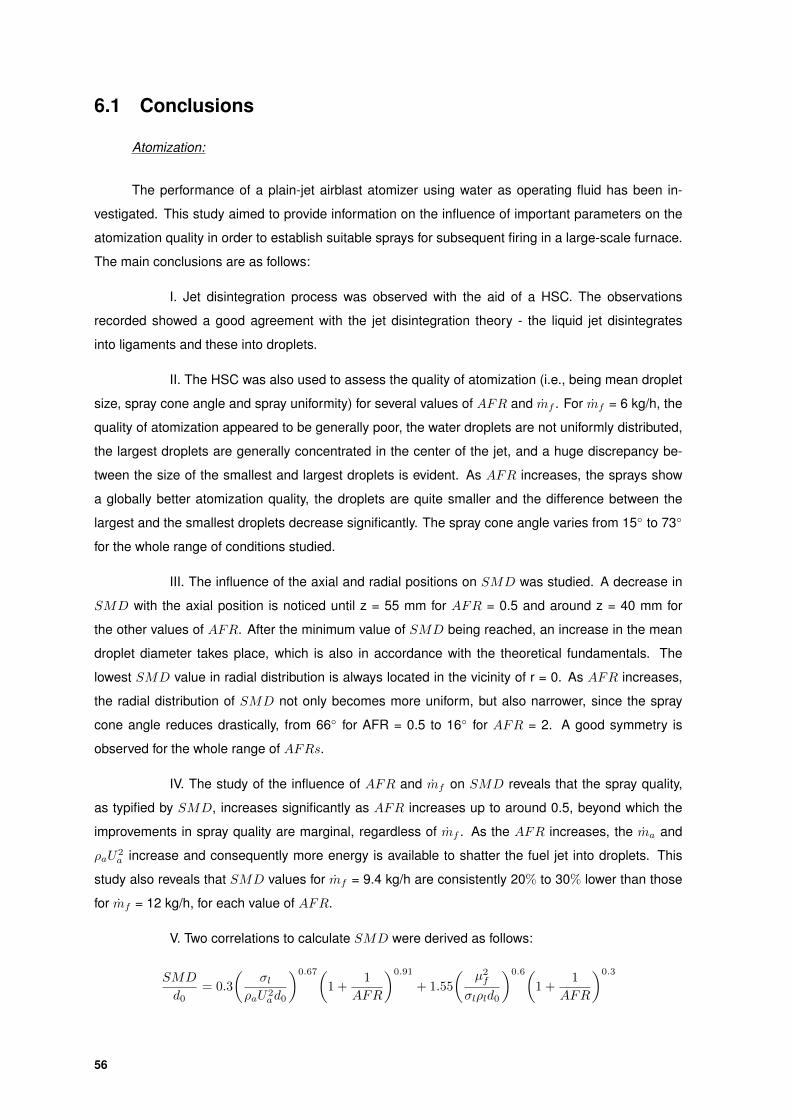
6.1 Conclusions
Atomization:
The performance of a plain-jet airblast atomizer using water as operating fluid has been in-
vestigated. This study aimed to provide information on the influence of important parameters on the
atomization quality in order to establish suitable sprays for subsequent firing in a large-scale furnace.
The main conclusions are as follows:
I. Jet disintegration process was observed with the aid of a HSC. The observations
recorded showed a good agreement with the jet disintegration theory - the liquid jet disintegrates
into ligaments and these into droplets.
II. The HSC was also used to assess the quality of atomization (i.e., being mean droplet
size, spray cone angle and spray uniformity) for several values of AFR and mf . For mf = 6 kg/h, the
quality of atomization appeared to be generally poor, the water droplets are not uniformly distributed,
the largest droplets are generally concentrated in the center of the jet, and a huge discrepancy be-
tween the size of the smallest and largest droplets is evident. As AFR increases, the sprays show
a globally better atomization quality, the droplets are quite smaller and the difference between the
largest and the smallest droplets decrease significantly. The spray cone angle varies from 15◦ to 73◦
for the whole range of conditions studied.
III. The influence of the axial and radial positions on SMD was studied. A decrease in
SMD with the axial position is noticed until z = 55 mm for AFR = 0.5 and around z = 40 mm for
the other values of AFR. After the minimum value of SMD being reached, an increase in the mean
droplet diameter takes place, which is also in accordance with the theoretical fundamentals. The
lowest SMD value in radial distribution is always located in the vicinity of r = 0. As AFR increases,
the radial distribution of SMD not only becomes more uniform, but also narrower, since the spray
cone angle reduces drastically, from 66◦ for AFR = 0.5 to 16◦ for AFR = 2. A good symmetry is
observed for the whole range of AFRs.
IV. The study of the influence of AFR and mf on SMD reveals that the spray quality,
as typified by SMD, increases significantly as AFR increases up to around 0.5, beyond which the
improvements in spray quality are marginal, regardless of mf . As the AFR increases, the ma and
ρaU2a increase and consequently more energy is available to shatter the fuel jet into droplets. This
study also reveals that SMD values for mf = 9.4 kg/h are consistently 20% to 30% lower than those
for mf = 12 kg/h, for each value of AFR.
V. Two correlations to calculate SMD were derived as follows:
SMD
d0= 0.3
(σl
ρaU2ad0
)0.67(1 +
1
AFR
)0.91
+ 1.55
(µ2f
σlρld0
)0.6(1 +
1
AFR
)0.3
56

SMD
d0= 19.2Re−0.15We−0.45
(mf
ma
)0.83
The first equation shows an overall better adjustment to the experimental data.
Combustion:
Following the water spray characterization experiments under non-reacting conditions, combus-
tion tests using diesel and biodiesel as input fuels have been carried out in a large-scale laboratory
furnace. The results include measurements of major gas species and PM emissions, whose mor-
phology and chemical composition were also analyzed. As for HC emissions, they were found to be
insignificant in all the tests performed. The main conclusions are as follows:
I. The study of the effect of the atomization quality on pollutant emissions revealed that
the NOx emissions from biodiesel combustion are always lower than those from diesel combustion.
Two reasons support this evidence: i) fuel bound nitrogen is present in the diesel, and therefore, the
formation of NO via the fuel mechanism can occur, and ii) biodiesel presents a high oxygen content
in its composition, which can lead to lower in-flame temperatures, therefore reducing the formation
of NO via the thermal mechanism. The results also showed that the CO emissions resulting from
biodiesel combustion decrease with the increase of AFR, from 60 to 30 ppm, whereas for diesel, the
CO emissions remain constant around 20 ppm. As for biodiesel, the higher CO concentration at lower
AFR values may be the result of poorer atomization.
II. The results revealed that the NOx emissions increase slightly with increasing excess
air level. Increasing the excess of air will enhance mixing conditions and combustion intensity, re-
sulting in higher flame temperatures, which promotes NO formation via the thermal mechanism. The
combustion of both liquid fuels exhibit similar trends concerning the emissions of CO and NOx. CO
emissions rapidly decrease until O2 = 2%, beyond which they remain unchanged. The high CO emis-
sions observed a low excess air levels is a direct consequence of the low oxygen availability, which
presumably establishes fuel rich zones in the central region of the spray, leading to incomplete com-
bustion and, therefore, higher emissions of CO. As the excess air increases, more O2 becomes avail-
able and, thus, the CO emissions decrease significantly.
III. NOx emissions present a similar overall behavior for the co-combustion of diesel and
biodiesel with NG. The concentration of NOx rises from 20 ppm for pure NG firing to around 35 ppm
for pure biodiesel firing. Similarly, for diesel, NOx emissions increase from 15 to around 45 ppm.
These trends may be related with the increase in the in-flame temperature when increasing the liquid
fuel thermal input, therefore promoting the formation of NO via the thermal mechanism. Fuel bound
nitrogen is present in the diesel used, therefore, the formation of NO via the fuel mechanism may also
take place. The CO emissions in the case of diesel combustion are quite constant at around 20 ppm,
regardess of the diesel thermal input. Conversely, in the case of biodiesel combustion, CO emissions
57

increase from 20 to 40 ppm as the biodiesel thermal input increases. This fact may be explained by
the oxygen content of the biodiesel used in the experiments.
IV. PM have been collected for some specific furnace operating conditions. Diesel com-
bustion showed a significantly higher concentration of PM when compared to biodiesel’s at the same
thermal input and AFR. When the liquid fuel input decreases and NG is introduced, PM emissions
decrease. As for the effect of atomization quality studied for biodiesel, it is clear that atomization
has a strong influence on PM emissions. Poor atomization leads to significantly higher emissions of
PM, resulting from richer local zones lacking oxygen to complete combustion. The images obtained
with the SEM show that it is clear that PM are composed by soot aggregates. Chemical analysis of
the PM revealed that the samples are mainly composed by carbon (soot). Apart from the two main
constituents, minor elements like F, Cl, K, Na, Si and S were also found in the PM from the diesel
combustion. The presence of sulphur is consisted with the diesel analysis. Elements like Al, Cu, Fe,
Na, Si, S and Cl were detected in the PM from biodiesel combustion.
6.2 Future work
As for atomization, it would be interesting to extend the present study to other fluids, including
biodiesel.
In regard to the combustion, to enhance the understanding of the pollutant emissions, in-flame
measurements of temperature and gas species are crucial. With these data, much more information
would be available allowing to draw significantly more consistent conclusions regarding pollutants
formation. In addition, due to their harmful impact on human health, specially the particles of smallest
sizes, it would be interesting to extend the study on PM emissions, namely to obtain data regarding
their size distribution and chemical analysis of each range of sizes.
58

References
A. K. Agarwal, T. Gupta, and A. Kothari. Particulate emissions from biodiesel vs diesel fuelled com-
pression ignition engine. Renewable and Sustainable Energy Reviews, 15(6):3278 – 3300, 2011.
S. A. Basha, K. R. Gopal, and S. Jebaraj. A review on biodiesel production, combustion, emissions
and performance. Renewable and Sustainable Energy Reviews, 13(6-7):1628 – 1634, 2009.
B. Bazooyar, A. Ghorbani, and A. Shariati. Combustion performance and emissions of petrodiesel and
biodiesels based on various vegetable oils in a semi industrial boiler. Fuel, 90(10):3078 – 3092,
2011.
S. Choi and Y. Oh. The spray characteristics of unrefined biodiesel. Renewable Energy, 42:136 –
139, 2012.
P. Coelho and M. Costa. Combustao. Edicoes Orion, 1st edition, 2007.
G. Colson, F. Peeters, and J. D. Ruyck. Experimental in-flame study of a 15mw dual fuel gas/oil
burner. Fuel, 78(11):1253 – 1261, 1999.
M. Costa. On Combustion of Heavy Fuel Oil and Pulverised Coal in a Large-scale Laboratory Fur-
nace. PhD thesis, Imperial College of London, 1992.
E. Delacourt, B. Desmet, and B. Besson. Characterisation of very high pressure diesel sprays using
digital imaging techniques. Fuel, 84(7-8):859 – 867, 2005.
M. Derudi and R. Rota. Experimental study of the mild combustion of liquid hydrocarbons. Proceed-
ings of the Combustion Institute, 33(2):3325 – 3332, 2011.
M. M. Elkotb, M. A. Madhy, and M. E. Montaser. Investigation of external-mixing airblast atomiz-
ers. Proceedings of the 2nd International Conference on Liquid Atomization and Sprays, Madison,
pages 107–115, 1982.
A. Ghorbani, B. Bazooyar, A. Shariati, S. M. Jokar, H. Ajami, and A. Naderi. A comparative study
of combustion performance and emission of biodiesel blends and diesel in an experimental boiler.
Applied Energy, 88(12):4725 – 4732, 2011.
C.-H. Hwang, S. Lee, J.-H. Kim, and C.-E. Lee. An experimental study on flame stability and pollutant
emission in a cyclone jet hybrid combustor. Applied Energy, 86(7a8):1154 – 1161, 2009.
59

T. Imamura and N. Nagai. The relative performance of externally and internally-mixed twin-fluid atom-
izers. Proceedings of the 3rd International Conference on Liquid Atomization and Sprays, London,
1985.
A. K. Jasuja. Plain-jet airblast atomization of alternative liquid petroleum fuels under high ambient air
pressure conditions. ASME Paper 82-GT-32, 1982.
Jose, A. Al-Kassir, J.A. y Lopez Sastre, and J. Ganan. Analysis of biodiesel combustion in a boiler
with a pressure operated mechanical pulverisation burner. Fuel Processing Technology, 92(2):271
– 277, 2011.
R. Klein-Douwel, P. Frijters, L. Somers, W. de Boer, and R. Baert. Macroscopic diesel fuel spray
shadowgraphy using high speed digital imaging in a high pressure cell. Fuel, 86(12-13):1994 –
2007, 2007.
J. Y. Lee, P. H. Lee, C. S. Park, B. I. Park, and S. S. Hwang. Combustion characteristics of mixture of
anode off gas and lng in reformer. International Journal of Hydrogen Energy, 36(8):5181 – 5188,
2011.
A. H. Lefebvre. Atomization and Sprays. Hemisphere Publishing Corporation, 1989.
G. E. Lorenzetto and A. H. Lefebvre. Measurements on drop size on a plain jet air blast atomizer.
AIAA J., 15(7):1006–1010, 1977.
P. Meyer and N. Chigier. Dropsize measurements using a Malvern 2200 Particle Sizer. Atomization
and Spray Technology, 2:261 – 298, 1986.
H. K. Ng and S. Gan. Combustion performance and exhaust emissions from the non-pressurised
combustion of palm oil biodiesel blends. Applied Thermal Engineering, 30(16):2476 – 2484, 2010.
S. H. Park, H. J. Kim, H. K. Suh, and C. S. Lee. Atomization and spray characteristics of bioethanol
and bioethanol blended gasoline fuel injected through a direct injection gasoline injector. Interna-
tional Journal of Heat and Fluid Flow, 30(6):1183 – 1192, 2009.
S. H. Park, J. Cha, H. J. Kim, and C. S. Lee. Effect of early injection strategy on spray atomization
and emission reduction characteristics in bioethanol blended diesel fueled engine. Energy, 39(1):
375 – 387, 2012.
P. Queiros. Atomizacao e combustao de glicerina. Master’s thesis, Instituto Superior Tecnico, Lisboa,
Portugal, 2011.
P. Queiros, M. Costa, and R. Carvalho. Co-combustion of crude glycerin with natural gas and hydro-
gen. Proceedings of the Combustion Institute, 2012.
N. K. Rizk and A. H. Lefebvre. Spray characteristics of plain-jet airblast atomizers. ASME J. Eng. Gas
Turbine Power, 106:639–644, 1984.
60

G. Tashtoush, M. I. Al-Widyan, and A. O. Al-Shyoukh. Combustion performance and emissions of
ethyl ester of a waste vegetable oil in a water-cooled furnace. Applied Thermal Engineering, 23(3):
285 – 293, 2003.
X. Zhou and H.-Z. Yu. Experimental investigation of spray formation as affected by sprinkler geometry.
Fire Safety Journal, 46(3):140 – 150, 2011.
61

62