1 Quaero Bruce Knuteson Berkeley/Chicago An automatic model-tester A new way to publish HEP data.
DECEMBER 2004 1763K N U T E S O N E T A L .
q 2004 American Meteorological Society
Atmospheric Emitted Radiance Interferometer. Part I: Instrument Design
R. O. KNUTESON, H. E. REVERCOMB, F. A. BEST, N. C. CIGANOVICH, R. G. DEDECKER, T. P. DIRKX,S. C. ELLINGTON, W. F. FELTZ, R. K. GARCIA, H. B. HOWELL, W. L. SMITH, J. F. SHORT, AND D. C. TOBIN
Space Science and Engineering Center, University of Wisconsin—Madison, Madison, Wisconsin
(Manuscript received 8 January 2004, in final form 20 May 2004)
ABSTRACT
A ground-based Fourier transform spectrometer has been developed to measure the atmospheric downwellinginfrared radiance spectrum at the earth’s surface with high absolute accuracy. The Atmospheric Emitted RadianceInterferometer (AERI) instrument was designed and fabricated by the University of Wisconsin Space Scienceand Engineering Center (UW-SSEC) for the Department of Energy (DOE) Atmospheric Radiation Measurement(ARM) Program. This paper emphasizes the key features of the UW-SSEC instrument design that contribute tomeeting the AERI instrument requirements for the ARM Program. These features include a highly accurateradiometric calibration system, an instrument controller that provides continuous and autonomous operation, anextensive data acquisition system for monitoring calibration temperatures and instrument health, and a real-timedata processing system. In particular, focus is placed on design issues crucial to meeting the ARM requirementsfor radiometric calibration, spectral calibration, noise performance, and operational reliability. The detailedperformance characteristics of the AERI instruments built for the ARM Program are described in a companionpaper.
1. Introduction
The central role of radiative processes in climatechange led, in the 1980s, to an intercomparison of ra-diation codes used in climate models (Luther et al.1988). The study group recommended ‘‘a program tosimultaneously measure spectral radiance at high spec-tral resolution along with atmospheric data necessary tocalculate radiances’’ (Ellingson and Fouquart 1991). In1991, a plan to deploy state-of-the-art instruments wasrealized during the Spectral Radiance Experiment(SPECTRE; Ellingson and Wiscombe 1996). The ex-perimental approach of SPECTRE became the core ofa new initiative by the Department of Energy (DOE)known as the Atmospheric Radiation Measurement(ARM) Program (DOE 1990). The ARM Program ex-tended the SPECTRE measurement concept by sup-porting the development of automated systems thatwould make long-duration measurements at dedicatedobserving sites. The ARM Program plan called for mea-surements of downwelling thermal emission at the sur-face with high spectral resolution and high absolute ac-curacy. The instrument selected for the measurement ofthermal emission at ‘‘one wavenumber’’ spectral reso-lution was the Atmospheric Emitted Radiance Interfer-
Corresponding author address: Dr. Robert O. Knuteson, SpaceScience and Engineering Center, University of Wisconsin—Madison,1225 West Dayton St., Madison, WI 53706.E-mail: [email protected]
ometer (AERI) developed by the University of Wis-consin Space Science and Engineering Center (UW-SSEC). The ARM Program has subsequently deployedAERI instruments at dedicated sites in the SouthernGreat Plains (SGP), the North Slope of Alaska (NSA),and the Tropical Western Pacific (TWP; Stokes andSchwartz 1994).
The AERI instrument is designed to meet the needsof the ARM Program for 0.5-wavenumber (unapodized)spectrally resolved emission data for application to stud-ies of both clear-sky and cloud-radiative properties. Theclear-sky AERI observations are contributing to a betterunderstanding of infrared spectroscopic issues, in par-ticular the water vapor continuum, important for vali-dation of infrared radiative transfer models (Revercombet al. 2003; Tobin et al. 1999; Turner et al. 2004). Theremote sensing capabilities of the AERI instruments be-low cloud level are being used to provide real-time tem-perature and water vapor profiling in the lowest 2–3 kmof the atmosphere (Feltz et al. 1998; Smith et al. 1999;Turner et al. 2000). The AERI instruments are also beingused within the ARM Program to remotely sense cloud-radiative and microphysical properties (Collard et al.1995; Mace et al. 1998; DeSlover et al. 1999; Turneret al. 2003).
In the following, the AERI instrument requirementspecification for the ARM Program is presented alongwith the design features important for meeting thoserequirements. The predeployment performance data ofthe AERI instruments built for the ARM Program are
1764 VOLUME 21J O U R N A L O F A T M O S P H E R I C A N D O C E A N I C T E C H N O L O G Y
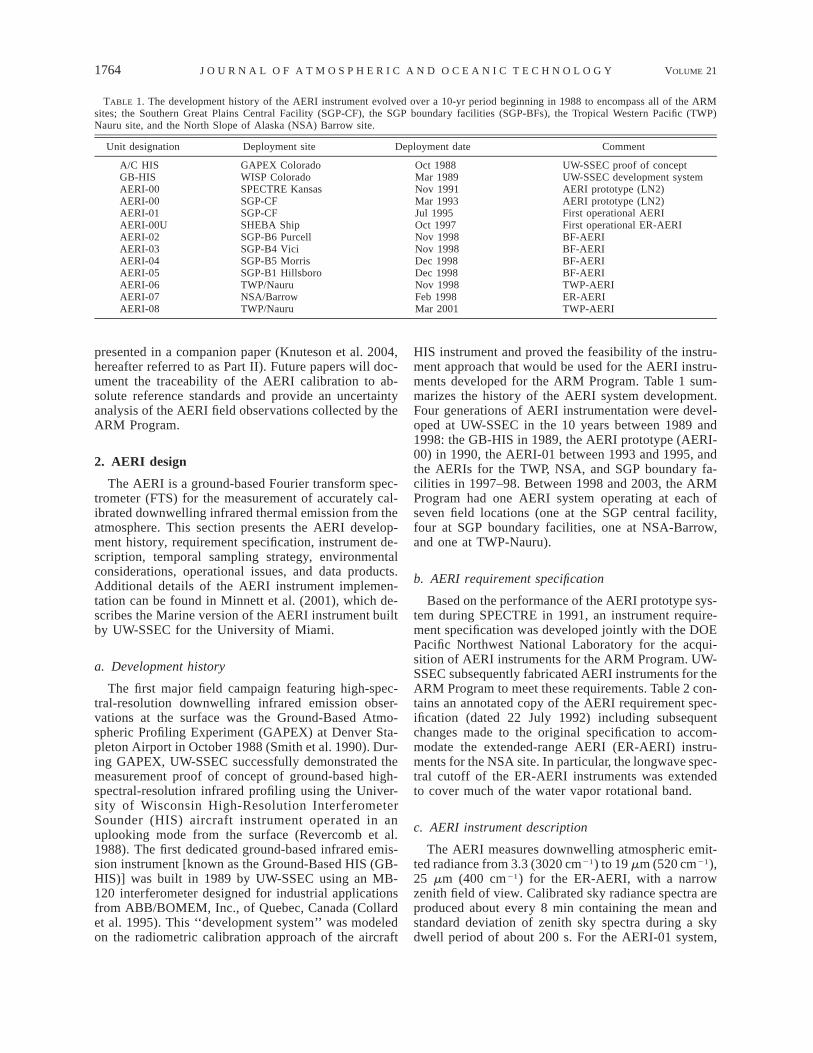
TABLE 1. The development history of the AERI instrument evolved over a 10-yr period beginning in 1988 to encompass all of the ARMsites; the Southern Great Plains Central Facility (SGP-CF), the SGP boundary facilities (SGP-BFs), the Tropical Western Pacific (TWP)Nauru site, and the North Slope of Alaska (NSA) Barrow site.
Unit designation Deployment site Deployment date Comment
A/C HISGB-HISAERI-00AERI-00AERI-01AERI-00UAERI-02AERI-03AERI-04AERI-05AERI-06AERI-07AERI-08
GAPEX ColoradoWISP ColoradoSPECTRE KansasSGP-CFSGP-CFSHEBA ShipSGP-B6 PurcellSGP-B4 ViciSGP-B5 MorrisSGP-B1 HillsboroTWP/NauruNSA/BarrowTWP/Nauru
Oct 1988Mar 1989Nov 1991Mar 1993Jul 1995Oct 1997Nov 1998Nov 1998Dec 1998Dec 1998Nov 1998Feb 1998Mar 2001
UW-SSEC proof of conceptUW-SSEC development systemAERI prototype (LN2)AERI prototype (LN2)First operational AERIFirst operational ER-AERIBF-AERIBF-AERIBF-AERIBF-AERITWP-AERIER-AERITWP-AERI
presented in a companion paper (Knuteson et al. 2004,hereafter referred to as Part II). Future papers will doc-ument the traceability of the AERI calibration to ab-solute reference standards and provide an uncertaintyanalysis of the AERI field observations collected by theARM Program.
2. AERI design
The AERI is a ground-based Fourier transform spec-trometer (FTS) for the measurement of accurately cal-ibrated downwelling infrared thermal emission from theatmosphere. This section presents the AERI develop-ment history, requirement specification, instrument de-scription, temporal sampling strategy, environmentalconsiderations, operational issues, and data products.Additional details of the AERI instrument implemen-tation can be found in Minnett et al. (2001), which de-scribes the Marine version of the AERI instrument builtby UW-SSEC for the University of Miami.
a. Development history
The first major field campaign featuring high-spec-tral-resolution downwelling infrared emission obser-vations at the surface was the Ground-Based Atmo-spheric Profiling Experiment (GAPEX) at Denver Sta-pleton Airport in October 1988 (Smith et al. 1990). Dur-ing GAPEX, UW-SSEC successfully demonstrated themeasurement proof of concept of ground-based high-spectral-resolution infrared profiling using the Univer-sity of Wisconsin High-Resolution InterferometerSounder (HIS) aircraft instrument operated in anuplooking mode from the surface (Revercomb et al.1988). The first dedicated ground-based infrared emis-sion instrument [known as the Ground-Based HIS (GB-HIS)] was built in 1989 by UW-SSEC using an MB-120 interferometer designed for industrial applicationsfrom ABB/BOMEM, Inc., of Quebec, Canada (Collardet al. 1995). This ‘‘development system’’ was modeledon the radiometric calibration approach of the aircraft
HIS instrument and proved the feasibility of the instru-ment approach that would be used for the AERI instru-ments developed for the ARM Program. Table 1 sum-marizes the history of the AERI system development.Four generations of AERI instrumentation were devel-oped at UW-SSEC in the 10 years between 1989 and1998: the GB-HIS in 1989, the AERI prototype (AERI-00) in 1990, the AERI-01 between 1993 and 1995, andthe AERIs for the TWP, NSA, and SGP boundary fa-cilities in 1997–98. Between 1998 and 2003, the ARMProgram had one AERI system operating at each ofseven field locations (one at the SGP central facility,four at SGP boundary facilities, one at NSA-Barrow,and one at TWP-Nauru).
b. AERI requirement specification
Based on the performance of the AERI prototype sys-tem during SPECTRE in 1991, an instrument require-ment specification was developed jointly with the DOEPacific Northwest National Laboratory for the acqui-sition of AERI instruments for the ARM Program. UW-SSEC subsequently fabricated AERI instruments for theARM Program to meet these requirements. Table 2 con-tains an annotated copy of the AERI requirement spec-ification (dated 22 July 1992) including subsequentchanges made to the original specification to accom-modate the extended-range AERI (ER-AERI) instru-ments for the NSA site. In particular, the longwave spec-tral cutoff of the ER-AERI instruments was extendedto cover much of the water vapor rotational band.
c. AERI instrument description
The AERI measures downwelling atmospheric emit-ted radiance from 3.3 (3020 cm21) to 19 mm (520 cm21),25 mm (400 cm21) for the ER-AERI, with a narrowzenith field of view. Calibrated sky radiance spectra areproduced about every 8 min containing the mean andstandard deviation of zenith sky spectra during a skydwell period of about 200 s. For the AERI-01 system,
DECEMBER 2004 1765K N U T E S O N E T A L .
the sky dwell period is composed of 45 ‘‘forward’’ and45 ‘‘backward’’ Michelson interferometer scans, whilefor the faster-scanning AERI-02 (and later systems), 90complete scans are obtained in the same dwell time. Theremaining time is spent viewing two internal calibrationreference targets. The AERI real-time output, which isaccessible through a network connection, consists ofradiometrically and spectrally calibrated radiances cor-rected for all instrument effects. Figure 1 illustrates typ-ical ‘‘clear sky’’ measurements of downwelling atmo-spheric infrared emission at the surface as observed atthe ARM SGP, NSA, and TWP sites. The midlatitudeAERI observations from the ARM SGP site (Oklahoma/Kansas) typically fall in the range between the Arcticand tropical measurements.
The AERI is composed of two major assemblies: theinterferometer/optics bench assembly and the electron-ics support equipment rack. Figure 2 is a block diagramindicating the subsystem components that will be de-scribed in this paper. The interferometer/optics benchassembly protrudes through a thermally insulated sidewall of a building, exposing the front-end optics andcalibration blackbodies to ambient temperature, whileallowing the interferometer and the electronics supportequipment to operate at room temperature. The verticalplate that provides structural support for the front-endoptics and blackbody assembly is an integral part of theoptics bench. This plate, which is made of GE Noryl,also provides a thermal barrier between the inside andoutside. The outside portion of the AERI is containedin a weatherproof enclosure with an open view port tothe sky. An automated hatch mechanism closes the viewport in rain or snow conditions. This enclosure attachesto the side of the building that houses the AERI and ispassively designed to be at outside ambient temperature.Figure 3 shows the installation at the ARM SGP CentralFacility near Lamont, Oklahoma. The AERI sensor(based on measurements of AERI-00U) weighs about80 kg (175 lb), plus an additional 36 kg (80 lb) for theelectronics rack. The measured power is 828 W peak(7.2 A at 115 VAC) and 529 W steady state (4.6 A at115 VAC).
1) INTERFEROMETER/OPTICS BENCH ASSEMBLY
The interferometer/optics bench assembly is com-posed of the interferometer subsystem, the front-endoptics and calibration blackbodies, and the mechanicallycooled infrared detector. All of these items are struc-turally coupled to a common optical bench mounted tothe field site facility structure via mechanical isolatorsattached to a slide plate. Figure 4 identifies the mainoptical assembly components of the AERI instrument.
(i) Interferometer subsystem
The interferometer used in the AERI system is thecommercially available MR-100 series manufactured by
ABB/BOMEM, Inc. The aft optics used is the ‘‘radio-metric option’’ with a well-defined aperture stop andselectable field stop. The MR-100 is a stand-alone in-terferometer including the detector preamplifiers, analogfilters, and analog-to-digital electronics. An autostart se-quence upon power-up initializes the system using a‘‘white light’’ source without the need for operator in-tervention. The interferometer uses an internal helium–neon laser in the detector sampling, leading to a highlystable spectral calibration. Table 3 summarizes the in-terferometer characteristics common to all the AERIinstruments built for the ARM Program. The unusedentrance port on the MB-100 four-port interferometeris covered with a massive copper block with a black-ened, grooved surface containing a temperature monitor(‘‘second-port temperature’’). The thermal inertia of thecopper block provides a stable reference for the unusedentrance port during the 10-min calibration period.Since the emission from the ‘‘second port’’ is constantduring sky and blackbody views, it is removed by theonboard calibration.
(ii) Calibration subsystem
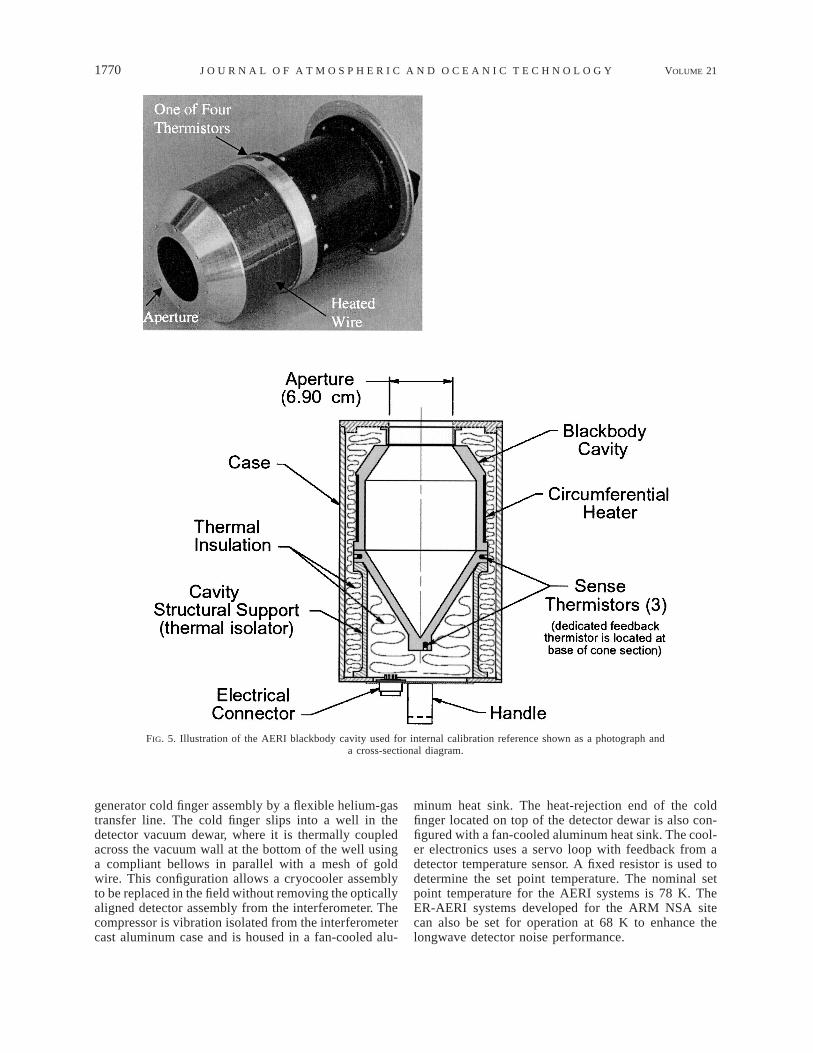
The front-end optics and calibration subsystems weredeveloped at UW-SSEC to meet the ARM requirementfor absolute radiometric calibration. The AERI systemuses a full-aperture two-point radiometric calibrationwith onboard reference blackbodies that use temperaturemeasurements traceable to the National Institute of Stan-dards and Technology (NIST) resistance standards. Thecalibration sources are precision blackbodies built atUW-SSEC using a geometry with high cavity emissiv-ity. The ambient temperature reference blackbody(ABB) is unheated and operates near outdoor ambienttemperature, and the hot temperature reference black-body (HBB) is temperature controlled to a fixed tem-perature near 608C. Three YSI Super Stable thermistorsare imbedded in each blackbody cavity to measure tem-perature. A dedicated thermistor is used for temperaturecontrol. Figure 5 shows a picture of a UW-SSEC AERIblackbody with the thermal insulating jacket removed.Each thermistor is calibrated at UW-SSEC after thethermistor is installed in the blackbody using a NIST-traceable standard with absolute temperature knowledgeto better than 60.03 K (3s). The thermistor calibrationuses the same high-precision readout electronics that areused in each AERI system. The resistance measurementis described later. This scheme eliminates errors asso-ciated with the self-heating of the thermistors duringreadout. The thermistor calibration is done at five dif-ferent temperatures over the operating range. A leastsquares fit to the temperature/resistance calibrationpoints is used to determine the three unique Steinhartand Hart thermistor coefficients relating thermistor re-sistance to temperature (Steinhart and Hart 1968). Thesecoefficients are entered into the AERI real-time softwareconfiguration parameters for the instrument on which
1766 VOLUME 21J O U R N A L O F A T M O S P H E R I C A N D O C E A N I C T E C H N O L O G Y
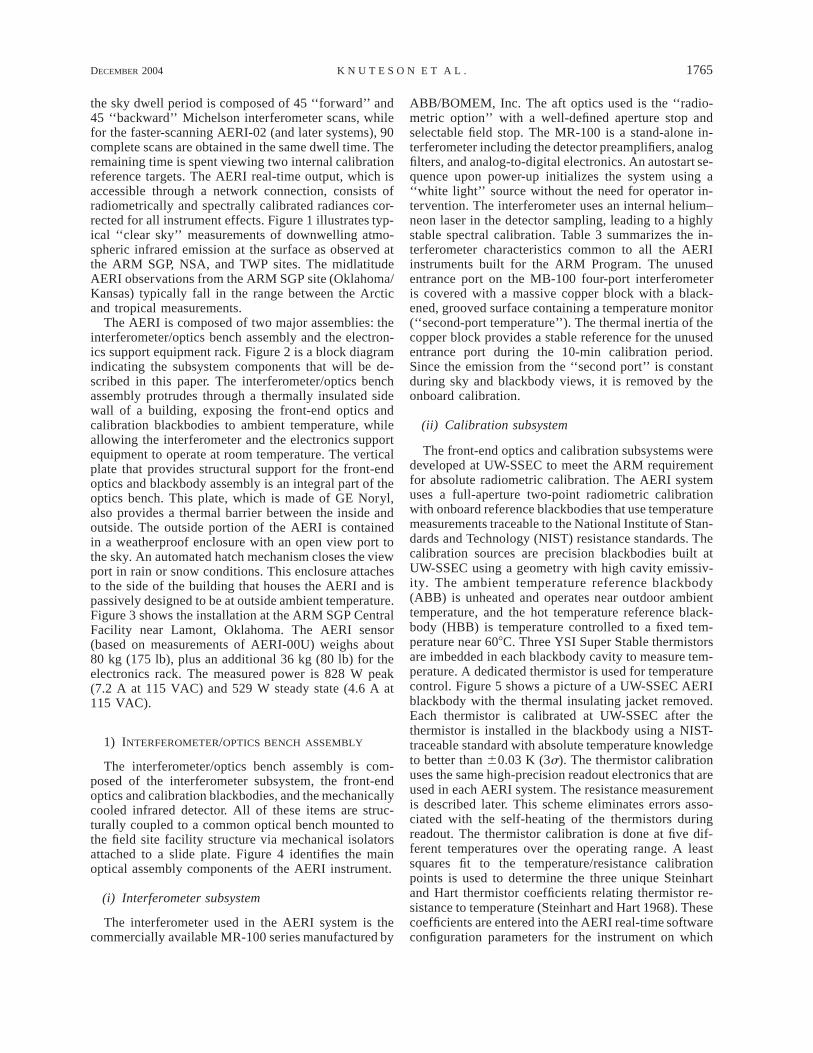
TABLE 2. AERI instrument requirement specifications.
Item Specification
General system elements ● Michelson interferometer with PC computer interface.● Full-aperture temperature-controlled calibration reference sources.● Automated system for providing sequential views of the sky (zenith) and two reference
sources for calibration.● Environmental Monitoring System, for collection of blackbody temperatures and other
housekeeping data.● Computer and Data Handling System. Its control functions involve sequencing all AERI op-
erations, including scene switching, ingesting of interferometer and Environmental Moni-toring System data, calibration, and data transfer. Data handling includes acquisition, pro-cessing, display, and networking.
Radiometric performance specifi-cations
The required radiometric performance for the AERI is defined by specifying the spectral cov-erage and resolution, the spatial field of view, and the absolute calibration accuracy and re-producibility.
Spectral coverage and resolution(standard AERI)
Coverage: 550–3000 cm21 (3.3–18.2 mm).Resolution: 0.5 cm21, unapodized. [max optical path difference (OPD) of 1 cm].
Spatial FOV Angular FOV: ,100 mrad full angle.
Radiomeric calibration Absolute accuracy: ,1% of ambient blackbody radiance.Reproducibility: ,0.2% of ambient blackbody radiance.
AERI subsystem specifications Blackbody cavity characterization● Temperature knowledge: 60.18C of absolute temperature.● Emissivity knowledge: better than 60.1%.● Temperature gradient: 0.358C (knowledge to within 0.18C).● Temperature stability: better than 0.058C over viewing period (ø120 s).Nonlinearity knowledge: better than 0.1%.Polarization: ,0.1%.
Wavelength calibration Channel wavenumber knowledge: better than 0.01 cm21.
Noise ,0.2 mW (m2 sr cm21)21 for 670–1400 cm21 (standard AERI).
(Rms for 2-min blackbody view) ,0.4 mW (m2 sr cm21)21 for 420–1400 cm21 (ER-AERI) (except 667 cm21, where CO2 in theinstrument reduces responsivity). ,0.015 mW (m2 sr cm21)21 for 2000–2600 cm21 (except2300–2400 cm21, where CO2 in the instrument reduces responsivity).
Temporal sampling Repeat cycle: ø10 min with programmable limits for sky and blackbody viewing at absolutetime intervals.
(Note: Typically it is expected that the sky will be viewed for about 4 min and each of thetwo blackbodies for about 2 min.)
Interferometer scan period: ,2 s.(Note: The stated requirement would allow a 50 m s21 cloud at 10 km to move only 10% of a
100-mrad FOV during a single scan.)
Operational requirements The AERI automatic control system hardware shall contain these features:● Scheduled sequencing of the following operations:
—Scene switching between sky and blackbody views.—Interferometer and housekeeping data acquisition and transfer.—Interferometer detector servicing.
● Capability of remotely changing the operations listed above.● 24-h continuous operations with data output at 10-min intervals.● Scheduled maintenance: not less than 7 days.● Real-time display with flags for out-of-limit conditions. Examples of quantities to select
from include the following:—Spectra from sky and blackbody views.—Housekeeping data (interferometer temperature, ambient temperature, blackbody tempera-
tures, electronics temperature).—Blackbody spectral variance.—Scene mirror position.—Environmental Monitoring System measurement stability (determined from dedicated chan-
nels reading fixed precision resistors).
Operating environment The operating AERI instrument front end including the scene mirror, blackbodies, and interfer-ometer front window will be exposed to an outside ambient environment with temperatureextremes from 2308 to 1408C (2708 to 1408C for the ER-AERI systems). The AERI willbe protected from rain or other nonoperating conditions by a waterproof housing with ahatch (this housing with hatch is not the responsibility of the AERI vendor). The remainderof the AERI system (the interferometer, electronics, and computers) will be housed in a con-trolled environment at 208 6 58C (the temperature-controlled housing is not the responsibili-ty of the AERI vendor).
Networking The AERI shall use TCPIP networking with ftp and bootp functions.

DECEMBER 2004 1767K N U T E S O N E T A L .
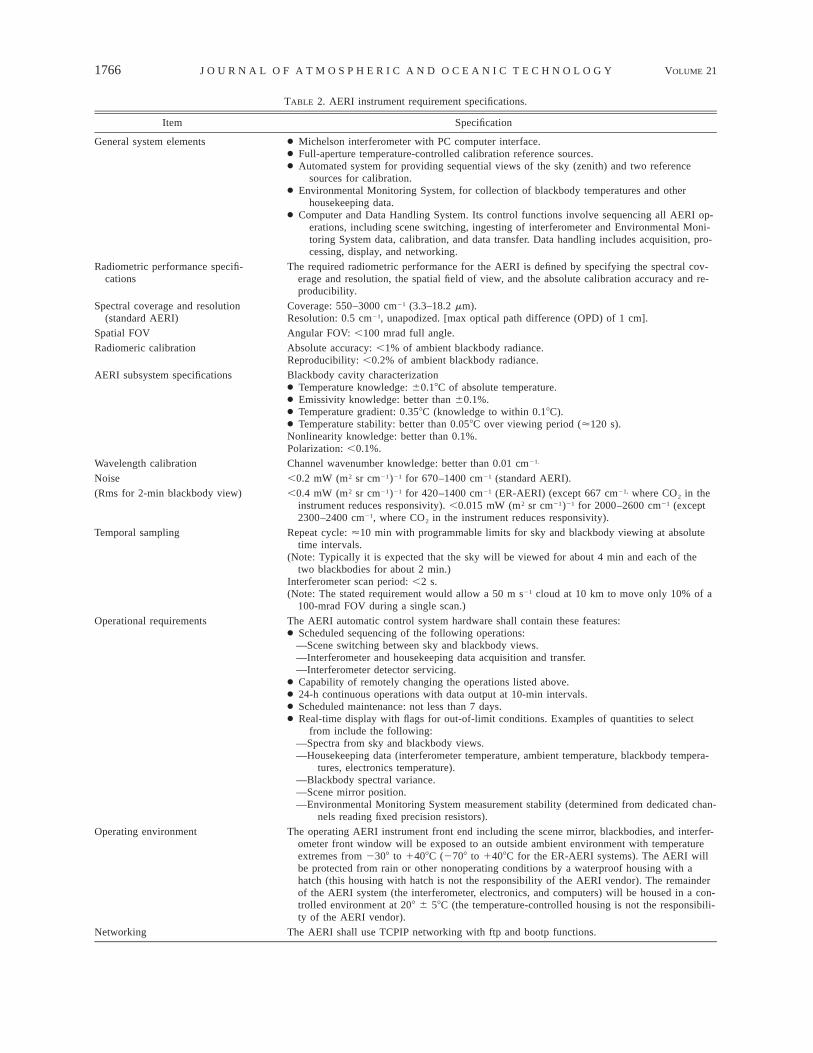
TABLE 2. (Continued)
Item Specification
Data products The AERI data products are divided into primary and secondary products. The primary prod-ucts required for scientific use include evaluation of the data quality. The secondary prod-ucts provide important auxiliary information for real-time monitoring of operations as wellas historical data for subsequent quality control.
Primary (every viewing cycle; ø10 min):● Calibrated spectra.● Standard deviation for blackbody and sky views.● Calibration coefficient and blackbody temperatures.Secondary (every cycle):● Ambient air temperature.● Ambient pressure.● Ambient humidity.● Instrument housekeeping data.● Vertical sky images (Note: feature not implemented).
FIG. 1. AERI ‘‘clear sky’’ observations from the ARM TWP-Nauru(2002 UTC 15 Nov 1998), NSA-Barrow (1201 UTC 10 Mar 1999),and SGP Central Facility (0146 UTC Sep 2000) sites. The wave-number range 400–3000 cm21 corresponds to the thermal infraredwavelengths of 25–3.3 mm. AERI observations from the midlatitudeARM SGP site (Oklahoma/Kansas) typically span the range betweenthe Arctic and tropical measurements. AERI radiance units, RU 5mW (m2 sr cm21)21.
the blackbody is installed. The AERI blackbodies areall mechanically identical and can be interchanged with-out compromising alignment because of a unique align-ment registration scheme. The overall temperatureknowledge of the blackbody is required to be better than60.10 K (3s). The UW-SSEC has experience with thefabrication and NIST-traceable calibration of over 40 ofthese blackbodies.
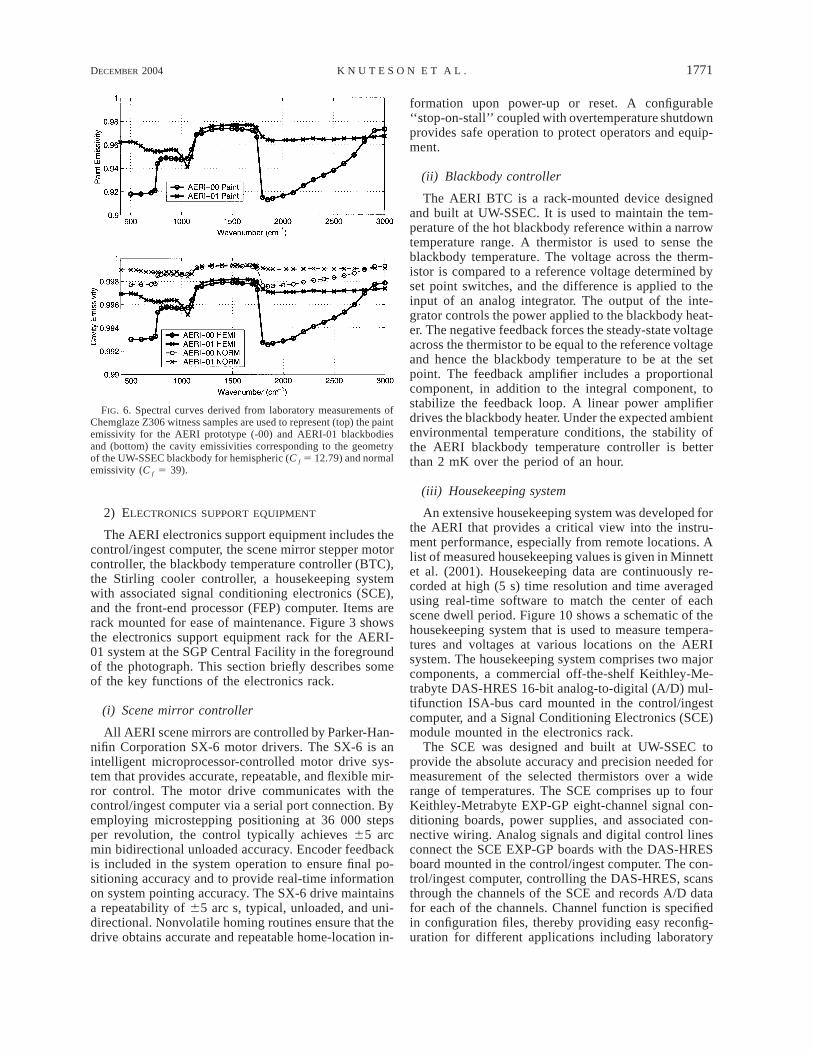
The blackbody emissivity is obtained from measure-ments of witness samples of the diffuse paint (Chem-glaze Z306) used to coat the interior surfaces of theblackbodies and a model for the cavity effect. The over-all blackbody cavity emissivity knowledge is requiredto be better than 60.1%, with an emissivity greater than0.990. Figure 6 shows the measured paint emissivity
and computed cavity emissivity spectra used to repre-sent the AERI blackbodies. The cavity emissivity isrelated to the measured paint emissivity, , through themey
approximate relation
meycave 5 . (1)y m1 2 eyme 1y Cf
A cavity factor C f of 12.79 has been used in the ra-diometric calibration for all AERI systems to date basedupon a theoretical estimate of the hemispheric cavityemissivity that makes use of the same cavity geometry(Sydnor 1970). A more recent Monte Carlo ray traceanalysis of the cavity geometry indicates that the pre-vious estimate of cavity factor is too low when the re-stricted field of view of the AERI system is consideredat nearly normal incidence. Detailed results of this on-going analysis will be reported at a later date. A pre-liminary estimate for the cavity normal emissivity givesa C f of about 39.
(iii) Spatial field of view
In order to avoid the need for a telescope in front ofthe interferometer, the beam diameter defined by theentrance aperture to the interferometer was used alongwith the field angle to size the front-end optics andcalibration references sources. A 458 gold-coated mirrorattached to a computer-controlled stepper motor is usedto switch between zenith sky and calibration referencesources. The polarization insensitivity of bare gold tothe angular rotation of the scene mirror is used to avoida polarization sensitivity of the interferometer, whichwould otherwise lead to a calibration error, since thereference sources are located at 6608 from the verticalsky view. Since the interferometer is immediately be-hind the scene mirror, the spatial field of view (FOV)of the AERI instruments is equal to the interferometerFOV. The FOV half-angle is determined by the selectionof an internal field stop. The field stop used in the AERIprototype (15-mrad half-angle) and AERI-01 systems
1768 VOLUME 21J O U R N A L O F A T M O S P H E R I C A N D O C E A N I C T E C H N O L O G Y
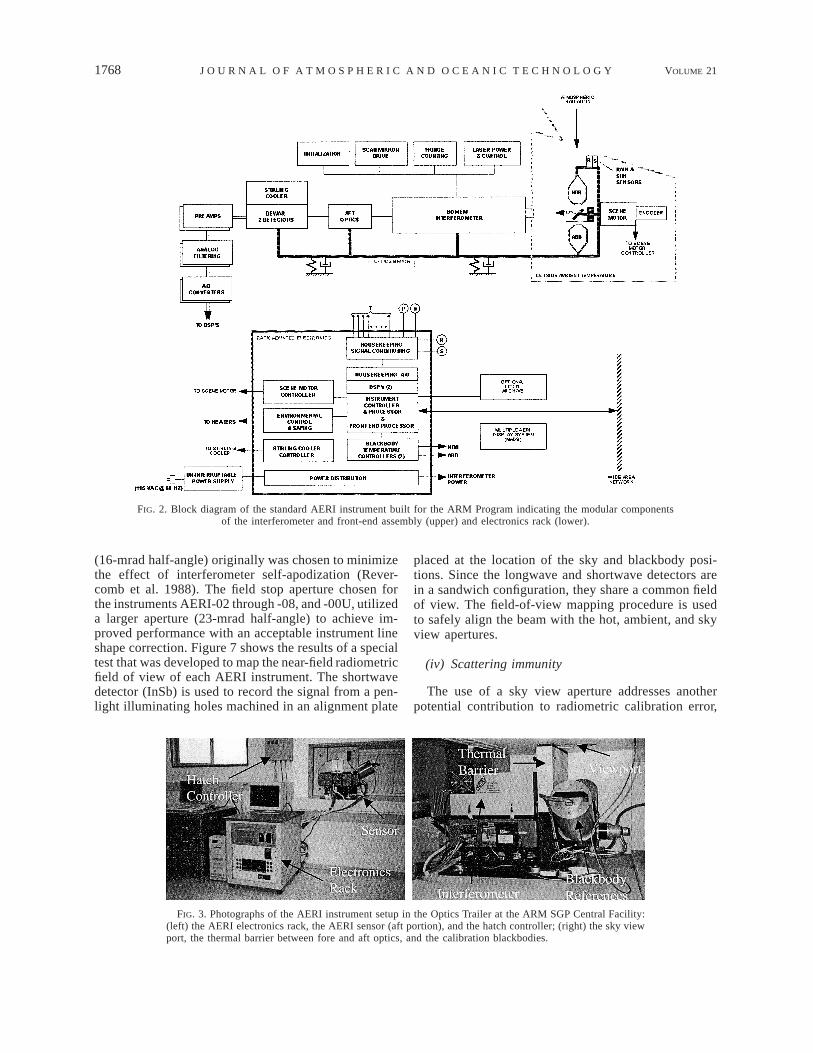
FIG. 2. Block diagram of the standard AERI instrument built for the ARM Program indicating the modular componentsof the interferometer and front-end assembly (upper) and electronics rack (lower).
FIG. 3. Photographs of the AERI instrument setup in the Optics Trailer at the ARM SGP Central Facility:(left) the AERI electronics rack, the AERI sensor (aft portion), and the hatch controller; (right) the sky viewport, the thermal barrier between fore and aft optics, and the calibration blackbodies.
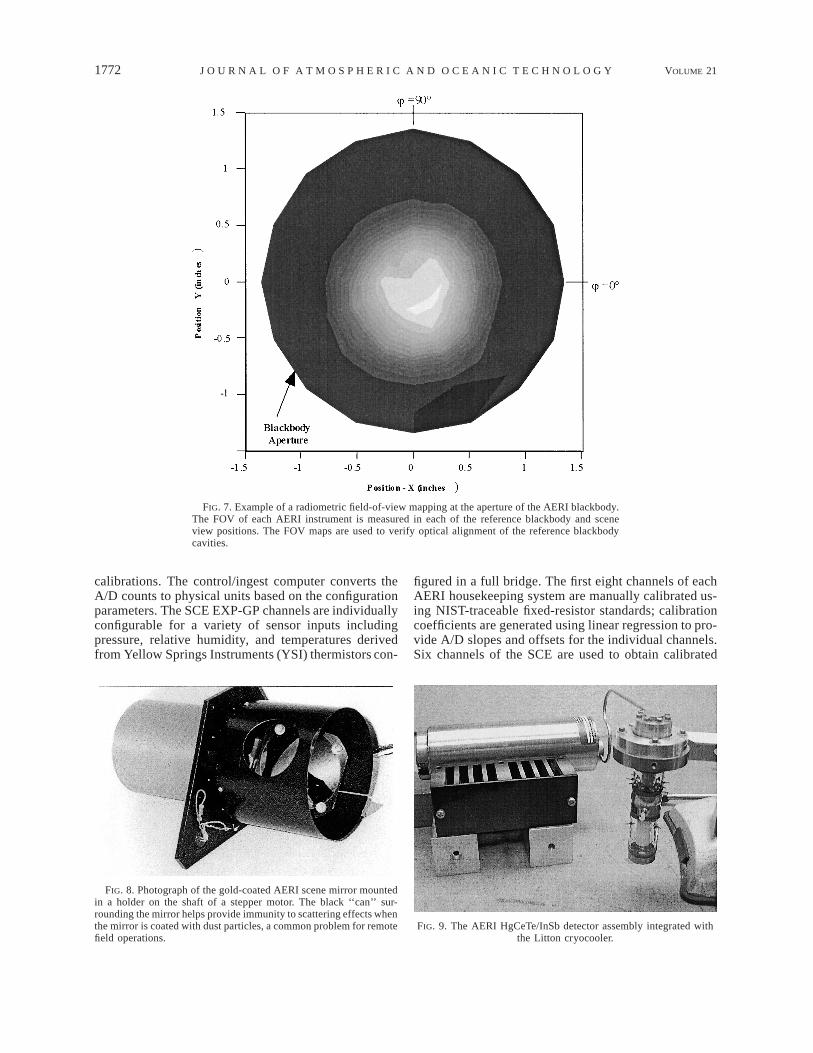
(16-mrad half-angle) originally was chosen to minimizethe effect of interferometer self-apodization (Rever-comb et al. 1988). The field stop aperture chosen forthe instruments AERI-02 through -08, and -00U, utilizeda larger aperture (23-mrad half-angle) to achieve im-proved performance with an acceptable instrument lineshape correction. Figure 7 shows the results of a specialtest that was developed to map the near-field radiometricfield of view of each AERI instrument. The shortwavedetector (InSb) is used to record the signal from a pen-light illuminating holes machined in an alignment plate
placed at the location of the sky and blackbody posi-tions. Since the longwave and shortwave detectors arein a sandwich configuration, they share a common fieldof view. The field-of-view mapping procedure is usedto safely align the beam with the hot, ambient, and skyview apertures.
(iv) Scattering immunity
The use of a sky view aperture addresses anotherpotential contribution to radiometric calibration error,
DECEMBER 2004 1769K N U T E S O N E T A L .
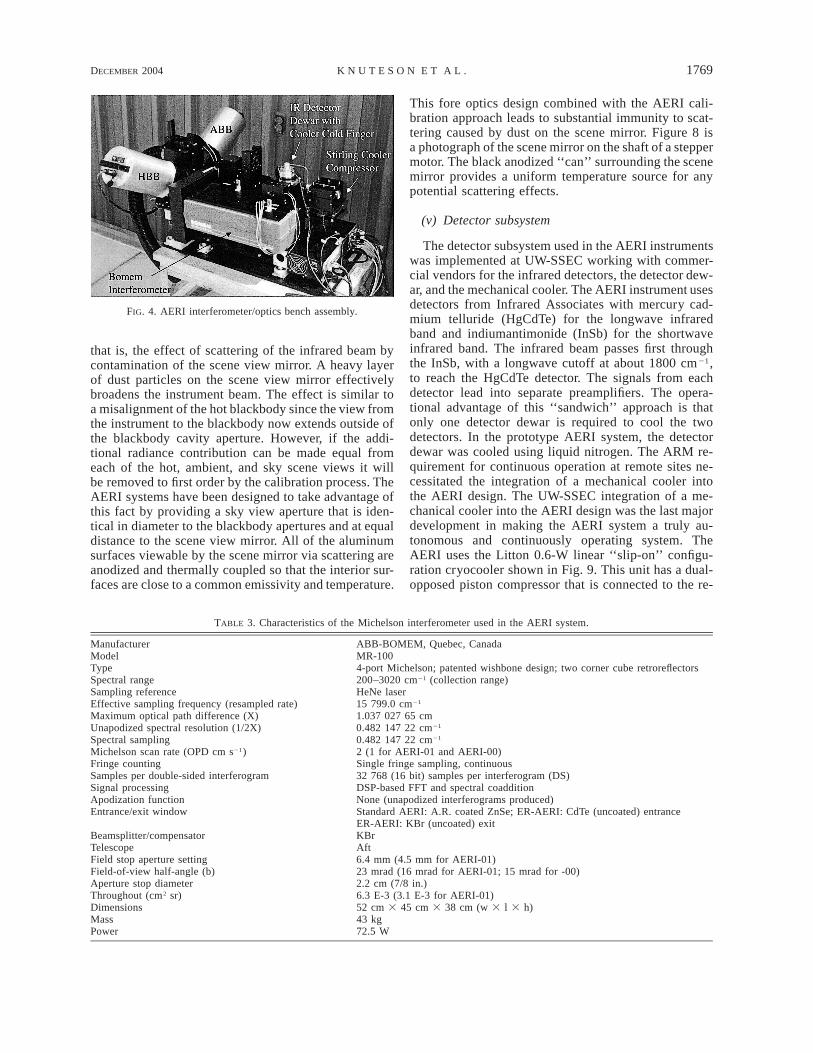
FIG. 4. AERI interferometer/optics bench assembly.
TABLE 3. Characteristics of the Michelson interferometer used in the AERI system.
Manufacturer ABB-BOMEM, Quebec, CanadaModel MR-100Type 4-port Michelson; patented wishbone design; two corner cube retroreflectorsSpectral range 200–3020 cm21 (collection range)Sampling reference HeNe laserEffective sampling frequency (resampled rate) 15 799.0 cm21
Maximum optical path difference (X) 1.037 027 65 cmUnapodized spectral resolution (1/2X) 0.482 147 22 cm21
Spectral sampling 0.482 147 22 cm21
Michelson scan rate (OPD cm s21) 2 (1 for AERI-01 and AERI-00)Fringe counting Single fringe sampling, continuousSamples per double-sided interferogram 32 768 (16 bit) samples per interferogram (DS)Signal processing DSP-based FFT and spectral coadditionApodization function None (unapodized interferograms produced)Entrance/exit window Standard AERI: A.R. coated ZnSe; ER-AERI: CdTe (uncoated) entrance
ER-AERI: KBr (uncoated) exitBeamsplitter/compensator KBrTelescope AftField stop aperture setting 6.4 mm (4.5 mm for AERI-01)Field-of-view half-angle (b) 23 mrad (16 mrad for AERI-01; 15 mrad for -00)Aperture stop diameter 2.2 cm (7/8 in.)Throughout (cm2 sr) 6.3 E-3 (3.1 E-3 for AERI-01)Dimensions 52 cm 3 45 cm 3 38 cm (w 3 l 3 h)Mass 43 kgPower 72.5 W
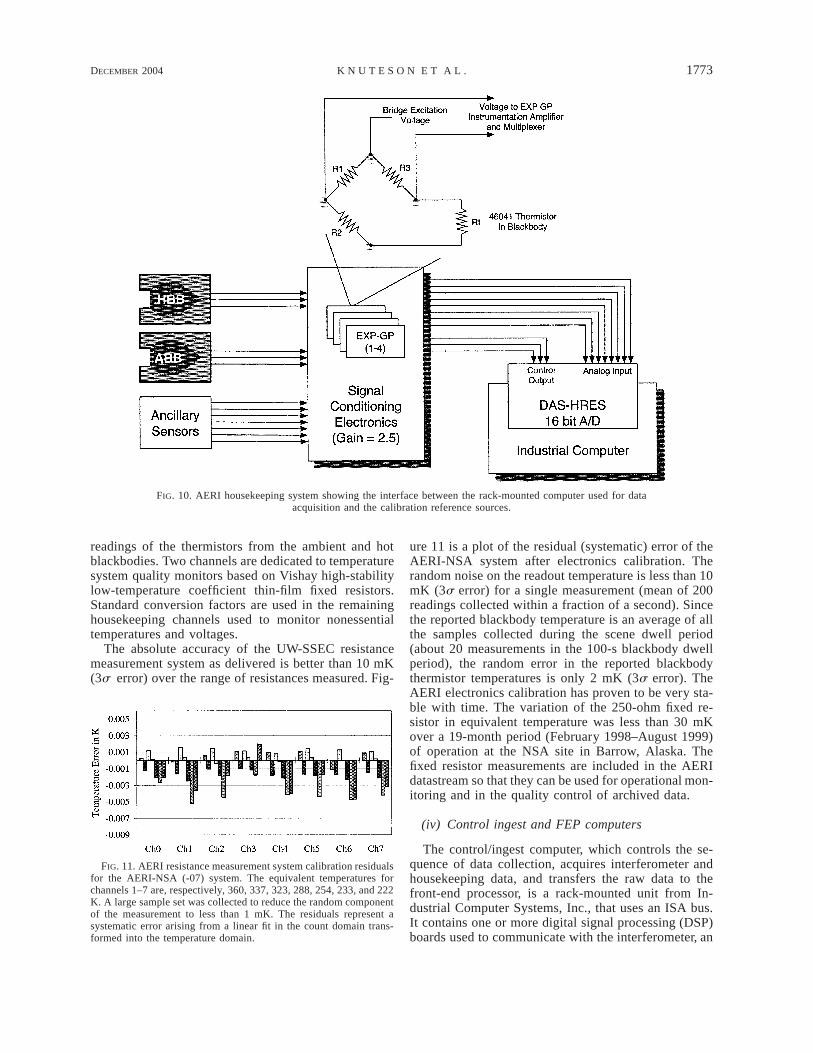
that is, the effect of scattering of the infrared beam bycontamination of the scene view mirror. A heavy layerof dust particles on the scene view mirror effectivelybroadens the instrument beam. The effect is similar toa misalignment of the hot blackbody since the view fromthe instrument to the blackbody now extends outside ofthe blackbody cavity aperture. However, if the addi-tional radiance contribution can be made equal fromeach of the hot, ambient, and sky scene views it willbe removed to first order by the calibration process. TheAERI systems have been designed to take advantage ofthis fact by providing a sky view aperture that is iden-tical in diameter to the blackbody apertures and at equaldistance to the scene view mirror. All of the aluminumsurfaces viewable by the scene mirror via scattering areanodized and thermally coupled so that the interior sur-faces are close to a common emissivity and temperature.
This fore optics design combined with the AERI cali-bration approach leads to substantial immunity to scat-tering caused by dust on the scene mirror. Figure 8 isa photograph of the scene mirror on the shaft of a steppermotor. The black anodized ‘‘can’’ surrounding the scenemirror provides a uniform temperature source for anypotential scattering effects.
(v) Detector subsystem
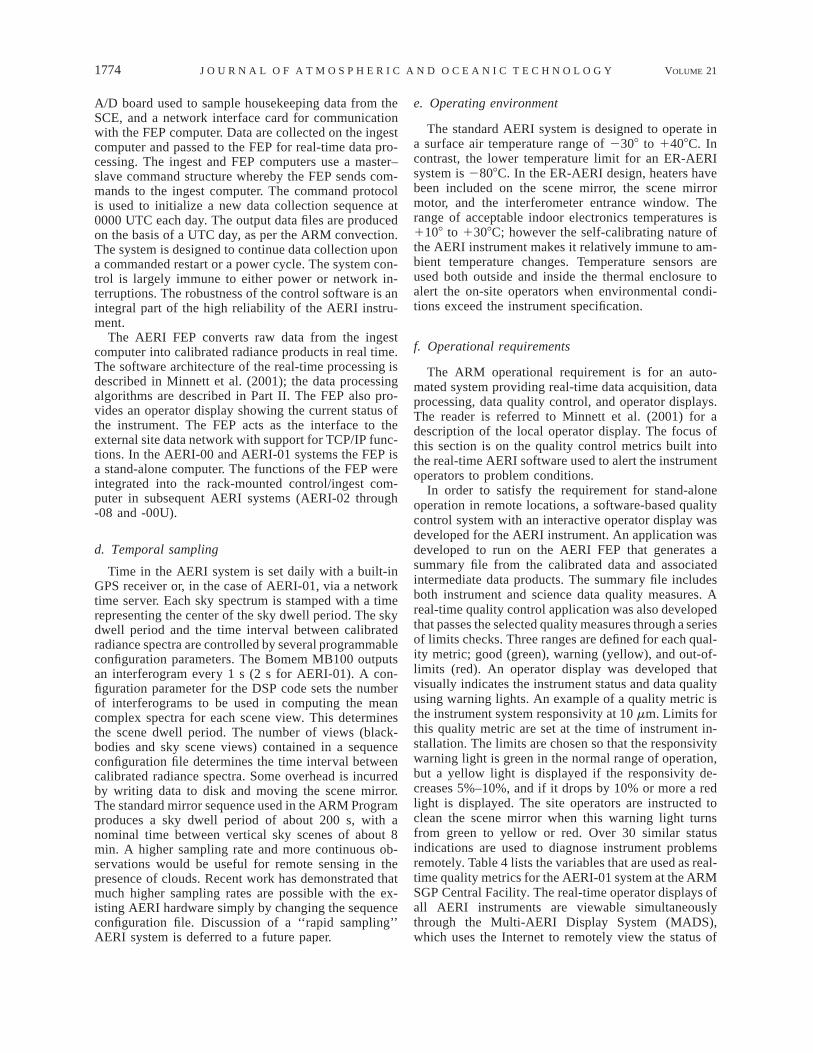
The detector subsystem used in the AERI instrumentswas implemented at UW-SSEC working with commer-cial vendors for the infrared detectors, the detector dew-ar, and the mechanical cooler. The AERI instrument usesdetectors from Infrared Associates with mercury cad-mium telluride (HgCdTe) for the longwave infraredband and indiumantimonide (InSb) for the shortwaveinfrared band. The infrared beam passes first throughthe InSb, with a longwave cutoff at about 1800 cm21,to reach the HgCdTe detector. The signals from eachdetector lead into separate preamplifiers. The opera-tional advantage of this ‘‘sandwich’’ approach is thatonly one detector dewar is required to cool the twodetectors. In the prototype AERI system, the detectordewar was cooled using liquid nitrogen. The ARM re-quirement for continuous operation at remote sites ne-cessitated the integration of a mechanical cooler intothe AERI design. The UW-SSEC integration of a me-chanical cooler into the AERI design was the last majordevelopment in making the AERI system a truly au-tonomous and continuously operating system. TheAERI uses the Litton 0.6-W linear ‘‘slip-on’’ configu-ration cryocooler shown in Fig. 9. This unit has a dual-opposed piston compressor that is connected to the re-
1770 VOLUME 21J O U R N A L O F A T M O S P H E R I C A N D O C E A N I C T E C H N O L O G Y
FIG. 5. Illustration of the AERI blackbody cavity used for internal calibration reference shown as a photograph anda cross-sectional diagram.
generator cold finger assembly by a flexible helium-gastransfer line. The cold finger slips into a well in thedetector vacuum dewar, where it is thermally coupledacross the vacuum wall at the bottom of the well usinga compliant bellows in parallel with a mesh of goldwire. This configuration allows a cryocooler assemblyto be replaced in the field without removing the opticallyaligned detector assembly from the interferometer. Thecompressor is vibration isolated from the interferometercast aluminum case and is housed in a fan-cooled alu-
minum heat sink. The heat-rejection end of the coldfinger located on top of the detector dewar is also con-figured with a fan-cooled aluminum heat sink. The cool-er electronics uses a servo loop with feedback from adetector temperature sensor. A fixed resistor is used todetermine the set point temperature. The nominal setpoint temperature for the AERI systems is 78 K. TheER-AERI systems developed for the ARM NSA sitecan also be set for operation at 68 K to enhance thelongwave detector noise performance.
DECEMBER 2004 1771K N U T E S O N E T A L .
FIG. 6. Spectral curves derived from laboratory measurements ofChemglaze Z306 witness samples are used to represent (top) the paintemissivity for the AERI prototype (-00) and AERI-01 blackbodiesand (bottom) the cavity emissivities corresponding to the geometryof the UW-SSEC blackbody for hemispheric (C f 5 12.79) and normalemissivity (C f 5 39).
2) ELECTRONICS SUPPORT EQUIPMENT
The AERI electronics support equipment includes thecontrol/ingest computer, the scene mirror stepper motorcontroller, the blackbody temperature controller (BTC),the Stirling cooler controller, a housekeeping systemwith associated signal conditioning electronics (SCE),and the front-end processor (FEP) computer. Items arerack mounted for ease of maintenance. Figure 3 showsthe electronics support equipment rack for the AERI-01 system at the SGP Central Facility in the foregroundof the photograph. This section briefly describes someof the key functions of the electronics rack.
(i) Scene mirror controller
All AERI scene mirrors are controlled by Parker-Han-nifin Corporation SX-6 motor drivers. The SX-6 is anintelligent microprocessor-controlled motor drive sys-tem that provides accurate, repeatable, and flexible mir-ror control. The motor drive communicates with thecontrol/ingest computer via a serial port connection. Byemploying microstepping positioning at 36 000 stepsper revolution, the control typically achieves 65 arcmin bidirectional unloaded accuracy. Encoder feedbackis included in the system operation to ensure final po-sitioning accuracy and to provide real-time informationon system pointing accuracy. The SX-6 drive maintainsa repeatability of 65 arc s, typical, unloaded, and uni-directional. Nonvolatile homing routines ensure that thedrive obtains accurate and repeatable home-location in-
formation upon power-up or reset. A configurable‘‘stop-on-stall’’ coupled with overtemperature shutdownprovides safe operation to protect operators and equip-ment.
(ii) Blackbody controller
The AERI BTC is a rack-mounted device designedand built at UW-SSEC. It is used to maintain the tem-perature of the hot blackbody reference within a narrowtemperature range. A thermistor is used to sense theblackbody temperature. The voltage across the therm-istor is compared to a reference voltage determined byset point switches, and the difference is applied to theinput of an analog integrator. The output of the inte-grator controls the power applied to the blackbody heat-er. The negative feedback forces the steady-state voltageacross the thermistor to be equal to the reference voltageand hence the blackbody temperature to be at the setpoint. The feedback amplifier includes a proportionalcomponent, in addition to the integral component, tostabilize the feedback loop. A linear power amplifierdrives the blackbody heater. Under the expected ambientenvironmental temperature conditions, the stability ofthe AERI blackbody temperature controller is betterthan 2 mK over the period of an hour.
(iii) Housekeeping system
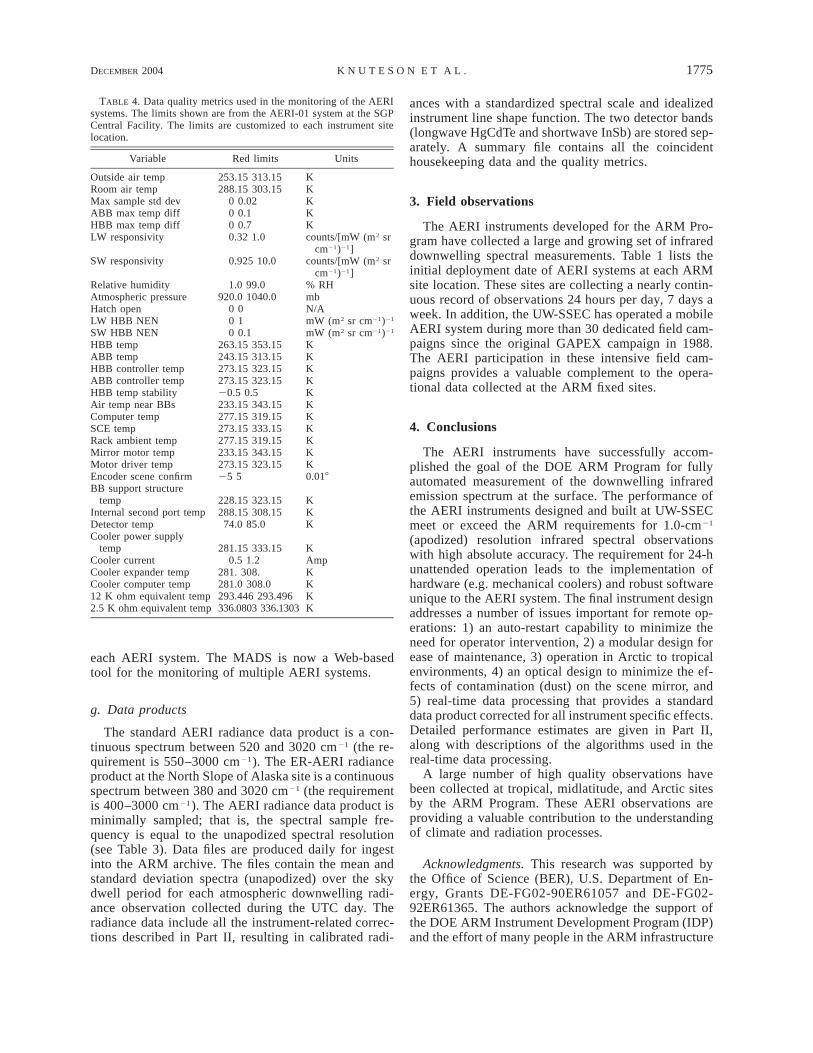
An extensive housekeeping system was developed forthe AERI that provides a critical view into the instru-ment performance, especially from remote locations. Alist of measured housekeeping values is given in Minnettet al. (2001). Housekeeping data are continuously re-corded at high (5 s) time resolution and time averagedusing real-time software to match the center of eachscene dwell period. Figure 10 shows a schematic of thehousekeeping system that is used to measure tempera-tures and voltages at various locations on the AERIsystem. The housekeeping system comprises two majorcomponents, a commercial off-the-shelf Keithley-Me-trabyte DAS-HRES 16-bit analog-to-digital (A/D) mul-tifunction ISA-bus card mounted in the control/ingestcomputer, and a Signal Conditioning Electronics (SCE)module mounted in the electronics rack.
The SCE was designed and built at UW-SSEC toprovide the absolute accuracy and precision needed formeasurement of the selected thermistors over a widerange of temperatures. The SCE comprises up to fourKeithley-Metrabyte EXP-GP eight-channel signal con-ditioning boards, power supplies, and associated con-nective wiring. Analog signals and digital control linesconnect the SCE EXP-GP boards with the DAS-HRESboard mounted in the control/ingest computer. The con-trol/ingest computer, controlling the DAS-HRES, scansthrough the channels of the SCE and records A/D datafor each of the channels. Channel function is specifiedin configuration files, thereby providing easy reconfig-uration for different applications including laboratory
1772 VOLUME 21J O U R N A L O F A T M O S P H E R I C A N D O C E A N I C T E C H N O L O G Y
FIG. 7. Example of a radiometric field-of-view mapping at the aperture of the AERI blackbody.The FOV of each AERI instrument is measured in each of the reference blackbody and sceneview positions. The FOV maps are used to verify optical alignment of the reference blackbodycavities.
FIG. 8. Photograph of the gold-coated AERI scene mirror mountedin a holder on the shaft of a stepper motor. The black ‘‘can’’ sur-rounding the mirror helps provide immunity to scattering effects whenthe mirror is coated with dust particles, a common problem for remotefield operations.
FIG. 9. The AERI HgCeTe/InSb detector assembly integrated withthe Litton cryocooler.
calibrations. The control/ingest computer converts theA/D counts to physical units based on the configurationparameters. The SCE EXP-GP channels are individuallyconfigurable for a variety of sensor inputs includingpressure, relative humidity, and temperatures derivedfrom Yellow Springs Instruments (YSI) thermistors con-
figured in a full bridge. The first eight channels of eachAERI housekeeping system are manually calibrated us-ing NIST-traceable fixed-resistor standards; calibrationcoefficients are generated using linear regression to pro-vide A/D slopes and offsets for the individual channels.Six channels of the SCE are used to obtain calibrated
DECEMBER 2004 1773K N U T E S O N E T A L .
FIG. 10. AERI housekeeping system showing the interface between the rack-mounted computer used for dataacquisition and the calibration reference sources.
FIG. 11. AERI resistance measurement system calibration residualsfor the AERI-NSA (-07) system. The equivalent temperatures forchannels 1–7 are, respectively, 360, 337, 323, 288, 254, 233, and 222K. A large sample set was collected to reduce the random componentof the measurement to less than 1 mK. The residuals represent asystematic error arising from a linear fit in the count domain trans-formed into the temperature domain.
readings of the thermistors from the ambient and hotblackbodies. Two channels are dedicated to temperaturesystem quality monitors based on Vishay high-stabilitylow-temperature coefficient thin-film fixed resistors.Standard conversion factors are used in the remaininghousekeeping channels used to monitor nonessentialtemperatures and voltages.
The absolute accuracy of the UW-SSEC resistancemeasurement system as delivered is better than 10 mK(3s error) over the range of resistances measured. Fig-
ure 11 is a plot of the residual (systematic) error of theAERI-NSA system after electronics calibration. Therandom noise on the readout temperature is less than 10mK (3s error) for a single measurement (mean of 200readings collected within a fraction of a second). Sincethe reported blackbody temperature is an average of allthe samples collected during the scene dwell period(about 20 measurements in the 100-s blackbody dwellperiod), the random error in the reported blackbodythermistor temperatures is only 2 mK (3s error). TheAERI electronics calibration has proven to be very sta-ble with time. The variation of the 250-ohm fixed re-sistor in equivalent temperature was less than 30 mKover a 19-month period (February 1998–August 1999)of operation at the NSA site in Barrow, Alaska. Thefixed resistor measurements are included in the AERIdatastream so that they can be used for operational mon-itoring and in the quality control of archived data.
(iv) Control ingest and FEP computers
The control/ingest computer, which controls the se-quence of data collection, acquires interferometer andhousekeeping data, and transfers the raw data to thefront-end processor, is a rack-mounted unit from In-dustrial Computer Systems, Inc., that uses an ISA bus.It contains one or more digital signal processing (DSP)boards used to communicate with the interferometer, an
1774 VOLUME 21J O U R N A L O F A T M O S P H E R I C A N D O C E A N I C T E C H N O L O G Y
A/D board used to sample housekeeping data from theSCE, and a network interface card for communicationwith the FEP computer. Data are collected on the ingestcomputer and passed to the FEP for real-time data pro-cessing. The ingest and FEP computers use a master–slave command structure whereby the FEP sends com-mands to the ingest computer. The command protocolis used to initialize a new data collection sequence at0000 UTC each day. The output data files are producedon the basis of a UTC day, as per the ARM convection.The system is designed to continue data collection upona commanded restart or a power cycle. The system con-trol is largely immune to either power or network in-terruptions. The robustness of the control software is anintegral part of the high reliability of the AERI instru-ment.
The AERI FEP converts raw data from the ingestcomputer into calibrated radiance products in real time.The software architecture of the real-time processing isdescribed in Minnett et al. (2001); the data processingalgorithms are described in Part II. The FEP also pro-vides an operator display showing the current status ofthe instrument. The FEP acts as the interface to theexternal site data network with support for TCP/IP func-tions. In the AERI-00 and AERI-01 systems the FEP isa stand-alone computer. The functions of the FEP wereintegrated into the rack-mounted control/ingest com-puter in subsequent AERI systems (AERI-02 through-08 and -00U).
d. Temporal sampling
Time in the AERI system is set daily with a built-inGPS receiver or, in the case of AERI-01, via a networktime server. Each sky spectrum is stamped with a timerepresenting the center of the sky dwell period. The skydwell period and the time interval between calibratedradiance spectra are controlled by several programmableconfiguration parameters. The Bomem MB100 outputsan interferogram every 1 s (2 s for AERI-01). A con-figuration parameter for the DSP code sets the numberof interferograms to be used in computing the meancomplex spectra for each scene view. This determinesthe scene dwell period. The number of views (black-bodies and sky scene views) contained in a sequenceconfiguration file determines the time interval betweencalibrated radiance spectra. Some overhead is incurredby writing data to disk and moving the scene mirror.The standard mirror sequence used in the ARM Programproduces a sky dwell period of about 200 s, with anominal time between vertical sky scenes of about 8min. A higher sampling rate and more continuous ob-servations would be useful for remote sensing in thepresence of clouds. Recent work has demonstrated thatmuch higher sampling rates are possible with the ex-isting AERI hardware simply by changing the sequenceconfiguration file. Discussion of a ‘‘rapid sampling’’AERI system is deferred to a future paper.
e. Operating environment
The standard AERI system is designed to operate ina surface air temperature range of 2308 to 1408C. Incontrast, the lower temperature limit for an ER-AERIsystem is 2808C. In the ER-AERI design, heaters havebeen included on the scene mirror, the scene mirrormotor, and the interferometer entrance window. Therange of acceptable indoor electronics temperatures is1108 to 1308C; however the self-calibrating nature ofthe AERI instrument makes it relatively immune to am-bient temperature changes. Temperature sensors areused both outside and inside the thermal enclosure toalert the on-site operators when environmental condi-tions exceed the instrument specification.
f. Operational requirements
The ARM operational requirement is for an auto-mated system providing real-time data acquisition, dataprocessing, data quality control, and operator displays.The reader is referred to Minnett et al. (2001) for adescription of the local operator display. The focus ofthis section is on the quality control metrics built intothe real-time AERI software used to alert the instrumentoperators to problem conditions.
In order to satisfy the requirement for stand-aloneoperation in remote locations, a software-based qualitycontrol system with an interactive operator display wasdeveloped for the AERI instrument. An application wasdeveloped to run on the AERI FEP that generates asummary file from the calibrated data and associatedintermediate data products. The summary file includesboth instrument and science data quality measures. Areal-time quality control application was also developedthat passes the selected quality measures through a seriesof limits checks. Three ranges are defined for each qual-ity metric; good (green), warning (yellow), and out-of-limits (red). An operator display was developed thatvisually indicates the instrument status and data qualityusing warning lights. An example of a quality metric isthe instrument system responsivity at 10 mm. Limits forthis quality metric are set at the time of instrument in-stallation. The limits are chosen so that the responsivitywarning light is green in the normal range of operation,but a yellow light is displayed if the responsivity de-creases 5%–10%, and if it drops by 10% or more a redlight is displayed. The site operators are instructed toclean the scene mirror when this warning light turnsfrom green to yellow or red. Over 30 similar statusindications are used to diagnose instrument problemsremotely. Table 4 lists the variables that are used as real-time quality metrics for the AERI-01 system at the ARMSGP Central Facility. The real-time operator displays ofall AERI instruments are viewable simultaneouslythrough the Multi-AERI Display System (MADS),which uses the Internet to remotely view the status of
DECEMBER 2004 1775K N U T E S O N E T A L .
TABLE 4. Data quality metrics used in the monitoring of the AERIsystems. The limits shown are from the AERI-01 system at the SGPCentral Facility. The limits are customized to each instrument sitelocation.
Variable Red limits Units
Outside air tempRoom air tempMax sample std devABB max temp diffHBB max temp diffLW responsivity
SW responsivity
253.15 313.15288.15 303.15
0 0.020 0.10 0.70.32 1.0
0.925 10.0
KKKKKcounts/[mW (m2 sr
cm21)21]counts/[mW (m2 sr
cm21)21]Relative humidityAtmospheric pressureHatch openLW HBB NENSW HBB NENHBB tempABB tempHBB controller tempABB controller tempHBB temp stability
1.0 99.0920.0 1040.0
0 00 10 0.1
263.15 353.15243.15 313.15273.15 323.15273.15 323.1520.5 0.5
% RHmbN/AmW (m2 sr cm21)21
mW (m2 sr cm21)21
KKKKK
Air temp near BBsComputer tempSCE tempRack ambient tempMirror motor tempMotor driver tempEncoder scene confirmBB support structure
temp
233.15 343.15277.15 319.15273.15 333.15277.15 319.15233.15 343.15273.15 323.1525 5
228.15 323.15
KKKKKK0.018
KInternal second port tempDetector tempCooler power supply
tempCooler currentCooler expander tempCooler computer temp12 K ohm equivalent temp2.5 K ohm equivalent temp
288.15 308.1574.0 85.0
281.15 333.150.5 1.2
281. 308.281.0 308.0293.446 293.496336.0803 336.1303
KK
KAmpKKKK
each AERI system. The MADS is now a Web-basedtool for the monitoring of multiple AERI systems.
g. Data products
The standard AERI radiance data product is a con-tinuous spectrum between 520 and 3020 cm21 (the re-quirement is 550–3000 cm21). The ER-AERI radianceproduct at the North Slope of Alaska site is a continuousspectrum between 380 and 3020 cm21 (the requirementis 400–3000 cm21). The AERI radiance data product isminimally sampled; that is, the spectral sample fre-quency is equal to the unapodized spectral resolution(see Table 3). Data files are produced daily for ingestinto the ARM archive. The files contain the mean andstandard deviation spectra (unapodized) over the skydwell period for each atmospheric downwelling radi-ance observation collected during the UTC day. Theradiance data include all the instrument-related correc-tions described in Part II, resulting in calibrated radi-
ances with a standardized spectral scale and idealizedinstrument line shape function. The two detector bands(longwave HgCdTe and shortwave InSb) are stored sep-arately. A summary file contains all the coincidenthousekeeping data and the quality metrics.
3. Field observations
The AERI instruments developed for the ARM Pro-gram have collected a large and growing set of infrareddownwelling spectral measurements. Table 1 lists theinitial deployment date of AERI systems at each ARMsite location. These sites are collecting a nearly contin-uous record of observations 24 hours per day, 7 days aweek. In addition, the UW-SSEC has operated a mobileAERI system during more than 30 dedicated field cam-paigns since the original GAPEX campaign in 1988.The AERI participation in these intensive field cam-paigns provides a valuable complement to the opera-tional data collected at the ARM fixed sites.
4. Conclusions
The AERI instruments have successfully accom-plished the goal of the DOE ARM Program for fullyautomated measurement of the downwelling infraredemission spectrum at the surface. The performance ofthe AERI instruments designed and built at UW-SSECmeet or exceed the ARM requirements for 1.0-cm21
(apodized) resolution infrared spectral observationswith high absolute accuracy. The requirement for 24-hunattended operation leads to the implementation ofhardware (e.g. mechanical coolers) and robust softwareunique to the AERI system. The final instrument designaddresses a number of issues important for remote op-erations: 1) an auto-restart capability to minimize theneed for operator intervention, 2) a modular design forease of maintenance, 3) operation in Arctic to tropicalenvironments, 4) an optical design to minimize the ef-fects of contamination (dust) on the scene mirror, and5) real-time data processing that provides a standarddata product corrected for all instrument specific effects.Detailed performance estimates are given in Part II,along with descriptions of the algorithms used in thereal-time data processing.
A large number of high quality observations havebeen collected at tropical, midlatitude, and Arctic sitesby the ARM Program. These AERI observations areproviding a valuable contribution to the understandingof climate and radiation processes.
Acknowledgments. This research was supported bythe Office of Science (BER), U.S. Department of En-ergy, Grants DE-FG02-90ER61057 and DE-FG02-92ER61365. The authors acknowledge the support ofthe DOE ARM Instrument Development Program (IDP)and the effort of many people in the ARM infrastructure
1776 VOLUME 21J O U R N A L O F A T M O S P H E R I C A N D O C E A N I C T E C H N O L O G Y
for the successful integration of the AERI instrumentsinto the ARM operational network.
REFERENCES
Collard, A. D., S. A. Ackerman, W. L. Smith, H. E. Ma, H. E. Rev-ercomb, R. O. Knuteson, and S. C. Lee, 1995: Cirrus cloudproperties derived from high spectral resolution infrared spec-trometry during FIRE II. Part III: Ground-based HIS results. J.Atmos. Sci., 52, 4264–4275.
DeSlover, D. H., W. L. Smith, P. K. Piironen, and E. W. Eloranta,1999: A methodology for measuring cirrus cloud visible-to-in-frared spectral optical depth ratios. J. Atmos. Oceanic Technol.,16, 251–262.
DOE, 1990: Atmospheric Radiation Measurement Program plan.DOE/ER-0442 and DOE/ER-0441, U.S. Department of Energy,Washington, DC, 135 pp.
Ellingson, R. E., and Y. Fouquart, 1991: The intercomparison ofradiation codes in climate models: An overview. J. Geophys.Res., 96, 8925–8927.
——, and W. J. Wiscombe, 1996: The Spectral Radiance Experiment(SPECTRE): Project description and sample results. Bull. Amer.Meteor. Soc., 77, 1967–1985.
Feltz, W. F., W. L. Smith, R. O. Knuteson, H. E. Revercomb, H. M.Woolf, and H. B. Howell, 1998: Meteorological applications oftemperature and water vapor retrievals from the ground-basedAtmospheric Emitted Radiance Interferometer (AERI). J. Appl.Meteor., 37, 857–875.
Knuteson, R. O., and Coauthors, 2004: Atmospheric Emitted Radi-ance Interferometer. Part II: Instrument performance. J. Atmos.Oceanic Technol., 21, 1777–1789.
Luther, F., R. Ellingson, Y. Fouquart, S. Fels, N. Scott, and W. Wis-combe, 1988: Intercomparison of radiation codes in climate mod-els (ICRCCM): Longwave clear-sky results. Bull. Amer. Meteor.Soc., 69, 40–48.
Mace, G. G., T. P. Ackerman, P. Minnis, and D. F. Young, 1998:Cirrus layer microphysical properties derived from surface-basedmillimeter radar and infrared interferometer data. J. Geophys.Res., 103, 23 207–23 216.
Minnett, P. J., R. O. Knuteson, F. A. Best, B. J. Osborne, J. A. Hanafin,and O. B. Brown, 2001: The Marine-Atmospheric Emitted Ra-diance Interferometer (M-AERI), a high-accuracy, sea-going in-frared spectroradiometer. J. Atmos. Oceanic Technol., 18, 994–1013.
Revercomb, H. E., H. Buijs, H. B. Howell, D. D. LaPorte, W. L.Smith, and L. A. Sromovsky, 1988: Radiometric calibration ofIR Fourier transform spectrometers: Solution to a problem withthe High-Resolution Interferometer Sounder. Appl. Opt., 27,3210–3218.
——, and Coauthors, 2003: The ARM Program’s water vapor inten-sive periods: Overview, initial accomplishments, and future chal-lenges. Bull. Amer. Meteor. Soc., 84, 217–236.
Smith, W. L., and Coauthors, 1990: GAPEX: A Ground-Based At-mospheric Profiling Experiment. Bull. Amer. Meteor. Soc., 71,310–318.
——, W. F. Feltz, R. O. Knuteson, H. E. Revercomb, H. B. Howell,and H. M. Woolf, 1999: The retrieval of planetary boundarylayer structure using ground-based infrared spectral radiancemeasurements. J. Atmos. Oceanic Technol., 16, 323–333.
Steinhart, I. S., and S. R. Hart, 1968: Calibration curves for therm-istors. Deep-Sea Res. Oceanogr. Abstr., 15, 497–503.
Stokes, G. M., and S. E. Schwartz, 1994: The Atmospheric RadiationMeasurement (ARM) Program: Programmatic background anddesign of the Cloud and Radiation Testbed. Bull. Amer. Meteor.Soc., 75, 1201–1221.
Sydnor, C. L., 1970: A numerical study of cavity radiometer emis-sivities. NASA JPL Tech. Rep. 32-1463.
Tobin, D. C., and Coauthors, 1999: Downwelling spectral radianceobservations at the SHEBA ice station: Water vapor continuummeasurements for 17 to 26 microns. J. Geophys. Res., 104, 2081–2092.
Turner, D. D., W. F. Feltz, and R. A. Ferrare, 2000: Continuous waterprofiles from operational ground-based active and passive remotesensors. Bull. Amer. Meteor. Soc., 81, 1301–1317.
——, S. A. Ackerman, B. A. Baum, H. E. Revercomb, and P. Yang,2003: Cloud phase determination using ground-based AERI ob-servations at SHEBA. J. Appl. Meteor., 42, 701–715.
——, and Coauthors, 2004: The QME AERI LBLRTM: A closureexperiment for downwelling high spectral resolution infraredradiance. J. Atmos. Sci., 61, 2657–2675.