ATLAS Pixel Detector Leakage Currentseidel/trento-feb2019.pdf · ATLAS Pixel Detector Leakage...
42
Sally Seidel Page 1 ATLAS Pixel Detector Leakage Current Sally Seidel University of New Mexico On behalf of the ATLAS Collaboration 14 th Trento Workshop on Advanced Silicon Radiation Detectors 25 February 2019
Transcript of ATLAS Pixel Detector Leakage Currentseidel/trento-feb2019.pdf · ATLAS Pixel Detector Leakage...

Sally Seidel Page 1
ATLAS Pixel Detector Leakage Current
Sally Seidel University of New Mexico
On behalf of the ATLAS Collaboration
14th Trento Workshop on Advanced Silicon Radiation Detectors
25 February 2019
Sally Seidel Page 2 25 February 2019
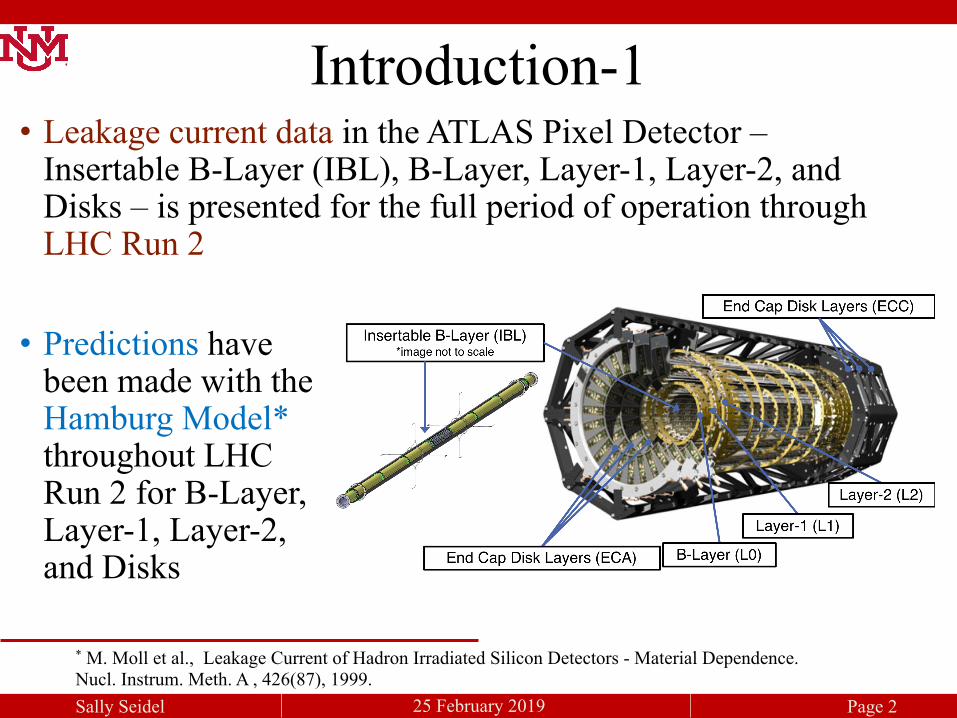
• Leakage current data in the ATLAS Pixel Detector – Insertable B-Layer (IBL), B-Layer, Layer-1, Layer-2, and Disks – is presented for the full period of operation through LHC Run 2
Introduction-1
* M. Moll et al., Leakage Current of Hadron Irradiated Silicon Detectors - Material Dependence. Nucl. Instrum. Meth. A , 426(87), 1999.
• Predictions have been made with the Hamburg Model* throughout LHC Run 2 for B-Layer, Layer-1, Layer-2, and Disks

Sally Seidel Page 3 25 February 2019
• Comparison is made of fluence predictions by Pythia8 and FLUKA to the fluence determined from the Hamburg Model scaled to agree with the leakage current data • A study of the optimal value of the effective band
gap energy of irradiated silicon, Eeff, is performed with ATLAS data • This study indicates that a value of Eeff <1.21 eV may be
more appropriate for predicting and measuring leakage current
Introduction-2
Sally Seidel Page 4 25 February 2019
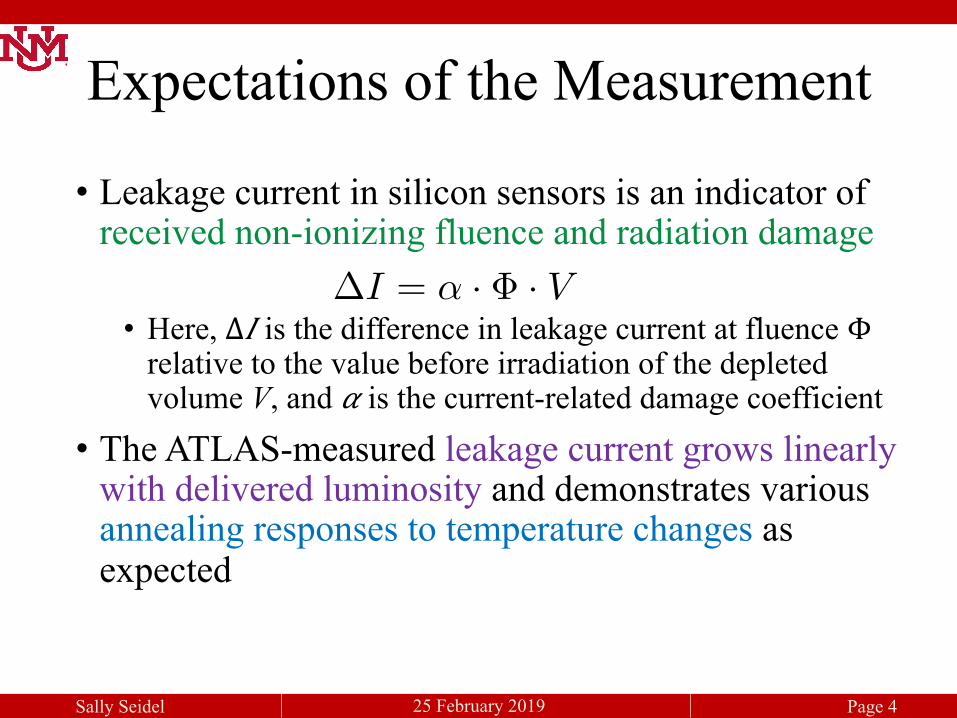
• Leakage current in silicon sensors is an indicator of received non-ionizing fluence and radiation damage
• Here, Δ𝐼 is the difference in leakage current at fluence Φ relative to the value before irradiation of the depleted volume V, and 𝛼 is the current-related damage coefficient
• The ATLAS-measured leakage current grows linearly with delivered luminosity and demonstrates various annealing responses to temperature changes as expected
Expectations of the Measurement
�I = ↵ · � · V

Sally Seidel Page 5 25 February 2019
• Measurements of Run 1 leakage current use the HVPP4 data collection subsystem* • LHC Run 2 leakage current measurements are made
using HVPP4 data with power supply leakage current** data to confirm and augment the measurement • The leakage current data are restricted to times
when high voltage is applied across the silicon sensors and when the LHC beams are declared stable
Measurement Procedure Details
*ATLAS Collaboration, A leakage current-based measurement of the radiation damage in the ATLAS Pixel Detector, 2015 JINST 10(04) C04024, http://cdsweb.cern.ch/record/1752122/files/ATL-INDET-PUB-2014-004.pdf ** Iseg Spezialelektronik GmbH, High Voltage Power Supply EHQ F607n-F

Sally Seidel Page 6 25 February 2019
• For both data and the Hamburg Model prediction, the leakage current is corrected to 0°C using the equation:
• The silicon activation energy is assumed to be Eeff = 1.21 eV †
• A study of the optimal Eeff value for ATLAS data is presented later in these slides.
Further Measurement Procedure Details
I(T ) = I(TR)/R(T ), where R(T ) = (TR/T )2 · exp
✓� Eeff
2kB(1/TR � 1/T )
◆
† A. Chilingarov, Temperature Dependence of the Current Generated in Si bulk, 2013 JINST 8(10) P1000, http://iopscience.iop.org/article/10.1088/1748-0221/8/10/P10003

Sally Seidel Page 7 25 February 2019
• All fluence received by the pixel sensors impacts the leakage current • The integrated luminosity used throughout this
analysis includes the luminosity accumulated outside of the LHC stable beams declarations • The total integrated luminosity seen by the B-Layer,
Layer-1, Layer-2, and Disks for the full period of operation is 191.1 fb-1
Integrated Luminosity
Sally Seidel Page 8 25 February 2019
• Hamburg Model predictions are made in four bins along the axis z for each barrel layer (a total of 12 predictions) and for each pair of Disks • Luminosity to fluence conversions are made using
the Pythia8 and FLUKA simulation and have a symmetric z-dependence around the interaction point • The predicted total fluence received by the B-Layer
modules closest to the interaction point – calculated using the total integrated luminosity (191.1 fb-1 ) – is 5.27 × 10¹⁴ 1 MeV neq / cm2
Hamburg Model Predictions

Sally Seidel Page 9 25 February 2019
• The predictions (12 for the barrel layers and 3 for the pairs of disks) are fit to the data with a scale factor • Each scale factor is a constant given by the ratio of leakage
current data to prediction
• For each barrel layer, the average of the scaled predictions associated with the four bins along the z axis is compared to the average leakage current data in the same four bins • The scale factors* range from ~1.20 far from the
interaction point in z to ~1.45 close to the interaction point in z
Scale Factor
*See Slide 35 for all scale factors

Sally Seidel Page 10 25 February 2019
Leakage Current in the Barrel Layers

Sally Seidel Page 11 25 February 2019
Leakage Current in Pixel Barrel
• Measurements on each layer are averaged over a representative sample of modules in η and 𝜙. .
• The measurements are consistent with expected higher levels of radiation for sensors closer to the beam line.
• The B-Layer is at r = 50.5 mm, Layer-1 at 88.5 mm, Layer-2 at 122.5 mm
• Average leakage current data compared to the average scaled Hamburg Model predictions for each barrel layer through 2018
• The Hamburg Model predictions have been scaled to match the measured leakage current data

Sally Seidel Page 12 25 February 2019
Ratios of Leakage Currents in Barrel Layers
• The vertical axis is proportional to the ratio of the applied fluence • The relative fluence between the layers is well predicted
• Ratios of the various Pixel Detector barrel layer leakage current data and (unscaled) Hamburg Model predictions for LHC Run 2

Sally Seidel Page 13 25 February 2019
Leakage Current Dependence on z

Sally Seidel Page 14 25 February 2019
B-Layer Z-binned Leakage Current • Z-binned B-Layer leakage current data at four values of
integrated luminosity. • Single module precision is shown with HVPP4 data, and
multiple module precision is shown with the power supply leakage current data
• The z-dependent scaled Hamburg Model predictions are also shown
• We see agreement and consistency between measurement methods

Sally Seidel Page 15 25 February 2019
Layer-1 Z-binned Leakage Current
• The z-dependent scaled Hamburg Model predictions are also shown • Overlapping bins
are due to simultaneous module measurements by the power supply subsystem
• Z-binned Layer-1 leakage current data at four values of integrated luminosity. • Single module precision is shown with HVPP4 data, and multiple
module precision is shown with the power supply leakage current data

Sally Seidel Page 16 25 February 2019
Layer-2 Z-binned Leakage Current • Z-binned Layer-2 leakage current data at four values of integrated
luminosity. • Single module precision is shown with HVPP4 data. and multiple
module precision is shown with the power supply leakage current data
• The z-dependent scaled Hamburg Model predictions are also shown
• Overlapping bins are due to simultaneous module measurements by the power supply subsystem

Sally Seidel Page 17 25 February 2019
Comparison of Predicted Fluence and Extracted Fluence
Sally Seidel Page 18 25 February 2019
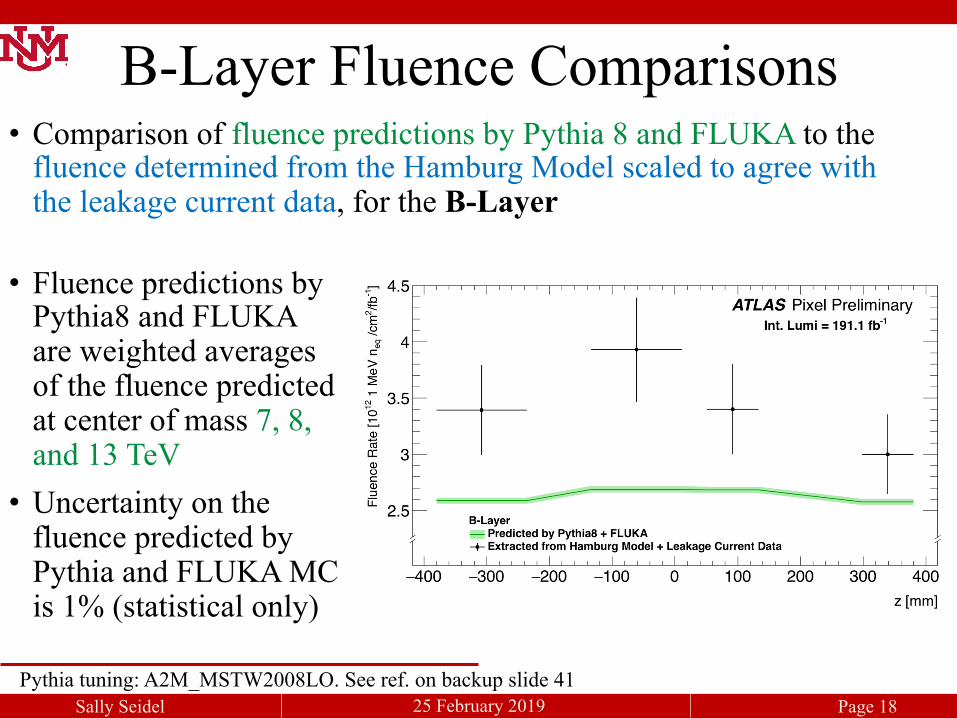
B-Layer Fluence Comparisons
Pythia tuning: A2M_MSTW2008LO. See ref. on backup slide 41
• Fluence predictions by Pythia8 and FLUKA are weighted averages of the fluence predicted at center of mass 7, 8, and 13 TeV • Uncertainty on the
fluence predicted by Pythia and FLUKA MC is 1% (statistical only)
• Comparison of fluence predictions by Pythia 8 and FLUKA to the fluence determined from the Hamburg Model scaled to agree with the leakage current data, for the B-Layer
Sally Seidel Page 19 25 February 2019
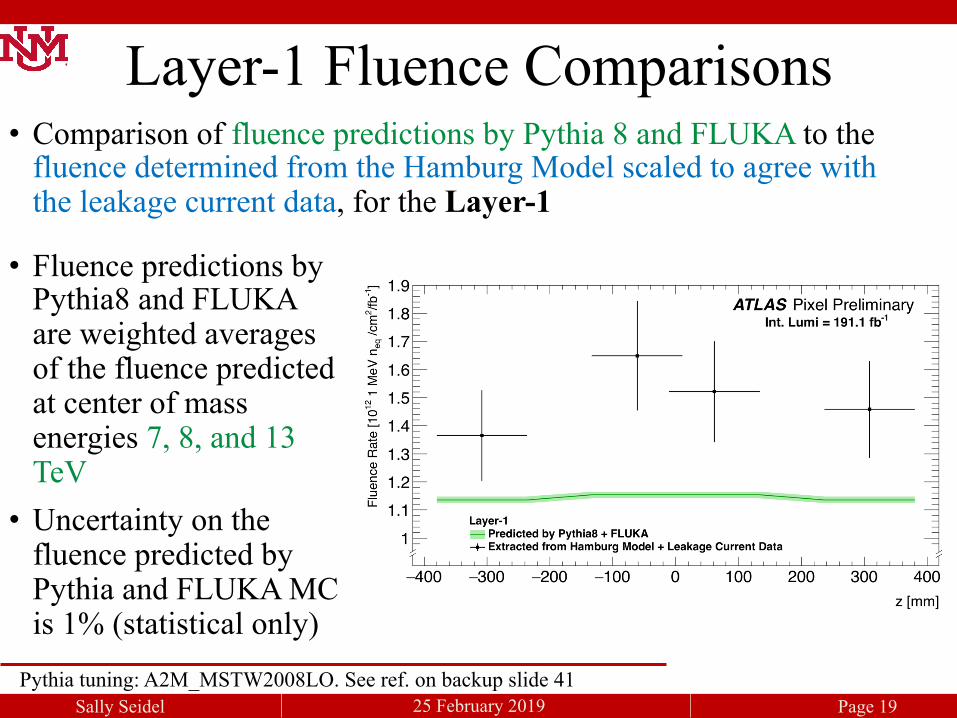
Layer-1 Fluence Comparisons
Pythia tuning: A2M_MSTW2008LO. See ref. on backup slide 41
• Fluence predictions by Pythia8 and FLUKA are weighted averages of the fluence predicted at center of mass energies 7, 8, and 13 TeV • Uncertainty on the
fluence predicted by Pythia and FLUKA MC is 1% (statistical only)
• Comparison of fluence predictions by Pythia 8 and FLUKA to the fluence determined from the Hamburg Model scaled to agree with the leakage current data, for the Layer-1
Sally Seidel Page 20 25 February 2019
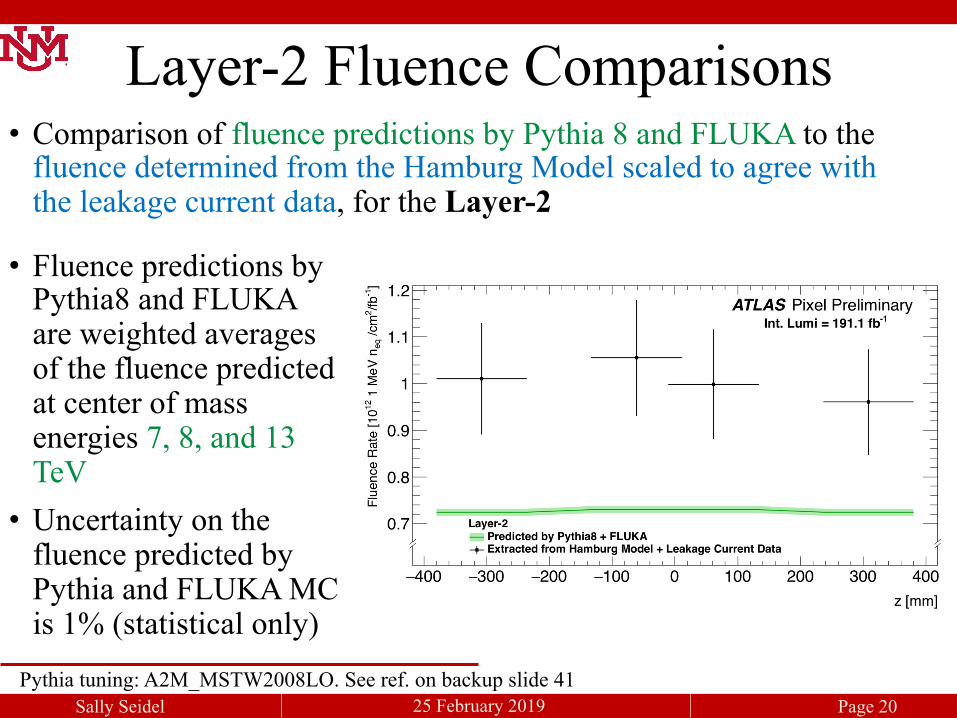
Layer-2 Fluence Comparisons
Pythia tuning: A2M_MSTW2008LO. See ref. on backup slide 41
• Fluence predictions by Pythia8 and FLUKA are weighted averages of the fluence predicted at center of mass energies 7, 8, and 13 TeV • Uncertainty on the
fluence predicted by Pythia and FLUKA MC is 1% (statistical only)
• Comparison of fluence predictions by Pythia 8 and FLUKA to the fluence determined from the Hamburg Model scaled to agree with the leakage current data, for the Layer-2
Sally Seidel Page 21 25 February 2019
Leakage Current in the Disks

Sally Seidel Page 22 25 February 2019
Leakage Current in Disks
• Each disk corresponds to both side A and side C of the Pixel Detector. Disk modules are at radius 119.2 cm. • The average module temperature and average sensor bias voltage are
shown in the top panels
• Average measured leakage current and Hamburg Model predictions for a sample of modules in the ATLAS Pixel detector disks for LHC Run-2.
• Disk-1 (|z| = 495 mm), Disk-2 (|z| = 580 mm), and Disk-3 (|z| = 650 mm) show comparable values of leakage current.
Sally Seidel Page 23 25 February 2019
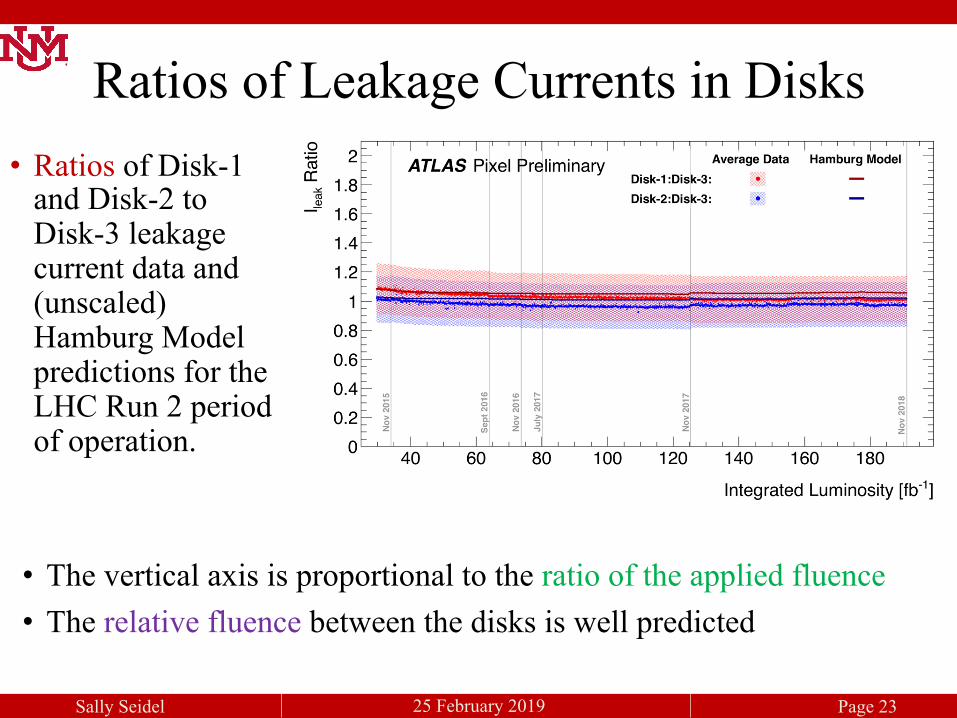
Ratios of Leakage Currents in Disks • Ratios of Disk-1
and Disk-2 to Disk-3 leakage current data and (unscaled) Hamburg Model predictions for the LHC Run 2 period of operation.
• The vertical axis is proportional to the ratio of the applied fluence • The relative fluence between the disks is well predicted
Sally Seidel Page 24 25 February 2019
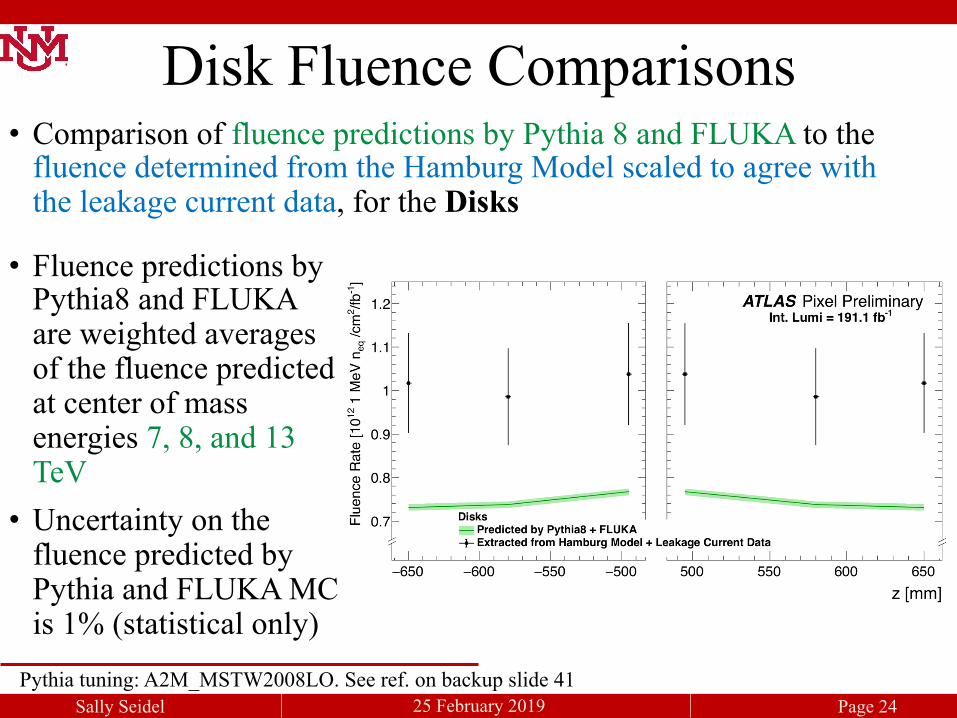
Disk Fluence Comparisons
Pythia tuning: A2M_MSTW2008LO. See ref. on backup slide 41
• Fluence predictions by Pythia8 and FLUKA are weighted averages of the fluence predicted at center of mass energies 7, 8, and 13 TeV • Uncertainty on the
fluence predicted by Pythia and FLUKA MC is 1% (statistical only)
• Comparison of fluence predictions by Pythia 8 and FLUKA to the fluence determined from the Hamburg Model scaled to agree with the leakage current data, for the Disks

Sally Seidel Page 25 25 February 2019
Leakage Current in the Insertable B-Layer (IBL)
Sally Seidel Page 26 25 February 2019
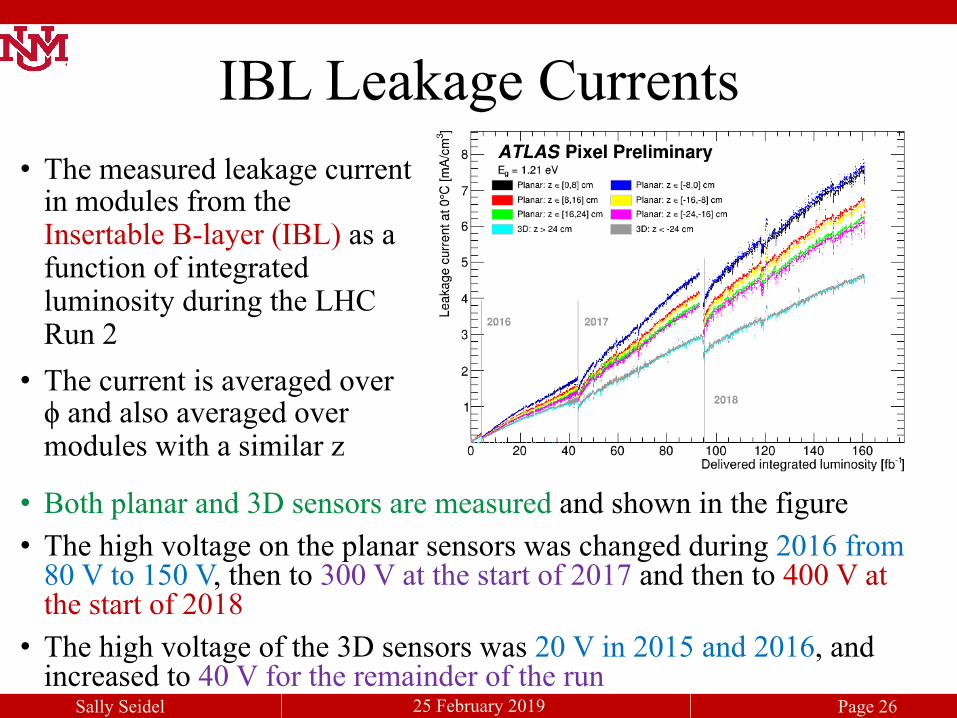
IBL Leakage Currents • The measured leakage current
in modules from the Insertable B-layer (IBL) as a function of integrated luminosity during the LHC Run 2
• The current is averaged over ϕ and also averaged over modules with a similar z
• Both planar and 3D sensors are measured and shown in the figure • The high voltage on the planar sensors was changed during 2016 from
80 V to 150 V, then to 300 V at the start of 2017 and then to 400 V at the start of 2018
• The high voltage of the 3D sensors was 20 V in 2015 and 2016, and increased to 40 V for the remainder of the run
Sally Seidel Page 27 25 February 2019
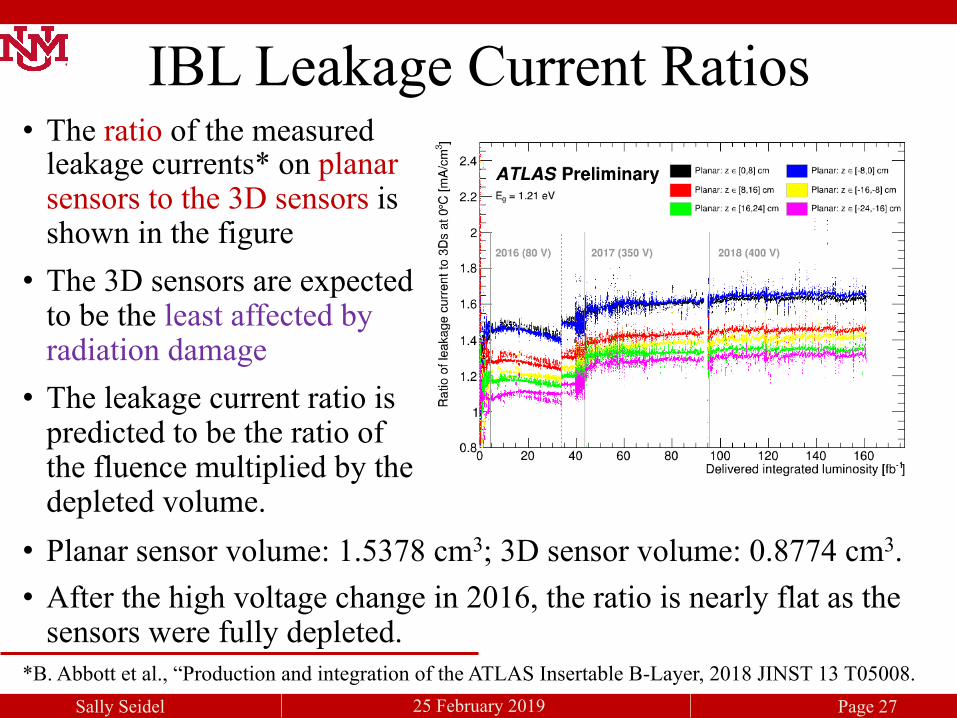
IBL Leakage Current Ratios • The ratio of the measured
leakage currents* on planar sensors to the 3D sensors is shown in the figure • The 3D sensors are expected
to be the least affected by radiation damage • The leakage current ratio is
predicted to be the ratio of the fluence multiplied by the depleted volume. • Planar sensor volume: 1.5378 cm3; 3D sensor volume: 0.8774 cm3. • After the high voltage change in 2016, the ratio is nearly flat as the
sensors were fully depleted. *B. Abbott et al., “Production and integration of the ATLAS Insertable B-Layer, 2018 JINST 13 T05008.

Sally Seidel Page 28 25 February 2019
Investigation of the Optimal Eeff Value

Sally Seidel Page 29 25 February 2019
• A study was performed to find the best combination of Eeff (which is input to the Hamburg Model) and the scale factor which brings the magnitude of leakage current predicted by the model into agreement with the average magnitude of the leakage current data. • The study used currents recorded in modules
located in the range (-38.0 < z < -23.7) cm on the B-Layer
Study of Eeff and the Scale Factor

Sally Seidel Page 30 25 February 2019
• Several predictions were generated, all normalized to 0 oC, each using a different value of Eeff
• The leakage current data were also normalized to 0 oC and analyzed once with each unique value of Eeff • Note that the value of Eeff is used in the temperature
normalization step
Setup of the Investigation

Sally Seidel Page 31 25 February 2019
Impact of Eeff
• Three pairs of leakage current data and predictions with the Hamburg Model, with three Eeff values used to analyze them, are shown here before a scale factor is applied

Sally Seidel Page 32 25 February 2019
Fitting Eeff and the Scale Factor • The level of agreement provided by each scale factor is
characterized by a χ2 figure of merit
• The Eeff value and scale factor with the minimum χ2/NDF is: Eeff = 1.11 with a scale factor = 1.05
(Eeff = 1.210 is paired with a scale factor = 1.312)
χ2 /NDF
Sally Seidel Page 33 25 February 2019
• Leakage current data in the ATLAS Pixel Detector through LHC Run 2 are reported • Including all barrel layers and Disks
• Comparisons of fluence predictions by Pythia8 and FLUKA to the fluence determined from the Hamburg Model scaled to agree with the leakage current data show tension • The relative fluence between the layers is well predicted • The magnitude of the tension may be improved with an re-
optimized value of Eeff • The tension in the z-dependence allows us to probe the
quality of fluence predictions by Pythia8 and FLUKA
Final Comments

Sally Seidel Page 34 25 February 2019
Additional Slides
Sally Seidel Page 35 25 February 2019
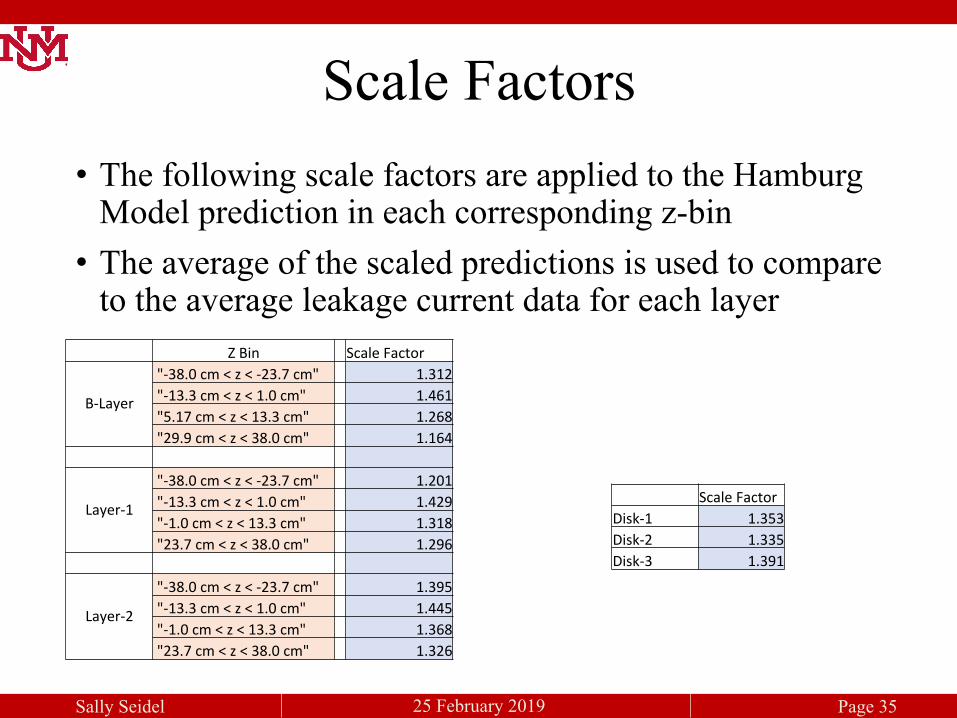
ZBin ScaleFactor
B-Layer
"-38.0cm<z<-23.7cm" 1.312"-13.3cm<z<1.0cm" 1.461"5.17cm<z<13.3cm" 1.268"29.9cm<z<38.0cm" 1.164
Layer-1
"-38.0cm<z<-23.7cm" 1.201"-13.3cm<z<1.0cm" 1.429"-1.0cm<z<13.3cm" 1.318"23.7cm<z<38.0cm" 1.296
Layer-2
"-38.0cm<z<-23.7cm" 1.395"-13.3cm<z<1.0cm" 1.445"-1.0cm<z<13.3cm" 1.368"23.7cm<z<38.0cm" 1.326
Scale Factors • The following scale factors are applied to the Hamburg
Model prediction in each corresponding z-bin • The average of the scaled predictions is used to compare
to the average leakage current data for each layer
ScaleFactorDisk-1 1.353Disk-2 1.335Disk-3 1.391

Sally Seidel Page 36 25 February 2019
Measurement Uncertainty
* ATL-INDET-PUB-2014-004 ** https://twiki.cern.ch/twiki/bin/view/Atlas/LuminosityForPhysics
• The measurement uncertainty for HVPP4 is 15.9%* • The uncertainty on measured leakage current for
LHC Run 2 Power Supply modules is 11.2%, calculated by adding the following uncertainties in quadrature:
Sally Seidel Page 37 25 February 2019
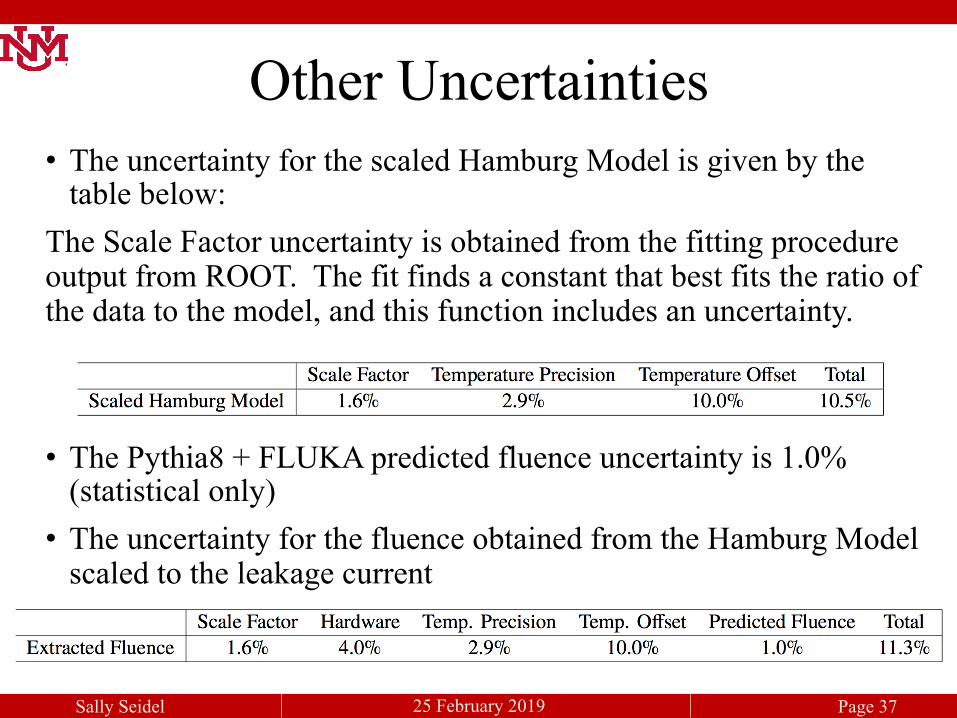
Other Uncertainties • The uncertainty for the scaled Hamburg Model is given by the
table below: The Scale Factor uncertainty is obtained from the fitting procedure output from ROOT. The fit finds a constant that best fits the ratio of the data to the model, and this function includes an uncertainty.
• The Pythia8 + FLUKA predicted fluence uncertainty is 1.0% (statistical only) • The uncertainty for the fluence obtained from the Hamburg Model
scaled to the leakage current
Sally Seidel Page 38 25 February 2019
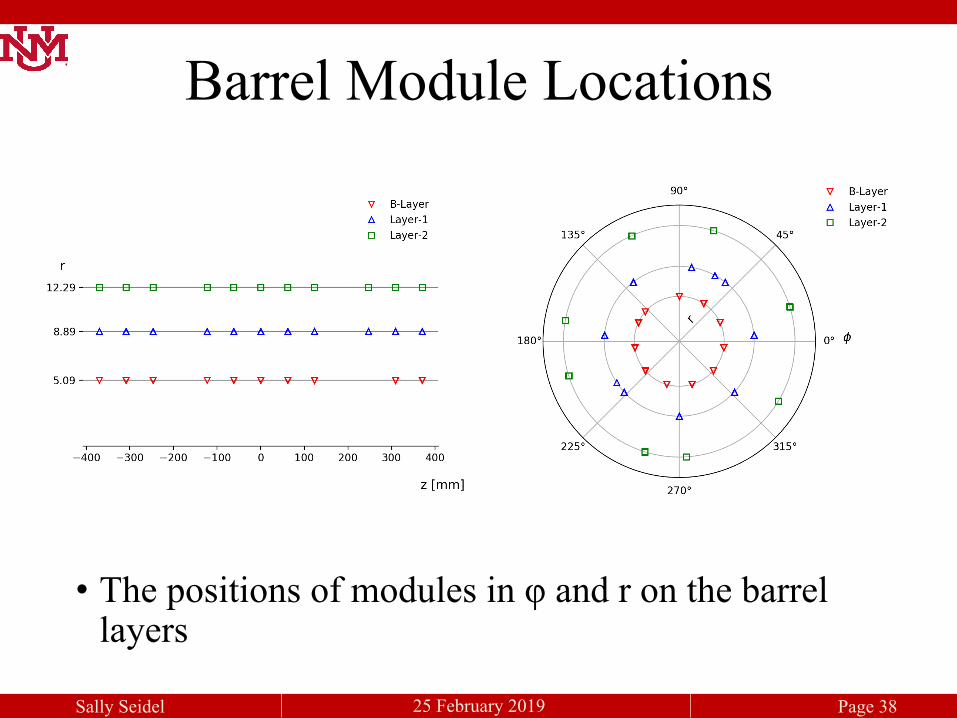
Barrel Module Locations
• The positions of modules in φ and r on the barrel layers
Sally Seidel Page 39 25 February 2019
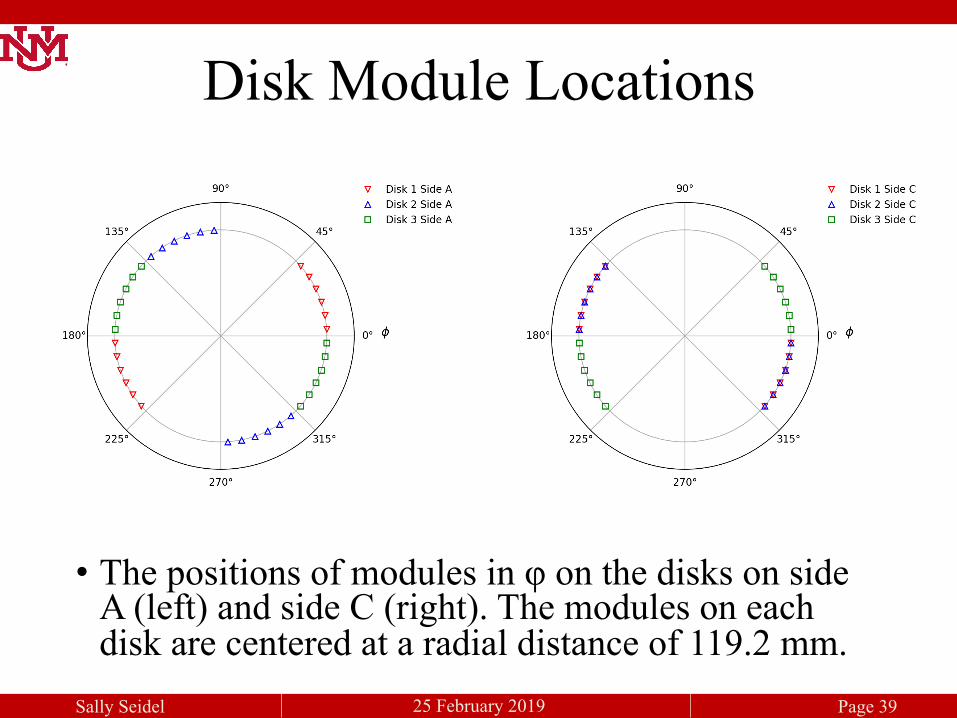
Disk Module Locations
• The positions of modules in φ on the disks on side A (left) and side C (right). The modules on each disk are centered at a radial distance of 119.2 mm.

Sally Seidel Page 40 25 February 2019
• The IBL leakage current data were reported at the RD50 meeting in November 2017* • Hamburg Model predictions were found to
overestimate the leakage current data for the IBL • Dedicated studies of fluence simulation using
FLUKA** and Geant 4 † ‡ are ongoing
IBL Fluence
* Nick Dann, ATLAS pixel and strip rad damage measurements, RD50 Workshop https://indico.cern.ch/event/663851/contributions/2711512/ ** S. Baranov et al., Estimation of Radiation Background, Impact on Detectors, Activation and Shielding Optimization in ATLAS, (2005), http://inspirehep.net/record/1196420/ † GEANT4 Collaboration, GEANT4: a simulation toolkit, Nucl. Instrum. Meth. A 506 (2003) 250. ‡ ATLAS Collaboration, The ATLAS Simulation Infrastructure, Eur. Phys. J. C 70 (2010) 823, arXiv:1005.4568 [physics.ins-det].
Sally Seidel Page 41 25 February 2019
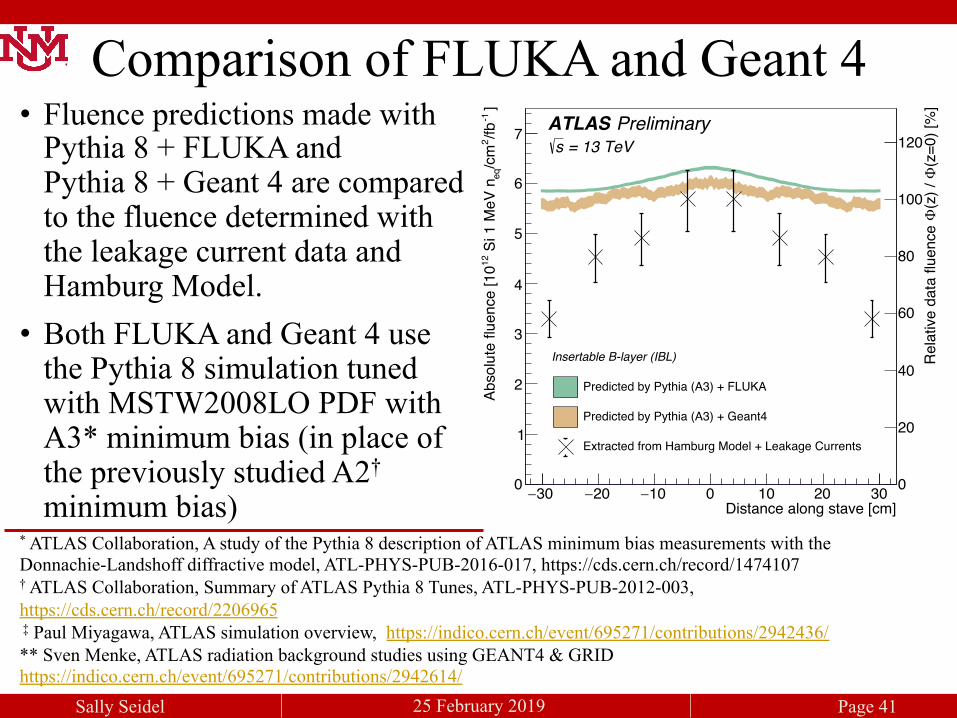
Comparison of FLUKA and Geant 4 • Fluence predictions made with
Pythia 8 + FLUKA and Pythia 8 + Geant 4 are compared to the fluence determined with the leakage current data and Hamburg Model. • Both FLUKA and Geant 4 use
the Pythia 8 simulation tuned with MSTW2008LO PDF with A3* minimum bias (in place of the previously studied A2† minimum bias)
* ATLAS Collaboration, A study of the Pythia 8 description of ATLAS minimum bias measurements with the Donnachie-Landshoff diffractive model, ATL-PHYS-PUB-2016-017, https://cds.cern.ch/record/1474107 † ATLAS Collaboration, Summary of ATLAS Pythia 8 Tunes, ATL-PHYS-PUB-2012-003, https://cds.cern.ch/record/2206965 ‡ Paul Miyagawa, ATLAS simulation overview, https://indico.cern.ch/event/695271/contributions/2942436/ ** Sven Menke, ATLAS radiation background studies using GEANT4 & GRID https://indico.cern.ch/event/695271/contributions/2942614/
30− 20− 10− 0 10 20 30Distance along stave [cm]
0
1
2
3
4
5
6
7
]-1/fb2
/cm
eq S
i 1 M
eV n
12Ab
solu
te fl
uenc
e [1
0
PreliminaryATLAS = 13 TeVs
0
20
40
60
80
100
120
(z=0
) [%
]Φ
(z) /
Φ
Rel
ativ
e da
ta fl
uenc
e
Insertable B-layer (IBL)
Predicted by Pythia (A3) + FLUKA
Predicted by Pythia (A3) + Geant4
Extracted from Hamburg Model + Leakage Currents

Sally Seidel Page 42 25 February 2019
• A comparison of fluence predictions made with FLUKA and Geant4 are compared to the fluence determined with the leakage current data and Hamburg Model. • The Pythia 8* simulation
tuned with A2 minimum bias and Geant 4 accounting for neutrons, protons and pions only are also compared.
Fluence Simulation Comparisons
*See references on backup slide 41
30− 20− 10− 0 10 20 30Distance along stave [cm]
0
1
2
3
4
5
6
7
]-1/fb2
/cm
eq S
i 1 M
eV n
12Ab
solu
te fl
uenc
e [1
0
PreliminaryATLAS = 13 TeVs
0
20
40
60
80
100
120
(z=0
) [%
]Φ
(z) /
Φ
Rel
ativ
e da
ta fl
uenc
e
Insertable B-layer (IBL)Predicted by Pythia (A2) + FLUKAPredicted by Pythia (A3) + FLUKAPredicted by Pythia (A3) + Geant4
only)πPredicted by Pythia (A3) + Geant4 (n + p + Extracted from Hamburg Model + Leakage Currents