Atlanta Households - Prosperity Now · Atlanta Households O ur national economy is barreling...
24
LIQUID ASSET POVERTY POPULATION JOBS Advancing Collective Prosperity Through Entrepreneurship in Atlanta Atlanta Households O ur national economy is barreling ahead—while leaving millions of people behind. Poverty and unemployment rates are down, but these indicators mask the financial tightrope that many working families walk every day. Atlanta and Georgia are no exceptions. In Georgia, nearly 30% of jobs are low-wage, up from 26.7% in 2011. Low-wage workers are struggling to stretch their income to meet basic expenses. Across the state, a little over half (50.2%) of families saved for an emergency last year, while only 41.6% of Black families reported saving for an emergency. However, in Atlanta 1 we see that 41.1% of families don’t have enough saved to cover three months of expenses at the poverty level, meaning these “liquid asset poor” households have less than $6,150 in savings—a conservative estimate of what it would take to weather a financial storm such as a job loss or medical emergency. This precarious situation presents real challenges for all families seeking to invest in their future and fully participate in the economy, but when we break the data down across racial and ethnic lines, we learn that Black families are nearly three times likelier to live in liquid asset poverty than their White counterparts in Atlanta. 2 Also, Black workers are nearly five times likelier to be unemployed than White workers. families don’t have enough saved to cover three months of expenses at the poverty level Latino Asian White 66% 33% 69% 22% 1 All data in the report is for the City of Atlanta unless otherwise specified. 2 All data accessed from the 2017 Prosperity Now Scorecard, available at http://www.scorecard.prosperitynow.org. See additional sources in the Appendix. Why Focus on African American Wealth in Atlanta? Black White Latino Asian 52% 37% 5% 4% Black 1 in 3 5X Black workers in Atlanta are By Solana Rice, Dominique Derbigny and Lebaron Sims more likely to be unemployed than White workers. BY RACE
Transcript of Atlanta Households - Prosperity Now · Atlanta Households O ur national economy is barreling...

LIQUID ASSET POVERTY
POPULATION
JOBS
Advancing Collective Prosperity Through Entrepreneurship in Atlanta
Atlanta Households
Our national economy is barreling ahead—while leaving millions of people behind. Poverty and unemployment rates are down, but these indicators mask the financial tightrope that many
working families walk every day.
Atlanta and Georgia are no exceptions. In Georgia, nearly 30% of jobs are low-wage, up from 26.7% in 2011. Low-wage workers are struggling to stretch their income to meet basic expenses. Across the state, a little over half (50.2%) of families saved for an emergency last year, while only 41.6% of Black families reported saving for an emergency. However, in Atlanta1 we see that 41.1% of families don’t have enough saved to cover three months of expenses at the poverty level, meaning these “liquid asset poor” households have less than $6,150 in savings—a conservative estimate of what it would take to weather a financial storm such as a job loss or medical emergency.
This precarious situation presents real challenges for all families seeking to invest in their future and fully participate in the economy, but when we break the data down across racial and ethnic lines, we learn that Black families are nearly three times likelier to live in liquid asset poverty than their White counterparts in Atlanta.2 Also, Black workers are nearly five times likelier to be unemployed than White workers.
families don’t have enough saved to cover three months of expenses at the poverty level
Latino
Asian
White
66%
33%
69%
22%
1All data in the report is for the City of Atlanta unless otherwise specified.
2All data accessed from the 2017 Prosperity Now Scorecard, available at http://www.scorecard.prosperitynow.org. See additional sources in the Appendix.
Why Focus on African American Wealth in Atlanta?
Black WhiteLatino Asian
52% 37%
5% 4%
Black
1 in 3
5XBlack workers in Atlanta are
By Solana Rice, Dominique Derbigny and Lebaron Sims
more likely to be unemployed than White workers.
BY RACE

Advancing Collective Prosperity Through Entrepreneurship in Atlanta
For more information and data visit prosperitynow.org
PUBLISHED DECEMBER 20172
Below is Prosperity Now’s Household Financial Security Framework, which shows the interplay between financial knowledge, income, savings and assets. This helpful illustration shows how low wages and lack of savings are just two barriers among many facing families of color, especially African American families.
Financial management skills and owning assets can increase income
Know how the financial system works and how to gather financial information and analyze choices to make beneficial financial decisions and manage household resources e�ectively
Households need:
Timely access to relevant financial information, knowledge and skills, such as through financial coaching, financial education or counseling Educatonal and parental activities that build children’s executive function from early childhood through adolescence
NAVIGATE
LEARN EARN SAVE OWN
PROTECTProtect—through insurance, consumer protections, financial service regulations and other services and polices—what households earn, save and own against
loss of income or assets, significant expenses (e.g., high medical costs) and predatory practices
Households need:
Access to a�ordable, quality insurance, including unemployment, disability, health and homeowners’/renters’ insurance Policies that protect consumers and regulate financial services Access to services that help address financial emergencies (e.g., foreclosure prevention programs, emergency loans)
Acquire the basic skills, executive function and specific job skills needed to access quality employment
Households need: Quality early childhood and K-12 education Financing/support for postsecondary education (e.g., financial aid, Children’s Savings Accounts) Job training and apprenticeship programs
Earn su�cient income to cover expenses and save; may include wages, employer
benefits, business income, public benefits, tax credits and investment income
Households need:
Opportunities and support for acquiring education and job skills Available quality jobs and business opportunities
A�ordable, reliable services that facilitate work (e.g., transportation, child care, stable housing)
Access to public benefits and tax credits
Set aside household income left over after meeting basic needs and paying down debt for emergencies and long-term savings for
assets, college savings and retirement savings
Households need:
A�ordable and accessible financial products and services Incentive programs that help savings grow, such as CSAs and IDAs Income that is su�cient to meet basic expenses, with some left over
Acquire a home, business, investments and/or other assets that help build financial
security and wealth
Households need:
A�ordable options (e.g., subsidized housing, low minimums for investments)
Access to a�ordable financing for mortgages and business loans
Incentives/supports for asset purchases (e.g., downpayment assistance, tax benefits, IDAs)
Preparation/skill-building prior to purchases (e.g., first-time homebuyer classes and business training)
HOUSEHOLD FINANCIAL SECURITY FRAMEWORK
The intergenerational cycle of poverty facing communities of color is perpetuated by a system that excludes them from the wealth-building opportunities that come with owning assets, such as having savings in the bank or owning a home or small business. The inability of households of color in Atlanta to purchase wealth-building assets is unsurprising when we consider that one in four African American Atlantans have zero or negative net worth, meaning they owe more than they own.
Given that African Americans make up 52% of Atlanta’s population, it is imperative that the city address the harsh economic realities facing Black Atlantans. Addressing the fact that many families are in no position to weather a financial crisis, much less accrue wealth and pass it on to future generations, is essential not only to the financial wellness of Atlanta’s households of color, but to the regional economy writ large.

For more information and data visit prosperitynow.orgFor more information and data visit prosperitynow.org
PUBLISHED DECEMBER 2017
Advancing Collective Prosperity Through Entrepreneurship in Atlanta
3
3
WHO IS LIQUID ASSET POOR IN ATLANTA, GA?
HOUSEHOLDS WITH ZERO NET WORTH
Note: Liquid asset poverty estimates at the city level are derived from Prosperity Now’s statistical modeling process using the Census Bureau’s Survey of Income and Program Participation and the 2011-2015
American Community Survey data. Caution should be used in interpreting the local estimates as the statistical model is based on national surveys of fewer than 50,000 households.
LIQUID ASSET POVERTY BY RACE
MEDIAN HOUSEHOLD INCOME
41%
HOUSEHOLDS IN LIQUID ASSET POVERTY…
AVERAGE BUSINESS VALUE UNEMPLOYMENT RATE HOMEOWNERSHIP RATE
LATINOBLACK ASIAN WHITE
$83,722$67,285$43,110$28,105
LATINO
ASIAN
WHITE
66%
33%
69%
22%
BLACK
7.3%is the average unemployment rate
(compared to 5.8% nationally)
Latino
Asian
White
6.1%
n/a
12.7%
2.6%
Black
BY RACE
WHITE
BLACK LATINO
ASIAN
$58,085 $475,877
$658,264 $706,090
32% 34%
38% 57%
BLACK LATINO
ASIAN WHITE
Across all measures of household financial security, households of color are faring worse than White households in Atlanta. 41.1% of families are “liquid asset poor” meaning they don’t have enough saved to cover three months of expenses at the poverty level or they have less than $6,150 in savings - a conservative estimate of what it would take to weather a financial storm such as a job loss or medical emergency. Almost 70% of Black families are liquid asset poor compared to 22% of White families.
Advancing Collective Prosperity Through Entrepreneurship in Atlanta
For more information and data visit prosperitynow.org
PUBLISHED DECEMBER 20174
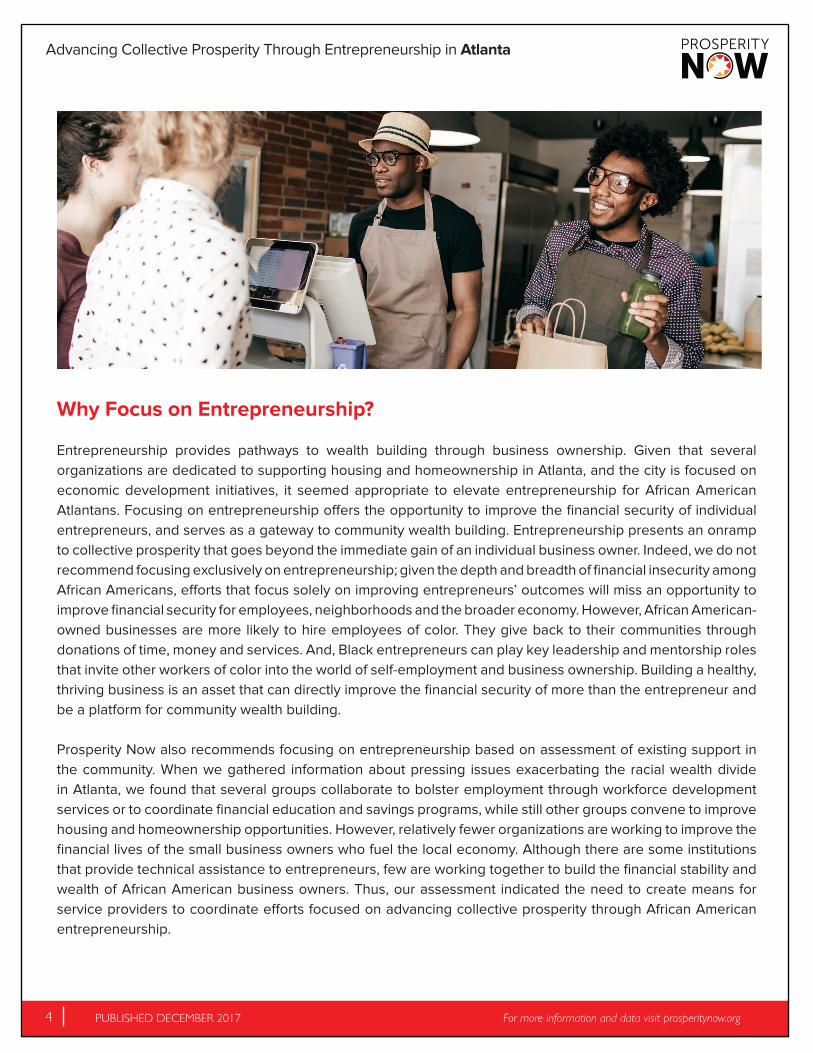
Why Focus on Entrepreneurship?
Entrepreneurship provides pathways to wealth building through business ownership. Given that several organizations are dedicated to supporting housing and homeownership in Atlanta, and the city is focused on economic development initiatives, it seemed appropriate to elevate entrepreneurship for African American Atlantans. Focusing on entrepreneurship offers the opportunity to improve the financial security of individual entrepreneurs, and serves as a gateway to community wealth building. Entrepreneurship presents an onramp to collective prosperity that goes beyond the immediate gain of an individual business owner. Indeed, we do not recommend focusing exclusively on entrepreneurship; given the depth and breadth of financial insecurity among African Americans, efforts that focus solely on improving entrepreneurs’ outcomes will miss an opportunity to improve financial security for employees, neighborhoods and the broader economy. However, African American-owned businesses are more likely to hire employees of color. They give back to their communities through donations of time, money and services. And, Black entrepreneurs can play key leadership and mentorship roles that invite other workers of color into the world of self-employment and business ownership. Building a healthy, thriving business is an asset that can directly improve the financial security of more than the entrepreneur and be a platform for community wealth building.
Prosperity Now also recommends focusing on entrepreneurship based on assessment of existing support in the community. When we gathered information about pressing issues exacerbating the racial wealth divide in Atlanta, we found that several groups collaborate to bolster employment through workforce development services or to coordinate financial education and savings programs, while still other groups convene to improve housing and homeownership opportunities. However, relatively fewer organizations are working to improve the financial lives of the small business owners who fuel the local economy. Although there are some institutions that provide technical assistance to entrepreneurs, few are working together to build the financial stability and wealth of African American business owners. Thus, our assessment indicated the need to create means for service providers to coordinate efforts focused on advancing collective prosperity through African American entrepreneurship.

For more information and data visit prosperitynow.orgFor more information and data visit prosperitynow.org
PUBLISHED DECEMBER 2017
Advancing Collective Prosperity Through Entrepreneurship in Atlanta
5
5
Challenges in African American Entrepreneurship
Despite the region’s reputation as a burgeoning mecca for upwardly mobile African Americans, Atlanta’s business scene exhibits the same inequities as those of other American cities. Residential segregation in the city remains as entrenched today as it was decades prior, and while population growth among households of color has outpaced the rate of growth among White households, the benefits of an equitable economy continue to evade households of color—African American entrepreneurs in particular. Recent data collected by Invest Atlanta suggests that, though a majority of the city’s population is African American, Atlanta’s certified businesses are disproportionately located in predominantly White neighborhoods. Further, estimates from the most recent Survey of Business Owners suggest that African American entrepreneurs in Atlanta are more likely to be sole proprietors and are less likely to turn their businesses into wealth-generating vehicles compared to entrepreneurs of other racial and ethnic backgrounds.
Among Atlanta’s African American residents, business ownership is seen as an opportunity to improve one’s earning potential. By and large, this isn’t far from the truth—the city’s median African American household earns $28,105 annually, a figure only roughly half the national median household income ($53,889). Likewise, African Americans in Atlanta remain nearly five times likelier than White residents to be unemployed.
Compared to the median household income for African American workers in Atlanta, the average African American-owned business is valued at $58,085, suggesting that microbusiness ownership is a reliable substitute for or supplement to traditional employment. However, the earnings derived from these businesses must cover operating expenses and the remaining funds may be too meager to support the business owner. And, given that nearly 96% of African American-owned businesses in the city have no paid employees, these businesses currently have little room for growth beyond day-to-day subsistence. Connecting African American business owners to capital, technical assistance and economic development opportunities could help them grow and expand to boost revenues and hire additional employees so that they become thriving, sustainable businesses.
By contrast, Atlanta’s median White household earns $83,722 annually, and the average White-owned Atlanta business is valued at $658,264—more than 11 times greater than the value of the city’s average African American-
Latino
Asian
Black
White
$475,877
$706,090
$658,264
American Indian or Alaska Native $39,306
$58,085
Business Value By Race
U.S. Census Bureau, 2012 Survey of Business Owners
Advancing Collective Prosperity Through Entrepreneurship in Atlanta
For more information and data visit prosperitynow.org
PUBLISHED DECEMBER 20176
owned business, suggesting a degree of success that allows the owner to capitalize upon their business as a true personal and community asset. The role of White-owned business as an asset to the community can be seen by the high percentage that have at least one paid employee. Compared to only four percent of Black-owned businesses, nearly 28% of White-owned businesses have one or more paid employees in addition to the owner. Since 2007, the majority of the growth in businesses operating in Atlanta has been driven by businesses without employees. However, the share of White-owned businesses with employees increased relative to White-owned non-employer businesses over the same time period, while the opposite occurred among African American-owned businesses.
As the city continues to grow and the demographics of the city evolve, it is imperative that Atlanta addresses these gaps in entrepreneurship outcomes head-on.
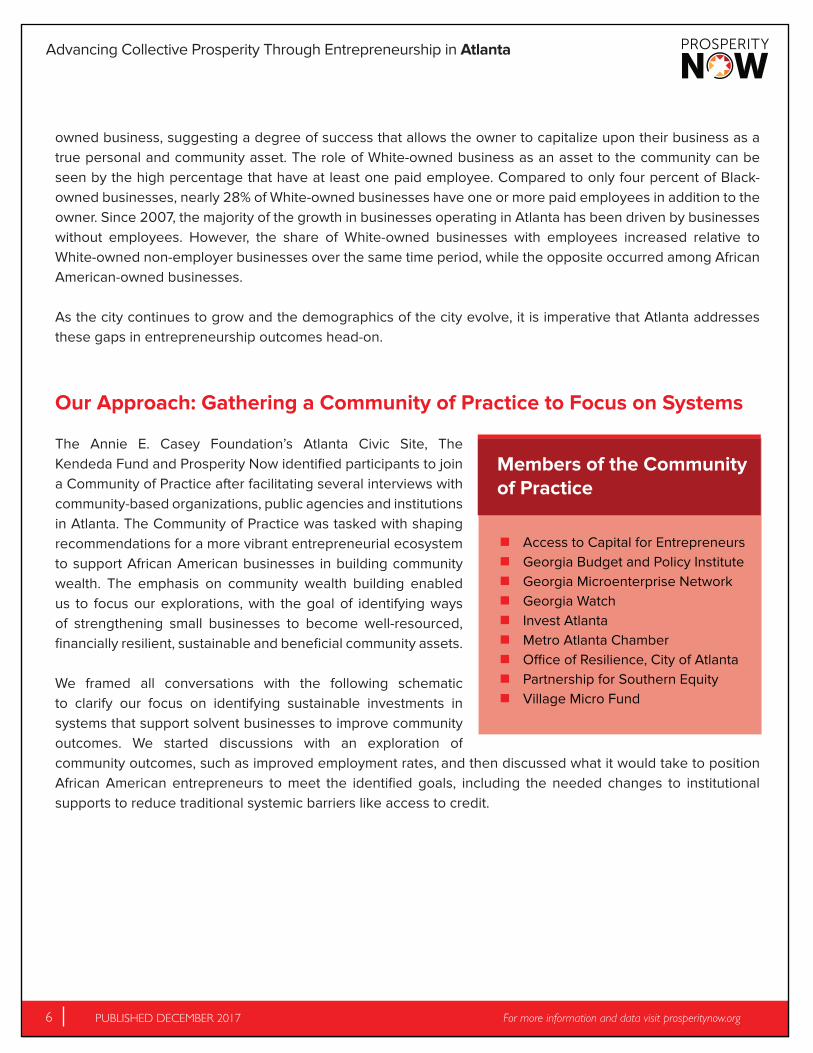
Our Approach: Gathering a Community of Practice to Focus on Systems
The Annie E. Casey Foundation’s Atlanta Civic Site, The Kendeda Fund and Prosperity Now identified participants to join a Community of Practice after facilitating several interviews with community-based organizations, public agencies and institutions in Atlanta. The Community of Practice was tasked with shaping recommendations for a more vibrant entrepreneurial ecosystem to support African American businesses in building community wealth. The emphasis on community wealth building enabled us to focus our explorations, with the goal of identifying ways of strengthening small businesses to become well-resourced, financially resilient, sustainable and beneficial community assets.
We framed all conversations with the following schematic to clarify our focus on identifying sustainable investments in systems that support solvent businesses to improve community outcomes. We started discussions with an exploration of community outcomes, such as improved employment rates, and then discussed what it would take to position African American entrepreneurs to meet the identified goals, including the needed changes to institutional supports to reduce traditional systemic barriers like access to credit.

For more information and data visit prosperitynow.orgFor more information and data visit prosperitynow.org
PUBLISHED DECEMBER 2017
Advancing Collective Prosperity Through Entrepreneurship in Atlanta
7
7
ENTERPRISE
INSTITUTIONS COMMUNITY
Organizations in the Community of Practice were tasked with:
n Describing a vision for advancing collective prosperity through African American entrepreneurship that builds from data and practice.
n Including actionable policy and programmatic recommendations for improving financial security for African American businesses.
n Identifying the resources, collaborations and partnerships necessary to achieve the policy and programmatic recommendations and vision.
Virtual and In-Person Meetings
Over the course of six months in 2017, Prosperity Now convened and facilitated three in-person meetings and two virtual conversations of the Community of Practice.
The first session relayed household financial security data and focused on identifying some of the key challenges facing African American entrepreneurs, including lack of access to credit, capital, technical assistance, networks and markets. On top of gaps in wealth and access to capital, a trust gap—too many organizations, investors and institutions misjudging the risk associated with investing in African American-owned businesses—stifles growth opportunities. Many members talked about needing alternative ways for entrepreneurs to demonstrate credit worthiness and to build the social capital that can grease the wheels of investment decisions.
The second and third conversations focused on solutions within the systems that drive these challenges. We facilitated a discussion on systems-level thinking, categorized solutions according to business’ needs, and discussed what it would take to implement these solutions and what the possible outcomes might be. We followed these conversations by asking each organization to submit a SWOT analysis intended to take stock of and reveal overlaps within strengths, weaknesses, opportunities and threats.

Advancing Collective Prosperity Through Entrepreneurship in Atlanta
For more information and data visit prosperitynow.org
PUBLISHED DECEMBER 20178
The Goals
After exploring the data and identifying challenges, the Community of Practice prioritized the need to increase the number of African American businesses with more than one employee. The Census reports that there are 25,457 African American-owned businesses in Atlanta. With this in mind, the Community of Practice set a primary goal of supporting 1,000 African American-owned businesses in 1,000 days by helping 900 businesses hire its first employee and another 100 businesses offer living wages to staff already employed.3 This is an ambitious goal that hinges on identifying African American business owners in high-growth sectors who are in a position to hire an additional employee. Also, given that Georgia has a minimum wage of $5.15 per hour (compared to the federal minimum wage of $7.25), we know that African American-owned businesses may be at a disadvantage if they pay more for labor than White-owned businesses. However, we believe that by strengthening African American business owners’ financial stability, this is a feasible goal that can produce larger community impacts.
Our hope is to spur local action to support African American-owned businesses to generate the following community outcomes:
n Increase the number of African American registered businesses
n Increase the number of African American businesses with employees
n Increase the number of African American businesses registered as contractors with the City of Atlanta
n Increase African American business revenues
n Increase employment among African Americans
n Improve financial stability for African American business owners and their employees
3 The numbers in these goals are dependent on additional research about the number of African American-owned businesses.

For more information and data visit prosperitynow.orgFor more information and data visit prosperitynow.org
PUBLISHED DECEMBER 2017
Advancing Collective Prosperity Through Entrepreneurship in Atlanta
9
9
Strategies Identified by the Community of Practice
The Community of Practice identified three initial strategies to help advance the goal of supporting 1,000 African American-owned businesses in 1,000 days. These strategies include ideas for implementation to help ensure that this is a living document that continues to inform the future work of the Community of Practice and other coalitions of organizations. While the details of these strategies need further refining, they include ways for organizations to collaborate on service delivery, deepen and strengthen policy advocacy, and create a rich narrative about how a more inclusive business development ecosystem can begin to bridge racial wealth inequality.
Strategy 1: Create Data Sharing Opportunities
Sharing existing programmatic data from organizations and gathering more data to identify and quantify African American businesses and their sectors, size and growth potential will better position the Community of Practice to:
n Test whether the number of entrepreneurs served in the goals is realistic and aspirational.
n Connect entrepreneurs to existing services in a coordinated way.
n Develop the basis for a possible ongoing “census” of African American entrepreneurs.
The goals outlined are ambitious, in large part because no single organization has a clear sense of the African American entrepreneurial landscape in Atlanta. Insufficient data are available on the number of existing African American-owned businesses, which sectors and industries they occupy, and their revenues over time. Data by race, place of business, industry and growth potential are just a few data points that, if collected, would help illuminate which African American businesses are well-positioned to expand, either by hiring at least one employee or by paying living wages.
To implement this strategy, organizations can leverage existing data sets and data management tools, and determine a consistent set of indicators to track for small businesses. Invest Atlanta may be a good starting point given that they already collect robust data on local businesses. Also, area universities that run small business development centers may have data on these measures. Previously, state and national funding was provided to entrepreneurship organizations that provide technical assistance to microenterprises (those with fewer than five employees) to enter data into Microtest, a service that Georgia Microenterprise Network (GMEN) provided until their funding was no longer available. Establishing a consistent data source is necessary to test strategies and ensure entrepreneurs get access to other services they need.Additionally, data sharing agreements and systems, like Microtest, can help organizations participating in the Community of Practice to share individualized data on the African American entrepreneurs they serve. Additional funding to cover data management costs is necessary. Once the data are compiled, a subset of entrepreneurs can be identified and interviewed to more deeply understand their financial position, their interest in and pathways for growth, their financial and operational challenges, and their understanding of resources available to them.

Advancing Collective Prosperity Through Entrepreneurship in Atlanta
For more information and data visit prosperitynow.org
PUBLISHED DECEMBER 201710
Strategy 2: Establish an Economic Development and Entrepreneurship Institute
Developing an economic development and entrepreneurship institute that is funded to build the capacity of community organizers to increase access to economic development opportunities among African American entrepreneurs would:
n Increase understanding of and access to development opportunities.
n Share recommendations and help technical assistance providers build a pipeline of entrepreneurs ready to seize opportunities.
n Help spur innovative business development ideas by enabling institute fellows to advise developers on an ongoing basis, rather than only during the implementation phases of development.
Shape the curriculum of the Georgia Economic Developer Certification requirements to ensure that economic development practitioners learn how to avoid business displacement, create procurement and contracting opportunities for Minority Business Enterprises (MBEs), and grow and attract more MBEs.
Because Atlanta and the surrounding metro area is home to a growing population, world-renowned universities and several Fortune 500 companies, it’s no surprise that the area consistently has major physical development projects in the works. Community groups often must organize to ensure that their neighborhoods see the benefits of these developments. While many projects now have community benefits agreements that stipulate local hiring, housing benefits and community amenities, these developments rarely account for the impact on local businesses.
The Community of Practice proposes to establish an entrepreneurship institute to engage community leaders and organizers in advocating for African American business growth opportunities, funding to support expansion, and access to economic development opportunities that are on the horizon. Such an institute would equip community organizers with data and a set of messages to make the case for the value that African American businesses bring to the region. The institute would also engage stakeholders—service providers, developers, city planners and others—to build a process for connecting African American entrepreneurs with opportunities in the earliest stages of local development activities (e.g., before permitting and zoning decisions are made), instead of bringing them to the negotiating table after a project has been approved.
The institute, and a curriculum to guide its efforts, would be co-developed by practitioners, entrepreneurs and technical assistance providers that work closely with entrepreneurs. The Community of Practice could interview community organizing groups and entrepreneurs about what tools, resources and supports might be helpful, and draft a citywide community benefits agreement that considers impacts on small businesses. Additionally, they could develop a fund for the institute to cover promotion and marketing, services provided to entrepreneurs and an evaluation tool to estimate the impact of development for local entrepreneurs and larger businesses.

For more information and data visit prosperitynow.orgFor more information and data visit prosperitynow.org
PUBLISHED DECEMBER 2017
Advancing Collective Prosperity Through Entrepreneurship in Atlanta
11
11
Strategy 3: Expand Procurement and Contracting Opportunities for African American Entrepreneurs
Expanding procurement and contracting opportunities for African American entrepreneurs as a method to expand markets for businesses interested in hiring one employee or increasing wages would:
n Increase the number of African American businesses registered as an MBE.
n Increase the amount of contracting funding allocated to businesses registered as MBEs.
n Increase the number of African-American business owners who report that the local and state procurement processes are clear and achievable.
A crucial element of growing a business is expanding markets. Several members of the Community of Practice expressed that public contracting and procurement opportunities have traditionally been a mainstay for African American businesses and must be a part of future strategies. The state of Georgia was recently ranked #1 in Governing Magazine’s survey of state procurement agencies. According to the state’s Department of Economic Development, Georgia has the second-largest percentage of African American businesses, but no policies exist to ensure that African American businesses are represented in contracting and procurement opportunities. Scaling opportunities for contracting and procurement will depend on what state and local policies allow and which opportunities exist to build and incentivize private-sector will. Streamlining the city and state processes for registering as a minority-owned business or disadvantaged business may be a good starting point.
There are also policy implications for this strategy because the state currently does not have any goals for small business procurement and contracting, let alone set-asides, preferences or targets for minority- or women-owned businesses. The Community of Practice also recommended that pairing entrepreneurs with opportunities to contract with larger businesses was a viable way of increasing access to these opportunities without policy change. This does take considerable coordination and business owners must be prepared and willing to enter into partnership on contract deliverables.
The Community of Practice will likely need to gather a group of cross-sector champions to develop a policy campaign that creates incentives for hiring minority- and women-owned businesses for state and local contracts. The Community of Practice will also likely need to build a training program that ensures service providers can offer trainings and consulting services that prepare and position businesses for contracting and procurement opportunities.

Advancing Collective Prosperity Through Entrepreneurship in Atlanta
For more information and data visit prosperitynow.org
PUBLISHED DECEMBER 201712
Conclusion
The data demonstrate a clear need to focus on the financial stability of African American families in Atlanta. Addressing disparities will require collaboration among many institutions, service providers and funders. It will require a clear conversation about the intersection of race and wealth and an acknowledgement of the systemic barriers complicating and stalling the economic potential of African Americans. This document is only a starting point for rethinking service delivery, small business advising and investment. Putting these recommendations into action depends on reaching out to more service providers, building the organizational commitment from leaders and executives to shoulder cross-sector initiatives, and establishing trust between organizations.
Although the Community of Practice focused narrowly on entrepreneurship as a point of entry, we hope that this report spurs conversation and collaboration relative to other aspects of financial security and wealth building, such as homeownership and savings. We also hope that this report informs Atlanta’s economic development, private-sector investment and poverty-alleviation goals.

For more information and data visit prosperitynow.orgFor more information and data visit prosperitynow.org
PUBLISHED DECEMBER 2017
Advancing Collective Prosperity Through Entrepreneurship in Atlanta
13
13
APPENDIX A: Resources
Microbusiness in GeorgiaThis guide, compiled by the Association for Enterprise Opportunity, summarizes the sectors, demographics and economic impact of microenterprise in the state in 2013.
Contracting for Equity: Best Local Government Practices that Advance Racial Equity In Government Contracting and Procurement PolicyThis report from the Government Alliance on Race & Equity identifies best practices and policies for agencies and advocates looking to ensure that entrepreneurs of color gain access to procurement and contracting opportunities.
Meda’s 2016 Annual ReportMeda is a statewide organization in Minnesota that focuses on helping minority entrepreneurs succeed through financing solutions, business consulting, and corporate and government contracting opportunities. Their annual report includes indicators of their success measured not only by improvements in business outcomes, but also in the amount of resources allocated to firms and the resulting impact on the community.
Research on Race and Entrepreneurship, December 2016This compilation of resources offered by the Kauffman Foundation explores the intersection of race, entrepreneurship and wealth, while connecting to many other resources and articles.
Stuck from the Start: The Financial Challenges of Low- and Moderate-Income African American Entrepreneurs in the SouthIncluded in this report from Prosperity Now is a summary of in-depth interviews with low-income African American entrepreneurs in the South.
Systems Thinking for Social Change: Making an Explicit ChoiceThis except from a book by David Peter Stroh is a helpful resource for identifying the root causes of the challenges entrepreneurs face and the solutions we can pursue to address the systems that create these challenges.

Advancing Collective Prosperity Through Entrepreneurship in Atlanta
For more information and data visit prosperitynow.org
PUBLISHED DECEMBER 201714
POPULATION AND DEMOGRAPHICSMeasures Atlanta Fulton County Atlanta MSA Georgia United StatesTotal Population 448,901 983,903 5,535,837 10,006,693 316,515,021
White 165,309 397,535 2,734,202 5,460,401 197,258,278
Black or African American 235,331 428,481 1,800,312 3,054,350 38,785,726
Asian 17,461 61,834 292,695 358,295 16,054,074
Hispanic or Latino 22,495 75,002 578,574 915,120 54,232,205
Total Households 185,820 379,957 1,964,316 3,574,362 116,926,305
White 80,196 174,470 1,068,561 2,128,149 80,971,346
Black or African American 90,138 160,194 638,024 1,072,378 14,186,983
Asian 6,087 20,600 88,249 106,772 5,067,711
Hispanic or Latino 6,740 19,821 144,597 226,114 14,410,181
U.S. Citizenship Rate 95.2% 92.6% 92.2% 94.1% 93.0%
White 97.4% 96.8% 98.2% 98.8% 98.5%
Black or African American 98.8% 97.8% 96.2% 97.5% 95.9%
Asian 55.7% 61.5% 65.8% 66.2% 72.1%
Hispanic or Latino 71.0% 66.1% 64.3% 65.1% 76.3%
Speak English Less Than "Very Well" 3.0% 5.7% 7.3% 5.7% 8.6%
White 1.0% 2.0% 1.4% 0.9% 1.6%
Black or African American 0.8% 1.3% 2.2% 1.5% 3.0%
Asian 21.1% 25.1% 36.8% 36.7% 34.8%
Hispanic or Latino 28.0% 37.7% 39.2% 38.9% 32.3%
HOUSEHOLD FINANCESMeasures Atlanta Fulton County Atlanta MSA Georgia United States
Median Household Income $47,527 $57,207 $57,000 $49,620 $53,889
White $83,722 $89,335 $70,082 $57,966 $59,542
Black or African American $28,105 $36,030 $43,433 $36,655 $35,695
Asian $67,285 $93,780 $69,137 $65,611 $74,245
Hispanic or Latino $43,110 $43,655 $40,512 $38,784 $42,651
Income Poverty Rate 19.3% 13.0% 12.0% 14.2% 11.3%
White 2.6% 2.9% 6.2% 8.4% 7.1%
Black or African American 31.4% 23.2% 18.4% 23.3% 23.1%
Asian 6.7% 6.6% 10.3% 10.8% 9.2%
Hispanic or Latino 30.3% 24.8% 26.5% 27.7% 21.8%
Asset Poverty Rate 36.2% 30.6% 24.7% 27.9% 25.8%
White 17.4% 17.0% 13.8% 19.1% 19.0%
Black or African American 50.7% 46.2% 39.2% 42.7% 44.5%
Asian 25.8% 16.6% 16.8% 17.8% 19.2%
Hispanic or Latino 49.6% 44.9% 45.5% 43.6% 39.7%
Liquid Asset Poverty Rate 48.4% 36.3% 40.8% 40.2% 36.8%
White 22.3% 19.1% 26.3% 29.8% 28.2%
Black or African American 68.7% 55.3% 58.9% 56.7% 56.7%
Asian 33.3% 21.0% 34.8% 31.4% 30.5%
Hispanic or Latino 66.4% 57.2% 71.8% 63.7% 60.7%
APPENDIX B : Data TablesFinancial security and demographic data are included, along with data definitions and sources for Atlanta, Fulton County, the Atlanta-Sandy Springs-Marietta Metropolitan Statistical Area,4 Georgia and the United States.

For more information and data visit prosperitynow.orgFor more information and data visit prosperitynow.org
PUBLISHED DECEMBER 2017
Advancing Collective Prosperity Through Entrepreneurship in Atlanta
15
15
Measures Atlanta Fulton County Atlanta MSA Georgia United StatesHouseholds with Zero Net Worth 25.6% 21.8% 17.8% 19.3% 16.9%
White 14.0% 13.3% 10.3% 13.4% 13.2%
Black or African American 34.8% 32.0% 28.7% 29.7% 30.1%
Asian 16.8% 10.8% 10.6% 10.6% 9.5%
Hispanic or Latino 31.5% 29.2% 28.9% 27.5% 23.7%
Unbanked Households 13.3% 9.0% 7.6% 11.9% 7.0%
White 2.5% 1.9% 2.6% 3.7% 3.1%
Black or African American 21.8% 16.5% 13.7% 16.8% 18.2%
Asian 2.3% 2.6% 3.7% 3.9% 4.0%
Hispanic or Latino 21.9% 18.4% 20.2% 22.1% 16.2%
Underbanked Households 23.2% 20.6% 20.1% 24.6% 19.9%
White 13.5% 12.8% 13.8% 15.6% 15.6%
Black or African American 31.7% 29.3% 29.8% 30.3% 31.1%
Asian 15.9% 15.5% 16.7% 17.3% 21.0%
Hispanic or Latino 22.0% 23.4% 23.9% 23.5% 29.3%
HOUSEHOLD FINANCES CONTINUED
Measures Atlanta Fulton County Atlanta MSA Georgia United StatesLabor Force Participation Rate 65.0% 67.3% 67.2% 62.7% 63.5%
White 74.0% 69.8% 65.6% 61.3% 62.8%
Black or African American 57.7% 64.0% 68.4% 63.3% 62.1%
Asian 62.3% 67.4% 66.3% 65.1% 65.0%
Hispanic or Latino 71.6% 73.1% 72.5% 70.4% 67.2%
Unemployment Rate 7.3% 6.2% 5.4% 6.0% 5.8%
White 2.6% 3.3% 3.7% 4.5% 4.6%
Black or African American 12.7% 10.0% 8.2% 9.0% 10.1%
Asian - 3.5% 3.3% 3.4% 4.5%
Hispanic or Latino 6.1% 5.5% 4.2% 4.9% 6.7%
Businesses Without Paid Employees 78.5% 79.0% 82.9% 82.8% 80.4%
White 72.1% 73.0% 78.3% 78.8% 79.4%
Black or African American 95.6% 96.1% 96.7% 96.8% 95.8%
Asian 55.8% 63.7% 73.8% 70.2% 74.9%
Hispanic or Latino 88.9% 90.2% 93.3% 92.9% 91.3%
Business Value $1,922,292 $2,069,619 $1,124,465 $1,032,874 $1,213,944
White $658,264 $760,295 $557,612 $531,082 $508,406
Black or African American $58,085 $53,497 $39,826 $37,324 $58,119
Asian $706,090 $499,562 $343,246 $366,658 $364,717
Hispanic or Latino $475,877 $277,431 $125,443 $120,962 $143,271
EMPLOYMENT AND BUSINESS OWNERSHIP
HOUSING AND HOMEOWNERSHIPMeasures Atlanta Fulton County Atlanta MSA Georgia United States
Homeownership Rate 43.6% 51.7% 63.5% 63.3% 63.9%
White 57.1% 66.0% 75.4% 73.5% 71.5%
Black or African American 32.9% 38.7% 48.1% 47.3% 42.4%
Asian 37.6% 52.3% 63.9% 63.2% 57.9%
Hispanic or Latino 34.3% 32.4% 44.0% 44.3% 46.0%
Median Property Value $209,200 $241,300 $168,100 $148,100 $178,600
White $280,000 $320,000 $180,000 $150,000 $180,000
Black or African American $98,000 $113,000 $120,000 $100,000 $125,000
Asian $205,000 $300,000 $200,000 $200,000 $350,000
Hispanic or Latino $150,000 $180,000 $125,000 $120,000 $150,000

Advancing Collective Prosperity Through Entrepreneurship in Atlanta
For more information and data visit prosperitynow.org
PUBLISHED DECEMBER 201716
Measures Atlanta Fulton County Atlanta MSA Georgia United States
Cost Burdened Renters 52.0% 50.4% 52.0% 52.4% 51.8%
White 36.0% 36.9% 42.4% 44.4% 48.0%
Black or African American 60.4% 58.9% 56.4% 56.8% 59.4%
Asian 30.6% 25.6% 37.4% 36.8% 46.0%
Hispanic or Latino 50.9% 50.8% 57.5% 55.6% 58.1%
Cost Burdened Owners 34.0% 31.7% 31.2% 31.7% 32.5%
White 26.7% 24.9% 25.6% 26.1% 29.6%
Black or African American 42.0% 39.9% 36.6% 38.3% 42.5%
Asian 34.1% 23.3% 38.3% 38.1% 39.4%
Hispanic or Latino 47.6% 36.8% 39.9% 38.6% 43.7%
HOUSING AND HOMEOWNERSHIP CONTINUED
EDUCATIONAL ATTAINMENTMeasures Atlanta Fulton County Atlanta MSA Georgia United States
High School Degree or Higher 89.0% 90.9% 88.2% 85.4% 86.7%
White 98.2% 97.5% 92.0% 89.0% 91.7%
Black or African American 82.1% 86.9% 88.7% 84.2% 83.8%
Asian 97.0% 95.1% 86.5% 86.1% 86.0%
Hispanic or Latino 75.7% 66.7% 62.1% 59.2% 64.9%
Bachelor's Degree 25.5% 30.0% 22.1% 18.1% 18.5%
White 42.0% 42.3% 26.0% 20.5% 19.3%
Black or African American 14.2% 17.7% 17.5% 13.6% 12.3%
Asian 34.9% 35.9% 29.6% 28.9% 29.7%
Hispanic or Latino 19.5% 17.2% 10.8% 9.9% 9.7%
Graduate or Professional Degree 18.4% 19.1% 12.5% 10.6% 18.5%
White 31.3% 25.7% 14.3% 12.0% 20.6%
Black or African American 8.9% 10.1% 9.5% 7.7% 12.3%
Asian 43.0% 40.9% 24.3% 23.4% 29.7%
Hispanic or Latino 12.0% 9.5% 4.9% 4.6% 9.7%
Disconnected Youth 13.3% 12.4% 15.0% 16.6% 11.2%
White 3.6% 4.8% 12.3% 13.7% 12.5%
Black or African American 20.2% 20.2% 19.2% 21.9% 7.1%
Asian 1.0% 5.7% 7.9% 7.4% 21.7%
Hispanic or Latino 10.2% 8.9% 14.7% 16.0% 4.5%
4 The Atlanta-Sandy Springs-Roswell, GA metropolitan statistical area consists of Barrow, Bartow, Butts, Carroll, Cherokee, Clayton, Cobb, Coweta, Dawson, DeKalb, Douglas, Fayette, Forsyth, Fulton, Gwinnett, Hall, Haralson, Heard, Henry, Jasper, Lamar, Meriweather, Morgan, Newton, Paulding, Pickens, Pike, Rockdale, Spalding, and Walton Counties.

For more information and data visit prosperitynow.orgFor more information and data visit prosperitynow.org
PUBLISHED DECEMBER 2017
Advancing Collective Prosperity Through Entrepreneurship in Atlanta
17
17
DATA MEASURES & SOURCESData Measure Measure Description Source
Popu
lati
on
Dem
ogra
phic
s
Total Households Total number of householdsU.S. Census Bureau, 2011-2015 American Community Survey
Total Population Total populationU.S. Census Bureau, 2011-2015 American Community Survey
Population with Disability Percentage of population living with a disabilityU.S. Census Bureau, 2011-2015 American Community Survey
U.S. Citizenship Rate Percentage of population that are U.S. citizensU.S. Census Bureau, 2011-2015 American Community Survey
Speak English Less Than "Very Well"
Percentage of population that speaks English less than "very well"
U.S. Census Bureau, 2011-2015 American Community Survey
Ho
useh
old
Fin
ance
s
Median Household Income Median household income in the past 12 monthsU.S. Census Bureau, 2011-2015 American Community Survey
Income Poverty RatePercentage of all families with income in the past 12 months below the federal poverty threshold
U.S. Census Bureau, 2011-2015 American Community Survey
Asset Poverty RatePercentage of households without sufficient net worth to subsist at the poverty level for three months in the absence of income
Estimates calculated by Haveman Economics, based on U.S. Census Bureau's Survey of Income and Program Participation, 2014 Panel, Wave 1 (2013) and 2011-2015 American Community Survey
Liquid Asset Poverty RatePercentage of households without sufficient liquid assets to subsist at the poverty level for three months in the absence of income
Estimates calculated by Haveman Economics, based on U.S. Census Bureau's Survey of Income and Program Participation, 2014 Panel, Wave 1 (2013) and 2011-2015 American Community Survey
Households with Zero Net WorthPercentage of households with zero or negative net worth
Estimates calculated by Haveman Economics, based on U.S. Census Bureau's Survey of Income and Program Participation, 2014 Panel, Wave 1 (2013) and 2011-2015 American Community Survey
Unbanked HouseholdsPercentage of households with neither a checking nor savings account
Estimates calculated by Marin Economic Consulting, based on 2015 FDIC National Survey of Unbanked and Underbanked Households, and 2011-2015 American Community Survey.
Underbanked Households
Percentage of households that have a checking and/or savings account and have used at least one of the following alternative financial services from non-bank providers in the last 12 months: money orders, check cashing, remittances, payday loans, refund anticipation loans, rent to own services, pawn shop loans, and auto title loans
Estimates calculated by Marin Economic Consulting, based on 2015 FDIC National Survey of Unbanked and Underbanked Households, and 2011-2015 American Community Survey.
Em
ploy
men
t &
Bus
ines
s O
wne
rshi
p
Labor Force Participation RatePercentage of civilian labor force who are employed or unemployed but actively searching for employment
U.S. Census Bureau, 2011-2015 American Community Survey
Unemployment RatePercentage of civilian labor force who are unemployed but actively searching for employment
U.S. Census Bureau, 2016 American Community Survey
Businesses Without Paid Employees
Percentage of total businesses that do not employ paid workers
U.S. Census Bureau, 2012 Survey of Business Owners
Business Value Average sales or reciepts earned per firmU.S. Census Bureau, 2012 Survey of Business Owners
Advancing Collective Prosperity Through Entrepreneurship in Atlanta
For more information and data visit prosperitynow.org
PUBLISHED DECEMBER 201718
Ho
usin
g an
d H
om
eow
ners
hip
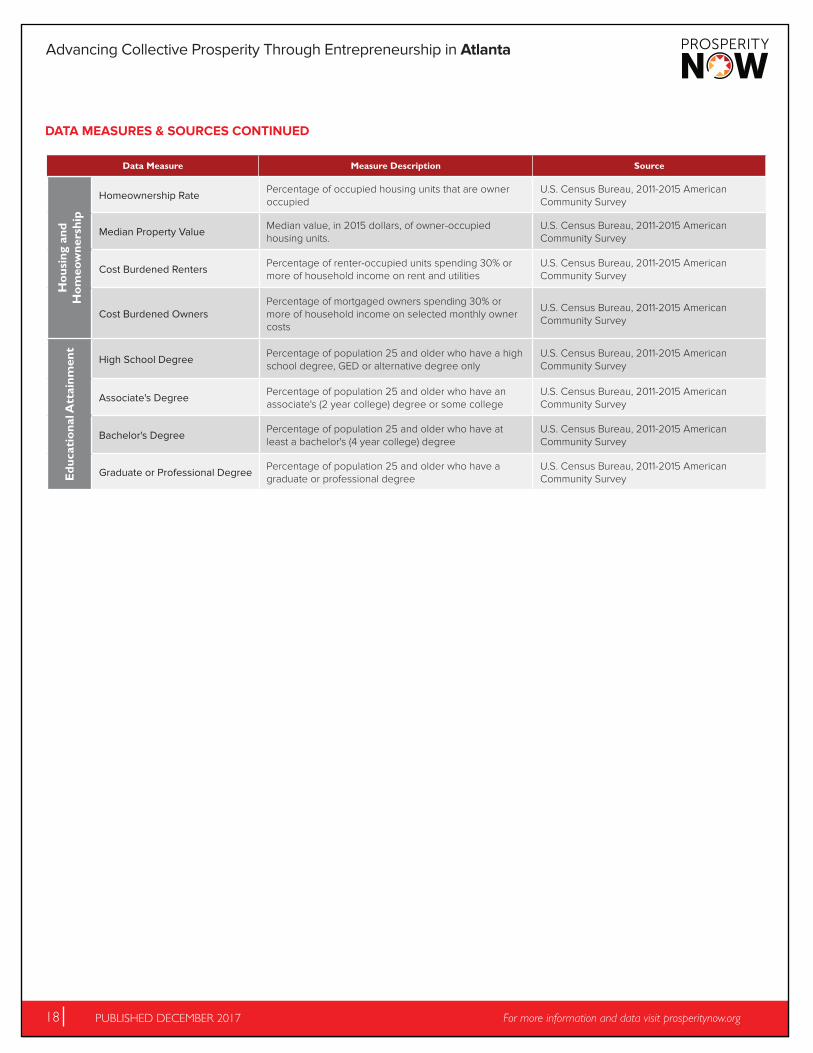
Homeownership Rate Percentage of occupied housing units that are owner occupied
U.S. Census Bureau, 2011-2015 American Community Survey
Median Property ValueMedian value, in 2015 dollars, of owner-occupied housing units.
U.S. Census Bureau, 2011-2015 American Community Survey
Cost Burdened Renters Percentage of renter-occupied units spending 30% or more of household income on rent and utilities
U.S. Census Bureau, 2011-2015 American Community Survey
Cost Burdened OwnersPercentage of mortgaged owners spending 30% or more of household income on selected monthly owner costs
U.S. Census Bureau, 2011-2015 American Community Survey
Edu
cati
ona
l Att
ainm
ent
High School Degree Percentage of population 25 and older who have a high school degree, GED or alternative degree only
U.S. Census Bureau, 2011-2015 American Community Survey
Associate's Degree Percentage of population 25 and older who have an associate's (2 year college) degree or some college
U.S. Census Bureau, 2011-2015 American Community Survey
Bachelor's DegreePercentage of population 25 and older who have at least a bachelor's (4 year college) degree
U.S. Census Bureau, 2011-2015 American Community Survey
Graduate or Professional Degree Percentage of population 25 and older who have a graduate or professional degree
U.S. Census Bureau, 2011-2015 American Community Survey
DATA MEASURES & SOURCES CONTINUED
Data Measure Measure Description Source

For more information and data visit prosperitynow.orgFor more information and data visit prosperitynow.org
PUBLISHED DECEMBER 2017
Advancing Collective Prosperity Through Entrepreneurship in Atlanta
19
19
APPENDIX C: MapsThe following maps were created by Prosperity Now using data collected by Invest Atlanta from the City of Atlanta Office of Revenue.
Total Businesses by Neighborhood

Advancing Collective Prosperity Through Entrepreneurship in Atlanta
For more information and data visit prosperitynow.org
PUBLISHED DECEMBER 201720
Businesses by Revenue

For more information and data visit prosperitynow.orgFor more information and data visit prosperitynow.org
PUBLISHED DECEMBER 2017
Advancing Collective Prosperity Through Entrepreneurship in Atlanta
21
21
Businesses by Number of Employees

Advancing Collective Prosperity Through Entrepreneurship in Atlanta
For more information and data visit prosperitynow.org
PUBLISHED DECEMBER 201722
Businesses by Industry (Standard Industrial Classification)
SIC Codes: 73: Business Services (including advertising, computer programming, consumer credit reporting agencies, etc.)87: Engineering, Accounting, Research, Management and Related Services58: Eating and Drinking Places72: Personal Services (including laundries, beauty and barber shops, funeral services, etc.)65: Real Estate56: Apparel and Accessory Stores59: Miscellaneous Retail (including drug stores, liquor stores, etc.)75: Automotive Repair, Services and Parking15: Building Construction General Contractors and Operative Builders50: Wholesale Trade – Durable Goods

For more information and data visit prosperitynow.orgFor more information and data visit prosperitynow.org
PUBLISHED DECEMBER 2017
Advancing Collective Prosperity Through Entrepreneurship in Atlanta
23
23
Acknowledgements
Prosperity Now thanks Janelle Williams, Senior Associate at the Annie E. Casey Foundation’s Atlanta Civic Site, and Tene Traylor, Fund Advisor at The Kendeda Fund, for their support. We also thank those we have interviewed and the following organizations for their work to shape this report.
n Access to Capital for Entrepreneurs
n Georgia Budget and Policy Institute
n Georgia Microenterprise Network
n Georgia Watch
n Invest Atlanta
n Metro Atlanta Chamber
n Office of Resilience, City of Atlanta
n Partnership for Southern Equity
@ProsperityNow prosperitynow.org

Advancing Collective Prosperity Through Entrepreneurship in Atlanta
For more information and data visit prosperitynow.org
PUBLISHED DECEMBER 201724
@ProsperityNow prosperitynow.org