ATINER's Conference Paper Series TEN2015-1873 · ATINER's Conference Paper Series TEN2015-1873...
18
Athens Institute for Education and Research ATINER ATINER's Conference Paper Series TEN2015-1873 Nabil Semaan Assistant Professor University of Balamand Lebanon Deterministic and Simulation Modeling of the Production of Ready Mix Concrete Batch Plant Industry in Nahr El Maout, Lebanon
Transcript of ATINER's Conference Paper Series TEN2015-1873 · ATINER's Conference Paper Series TEN2015-1873...

ATINER CONFERENCE PAPER SERIES No: LNG2014-1176
1
Athens Institute for Education and Research
ATINER
ATINER's Conference Paper Series
TEN2015-1873
Nabil Semaan
Assistant Professor
University of Balamand
Lebanon
Deterministic and Simulation Modeling of the
Production of Ready Mix Concrete Batch Plant
Industry in Nahr El Maout, Lebanon

ATINER CONFERENCE PAPER SERIES No: TEN2015-1873
2
An Introduction to
ATINER's Conference Paper Series
ATINER started to publish this conference papers series in 2012. It includes only the
papers submitted for publication after they were presented at one of the conferences
organized by our Institute every year. This paper has been peer reviewed by at least two
academic members of ATINER.
Dr. Gregory T. Papanikos
President
Athens Institute for Education and Research
This paper should be cited as follows:
Semaan, N. (2016). "Deterministic and Simulation Modeling of the
Production of Ready Mix Concrete Batch Plant Industry in Nahr El Maout,
Lebanon", Athens: ATINER'S Conference Paper Series, No: TEN2015-1873.
Athens Institute for Education and Research
8 Valaoritou Street, Kolonaki, 10671 Athens, Greece
Tel: + 30 210 3634210 Fax: + 30 210 3634209 Email: [email protected] URL:
www.atiner.gr
URL Conference Papers Series: www.atiner.gr/papers.htm
Printed in Athens, Greece by the Athens Institute for Education and Research. All rights
reserved. Reproduction is allowed for non-commercial purposes if the source is fully
acknowledged.
ISSN: 2241-2891
25/04/2016

ATINER CONFERENCE PAPER SERIES No: TEN2015-1873
3
Deterministic and Simulation Modeling of the Production of
Ready Mix Concrete Batch Plant Industry in Nahr El Maout,
Lebanon
Nabil Semaan
Abstract
The Ready Mix Concrete (RMC) batch plant is an industrialized plant,
where concrete is mixed from cement, coarse and fine aggregates, water and
admixtures. Then, it is delivered to the construction site using a transit truck
mixer. Calculating the productivity of RMC batch plants in the combined
operation of concrete mixing in the plant and the delivery to the site is a
complex task. RMC batch plants researchers or managers try to limit the
production evaluation to that of the mixer alone. This approach fails to look at
the batch plant production as a whole system, thus it fails to assess the bottle
necks, querying and idleness in each part of the plant system.
This paper analyzes the production of the RMC batch plant mixing and its
delivery to the site. The productivity is evaluated using two approaches: a
deterministic and a stochastic. The deterministic approach develops a general
production model and assesses a deterministic productivity. On the other hand,
a stochastic approach to productivity evaluation uses probabilistic activity
durations and assesses a probabilistic productivity. The simulation model is
based on the Monte Carlo simulation technique applied to MicroCyclone web-
based software. Both, the deterministic and stochastic models are applied to the
HOLCIM plant in Nahr El Maout, Lebanon.
The deterministic model found the batch plant production to be 63 m3/hr,
while the truck mixers vary between 6 and 36 m3/hr. depending on the truck
cycle time and the number of the trucks. The stochastic model simulated the
batch plant process with truck delivery to site for 30 iterations, and utilized
probabilistic activity durations. It was found that when a steady state is reached
it results to a productivity of 55 m3/hr. The simulation model identified that the
aggregates, cement and admixture transfer to the central mixer are 95% idle.
This research paper is relevant to both the academic field and the industry.
Keywords: Cycle Time, Deterministic Production, MicroCyclone, Monte
Carlo Simulation, Queue, Ready Mix Concrete, Stochastic Production.

ATINER CONFERENCE PAPER SERIES No: TEN2015-1873
4
Introduction
A concrete batch plant is a well-developed and industrialized plant, where
the concrete is combined before transferring it to the site using transit mixer
and ready to be placed (Utranazz, 2008). In the 1930s, the first Ready Mix
Concrete (RMC) factory was constructed but the industry was not used
frequently until the 1960s and then it expanded gradually (Feghali and El-
Imadi, 2011).
According to Alkoc and Erbatur (1997), the purpose of a production
system is to examine the interaction between operations, in order to determine
the idleness of resources, to locate the bottlenecks and to estimate the
production of the system.
The RMC batch plant managers always try to limit the production
evaluation by the mixer productivity solely. True a certain extent, this approach
fails to look at the batch plant production as a whole system. For instance, the
aggregates transfer from the bins to the mixer is not considered. Similarly the
cement transfer from the silo to the mixer is not considered as well. This
approach fails to evaluate the different systems (in a batch plant) production,
and points at the bottle necks, queuing and idle system in the plant.
The objective of this project is to determine the productivity of a concrete
batch plant using both deterministic and stochastic approaches. The
deterministic model is a general production model. In this model, the duration
and the factors affecting each activity are considered to be constant in order to
calculate the productivity. The stochastic approach is done using first a queuing
model, then a MicroCyclone model. Thus the following sub-objectives are
identified:
1. Develop a deterministic model of the production.
2. Evaluate the deterministic productivity.
3. Develop a production model using MicroCyclone.
4. Evaluate the MicroCyclone productivity.
5. Perform sensitivity analysis of the MicroCyclone model.
6. Analyze the results of the models.
Ready Mix Concrete Batch Plant
A ready mix concrete batch plant is a plant that is used to produce concrete
and transport it to the site using a transit mixer. Controlled by the usage of
computers where the constituents of concrete are measured accurately. Hence,
the main advantage of the ready mix concrete is to increase the quality of
concrete (Mark, 2010).
The combination of sand, Portland cement, aggregate and water forms the
concrete. The addition of small quantity of admixture may be used to decrease
the permeability of liquid, amplify the strength, change color, adjust concrete
viscosity, delay or increase the speed of the setting time, entrain the air, or

ATINER CONFERENCE PAPER SERIES No: TEN2015-1873
5
diminish the water requirements. The concrete batch plant combines Portland
cement, sand, aggregate and water together in order to get a ready mixed
concrete according to a certain mix.
The Ready mix concrete batch plant can be either a central or transit mix
type, or dry and wet type mix, or mobile and permanent type of plant, thus the
ready mix concrete batch plant can be divided into four categories (Atlantic,
2011a):
i) Dry mobile transit mix,
ii) Wet mobile central mix,
iii) Dry permanent transit mix,
iv) Wet permanent central mix.
The permanent batching plant, in general, contains silos, bins, concrete
batchers, conveyors, and control tools. Whereas the mobile batching plant
includes frameworks with batchers, conveyors, scales, organize supplies and
tiny silos that are transferred from one site to another. These supplies save
large amounts of money and time that improve the efficiency at the
construction site (Utranazz, 2008). Mobile concrete plants permit the
contractors to produce concrete at the construction site, hence reducing order
and transportation costs (Atlantic, 2011b).
On the other hand, the batch plant can has a transit (or truck) mix or
central mix. In a transit mix operation, the dry components (aggregates, cement
and admixture) are placed into a mixer truck, and then water is added
volumetrically in the truck mixer, hence the concrete mix is formed in the truck
mixer on the way to the construction site. Whereas, using a central mix
operation, the dry components of concrete (aggregates, cement and admixtures)
are mixed with water in a central batch plant mixer before pouring the mixed
wet concrete in the transit truck. The transit truck is used, in this case, for
transportation purposes only (Atlantic, 2011c).
Several researchers examined the production of concrete batch plants and
concreting operation in general. Wand and Anson (2000) gathered lot of
site/plant data for plants in Hong Kong, and performed a statistical analysis in
order to draw conclusions. Ying et al. (2005) used the data collected by Wang
and Anson (2000) and manipulated them in order to use them in a simulation
model.
Simulation of Concrete Batching Operations
Simulation is used in construction operation before the construction begins
to manipulate a model, which is a simplified representation of the real system,
in order to seek the unforeseen problems and optimize the system performance:
maximize production, and minimize the cost (Maria, 1997).
MicroCyclone is a simulation system developed by Halpin in 1973, and
published in his book in 1992 (Halpin, 1992), which can model and simulate an

ATINER CONFERENCE PAPER SERIES No: TEN2015-1873
6
operation where the duration of work tasks are randomly defined. The cyclone
method of modeling is based on the development of cyclical networks of
queues and activities (Alkoc and Erbatur, 1997). Halpin developed three
MicroCyclone modeling elements: the active state, idle state, and direction of
entity flow. One of the most important characteristics of MicroCyclone is the
sensitivity analysis technique. This feature allows the user to change the
number of resources and to know the productivity for a different number of
resources (Chung, 2009).
Several researchers have used MicroCyclone in the construction industry
and the concrete production specifically. For example, Alkoc and Erbatur
(1997) have developed a cyclone simulation model of the concrete casting
operation. However, they did not study the batch plant as an independent
system. Tang et al. (2005) have developed a simulation model based on
cyclone framework, but more advanced, entitled the Ready Mixed Concrete
SIMulation (RMCSIM). The RMCSIM simulates a whole day of activities for
a concrete plant with several mixing bays, several trucks with variable
capacities and serving several sites (with variable distances to plant). Their
model was limited to Hong Kong. Furthermore, it can be applied only in
academic circles since it requires complex mathematical background. Zayed et
al. (2005) developed a productivity and delays assessment model for concrete
plant–truck mixer operations using simulation with artificial Neural Networks
(ANN). Their work was limited to academics.
It is observed that while worldwide research is advanced in this topic, (1)
link to industry is still missing, (2) Lebanese academic research and industry is
way behind, and (3) current industry methods are based on common
engineering practices, prone to plan-as-you-go mis-management.
Ready Central Mix Concrete Batch Plant Process
Mixing concrete in a ready mix batch plant follows a specific process. The
central mix batch plant process requires that all raw materials (sand, coarse
aggregate, cement, water, and admixtures) are mixed in the central mixer prior
to delivery to transit trucks. Hence, the whole process consists of moving the
raw material from stock places to the mixer. Coarse and fine aggregates are
either stockpiled or stored in bins. The aggregates are transported to the central
mixer via conveyor belts. On the other hand, cement is stored in silos to keep it
away from moisture, and it is transported to the central mixer via either pipes
or a conveyor belt. Water is stored in tanks, and transported to the central
mixer via pipes. Finally, the admixtures are also stored in tanks, and
transported to the central mixer via pipes. Figure 1 illustrates the ready mix
concrete batch plant.

ATINER CONFERENCE PAPER SERIES No: TEN2015-1873
7
Figure 1. Ready Mix Concrete Batch Plant Process
GRAVEL TRUCK
AGGREGATE STORAGE
CONVEYOR BELT
AGGREGATE BIN
CEMENT SILOS
CEMENT BLOWER
CEMENT STORAGE
ADMIXTURE TANKS
ADMIXTURE STORAGE
WATER TANKS
WATER WELL
SCALE
CONCRETE MIXER
TRUCK MIXER
The central mixer role is important, since it mixes (according to ratios) all
the raw material in order to produce concrete. After mixing the concrete, the
central mixer unloads the concrete in a truck fleet that transport it to the
construction site.
Deterministic Production Model
Generic Deterministic Model
Production is defined as the output per unit of time. A deterministic
production for a concrete batch plant is equal to the volume of concrete
produced divided by the cycle time, as defined in Equation 1.
(1)
Where PBPi is the ideal batch plant productivity (m3/hr.)
VCM is the volume capacity of the central mixer (m3),
CTBP is the batch plant Cycle Time (hr.) it takes to:
i) Move the raw material to the central mixer,
ii) Mix in the central mixer
The batch plant cycle time (CTBP) defined in Equation 1 is evaluated using
Equation 2, as follows.

ATINER CONFERENCE PAPER SERIES No: TEN2015-1873
8
CTBP = CTgravel + CTsand + CTcement + CTwater + CTadmix + CTmix + CTunloading
(2)

ATINER CONFERENCE PAPER SERIES No: TEN2015-1873
9
Where CTBP is the batch plant cycle time (hr.),
CTgravel is the cycle time to move the gravel (coarse aggregate)
from bins to central mixer (hr.),
CTsand is the cycle time to move the sand (fine aggregate) from bins
to central mixer (hr.),
CTcement is the cycle time to move the cement from silo to the central
mixer (hr.),
CTwater is the cycle time to move the water from tank to central
mixer (hr.),
CTadmix is the cycle time to move the admixtures from tanks to
central mixer (hr.),
CTmix is the cycle time to mix the raw material in the central mixer
(hr.),
CTunloading is the cycle time to unload the concrete from the central
mixer in the transit trucks (hr.).
The ideal batch plant productivity, as defined in Equation 1, is affected by
many factors that reduce it. Hence, the actual batch plant productivity is
defined in Equation 3.
(3)
Where PBPi is the ideal batch plant productivity (m3/hr.),
PBPa is the actual batch plant productivity (m3/hr.),
fi are reduction factors, j = 1 to n, n = total number of reduction
factors.
Now, the actual transit truck productivity is defined in Equation (4)
(4)
Where PTRa is the actual transit truck productivity (m3/hr.)
VTR is the volume capacity of the transit truck (m3),
CTTR is the transit truck Cycle Time (hr.) it takes to:
iii) Load from the central mixer,
iv) Travel from batch plant to construction site,
v) Manoeuver and wait to unload in the construction site,
vi) Unload in the construction site,
vii) Travel back empty to the batch plant.
The transit truck cycle time (CTTR) defined in Equation 4 is evaluated
using Equation 5, as follows.
CTTR = CTload + CTtravel full + CTwait + CTunload + CTtravel empty
(5)
Where CTTR is the transit truck cycle time (hr.),
CTload is the cycle time to load concrete in the truck (hr),

ATINER CONFERENCE PAPER SERIES No: TEN2015-1873
10
CTtravel full is the cycle time to travel (full) to the construction site
(hr.),
CTwait is the cycle time to manoeuver and wait to unload in the site
(hr.),
CTunload is the cycle time to unload concrete in the site (hr.),
CTtravel empty is the cycle time to travel back empty to the batch plant
(hr.),
Now, the whole process productivity is governed by the lease one. Thus, if
the batch plant is less productive, truck have to wait in queue in order to be
loaded. On the other hand, if the trucks are less productive (long cycle time, for
example), the batch plant is idle most of time, waiting for the truck to come
back. The optimum productivity of the whole system is reached when a
balance point of the productivity is planned for, i.e. have a balanced (optimum)
number of trucks in order to have the batch plant productivity equal (or very
close) to the trucks productivity. The Balance Point (B.P.) is defined in
Equation 6.
(6)
Where B.P. is the Balance Point or the required number of transit trucks
in order to reach optimum productivity,
PBPa is the actual batch plant productivity,
PTRa is the actual transit truck productivity.
Nahr el Maout Holcim Plant Deterministic Productivity Evaluation
Holcim is a renowned European cement and concrete production industry;
it has several concrete batch plants in Lebanon serving the construction
industry. Nahr el Maout batch plant is localized near the Lebanese capital,
Beirut, and serves the surroundings. Nahr el Maout batch plant consists of the
following:
Aggregates (gravel and sand) bins: 3 bins, 45 m3 capacity each; and 2
bins 48m3 capacity each.
Cement silos: 3 silos, 67 m3 capacity each.
Water tank: 4 tanks, 260 m3 capacity.
Admixtures tanks: 6 tanks, 3 m3 capacity each.
Central mixer: 1 mixer, 2 m3 theoretical capacity.
Nahr el Maout uses a fleet of trucks, and each truck has a capacity of 9 m3.
Table 1 shows the actual schedule of concrete production for two cycles.

ATINER CONFERENCE PAPER SERIES No: TEN2015-1873
11
Table 1. Actual Batch Plant Schedule
Task Cycle
No.
Task Starts
at Time
[sec]
Task
Duration
[sec]
Task Ends at
Time
[sec]
Cycle
Time
[sec]
Batching
Aggregates 1 0 19 19
Discharge
Aggregates 1 19 34 53
Batching Cement 1 0 32 32
Discharge Cement 1 47 8 55
Batching Water 1 10 21 31
Discharge Water 1 40 14 54
Batching Admixture 1 0 41 41
Discharge
Admixture 1 41 14 55
Mixing Concrete 1 55 30 85
Discharge Mixer 1 85 34 119 119
Batching
Aggregates 2 76 20 96
Discharge
Aggregates 2 102 36 138
Batching Cement 2 55 32 87
Discharge Cement 2 125 8 133
Batching Water 2 85 21 106
Discharge Water 2 120 14 134
Batching Admixture 2 55 41 96
Discharge
Admixture 2 120 14 134
Mixing Concrete 2 138 33 171
Discharge Mixer 2 171 34 205 86
Applying Equations 1 to 4, and using batch plant cycle time duration of 86
sec (from Table 1), with variable truck cycle time, Table 2 show the results of
the deterministic productivity calculation, with the Balance Points (BP).
Table 2. Deterministic Batch Plant/Trucks Systems Productivity Results
CTTR
[min] PTRa
[m3/hr.]
PBPa
[m3/hr.]
BP Required No.
of Trucks
15 36 63 1.75 2
20 27 63 2.33 3
30 18 63 3.5 4
45 12 63 5.25 6
60 9 63 7 7
90 6 63 10.5 11
120 4.5 63 14 14

ATINER CONFERENCE PAPER SERIES No: TEN2015-1873
12
Figure 2 illustrates deterministic productivity curves for the Nahr el Maout
production.
Figure 2. Batch Plant Productivity Plot for Nahr el Maout
Both Table 1 and Figure 2 are a very important output of the deterministic
model. Plant manager can now read the plant productivity for a specific truck
number and truck cycle time. The manager, depending on the location of the
construction site can evaluate the truck cycle time, which is equal to the time to
load the truck mixer, travel full, unload at the site and return empty. When the
truck cycle time is evaluated, the manager can either decide on the number of
trucks for a certain plant production, or can regulate the plant production
depending on the fleet of trucks that is available.
The main drawback of this deterministic production evaluation is its lack
to incorporate the uncertainties in the production process. Only stochastic
modeling allow including uncertainties in the production evaluation.
Stochastic Simulation Production Model

ATINER CONFERENCE PAPER SERIES No: TEN2015-1873
13
The MicroCyclone model of the concrete batch plant production is
represented in Figure 3. The resources are the aggregates, the cement, the
admixture, the water, the aggregate bins, the cement silos, the admixture tanks,
the water tanks, the mixer, and the trucks. The process is divided into 3 cycles:
i) 1st cycle (feeding aggregate conveyor then feeding aggregate bins, blowing
cement in silos, pumping admixtures in tank, pumping water in tank), ii) 2nd
cycle (weighing and mixing aggregate, cement, admixture, and water in the
mixer), and iii) 3rd
cycle (loading the truck, truck travelling to site, unloading,
and returning empty).
Figure 3. MicroCyclone Model for the Concrete Batch Plant
Production
The power of simulation is that it can model the activities durations as
probabilities. MicroCyclone uses probabilities to represent the activity
durations. Several site visits were done, and different activity durations were
recorded. Then, histograms of the different activity durations are developed,
and the probability distribution function for each one is developed as well.
Triangular distribution is chosen since it represents best activity durations.
Table 3 shows the different activities probabilistic durations.

ATINER CONFERENCE PAPER SERIES No: TEN2015-1873
14

ATINER CONFERENCE PAPER SERIES No: TEN2015-1873
15
Table 3. Batch Plant MicroCyclone Model Activities Probabilistic Durations
Task SET Probabilistic Duration
[sec]
FEED AGGR BIN 1 Triangular (42, 53, 64)
BLOW CEM SILO 2 Triangular (32, 40, 48)
PUMP ADMX TANK 3 Triangular (38, 55, 72)
PUMP WATER TANK 4 Triangular (27, 35, 41)
MIX CONCR 5 Triangular (21, 30, 39)
FILL CONCR TRUCK 6 Triangular (20, 34, 55)
TRUCK TRAVEL 7 Triangular (900, 2700, 7200)
The MicroCyclone is run for 30 cycles (iterations). Table 4 shows the
productivity result.
Table 4. Productivity Simulation Results
Concrete Batch Plant Production
Productivity Information
Total Sim. Time Unit Cycle No. Productivity
[Per Time Unit]
98.5 30 0.3044
Referring to Table 4, the stochastic batch plant production (after 30 cycles)
is equal to (0.3045*3600) / 20 [m3/sec] = 54.81 m
3/hr., which is lower than the
63 m3/hr. that resulted from the deterministic productivity evaluation. Now,
looking at the different resources (queues) and their respective idleness, Table
5 shows the queues statistics.
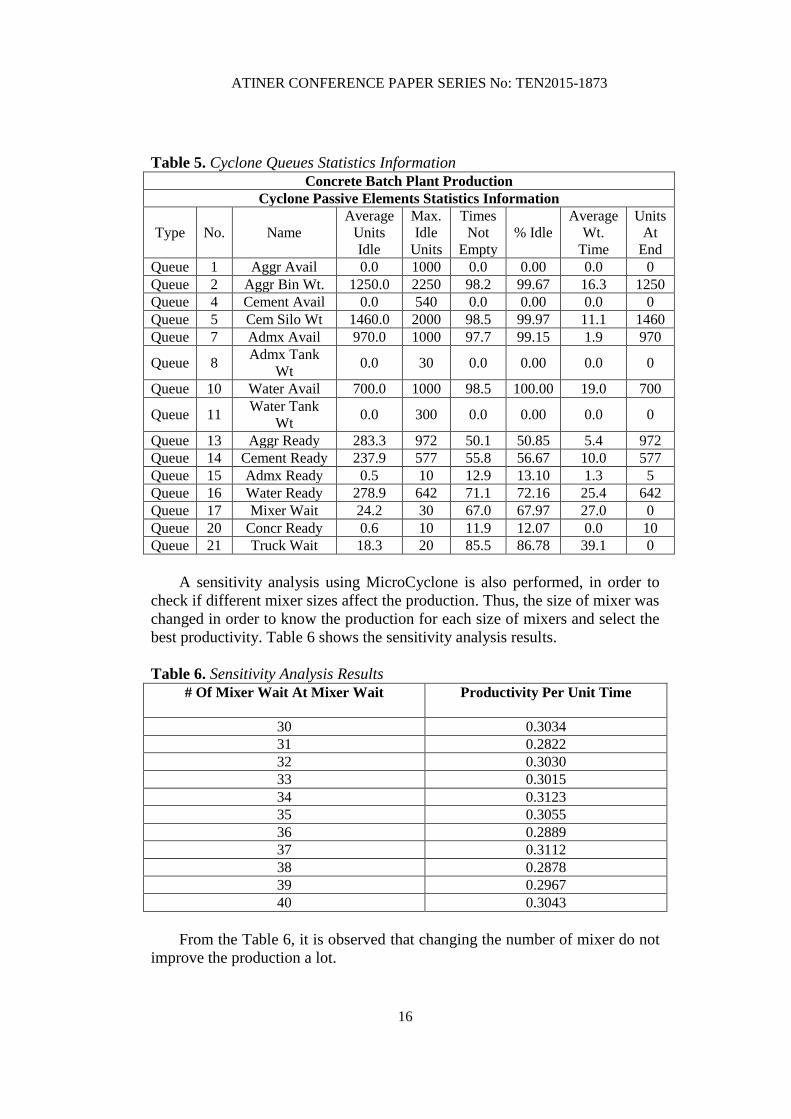
It is observed from Table 5 that the aggregates are idle for 51% of the time
which means 49% efficiency. For the cement, the idle time is 57% which
means 43% efficiency. For the admixtures, the percent of idleness is 13.1%.
This means that the admixtures are not idle most of the time. However, the
percent of idleness for water is 72% which is very large. The mixer is spending
67.97% of the time waiting. Therefore, the efficiency of the mixer is only about
32.3%. For the concrete ready, only 12% of the time is idle which means the
efficiency is about 88%. The trucks are most of the time idle (87%). For this
reason, it is better either to use a smaller fleet of trucks or use trucks with lower
capacity.
ATINER CONFERENCE PAPER SERIES No: TEN2015-1873
16
Table 5. Cyclone Queues Statistics Information
Concrete Batch Plant Production
Cyclone Passive Elements Statistics Information
Type No. Name
Average
Units
Idle
Max.
Idle
Units
Times
Not
Empty
% Idle
Average
Wt.
Time
Units
At
End
Queue 1 Aggr Avail 0.0 1000 0.0 0.00 0.0 0
Queue 2 Aggr Bin Wt. 1250.0 2250 98.2 99.67 16.3 1250
Queue 4 Cement Avail 0.0 540 0.0 0.00 0.0 0
Queue 5 Cem Silo Wt 1460.0 2000 98.5 99.97 11.1 1460
Queue 7 Admx Avail 970.0 1000 97.7 99.15 1.9 970
Queue 8 Admx Tank
Wt 0.0 30 0.0 0.00 0.0 0
Queue 10 Water Avail 700.0 1000 98.5 100.00 19.0 700
Queue 11 Water Tank
Wt 0.0 300 0.0 0.00 0.0 0
Queue 13 Aggr Ready 283.3 972 50.1 50.85 5.4 972
Queue 14 Cement Ready 237.9 577 55.8 56.67 10.0 577
Queue 15 Admx Ready 0.5 10 12.9 13.10 1.3 5
Queue 16 Water Ready 278.9 642 71.1 72.16 25.4 642
Queue 17 Mixer Wait 24.2 30 67.0 67.97 27.0 0
Queue 20 Concr Ready 0.6 10 11.9 12.07 0.0 10
Queue 21 Truck Wait 18.3 20 85.5 86.78 39.1 0
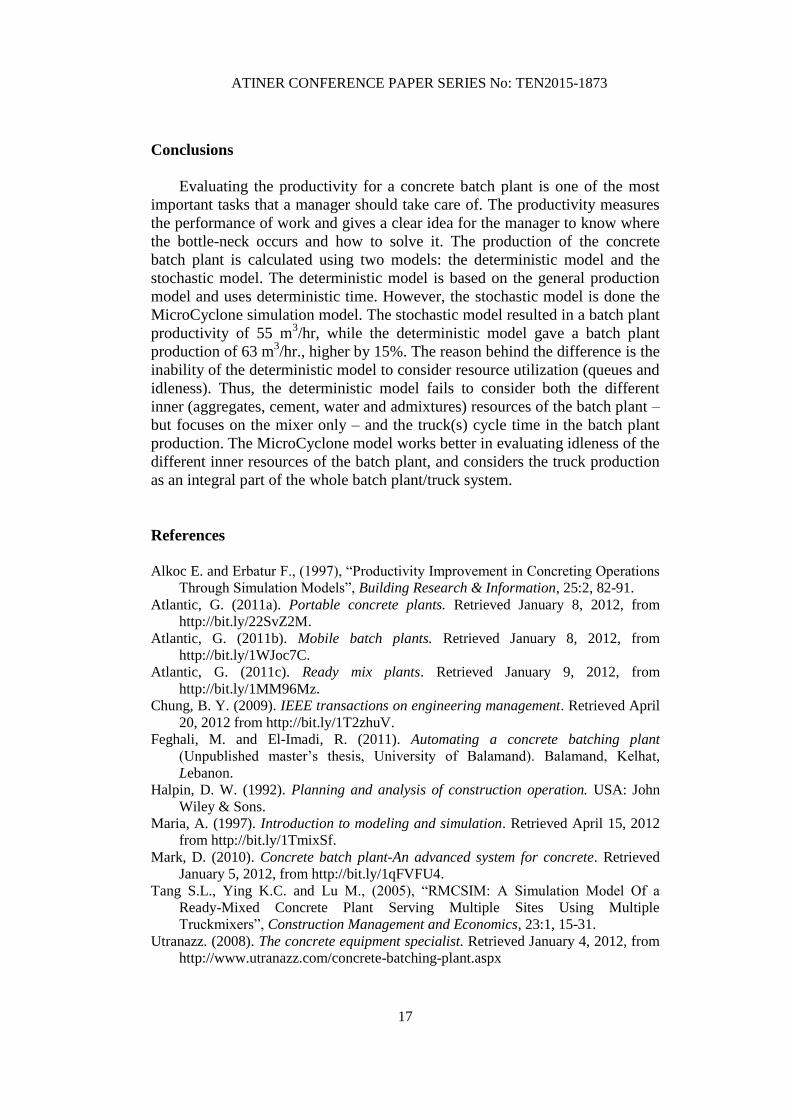
A sensitivity analysis using MicroCyclone is also performed, in order to
check if different mixer sizes affect the production. Thus, the size of mixer was
changed in order to know the production for each size of mixers and select the
best productivity. Table 6 shows the sensitivity analysis results.
Table 6. Sensitivity Analysis Results
# Of Mixer Wait At Mixer Wait Productivity Per Unit Time
30 0.3034
31 0.2822
32 0.3030
33 0.3015
34 0.3123
35 0.3055
36 0.2889
37 0.3112
38 0.2878
39 0.2967
40 0.3043
From the Table 6, it is observed that changing the number of mixer do not
improve the production a lot.
ATINER CONFERENCE PAPER SERIES No: TEN2015-1873
17
Conclusions
Evaluating the productivity for a concrete batch plant is one of the most
important tasks that a manager should take care of. The productivity measures
the performance of work and gives a clear idea for the manager to know where
the bottle-neck occurs and how to solve it. The production of the concrete
batch plant is calculated using two models: the deterministic model and the
stochastic model. The deterministic model is based on the general production
model and uses deterministic time. However, the stochastic model is done the
MicroCyclone simulation model. The stochastic model resulted in a batch plant
productivity of 55 m3/hr, while the deterministic model gave a batch plant
production of 63 m3/hr., higher by 15%. The reason behind the difference is the
inability of the deterministic model to consider resource utilization (queues and
idleness). Thus, the deterministic model fails to consider both the different
inner (aggregates, cement, water and admixtures) resources of the batch plant –
but focuses on the mixer only – and the truck(s) cycle time in the batch plant
production. The MicroCyclone model works better in evaluating idleness of the
different inner resources of the batch plant, and considers the truck production
as an integral part of the whole batch plant/truck system.
References
Alkoc E. and Erbatur F., (1997), “Productivity Improvement in Concreting Operations
Through Simulation Models”, Building Research & Information, 25:2, 82-91.
Atlantic, G. (2011a). Portable concrete plants. Retrieved January 8, 2012, from
http://bit.ly/22SvZ2M.
Atlantic, G. (2011b). Mobile batch plants. Retrieved January 8, 2012, from
http://bit.ly/1WJoc7C.
Atlantic, G. (2011c). Ready mix plants. Retrieved January 9, 2012, from
http://bit.ly/1MM96Mz. Chung, B. Y. (2009). IEEE transactions on engineering management. Retrieved April
20, 2012 from http://bit.ly/1T2zhuV. Feghali, M. and El-Imadi, R. (2011). Automating a concrete batching plant
(Unpublished master’s thesis, University of Balamand). Balamand, Kelhat,
Lebanon.
Halpin, D. W. (1992). Planning and analysis of construction operation. USA: John
Wiley & Sons.
Maria, A. (1997). Introduction to modeling and simulation. Retrieved April 15, 2012
from http://bit.ly/1TmixSf.
Mark, D. (2010). Concrete batch plant-An advanced system for concrete. Retrieved
January 5, 2012, from http://bit.ly/1qFVFU4.
Tang S.L., Ying K.C. and Lu M., (2005), “RMCSIM: A Simulation Model Of a
Ready-Mixed Concrete Plant Serving Multiple Sites Using Multiple
Truckmixers”, Construction Management and Economics, 23:1, 15-31.
Utranazz. (2008). The concrete equipment specialist. Retrieved January 4, 2012, from
http://www.utranazz.com/concrete-batching-plant.aspx

ATINER CONFERENCE PAPER SERIES No: TEN2015-1873
18
Wang S. H. and Anson M., (2000) “Comparison of the Concreting Productivities in
hong Kong and Beijing and a Proposed Comparison Methodology”,
Construction Management and Economics, 18:3, 363-372.
Ying K. C., Tang S. L., Anson M. and Lu M., “An Experiment To Explore The
Potential Of Simulation for Improving Ready Mixed Concrete Delivery to
Construction Sites”, HKIE Transactions, 13:3, 6-13.
Zayed T., Halpin D. and Basha I., (2005), “Productivity and Delays Assessment for
Concrete Batch Plant-Truck Mixer Operations”, Construction Management and
Economics, 23:8, 839-850.