at GLWA’s High Purity Oxygen WRRF
41
Phosphorus Control at GLWA’s High Purity Oxygen WRRF Majid Khan, PhD., Director-Wastewater Operations Wendy Barrott, Manager-Research & Innovation Luther Blackburn, Manager-Wastewater Operations
Transcript of at GLWA’s High Purity Oxygen WRRF

Phosphorus Control
at GLWA’s High Purity
Oxygen WRRFMajid Khan, PhD., Director-Wastewater Operations
Wendy Barrott, Manager-Research & Innovation
Luther Blackburn, Manager-Wastewater Operations

Contents of Presentation
Overview of the GLWA WRRF
Phosphorus impact on environment
Phosphorus control
Current control at WRRF
Challenges
Search for optimization

Serves 35% of Michigan’s population
• ~3.5 million people in 77 communities
• over a 946 sq. miles of service area
Only one GLWA WRRF in system• Treatment Capacity: 1700 MGD primary
• 930 MGD secondary treatment
• 658 MGD average flow
Solids Disposal Requirements• Average day - 450 dry tons
• Peak day – 850 dry tons
GLWA WATER RESOURCE RECOVERY FACILITY

TO RIVER
TO RIVER
TO RIVER
During dry weather, all wastewater flows to the WRRF for complete treatment. As wet weather flows increase beyond the WRRF’s capacity, retention basins capture the 1st flush. If the capacity of these Combined Sewer Overflow (CSO) Retention Basins is exceeded, primary treated and disinfected CSO flow is sent to the river. During wet weather, when treatment or hydraulic capacity is exceeded, some untreated CSO flows are diverted to the river.
Annually, the WRRF treats enough wastewater to fill 375,000Olympic swimming pools and removes enough solids from the wastewater to fill all the box cars on a train over 30 miles long.
TO ROUGE RIVER
Treated CSO
9 Facilities
Untreated CSO
59 CSO Outfalls
1,698.5 MG
Yearly WRRF Totals
250,390 MG (treated)
165,000 Tons (solids removed)
COLLECTION SYSTEM
The GLWA collection system is a combined system. Sanitary Sewage (from homes, businesses and industries) and Storm runoff (from catch basins) flow through the same sewers.

WATER RESOURCE RECOVERY FACILITY OVERVIEW
FeCl3
SO2
FeCl3
SODIUM BI SULFITE
SODIUM HYPO CHLORITE
PRIMARY CLARIFIERS
AERATION TANKS
SECONDARY CLARIFIERSPUMP
STA 1
PUMP STA 2
BIOSOLIDS DRYER
FACILITY
1° SLUDGE PROCESSING
2° SLUDGE PROCESSING
DEWATERING PRESSES
DEWATERING CENTRIFUGES SLUDGE
INCINERATION
SLUDGE OFFLOADING
JUNCTION CHAMBERPROCESS
WATER
DRO
SLUDGE STORAGE
CHLORINE

Phosphorus
Impact on the Environment

Increasing population requires better phosphorus
management
“The phosphorus content of our land, following
generations of cultivation, has greatly diminished.
It needs replenishing. I cannot over-emphasize the
importance of phosphorus not only to agriculture
and soil conservation, but also the physical health
and economic security of the people of the nation.
Many of our soil deposits are deficient in
phosphorus, thus causing low yield and poor
quality of crops and pastures…."
- President Franklin D. Roosevelt, 1938

2012 Great Lakes Water Quality Agreement

Can we close the phosphorus cycle?
Critical for plant growth
Mined and shipped
Finite resource
Necessary for agricultural
Not evenly distributed globally
Geopolitical issue
A Valuable Resource
Excess phosphorus in waterways causes harmful algae blooms
– Runoff from agricultural fields
– Runoff from CAFOs
– Effluent WWTP.
– Failing septic systems
An Environmental Pollutant
Phosphorus can be captured and reused
Manage manure spreading
Increase capture in WWTP
Manage biosolids spreading
Recovery of phosphorus fertilizers from WWTP side streams and/or biosolids
Phosphorus Conservation

Sustaining Michigan’s Water Heritage
Vision Statement
Ecosystems Approach
A Sampling of the Goals
Protect and restore aquatic ecosystems
Ensure clean and safe waters
Invest in water infrastructure
Personal take away: Achieve a 40% reduction in the phosphorus loads to Western Lake Erie Basin by 2025
A Strategy for the Next Generation
October 2016

Phosphorus Control
At wastewater treatment facilities

Phosphorus Species

Objective: Convert Soluble P to Particulate P

Phosphorus Control in WWTP Effluents
Chemical precipitation is used to remove the inorganic forms of phosphate by the addition of a coagulant to wastewater
Calcium
Aluminum
Iron
Chemical phosphorus removal Biological phosphorus removal
Soluble and particulate phosphorus
Sewage treatment configuration applied to activated sludge systems for removal of phosphate
BPR is achievedBy growing PAOsIn anaerobic to aerobic conditions.

Typical Chemical Treatment Opportunities

Ferric Reaction with Phosphorus
The following illustrates a “stoichiometric reaction” of Fe+++ with P
FeCl3 + H3PO4 = FePO4 + 3HCl
1 mole of Fe reacts with 1 mole P
→5.2 mg ferric chloride per 1 mg P
→0.92 mg alkalinity per mg of ferric chloride

But the precipitation is not linear

Biological Phosphorus Removal
Uses Phosphorus Accumulating Organisms (PAOs) in an anaerobic – aerobic system
Under anaerobic conditions
Proliferation of PAOs occurs
PAOs assimilate fermentation products (acetate) into storage products (polyhydroxybutyrate – PHB) and concomitantly release stored polyphosphate as ortho phosphate
In the aerobic tank
PHB is oxidized and concomitantly phosphate is stored within the cell – luxury phosphorus uptake
Stoichiometrically about 10 grams of bCOD is needed for the removal of one gram of phosphate

Enhanced biological phosphorus removal (EBPR)
Anaerobic Aerobic
PO4
PO4
O2
Volatile Fatty Acids
Poly P Poly P
PHBPHB
From wastewater

Typical Biological Phosphorus Removal
Secondary
clarifier
Aerobic tankAnaerobic/
Fermentative tank
Primary
effluent
Return activated sludge (RAS)
Disinfection

In Real Life: Phosphorus Removal Factors
– Dose
– pH
– Phosphorus profile
– Mixing
– Contact time
– Aging
– Alkalinity
– Separation process
Chemical
‒ Anaerobic zone integrity
‒ Substrate availability
‒ Phosphorus vs. substrate limited
– Adequate Cations
‒ Aerobic zone
‒ Secondary phosphorus release
‒ Solids separation
Biological

Current Phosphorus Control
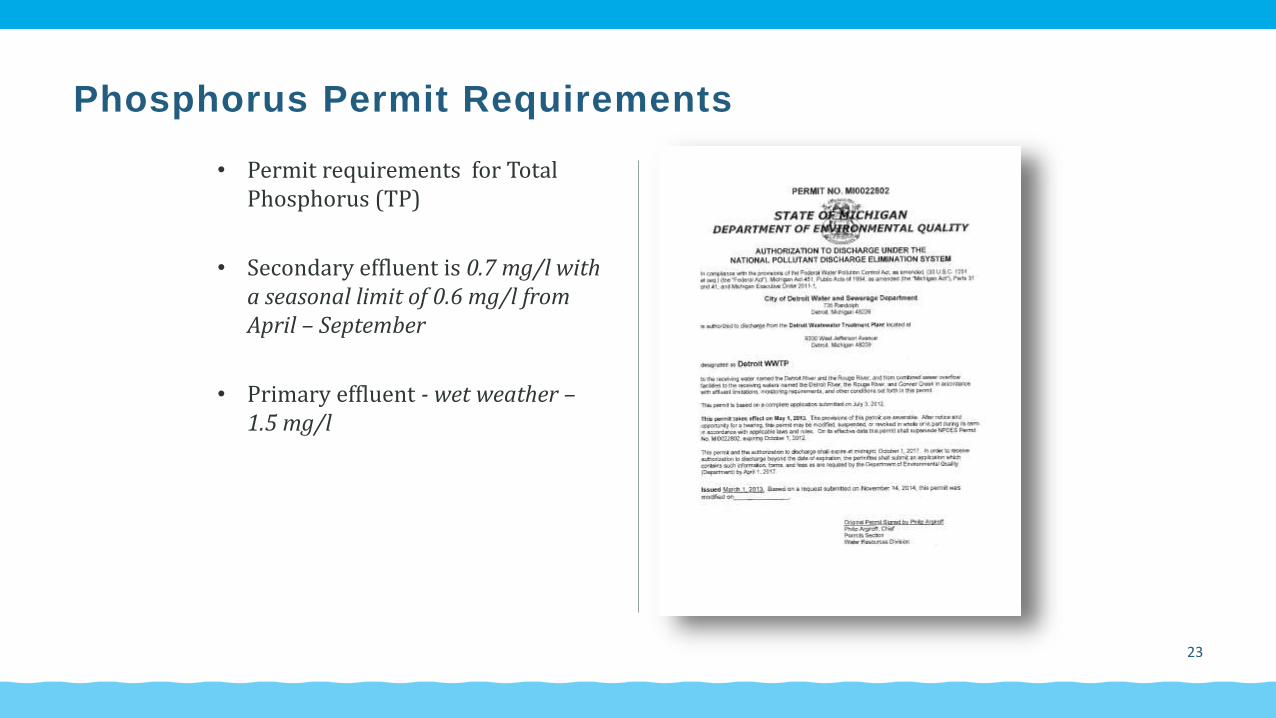
Phosphorus Permit Requirements
• Permit requirements for Total Phosphorus (TP)
• Secondary effluent is 0.7 mg/l with a seasonal limit of 0.6 mg/l from April – September
• Primary effluent - wet weather –1.5 mg/l
23

GLWA-WRRF Phosphorous Control Protocol
Maintain soluble phosphorous entering into aeration basins: 0.5 – 1.0 mg/l
Maintain D.O. in last stage of aeration basins: 2.0 - 4.0 mg/l
Maintain secondary clarifier’s hydraulic loading: 37 - 40 MGD
Maintain sludge blanket depth in secondary clarifiers: 2 – 3 ft
Maintain Sludge Retention Time (SRT) in gravity thickeners: <24 hrs
Keep sludge aerated in storage tanks before it is sent for dewatering
Dose Ferric Chloride: During dry weather @1.5 mg/l, wet weather 2.0 mg/l only if soluble phosphorous is above 1.0 mg/l entering into aeration basins
Outcomes: Phosphorus compliant, nutrient sufficient to prevent filamentous growth, prevent anaerobic activity in clarifiers for low effluent SS

Historical Phosphorus 1990-2017 YTD
0
0.2
0.4
0.6
0.8
1
1.2
mg/
l
Wastewater Treatment Plant Secondary Effluent Total Phosphorous Concentration
Pre-2015 NPDES Permit Limit 1.0 mg/l
January 2015 NPDES Permit Limit 0.7 mg/l
NPDES Permit Seasonal Limit 0.6 mg/l
Generally works well

However at Seasonal Low Flows
0
0.5
1
1.5
2
2.5
3
3.5
Sep-16 Oct-16 Nov-16 Dec-16 Jan-17 Feb-17 Mar-17 Apr-17 May-17 Jun-17 Jul-17 Aug-17 Sep-17
mg/
l
Wastewater Treatment Plant Total Phosphorus Concentration
Influent Effluent Permit monthly limit 0.7 mg/l Permit seasonal 6-month average limit 0.6 mg/l
Effluent TP bumps against seasonal limit

Continuing Challenge to Improve
Drivers for improvement
• Control chemical costs – always present!FerricPure Oxygen
• Multiple opinions that ferric was being overfed and multiple suggested changes to control scheme
• Desire to continue good phosphorus removal at low flows
• Desire to push for lower phosphorus effluent levels

However: Questions Needed to be Answered
Data suggested biological phosphorus removal was present
• Plant wasn’t designed for it and our control scheme did not account for it
• What conditions in bioreactors promoted Bio-P?
• Could Bio-P be maximized to reduce ferric feed?
Plant struggled to remove phosphorus during low flows < 500 MGD
• Why?
• Permit compliance becomes challenging in late summer

University-Utility Partnership
• Characterize the mechanisms of phosphorus removal, chemical and biological, with the goal optimizing performance and reducing costs for chemical additions
• Verify presence of bio-P organisms
• Characterize the profile of the phosphorus (total, colloidal, soluble) over time
• Measure kinetics in bioreactors
• Measure oxygen profile in all bio-reactors
• Update the process model to support further optimization efforts

Results to date
Preliminary

Grit
Landfill
Scum - Landfill
Primary Bio P
Rivers
To Sludge Thickening
To Sludge Thickening
Cl2 SO2
Landfill
Land application
Ash -Landfill
Conclusion: Plant definitely has Bio-P
Excellent Solids
Removal
Chemical- Ferric Chloride
Verified Plant is operating like this

WRRF Constituent Mass Loadings Generally
Independent of Influent Flow: Phosphorus
0
5,000
10,000
15,000
20,000
25,000
30,000
35,000
400 500 600 700 800 900 1000
Ph
osp
ho
rus
(lb
-P/d
ay)
Flow (mgd)
Relationship Between Plant Influent Flow and Phosphorus Loading
TP SP
Data 2013 - 2016

Flow, Mass Loading Relationship Leads to Correlation
of Flow and Concentration
0.0
0.5
1.0
1.5
2.0
2.5
400 600 800 1000 1200 1400 1600 1800
TSP
(m
g-P
/L)
Flow (mgd)
Influent TSP PEAS TSP
Jan – Mid-Sept, 2017

TSP Removal (mg-P/L) Varies with Flow Rate
Across Primaries
-0.4
-0.2
0.0
0.2
0.4
0.6
0.8
1.0
400 600 800 1000 1200 1400 1600 1800
Del
ta T
SP (
mg-
P/L
)
Flow (mgd)
Jan – Mid-Sept, 2017
Begin to loose SP removal @ ~ 550 MGD

And, Chemical Use Efficiency Varies with Flow
Rate Across Primary
-0.4
-0.2
0.0
0.2
0.4
0.6
0.8
400 600 800 1000 1200 1400 1600 1800
Del
ta T
SP/F
e (m
g-P
/mg-
Fe
Flow (mgd)
Jan – Mid-Sept, 2017
Decreasing Chemical efficiency
In general mixing is poor, but improves slightly between 650 and 500 MGD

Mixing Improvement Needed

TSP Removal by Biological Process Increases as Flow
Decreases Because More TSP Available
0
0.2
0.4
0.6
0.8
1
1.2
1.4
1.6
1.8
2
400 500 600 700 800 900 1000
TSP
(m
g-P
/L)
Flow (MGD)
SE PE
0.00
0.20
0.40
0.60
0.80
1.00
1.20
1.40
1.60
1.80
2.00
400 500 600 700 800 900 1000
Bio
logi
cal T
SP R
emo
val (
mg-
P/L
)Flow (MGD)
Bio-P Maximum Removal ~ 1.0
Data 2013 - 2016

New hypothesis for control
• Primary SP removal decreases with decreasing flow, and Bio-P increases –maxes capability out
• At much lower flow primary SP removal becomes very bad and Bio-P cannot remove more; phosphorus is higher in secondary effluent
• To address poor SP removal at very low flow – now adding ferric at the end of aeration decks (post aeration)

Installed FeCl3 Addition for Polishing

Plan to further lock in improvements
• Continue to refine control protocol for continued good phosphorus removal at low flow ---
• Add increased mixing to ferric addition points in PS 1 and PS2- need engineering
• Investigate two step ferric dosing as way to reduce ferric use after mixing upgrade
• Evaluate addition of ferric to side-streams
• Evaluate methods to increase Bio-P removal and reduce ferric addition
• Increase sensor and automated control for Ferric Chloride addition

QUESTIONS