Associations Involving Yield of Sugar Per Acre and Its ...
184
Louisiana State University LSU Digital Commons LSU Historical Dissertations and eses Graduate School 1970 Associations Involving Yield of Sugar Per Acre and Its Components in Sugarcane. Benjamin Leighton Legendre Louisiana State University and Agricultural & Mechanical College Follow this and additional works at: hps://digitalcommons.lsu.edu/gradschool_disstheses is Dissertation is brought to you for free and open access by the Graduate School at LSU Digital Commons. It has been accepted for inclusion in LSU Historical Dissertations and eses by an authorized administrator of LSU Digital Commons. For more information, please contact [email protected]. Recommended Citation Legendre, Benjamin Leighton, "Associations Involving Yield of Sugar Per Acre and Its Components in Sugarcane." (1970). LSU Historical Dissertations and eses. 1733. hps://digitalcommons.lsu.edu/gradschool_disstheses/1733
Transcript of Associations Involving Yield of Sugar Per Acre and Its ...
Louisiana State UniversityLSU Digital Commons
LSU Historical Dissertations and Theses Graduate School
1970
Associations Involving Yield of Sugar Per Acre andIts Components in Sugarcane.Benjamin Leighton LegendreLouisiana State University and Agricultural & Mechanical College
Follow this and additional works at: https://digitalcommons.lsu.edu/gradschool_disstheses
This Dissertation is brought to you for free and open access by the Graduate School at LSU Digital Commons. It has been accepted for inclusion inLSU Historical Dissertations and Theses by an authorized administrator of LSU Digital Commons. For more information, please [email protected].
Recommended CitationLegendre, Benjamin Leighton, "Associations Involving Yield of Sugar Per Acre and Its Components in Sugarcane." (1970). LSUHistorical Dissertations and Theses. 1733.https://digitalcommons.lsu.edu/gradschool_disstheses/1733
70 - 18,541
LEGENDRE, Benjamin Leighton, 1943-ASSOCIATIONS INVOLVING YIELD OF SUGAR PER ACRE AND ITS COMPONENTS IN SUGARCANE.
The Louisiana State University and Agriculturaland Mechanical College, Ph.D., 1970Agronomy
U n iv ersity M icrofilm s, Inc., A nn A rbor, M ich igan
THIS DISSERTATION HAS BEEN MICROFILMED EXACTLY AS RECEIVED
ASSOCIATIONS INVOLVING YIELD OF SUGAR PER ACRE AND ITS COMPONENTS IN SUGARCANE
A Dissertation
Submitted to the Graduate Faculty of the Louisiana State University and
Agricultural and Mechanical College in partial fulfillment of the
requirements for the degree of Doctor of Philosophy
inThe Department of Agronomy
byBenjamin Leighton Legendre
B.S., Louisiana State University, 1965 M.S., Louisiana State University, 1967
January 1970
ACKNOWLEDGMENTS
The writer wishes to express his sincere appreciation to Dr. M. T. Henderson, Professor of Agronomy, Louisiana State university, for his assistance in the planning and directing this study, for his help in interpreting the results, and for his suggestions in the preparation of this manuscript.
To Dr. W. H. Willis, Head, Department of Agronomy, for his counseling and interest throughout the duration of this study, the writer is sincerely grateful.
To Daniel p. viator, fellow graduate student, for his many hours spent in help collecting and recording of data and for his helpful comments in the preparation of this manuscript, the writer is most appreciative.
A special word of gratitude is extended to his wife,4
Nell, to his parents, Mr. and Mrs. Irving E. Legendre, Sr., and to L. S. McAnelly, for their encouragement and assistance, both financial and moral, throughout the course of the study.
To the many other people who helped make this study possible - D r . R. D. Breaux, Research Agronomist, U. S.Sugar Cane Field station, the late Dr. W. B. Townsend, Director, Computer Research Center, Louisiana State
ii

University, Mr. Harry webre, manager of Legendre and Web re, and to r-lr. Farl Schwa)), overseer for Legendre and Wobre - only to mention a few, the writer in much indebted.
Acknowledgment is due to the American Sugar Cane League of the U.S.A. for the moral and financial backing given to this study.
Special mention of gratitude must be made to the staff and personnel at the u. S. Sugar Cane PieId Station, Houma, Louisiana, for their encouragement and kind remarks concerning the completion of this manuscript.
ill
t a b u : o p c o n t e n t sPage
AC KNOY7LE DGMFNTS i iLIST OP T A B L E S ............................................ vLIST OF FIGURES..............................................viiA B S T R A C T ................................................... viiiINTRODUCTION ....................................... 1REV IF W OF LITERATURE . 4MATERIALS AND METHODS................ 28RESULTS........................................................ 77
Associations Between Yield of Sugar perAcre and Its components................................. 77Association Between Yield of Cane perAcre and Its Components................................ 104Association Between Yield of Sugar perTon of Cane and its c o m p o n e n t s .......................125Associations Among the Yield Components............. 140
SUMMARY....................................................... 160BIBLIOGRAPHY................................................ 165V I T A ..........................................................171
iv
LIST OF TABLESPage
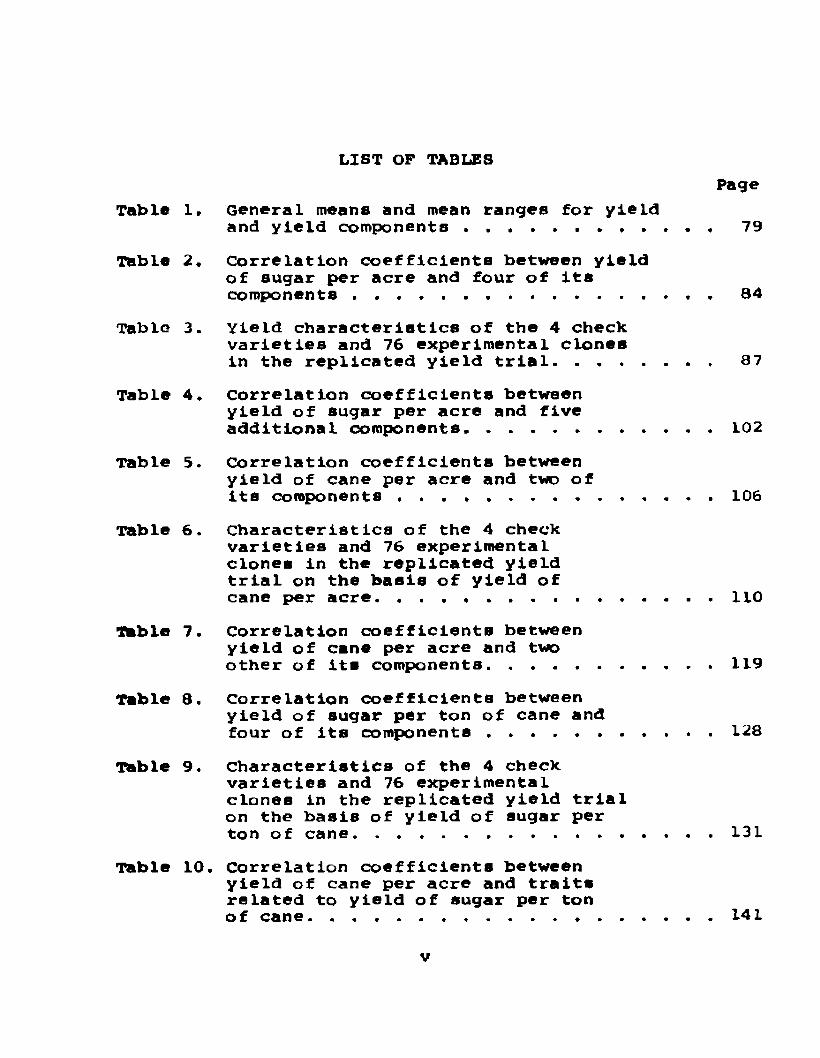
Table 1. General means and mean ranges for yieldand yield c o m p o n e n t s ......................... 79
Table 2. Correlation coefficients between yield of sugar per acre and four of its components . . . . . . . ..................... 84
Table 3. Yield characteristics of the 4 check varieties and 76 experimental clones in the replicated yield trial................... 87
Table 4. Correlation coefficients between yield of sugar per acre and fiveadditional components............................102
Table S. Correlation coefficients between yield of cane per acre and two ofits c o m p o n e n t s ..............................* . 106
Table 6. Characteristics of the 4 check varieties and 76 experimental clones in the replicated yield trial on the basis of yield ofcane per acre............................... 110
table 7. Correlation coefficients between yield of cane per acre and twoother of its components......................... 119
Table 8. Correlation coefficients betweenyield of sugar per ton of cane andfour of its components . 128
Table 9. Characteristics of the 4 check varieties and 76 experimental clones in the replicated yield trial on the basis of yield of sugar per ton of c a n e . .....................................131
Table 10. Correlation coefficients between yield of cane per acre and traits related to yield of sugar per tonof cane............................................141
v
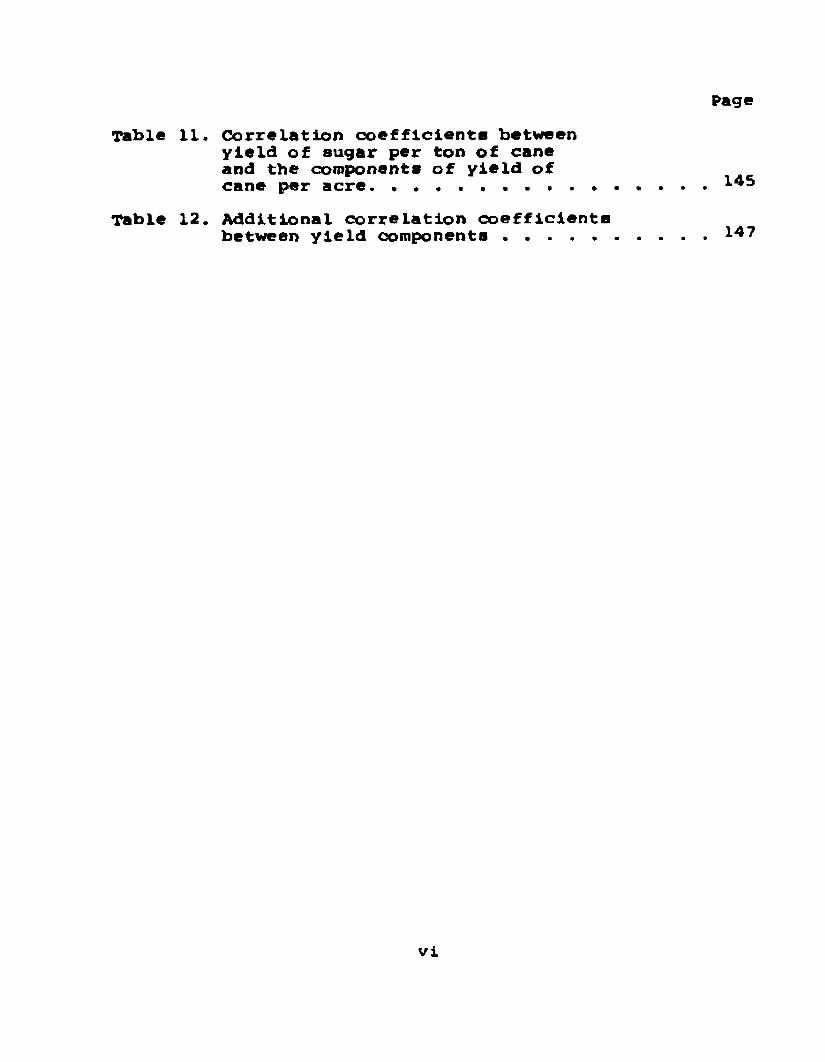
PageTable 11, Correlation coefficients between
yield of sugar per ton of cane and the components of yield of cane per acre. . . . ..............
Table 12. Additional correlation coefficients between yield components .........
vi
LIST OF FIGURES
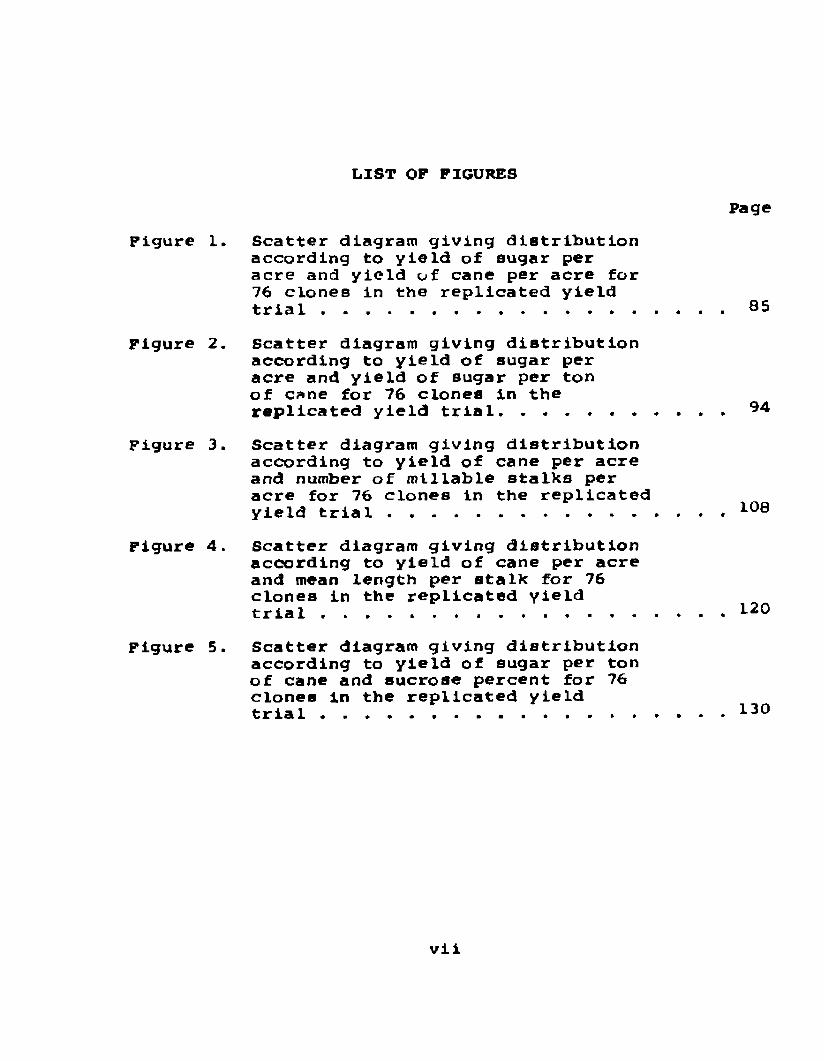
Figure 1.
Figure 2.
Figure 3.
Figure 4.
Figure 5.
PageScatter diagram giving distributionaccording to yield of sugar peracre and yield of cane per acre for76 clones in the replicated yieldt r i a l ............................................ 85Scatter diagram giving distribution according to yield of sugar per acre and yield of sugar per ton of cane for 76 clones in the replicated yield trial..............Scatter diagram giving distribution according to yield of cane per acre and number of mtllable stalks per acre for 76 clones in the replicated yield trial ..........................Scatter diagram giving distribution according to yield of cane per acre and mean length per stalk for 76 clones in the replicated trial ................................Scatter diagram giving distribution according to yield of sugar per ton of cane and sucrose percent for 76 clones in the replicated yield trial ................................
vi i
ABSTRACT
A study was conducted to determine the association between yield of sugar per acre and its components as well as associations among the components for 76 randomly chosen sugarcane clones (Saccharum sp.) derived from the cross C.P. 48-103 X C.P.33-224. The parental clones and two varieties, C.P.44-101 and C.P.52-68, were grown as checks.
Data were taken from a replicated yield trial representing one year only of the plant cane crop. The traits measured involved yield of sugar per acre, yield of cane per acre, yield of sugar per ton of cane, stalks per acre, mean weight per stalk, mean length per stalk, mean diameter per stalk, sucrose percent, brix, purity of juice, and percent fiber in cane. The data were used to calculate phenotypic and genotypic correlation coefficients.
Both yield of cane per acre and sugar per ton of cane were highly associated with yield of sugar per acre. Thus, rigid selection should be practiced for both components beginning as early as possible.
Moderate, positive associations were found between yield of cane per acre and three of its components: numberof stalks per acre, weight per stalk, and length per stalk.A significant, but low, association occurred with diameter
vlii
per sealk. It appeared that selection for high stalk population and tallness would prove most effective in obtaining clones with high yielding capacity.
Strong positive associations were found between sugar per ton of cane and both sucrose percent and brix. Thus, effective selection can be practiced early in a breeding program for high sugar per ton of cane by utilizing sucrose percent and/or brix.
Several important associations occurred between the yield components which would have significance in sugarcane breeding. One was a moderate negative association between number of millable stalks per acre and stalk diameter. Selection for exceptionally large stalk diameter vould tend to eliminate desirable clones with above average stalk population .
Both length per stalk and sucrose percent showed a low, positive association with fiber percent, which may cause serious problems unless clones are eliminated early in the breeding program on the basis of high fiber.
A moderate negative correlation was found between stalk diameter and percent fiber. Thus, the apparently desirable practice of retaining clones which are average or below in stalk diameter — comparable to C.P.52-68 — would tend to raise the fiber content of selected clones unless the clones are also screened to eliminate those unacceptably high in fiber.
ix
There was, as expected, a strong association between sucrose percent and brix which emphasizes the importance of selecting for high brix levels in material before sucrose percent can be measured, such as in the single stool stage.
Of special significance was the absence of negative associations between yield of cane per acre and sugar per ton of cane or sucrose percent. It appears that no serious complication exists to combining high cane yield with high sucrose content.
x

INTRODUCTION
It has become apparent that the development of new commercial varieties of sugarcane, Saccharum sp., which are superior to those varieties presently being grown, is becoming increasingly difficult. Methods of selection to cope with the probLem of obtaining high yielding varieties, both in the yield of sugar per ton of cane and the yield of cane per acre, must be developed so that the sugarcane breeder can make more effective selection.
In Louisiana the Industry is plagued by increasing cost of production, labor shortages, and restricted acreage on which to grow its crop. To help ease the situation in terms of the economic plight of our farmers, an alternative would be to develop even better varieties, which would tend to Increase the farmer's income per acre.
By development of new varieties, the farmer can better his economic situation in several ways. Probably the primary objective of any breeding program would be to release a variety of sugarcane which out yields any of the presently grown commercial varieties. This increased yield over what could be expected with the older varieltes would directly increase the income per acre with relatively little Increase in cost of producing the crop.
1
2For many years sugarcane breeders have taken for
granted that certain characteristics, particularly components of yield, when selected for early in the breeding program, would aid in the development of superior sugarcane varieties. However, this assumption has not been subjected to rigid scientific examination and may not be valid in all cases for one of two possible reasons. For one, selection at an early stage, particularly in single stools, may not be effective in obtaining clones and varieties which possess the desired trait due to low herltability. Another possible cause of failure in selection for a trait is that even though the trait may be a component of yield it may not be positively associated with high yielding ability due to its negative correlation with another yield component.
Several investigations have dealt with associations of various yield components of sugarcane in one or more phases of the breeding program but little work has been done with the association of yield components of unselected material from the single stool nurseries through the various unreplicated clonal plot stages or line trials and the replicated yield trials which are the final steps in the breeding program.
A four year study of the breeding behavior of yielding ability and associated characteristics in sugarcane was initiated by the writer in the fall of 1965 as a Graduate Research Assistant, Louisiana Agricultural Experiment

Station, Baton Rouge, Louisiana. The study dealt with the unselected progeny of one cross, C.P.48-103 X C.P.33-224.Hie principle objectives of the investigation were:
1. To determine in this cross the relative contribution of the various yield components to yielding ability.
2. To determine in this cross the nature and degree of association between the various yield components. Quantitative data were taken on a group of randomly
chosen segregates from the C.P.48-103 X C.P.33-224 crost in four stages which are characteristic of the breeding programs in Louisiana: single stools, 6-foot unreplicated clonalplots, 15-foot unreplicated clonal plots and a replicated yield trial consisting of 30-foot plots. The influence of the various yield components on yield of sugar and yield of cane and of components with one another were investigated through correlation coefficients.

REVIEW OF LITERATURE
Barber (7) in 1915 reported that in India there was an inverse relationship between purity of juice and plant vigor and also between sucrose percentage and plant vigor.He maintained that normally the least vigorous clones possessed the highest sucrose percent and purity. A year later Barber (8) found no definite correlation between diameter of stalk and sucrose percent but a small positive correlation between the length of the stalk and sucrose percent. Other correlations were calculated which showed little or no association between sucrose percent in the juice at maturity and leaf length and width, stalk length and -stalk diameter, total weight of a single stool, the number of stalks and shoots per stool, stalk module {length of stalk divided by its diameter), leaf module (length of the leaf divided by its width), and color. He also correlated leaf width and the diameter of stalk but found no association.
Venkatraman (57) in 1927 listed several difficulties in the study of inheritance of sugarcane which included:(a) special care needed to grow plants from seed; (b) the occurrence of great variations among seedlings of the same parents; and (c) the uncertainty in the matter of parentage
4

5of most batches. He concluded that a thorough knowledge of the mode of Inheritance and segregation of characters requires a continuous study of more than one generation.
McIntosh (41) in 1933 obtained a significant positive correlation of 0.541 for stool weight between single stools and their subsequent vegetatively propagated stage.He also found significant positive correlations for number of stalks per stool between the single stool stage and the first clonal stage. *nie percent sucrose was likewise correlated between these two stages of development. He concluded from his experiments that with suitable precautions exercised at selection in the first year, these features mentioned above are of value in selection within classes of single stools.
Craig (16) in 1934 reported that there was a total lack of correlation between the refractrmeter brix and the weight per stool. Hill (30), the following year, after studying 418 selections in first year growth from individual single stools and the plant cane crop of clones established from the single stools, arrived at the conclusion that the weight per stool was normally exaggerated in the initial growth of the single stool; the average weight per stool in the first clonal stage being less than 50?6 of that of the initial growth of the single stools. He proposed that a minimum weight limit might be set in the initial population of the single stools as selected clones seldom equal or
6exceed their initial vigor in the single stools. In 166 of the 418 single stools, he studied stalk number and found that stalk number also tended to be higher in the initial growth of the single stools than in the subsequent clonal plots. Results showed that total solids in the juice appeared to be maintained from the initial growth in single stools to the first clonal plots.
Hill found that the correlation between the initial growth of the single stool and the first clonal plots for mean weight per stalk was a positive 0.222; for mean total solids, the correlation coefficient was a positive 0.415; and for mean stalk number, the correlation coefficient was a positive 0.282. He also found a positive correlation coefficient of 0.671 between weight per stool and stalk number, on the basis of these results he felt that newly produced clones derived from single stools should be allowed to settle down for one or two seasons in order to allow exaggerated vigor to abate and to give undesirable traits a chance to appear before attempting to assess quantitative characters.
Mangelsdorf (39) reported that considerations in preliminary selection should be based chiefly on qualitative rather than on quantitative characters. important features which must be considered are strong stubbllng, rapid covering, effective weed control, a fair stalk size, a hard rind for the prevention of borer attack, self
7stripping, little pithiness, high sucross oontsnt, and disease resistance.
Venkatraman (58) reported in 1935 that a detailed inspection was not carried out with the original single stool material in India because it was found that ranking of clones in the first clonal plots did not agree with the ranking of the single stools.
In 1938 Bell (9) observed that the "feet of mill- able cane" was closely associated with stool weight. De Sornay (17) in Mauritius noted that the main criteria for assessing the value of a single stool derived from a seedling were weight, total solids as brix, freedom from arrowing, freedom from disease, and the habit and general appearance, in the breeding program in Mauritius an attempt was made to select single stools with a good weight but having other desirable characters as well. Diameter and length of stalkB were single stool characters associated with weight.A single stool having a high number of tillers of medium length was better than a single stool with few tillers of long length. Erectness was considered to be a desirable character but this habit of growth did not seem to be a character of high heritability. Single stools which were lodged were not discarded due to the lodged condition if the cane had other desirable traits. Selection in the second trials in Mauritius was conducted in the same manner as the first trials except for the fact that there were
8standards grown in among the experimental clones.
Inniss (32) in 1953, at the British West indies Central Sugar Cane Breeding Station, found that the best criteria for which selection could be practiced in the first year single stool stage were number of sound stalks, number of rotten stalks, percentage of arrowing, brix and weight per bundle. Stevenson (54) in Barbados concluded from results obtained from 114 field selections made in the 1952 crop that selection could be made on the basis of yield with a reasonable degree of certainty that some clones with high brix will be taken even though he found a low negative correlation coefficient of -0.213 between stool weight and brix.
In 1954 Warner (61) emphasized the point that the key to effective selection lies in the presence of ample genetic diversity in the seedling populations.
Breaux et aJL. (10) in 1956 reported significant positive correlation coefficients of 0.49 and 0.43 between brix of single stools and sucrose percent of 8-foot plant cane plots derived from the single stools in two series of crosses (1952 and 1951 Louisiana series, respectively). A significant positive correlation coefficient of 0.63 was found between initial stool brix and sucrose percent of the 1949 Canal Point series. it was concluded that selection in the individual stool stage for brix was effective to some degree in obtaining varieties with high sucrose content;
9however, caution must be observed in selection for brix in single stools as the association was not sufficiently high enough to warrant rigid selection.
Singh (49) in 1956 noted a significant positive correlation coefficient of 0.70 between percent fiber and bagasse of all seven crosses investigated at Louisiana State University. No relationship was found between fiber percent and stalk erectness. A low, but significant, positive correlation was found between fiber percent and number of stalks per stool in several of the crosses. Fiber percent was significantly and positively associated with sucrose content. Noting the fiber percent of the parental clones and the mean fiber percent of the progenies of each of the crosses, it was concluded that a parent high in fiber may be used in the breeding program as long as It is combined with a parent low in fiber percent.
Raghaven and Govindaswamay (47) in 1956 reported that sugarcane was not a favorable material for genetical studies. They found sugarcane to be a highly heterozygous polyploid complex with a large reserve of lethal genes. To study sugarcane, it was the practice to use correlation of data obtained by genetical procedure with observations made by cytologic techniques. This approach required a sound knowledge of statistical methods.
In 1956 Warner (62) listed several criteria for breeding for increased yield in sugarcane. lhese included
10
(a) techniques of breeding should ensure ample genetic diversity in seedling populations; (b) large populations are necessary to include the rare seedlings which are superior to established commercial varieties; (c) all stages of selection should be under conditions of plant-to-plant competition comparable to those in commercial fields; (d) seedlings should be tested over a range of environmental conditions; and (e) final yield trials should be free of bias and carefully interpreted with the aid of complete information.
Skinner (50) used correlation coefficients to analyze the results of his data taken from 2-sett plots established from selected single stools which were planted singly or in bunches. Characteristics studied included brix, stalk length, stalk diameter, condition of the top (expressed on a 1 - 7 scale with 1 representing extremely poor tops and 7 representing excellent tops), stalks per stool, grade in June, and grade in September. He also studied arrowing (expressed on a 0 - 6 scale with 0 indicating no flowers to 6 which indicated early flowering). There was a significant negative association of -0.323 between stooling and stalk diameter. The varieties with large stalk diameters tended to have poor stooling and profusely stooling varieties tended to be small in stalk diameter. By contrast, brix, stalk length, and the condition of the top were positively associated with one another. All three characters were
11closely correlated with the commercial grade. He concluded that this positive correlation between desirable characters simplifies the selection process. These correlations were not of sufficient magnitude so that selection for only one of these three characters would have assured that the other characters would have been improved automatically by a correlated response.
George (21) reported in 1959 that there was a positive association between mean weight per stool and mean stalk length of clones of five Saccharum crosses, as indicated by the highly significant positive correlation coefficient of 0.81. He also indicated that there might be an association between mean weight per stool and mean diameter but not nearly of the magnitude as mean weight per stool and stalk length. A high positive correlation was found between mean weight per stool and the number of tillers. No association was shown between mean stalk diameter and number of tillers.
Hebert and Henderson (27) studied several important agronomic characters in progenies of seven sugarcane crosses. The characters studied included stalk diameter, erectness of stalks, number of stalks per stool, brix by hand refractometer, and sucrose by polarization. They showed conclusively that selection in the original single stool nurseries was relatively ineffective for many characters for which selection had here-to-fbre been very vigorous. This was particularly true for erectness of stalks, number
12of stalks par stool, and to some extent, brix. A suggestion which was made after analyzing the data was that a more liberal selection must be undertaken in the original single stool nurseries and that more clonal plots should be established each year.
Results of their study indicated no association between the following pairs of characters: (1) Stalk diameter and erectness of stalks; (2) stalk diameter and number of stalks per stool; (3) Stalk diameter and brix; (4) Erectness of stalks and number of stalks per stool; (5) Erectness of stalks and brix; (6) Number of stalks per stool and brix; (7) Stalk diameter and sucrose percent; (8) Erectneas of stalk and sucrose percent; and (9) Number of stalks per stool and sucrose percent. There was found a significant negative correlation between number of stools per plot and the number of stalks per stool. Brix and sucrose percent were found to be highly correlated.
Hebert and Newton (28) , w r k i n g at the U. S. Sugar Cane Field Station, Houma, Louisiana, found a highly significant positive association between the number of stalks in first year single stools and the number of shoots in the spring after harvest. They also noted a significant positive correlation for number of stalks in first year single stools and first ratoon crop of the single stools.
in 1960 Skinner (51) showed that lodging resistance was not correlated with either vegetative yield or sugar
13content. Prom auch results, he concluded that there was promise that selecting for resistance to lodging would not Interfere with selecting high yielding, high sucrose varieties. He considered that resistance to lodging was genetically controlled and dependent partly on inherent capacity of lodging resistance of the variety and partly on environmental conditions.
loupe et aJL. (37) studied number of stalks, erectness of stalks, vigor, brix (as determined with a hand refractometer), and diameter of stalks in the initial growth of the single stools as well as in the first stubble crop of the single stools. The main emphasis in their study was to determine the effectiveness of selecting sugarcane varieties from either the initial growth of a single stool or from the first stubble crop of the single stool. An evaluation of the association of characters used as selection criteria indicated that number of stalks is a highly valid criterion for which selection could be practiced in the initial stage of growth of the single stools.All other characters studied were shown to have some value when selecting but to a lesser extent.
Breaux et a 1. (12) felt that it is becoming increasingly difficult to develop superior commercial varieties due to the fact that standards used for new varieties are being continuously upgraded. It was their feeling that to keep pace with the industry, a more efficient

14method of selecting the new varieties must be developed.It was also felt that a thorough understanding of the components or characters which make up yield must be obtained and any alterations in the selection program deemed necessary should be made as soon as possible.
Coleman et a l. (15) in 1963 reported using a breeding rating in the evaluation of sugarcane progenies at Meridian and Poplarville, Mississippi. Data were collected on stalk diameter, stalk number, plant height, juiciness and brix by refractometer from the first stubble crop of single stools established from five bi-parental sugarcane crosses. Height of the cane was an estimated value. Their procedure used in the determining of the rating consisted of multiplying the percentage of plants in each of the following categories together: (1) freeof mosaic; (2) survived one winter in the field; (3) stalk diameter greater than 28 mm; (4) more than three stalks;(5) iiiore than 47 inches tall (62 inches at Poplarville);(6) zero juiciness rating; and (7) brix greater than 21.00. It was felt by the authors that a rating system of this type should be useful in a sugarcane breeding program for evaluating progenies. Also, useful information might be gained as to the location Where each cross might be most useful if seedlings are to be evaluated at several locations .
Gangopadhyaya and Sarkar (20), working in India,
15conducted a study to determine the extent of association of yield with germination percentage, stalk height, circumference of Btnlk, .and maximum number of stalks. They reported a significant positive correlation between yield and stalk height which they felt verified the assumption that higher yields can be obtained by increasing stalk height while maintaining the remaining features at the same level. They also reported a significant positive correlation between yield and stalk number but found no correlation between yield and circumference of stalk or germination percentage.
George (22) in 1963 reported on a follow-up experiment to his work he published in 1959, dealing with the effects of the environment on components of yield in the initial growth of plant material from seedlings. He wanted to determine the effects of the environment on the initial plant growth characteristics and on the efficiency with Which selection could be practiced at this stage of growth. Characters studied included the number of stalks, the average length of stalks, the average diameter of stalks, the number of flowers per stool, grade (on a scale of 1 - 1 0 representing the selector's opinion of the plant), brlx, weight per plot, and weight per stool. Some of the more significant results reported indicated that there was a significant positive correlation between grade and the characters influencing volume or weight. Of special

16
interest were the associations of average weight per stool with mean length and number of stalks per stool. The correlation coefficient between mean length and mean weight per stool was a positive, highly significant 0.62? whereas, the correlation coefficient between mean weight per stool and number of stalks per stool was a significant 0.33.George concluded that, at any one site, mean length of stalk was a guide to the worth of families of seedlings while mean number of stalks provided a guide to which environment a particular family is best adapted.
Varma (56), in summarizing data from three experiments from India, reported that yield of cane was consistently found to be correlated with number of mi liable stalks and with stalk height. Also, in some circumstances, under certain treatments and years, yield was also associated with germination percentage, number of tillers per plant and plant weight.
In 1963, Yang, a_l. (64) in Taiwan also reported a high positive correlation between stalk length and yield of cane. They reported that there was a high negative association between number of millable stalks and stalk diameter. They found the heritability for stalk length to be 80.9%, for cane yield to be 75.8%, for number of millable stalks to be 55.5%, and for stalk diameter to be 25.1%.
Morri11-Olavarrieta (44) in 1964 studied the selection of sugarcane in single stools from the initial
17populations In the field at Louisiana State university.He reported significant positive correlation coefficients for average stalk diameter, vigor, erectness, and number of stalks per stool between the first year crop and the first stubble crop of single stools. He concluded that there can be no specific selection percentage in the initial selection and therefore minimum standards for selection should be lowered to allow the selection of more genetically variable types, certain traits, such as stalk diameter, degree of pithiness, and number of stalks per stool, should be kept in mind when making selections to prevent carrying over undesirable plant material into the clonal plots.
Ethirajan (16), in 1965, using a biometric analysis on quantitative characters of four crosses of sugarcane, reported that sugar yield is considerably influenced by stalk density and weight. He showed that there was a positive correlation between sugar yield and the individual components of yield and juice quality. Stalk specific gravity was singled out as the most significant genetically controlled factor determining yield. Khaphaga jet al. (34) reported a year later on some results obtained in Egypt where they measured stalk weight, stalk length, Btalk diameter, internode number, and brix of three varieties. They found that all these characters studied were correlated with stalk weight except brix.
13In 1966, Walker (59) noted that there are many
features of sugarcane which tend to be negatively correlated and that the release of any new variety may involve many compromises. Certain characters in sugarcane were correlated through linkage or by a single genetic control and if they were negatively associated, it would create serious problems. Certain characters behaved independently and could be selected for reliably if the environmental conditions were such as to assist in the expression of the character.
Anzalone et a_l. (2) in 1967 at the Louisiana Agricultural Experiment Station reported that the selection criteria used in individual single stool nurseries was based on three separate visual characters, namely, vigor or height of stalk, stalk diameter, and the absence of mosaic. Prior to 1959 several other criteria were used which were not still being used, namely, number of stalks per stool, erectness of stalks, absence of pith, and brix relative to a standard. It was felt that these characteristics were influenced excessively by the environment; therefore, effective selection would have been biased.
Breaux and Panguy (11) found no appreciable association between infection with mosaic and any of the agronomic characters studied in the single stool nurseries or 6-foot clonal plots. Hie stubble material of the single stools and the plant cane of the clonal plots were rated
19for stalk number, stalk diameter, stalk height, brix, and commercial grade.
Brown (13) correlated brix with fiber to see if selection for high brix clones would lead toward undesirable fiber levels in the clones. Random sampling of the 6-foot clonal plots showed that 40% of the clones were too high In fiber to be accepted commercially. When correlation coefficients were determined between brix and fiber, it was found that there was a small, nonsignificant genotypic correlation, a large significant, positive environmental correlation, and a small significant, positive phenotypic correlation.
Buzacott (14) reported that there seemed to be no direct correlation between erectness of stalks and fiber content; however, vdiere clones of long stalk length were concerned, it was likely that more resistance to lodging would come from those clones having higher fiber.
In 1967 George (23) assessed the effect of competition between sugarcane clones at the microplot stage.His results confirmed that when using microplots which are dissimilarly bordered, bias may be introduced; however, he felt that this situation was unavoidable but cautioned that selection should be liberal in order to obtain desirable genotypes.
Giamalva et al^ (24) noted that the quality of plant material grown from plants selected from the single stool

20versus bunches of L0 was approximately the same; however, the rate of selection from single stools was greater. They felt that minimum standards should be lowered in selection at the single stool stage with emphasis placed on stalk diameter, pithiness, and number of stalks per stool.
Hebert (26) evaluated 90 varieties from six replicated field tests for the 13 year period 1943 to 1955. Characteristics measured were stalk diameter, stalk weight, yield of cane per acre, sugar per ton of cane, and milling quality as indicated by the varietal correction factor. The closest association occurred between stalk diameter and stalk weight with a highly significant positive correlation coefficient of 0.524. The magnitude of this value suggested that other factors besides stalk diameter affect stalk weight. Hebert listed length of stalk, quality of fiber, pithiness, and sugar concentration of the juice as possible other factors affecting weight of stalks. Significant positive correlations were also found to exist between stalk diameter and milling quality and stalk weight and yield of cane per acre. All other correlation coefficients showed only a low degree of association with no evidence of any real association between sugar per ton of cane and yields of cane per acre. He concluded from this that it is possible to make selection for sugar content early in the selection program with the assurance that high tannage varieties will not be discarded as a consequence of the selection.

21Luna (38) studied the progenies of four crosses
for brix, stalk diameter, and number of stalks, several conclusions were drawn from his results which included:(1) the presence of a possible negative heterotlc effect, especially for stalk thickness and number of immature stalks; (2) the tendency of the median of the progeny of the crosses to approach the parent of lesser value; (3) if at least one of the parents used has a high value for some character, the chances of obtaining seedlings with a high value characteristic are increased; and (4) the presence in this particular case of correlation coefficients, consistent and negative, between brix and diameter, and consistent and positive between number of millable stalks and immature stalks.
Matherne ejt a_l. (40) reported that in the C. P. and L. nurseries, which consist of single-row plots of each variety, 15 to 40 feet long, subjective ratings were made on vigor, growth habit with reBpect to erectness and shading ability, diameter of stalks, solidness of stalks, and stubbling ability. Sucrose content was determined at different dates from 10-stalk samples. From the brix and sucrose data, sugar per ton of cane was calculated. For the first replicated experiments conducted at the Houma Station and Baton Rouge, Louisiana, selections were made according to available agronomic and pathological information. Each plot was weighed and a 20 to 25 stalk sample
22
was taken for sucrose analysis.In 1963 and again in 196/ Price (45, 46) summarized
the cytogenetic data on sugarcane. He reported that a major feature in the evolution of modern varieties was the crossing of S. officlnarum times S. spontaneum followed by recurrent bacXcrossing to S. officlnarum. It was found that in the original cross and first bacXcross that the female, S . officlnarum, transmits its somatic rather than its reduced number of rhromosomes to the progeny. While the chromosome number of S. spontaneum is first halved and then quartered, the somatic number of S. offlcinarum is transmitted in full.
Price further reported that the usual somatic chromosome complement in our modern varieties, especially those derived in Java, has approximately 1% of S. officlnarum1s genome plus 1/8 of S. spontameum's genome. Specific reference can be made to the chromosome number of P.O.J.2878. One would assume that in the breeding of such varieties, meiotic irregularities would be common with the loss of whole chromosomes; however, this is not the case with current varieties as the chromosome number has held at 2n * 100 - 125.
At Coimbatore, Rao (48) stated that selection in the first field nursery was based on vigor and tillering.The second selection was based on vigor, number of millable stalXs, girth of stalX, brix, and natural incidence of disease and pest resistance.
In Queensland, SXinner (52) reported that a grading
23system was used in which each variety was graded on a scale ranging from 1 - 2 0 (1 representing clones very poor and 20 representing clones excellent in all categories) in comparison with the standard commercial varieties which were graded 10. The grade represented the selector's opinion of the merit of the variety after considering all of its important characters.
Smith (53) in Jamaica reported that from the single stool nurseries, a single stalk of the more attractive plants was cut and examined for pithiness and toughness.If acceptable, the stool was brixed. Those single stools with a favorable combination of brix, vigor, and growth characteristics, relative to the standards were retained. Single stools were rejected due to a lack of vigor, a small diameter stalk, a low number of stalks per stool, and a variation in stalk size and age. Also single stools were rejected because of susceptibility to lodging, heavy or early arrowing, poor bud type, and susceptibility to the more important diseases.
Van Breeman et a_l. (55) working at Central Romana, Dominican Republic, stated that their first round selections are based on refractometer brix and a "growth rating", the latter determined by visual evaluation.
Walker (60) indicated that the best criteria to apply in the earlier single plants or small plot trials were those characters with constant or near-constant expression

24
from stage-to-staye. To examine what he felt was the best criteria to use in the initial selection/ he took the data for 26 years for the first two stages of selection and correlated the two. Data were recorded on number of stalks per stool, weight per stool or plot, and refractometer brix for the plant cane crops only of the single stools and the first year clonal plots. The correlation for brix was generally better than the correlation for weight. The correlations, as a whole, suggested that brix and stalk number can be predicted fairly closely; whereas, weight is a poor criterion for selection in the first of the selection stages.
In British Guiana, Watkins (63) considered the selection in the initial plant population to be the most crucial stage in the selection program. It was his feeling that all stalk and stool characteristics used as selection criteria are, more or less, affected by the environment as indicated by the low correlation coefficients obtained between the plant material harvested from the initial plant populations in single stools and the first clonal stage.
In Florida, Falgout jet a_l. (19) stated that the following criteria were used in initial selection of single stools: stalk size, solidness, stooling ability,growth characteristics, erectness, desirable top, self stripping of leaves, disease resistance, and freedom from

25cracks and protruding buds. Only one stalk was taken from each single stool to establish a 4-foot clonal plot. in the first clonal plot stage, selection of clones was based on the same criteria as in the single stool nurseries, plus these clones were brixed. The selections were replanted on 2-row, 15-foot plots at two locations, one on warm land and the other on extremely cold land. In addition to selection criteria mentioned, additional information was gathered as to cold tolerance and juice quality* The first small replicated test was established from the selected clones. information was taken on fiber percent, juice quality, and stubbling in the first stubble crop. A 4-replication yield trial was then replanted from selected material for evaluation of all characters mentioned above plus juice extraction, yield of cane per acre, sugar per ton, and sugar per acre.
In 1968 James and Falgout (33) investigated all possible phenotyp <orrelations among fiber percentage, number and diameter of stalk, brix by hand refractometer, and the number of shoots in the spring after harvest in the initial growth from seedlings of four sugarcane progenies. Highly significant correlation coefficients were found in all four progenies between fiber and brix.Fiber and diameter of stalks wt.e found to be negatively associated. Highly significant positive correlation coefficients were found between number of stalks and number of shoots in the spring after harvest. All other correlations

26
were of no practical importance.Correlation coefficients showed that 6 of the 10
possible characters combined represented undesirable associations but were of such low magnitude that little problem would be encountered in a breeding program except for the high positive association between brix and fiber. Frequency distributions for the characters studied in each of the progenies of the four crosses indicated that selection for any one character alone was not too difficult.
Legendre et a_l. (35) in 196Q reported that correlation coefficients obtained from two studies involving 74 experimental varieties indicated that stand counts in early April to early June provided a reliable evaluation of the abilities of a clone to produce mature stalks in October.
According to Anzalone and DiVitorrio (1) at the Louisiana Agricultural Experiment Station, the potential of a clone to produce high tonnage can be attributed to selection for the highly heritable characters of stalk height, stalk diameter, and an absence of mosaic. Again, it was stressed that a liberal selection rate at the single stool stage was essential due to the effects of the environment in completely or partially masking variations caused by genetic differences of individuals. Brix and sucrose determinations were not made until the 6- and 15-foot clonal plot stages because there were no dependable morphological characters correlated with high sucrose and brix

27determination in single stools was known to be questionable in reliability.
MATERIALS AND METHODS
The materials used in this study included an un- selected progeny of the bi-parental cross C.P.48-103 X C.P.33-224, the parental clones, and three commercial varieties, C.P.44-101, C,P.52-68, and C.P.55-30.
This cross was selected because of known differences in the parental clones in their basic yield components. Some of the important characteristics in which the parental clones differed were number of millable stalks per unit area of land, mean diameter of stalk, mean length of stalk, sucrose percent, and fiber percent in cane.
The plant material of the progeny was grown as individually spaced plants, designated single stools, derived from seed and as clonal plots of varying sizes derived from the individually spaced plants. A single 6- foot clonal plot, a single 15-foot clonal plot, and a three replication yield trial, with each plot being 30 feet in length, were grown of each clone. The tvo parents and three other check varieties included in the investigations already were clones at the beginning of the studies. The plant material of these checks was grown in the three clonal plot stages along with the progeny.
Prior to the beginning of the research done by the28

29writer, the cross had been made at the U. S. Sugar Cane Field Station, Canal Point, Florida, during the 1963 crossing season with the seed being sent to the u. S. Sugar Cane Field Station at Houma, Louisiana. The u. S. Sugar Cane Field Station at Houma will be hereafter referred to as the Houma Station. The seed, or "fuzz", were stored in a freezer for one year. In January of 1965 approximately 300 seedlings were established in flats in the greenhouse and were later transplanted singly to peat pots. There was no screening for sugarcane mosaic in the greenhouse due to the possibility of introducing bias into the study. The seedlings were transplanted individually into the field at the Houma Station in the spring with a 16-inch spacing between seedlings within rows. Individually spaced plants developing from these Beedlings were grown in 196 5 and 1966, the latter constituting the first stubble crop. The planting of seed, transplanting of seedlings, and the care of single plants at the Houma Station was done by Dr. R. D. Breaux.
The term "single stools" will hereafter be used to refer to the individual plants grown from separately spaced seedlings.
Single Stool StageThe writer began investigations of the material in
the fall of 1965. From the approximately 300 single stools
30
being grown in the first year at the Houma Station, 200 •ingle stools were selected for investigation. The 200 single stools selected were taken at random except for the restriction that each have a minimum of four stalks. Each of the 200 single stools selected was identified with a stake bearing an assigned selection number. The stake was placed beside the single stool in the field. There were no data taken from the single stools during the first year of growth - 1965.
Data obtained in the fall of 1966 on the first stubble crop of the single stools Included number of mill- able stalks per stool, mean stalk length, mean stalk diameter, mean weight per stalk, erectness of stalks, and plant vigor. Procedures followed in measuring each of the traits will be described later.
Six-foot Clonal PlotsA six-foot clonal plot for the collection of experi
mental data was established from each of the 200 single stools at Leighton Plantation, Thibodaux, Louisiana, on September 25, 1965. In planting each 6-foot experimentalclonal plot, two stalks from a single stool were planted side-by-side in the planting furrow. Any stalks extending beyond 5*$ feet within the plot were cut to a length of 5*s feet, with the excess seed cane removed from the planting furrow and discarded. In a few cases two stalks did not

31provide enough cane to plant feet of row. in these cases additional stalks from the single stools were used to equalize the length of all clonal plots. Excess planting material was handled in the same way as described above. Pour replications of each check variety in the form of 6-foot plots were grown along with the 200 experimental clones. The four replications of the five check varieties were planted in the form of four blocks scattered among the plots of the experimental clones.
Seed cane of C.P.33-224 had to be sent from Canal Point, Florida. Due to extensive treatment for the prevention of the Introduction of new pathogens to the Louisiana sugarcane industry, the cane was in a poor physical condition. The cane was planted along with the experimental clones and other checks but failed to germinate in the spring of 1966. In order to have plant material of C.P. 33-224, several stalks of this variety were obtained from Dr. E. Paleatseas, Louisiana Agricultural Experiment Station, Baton Rouge, Louisiana. These stalks were cut into separate nodal pieces, normally referred to as single eye pieces.These single eye pieces were then pre-germinated in flats and later transplanted to peat pots. On April 11, 1966, four plants were transplanted to each of the four plots already reserved for this parent.
Data obtained in the fall of 1966 in the plant cane crop of each of the 6-foot experimental clones and checks

32Included number of millable stalks per plot, mean stalk length, mean stalk diameter, mean weight per stalk, erect- ness of stalks, laboratory brix, sucrose percent, purity, and percent bagasse in cane, once the samples were obtained and data recorded, the remainder of the cane on the plots was harvested by the plantation equipment.
In the spring and summer of 1967 shoot counts, or stand counts, were made on each plot of the experimental clones and checks in the first stubble crop on two dates, in May of 196 7 records were taken on the apparent percentage of mosaic infection in all of the plots. in the fall of 196 7 records were taken for the number of millable stalks in each plot. No further records beyond the first stubble crop were made on the 6-foot plots.
Fifteen-foot Clonal Plotsin the fall of 1965, in addition to planting the
experimental 6-foot clonal plots described previously, a second small clonal plot was planted at Leighton Plantation of each of the 200 single stools selected at the Houma Station. The purpose of these plots was to provide an increase for planting the experimental clones in 1966, and consequently no data were obtained from these plots.
On September 24 and 25 of 1966, a 15-foot experimental clonal plot was established of each of the 200 clones in the study from stalks obtained from the increase plots
33described in the previous paragraph. Three replications of each check variety in the form of 15-foot clonal plots were grown along with the 200 experimental clonal plots.They were planted in the form of blocks scattered among the plots of the experimental clones.
The planting rate was essentially the same as in the 6-foot clonal plots except that there were 14*s linear feet of stalk planted within each plot. Several stalks were required to plant each of the plots, with the planting rate being the usual two stalks and one foot overlap.
in the spring and summer of 1967 shoot or stand counts were made in the 15-foot clonal plots on three dates. Each clone was examined for mosaic in June, 196 7, with the number of stools infected with mosaic being recorded .
Data were taken in the fall of 1967 on each of the 15-foot experimental clones and checks for number of mill- able stalks per plot, mean stalk length, mean stalk diameter, mean weight per stalk, erectness of stalks, laboratory brix, sucrose percent, purity, bagasse percent in cane, fiber percent in cane, and the yield of 96 pol sugar per ton of cane, which is usually designated as sugar per ton. once the samples were obtained and data recorded, the remainder of the cane on the plots was harvested by the plantation equipment.
in the spring of 1968 shoot or stand counts were
34made for each plot of the experimental clones and checks in the first stubble crop at two week intervals, starting March 26 and ending July 1. In the fall of 1968 the number of millable stalks was counted for each plot. No further records beyond the first stubble crop were made on the 15-foot plots.
Thirty-foot Clonal Plots in the Replicated Yield TrialIn September of 1966, the 200 experimental clones
and checks were also replanted to increase plots in order to provide increase for a replicated yield trial.
In the fall of 1967 a replicated yield trial was established at Leighton plantation of 77 of the 200 experimental clones plus four of the check varieties - C.P.48-103, C.P.33-224, C.P.52-68, and C.P.44-101. The material for planting the yield trial was obtained from the increase plots referred to in the previous paragraph. Each plot in the yield trial was one row wide and 30 feet in length, with the experiment being planted in a 9 x 9 triple lattice design. There were three replications of each experimental clone and check.
The 77 experimental clones included in the yield trial were taken at random from the 200 in 6- and 15-foot clonal plots, except for the restrictions imposed by mosaic infection. All increase material was rogued for mosaic infection three times during the spring and summer of 1967,

35
with all stools showing symptoms of mosaic being discarded by digging out the entire infected stool. Records were kept as to the percentage of mosaic in each clone.
An analysis was made of all 200 experimental clones in the summer of 1967 as to their apparent susceptibility or resistance to mosaic. The data on mosaic infection which had been collected from the stubble crop of the 6-foot experimental clonal plots and the plant cane crop of the 15-foot experimental clonal plots as well as the increase material were all taken into account in assessing what clones should be included in the yield trial. Only 77 experimental clones were found to exhibit a sufficient degree of mosaic resistance to be considered for the yield trial. With thefour check varieties added to bring the total to SI entries,the 9 x 9 lattice design could then be used.
In the spring of 1968 shoot or stand counts weremade for all 81 entries in all three replications at two week intervals, beginning March 26 and ending July 1. In August, the number of stalks showing symptoms of mosaic was recorded for each plot. Data recorded in the fall of 1968 from each plot in the three replications included number of millable stalks per plot, erectnest. of stalks, and mean weight per stalk. The number of millable stalks per acre, yield of cane per acre, yield of sugar per ton, and the yield of sugar per acre were all calculated for each plot in the three replications. Data taken from only

36
one replication for all 81 entries included mean stalk length, mean stalk diameter, laboratory brix, sucrose percent, purity, bagasse percent in cane, and fiber percent in cane.
Procedures for Measuring CharactersCharacters for which data were obtained in this
study were:1. Vigor rating in the single stools2. Shoot or stand counts3. Number of millable stalks per stool or per plot4. Number of millable stalks per acre5. Mean stalk length6. Mean stalk diameter7. Mean weight per stalk8. Yield of cane per acre9 Brix, sucrose percent, and purity
10. Bagasse percent in cane11. Fiber percent in cane12. Yield of sugar per ton of cane13. Yield of sugar per acre14. Erectness of stalks15. Mosaic infection.
1. Vigor rating in the single stools.The vigor rating made on September 17, 1966, in the
stubble crop of the single stool material was the writer's
37
visual evaluation of the overall vigor of the plants. The rating was influenced by the number of millable stalks per stool, stalk length, and stalk diameter. The rating scale used ranged from 1 to 10, with the lower numbers given to those single stools having low vigor and the higher numbers to those single stools having high vigor.
2. shoot or stand counts.Shoot or stand counts were made in the stubble crop
of the 6-foot plots on two dates. These counts were made by counting and recording the total number of individual shoots in each plot. Hie four replications or plots of each check variety were counted separately and the data recorded. Shoot or stand counts were made on two dates in the plant cane crop of the 15-foot plots and on eight dates in the first stubble crop of the 15-foot plots.Again, each of the three plots of the check varieties was counted separately and the data recorded. Shoot counts were also made on each plot of the 81 entries in all replications of the replicated yield trial on eight dates in the plant cane crop. All stand counts were made in the spring and summer.
3. Number of millable stalks per stool or per plot.Hie number of millable stalks per stool was deter
mined for each of the 200 single stools in the first stubble crop on September 17, 1966. For the 6- and 15-foot plots,
38the number of millable stalks per plot was obtained in both the plant and stubble crops in the fall of the respective crops, in both of these clonal plot Investigations, the individual plots of the check varieties were counted separately. The number of millable stalks was counted individually for each plot of the replicated yield trial in the plant cane crop. Check varieties were handled in the same manner as were the experimental clones in the yield trial.
4. Number of millable stalks per acre.The number of millable stalks per acre was calcu
lated for each plot of the 81 entries in the plant cane crop of the replicated yield trial in 1968. The number of millable stalks per acre was calculated for each clone by multiplying the number of millable stalks per plot times a factor of 242, as each plot represented 1/242 of an acre.
5. Mean stalk length.Ten stalk samples, when available, were cut,
cleaned, bundled, and identified in the field for each of the single stools on November 29, 1966. Twenty-six of the single stools did not survive the winter; therefore, there was no plant material to be sampled in the first stubble crop. Many other single stools had less than 10 stalks; therefore, from these single stools the number

39of italics taksn for ths samp Is was lsss than 10. Stalks wars taksn at random except for ths rsstrlction that sach stalk taksn was not obviously affsctsd by ths sugarcans borer (Diatraea saccharalis p .). All bundles were moved from ths field to ths headland where the length of each stalk was measured, in inches, in a pre-calibrated trough and the data recorded. After each stalk was measured and the length recorded, the sample was bound and identified again. The mean stalk length was calculated for each single stool from these data. Where the measurement was made on only one stalk, that value was used to represent the single stool.
Mean stalk length of each 6- and 15-foot clonal plot represented the average of a 10-stalk sample, taken consecutively from each plot, starting with the first representative stool. In most cases, samples were taken starting with the first stool of the plot; however, in a few cases it was apparent visually that the first stool was not representative of the clone. Samples for both clonal plot stages were taken in November. Stalks taken for a sample were cut, cleaned, bundled, and identified then removed from the field to a convenient location where measurements were made on each stalk of the sample on a pre-calibrated platform and the data recorded. After each stalk was measured and the length recorded, each sample was ret**d. The mean stalk length was then

40determined for each plot. Each plot of the check varieties was also handled in the same manner.
Mean stalk length was determined for one replication of the replicated yield trial on November 4, 1968.It also represented the average of a 10-stalk sample. From each plot, a 20-stalk sample was cut, cleaned, bundled, identified, and removed from the field to a more convenient location where the 20-stalk sample was divided into two 10- stalk subBamples. The stalk length was then measured for each stalk of one of the 10-stalk subsamples of each plot and the data recorded. Hie mean stalk length was calculated from these data. Plots of the four check varieties were handled In the same manner.
6. Mean stalk diameter.Mean stalk diameter of each single stool was ob
tained on September 17, 1966, by measuring with a caliperthe diameter at the midpoint of one internode near the middle of each of five stalks, and averaging the results. Measurements of stalk diameter for the five stalks of each single stool were taken at random while the cane was still standing in the field. To be sure that samples were not affected by the high borer infestation, stalks which showed an internode obviously reduced in size were not taken. 'ITie diameter, in millimeters, was recorded of each stalk of the sample. Where a single stool had less than five acceptable

41stalks, the mean stalk diameter was determined from the number of stalks present. In some single stools there was only one stalk.
For the 6-foot plots, the mean stalk diameter per plot was determined on November 10, 1966, by averaging the diameters of 10 stalks while the cane was still standing in the field. Beginning at the first representative stool of the clone, 10 consecutive stalks were measured. Again, only one measurement was made per stalk at the middle of the internode nearest the midpoint of the stalk. No stalks were selected for measurement which showed evidence of internodes which had been obviously reduced in size by borers. Check plots were sampled separately, with 10 stalks measured for each of the four plots of the five check varieties.
The mean stalk diameter of the clones in the 15-footplots was obtained on November 10, 1967, from an average ofa 10-stalk sample. This sample was the same sample which had been used for the measurement of stalk length. Check varieties were handled in the same manner as described in previous paragraph.
The mean stalk diameters of the 81 entries in thereplicated yield trial were taken on November 4, 1968, fromthe average of a 10-stalk sample, the same sample used for the measurement of stalk length. The caliper was used for measurement at the middle of the internode nearest the midpoint of the stalk. The check varieties were handled in
42the same manner as the other clones in the study.
7. Mean weight per stalk.Mean weight per stalk for the stubble crop of the
single stools was obtained from the same sample taken for measurement of stalk length. The mean weight per stalk was an average of a 10-stalk hand-cleaned sample when 10 stalks were available. in several cases the mean weight per stalk was an average of less than 10 stalks and in some single stools there was only one stalk in the sample.
in the 6-foot plots, mean weight per stalk of the clones was obtained from the same sample used for measurement of stalk length. The mean weight per stalk was an average of the 10-stalk sample. The mean weight per stalk was also determined for each of the check plots separately.
Mean weight per stalk was obtained for the 15-foot plots from the same 10-stalk sample used for the measurement of mean stalk length and mean stalk diameter. Again, stalks had been hand-cleaned. Bach sample of 10 stalks was weighed and the average weight per stalk was determined. All plots of the check varieties were handled individually.
Mean weight per stalk for each plot of the replicated yield trial represented the average on a 20-stalk sample. Samples were taken as described in the section of mean stalk length. The check varieties were handled in the same manner as the experimental clones in the study.

438* Yield of cane per acre.
Yield of cane per acre, in tons, as determined inthe replicated yield trial, is an estimated value. in thisstudy the yield of cane per acre of each plot was estimatedby multiplying the mean weight per stalk times the numberof millable stalks per acre, then dividing by 2000. Inseparate experiments, Hogarth and Skinner (31) in Australiaand Hebert (25) in Louisiana reported highly significant
*
positive correlations between estimated yields of cane per acre and actual yields of cane per acre by weighing entire p lo t s .
9. Brix, sucroBe percent, and purity.In the 6- and 15-foot plots, juice quality studies
were made from the same samples that were used for the measurement of mean stalk length, and mean weight per stalk. It was mentioned under the heading stalk length that a 20- stalk sample was taken from each plot of one replication In the replicated yield trial and that these samples were divided into two 10-stalk subsamples. one of these subsamples was then subdivided into two 5-stalk sub-subsamples. Brix, sucrose percent, and purity were obtained from each 5-stalk lot. All check plots were handled individually in the 6- and 15-foot plots and in the yield trial only one replication of each of the check varieties was utilized for the two analyses.
In this study all brix and sucrose determinations were run in the laboratory from milled cane samples. The facilities for milling cane at the Houma Station were used for milling the samples of the 6-foot plots and the mill for the Department of Plant Pathology, Louisiana Agricultural Experiment Station, Baton Rouge, Louisiana, was used for milling the samples of the 15-foot plots and the replicated yield trial.
Brix was obtained by the use of the brix hydrometer standardized at 20°C. Temperature corrections were made according to Table 21 in Cane Sugar Handbook, ninth edition by Spencer and Meade (42).
Sucrose percent was analyzed by Horne's method, using the dry salt for clarification. A portion of the juice of the sample was placed in flask with 3 to 4 grama of the dry lead subacetate added for each 100 milliliters of juice taken. The samples were thoroughly mixed and filtered. The filtrate was then polarized in a 200 millimeter tube. The polarization of the juice was thenobtained from Schmitz's table (42).
Purity was calculated for each sample by dividing the sucrose percent by the brix, then multiplying by 100. This represents what is known as the gravity purity (42).
10. Bagasse percent in cane.Bagasse percent in the cane was determined for each

45clone In the 6-foot plots, the 15-foot plots and for each clone in one replication of the replicated yield trial.Two determinations for bagasse percent in cane were made for each clone in the replicated yield trial. The samples which were used for juice quality studies were also used here. All weights of the samples of stalks were properly recorded prior to milling on the identifying tag for each sample. After milling, the bagasse was collected from each sample and weighed, with this weight being also recorded. The percent bagasse in the cane was derived by dividing the bagasse weight by the stalk weight prior to milling then multiplying by 100.
For the 6-foot plots there were four determinations of bagasse percent for each of the five check varieties.In the 15-foot plots there were three determinations of bagasse percent for each of the five check varieties. Two determinations of bagasse percent were made for each of the four checks in the one replication of the replicated yield trial.
11. Fiber percent in cane.Fiber percent determinations were also made from
the same samples milled for juice quality studies. Fiber percent was determined for the 15-foot plots and for the one replication of the replicated yield trial. As was the case for the bagasse percent determinations in the replicated yield trial, there were two determinations made for

46fiber percent, one for each of the 5-stalk sub-subsamples.The same procedure was followed for the check varieties as for the experimental clones in the 15-foot clonal plots and the replicated yield trial.
The fiber percentages of the samples were obtained by the procedure outlined by Henderson e_t ,al. (29). The stalks of each clone were hand-cleaned of all trash and weighed. Samples were put once through an experimental mill which provided approximately 60 percent juice extraction. Both the juice and the bagasse were collected. From the juice sample, a determination of the brix was made. The bagasse was bagged and weighed immediately after milling with the weight recorded. The bagasse was then dried in a gas- fired drier at about 150°F until the samples had reached constant weight. The weight of dried bagasse was subtracted from the original weight of bagasse taken after milling.The difference in weights represented the moisture which had remained in the bagasse after the one milling. It was assumed that this moisture contained the same concentration of soluble solids, or brix, as the expressed Juice; therefore, the amount of soluble solids remaining in the bagasse was calculated by multiplying the brix times the amount of moisture. This figure represented solids remaining in the dried bagasse and therefore was subtracted from the weight of dried bagasse. The difference represented an estimate of the weight of fiber in the sample.
47The fiber percent of the sample was obtained by dividing the estimated weight of fiber by the weight of the sample, then multiplying by 100.
12. Yield of sugar per ton of cane.The amount of sugar in pounds that can be obtained
by normal commercial processing methods from a ton ofsugarcane, commonly designated sugar per ton, is highly important in eugarcane breeding programs since it is a basic component of the yield of sugar per acre. Determination of the number of pounds of sugar produced per ton of cane milled is a straightforward, relatively simple procedure for commercial mills. However, in research programs, based of necessity on large numbers of small samples of cane, only estimates of sugar per ton can be made, and, in research involving different varieties, reliable estimates require complex procedures. Furthermore, in making these estimates from small samples of cane, it is not feasible for several reasons to determine in any direct manner the amount of sugar that can be removed from the samples of cane by processing. The determinations must, of necessity, represent indirect means of estimating the amount of sugar that could be obtained from the small samples of cane if they were subjected to processing procedures comparable to those in commercial mills. Hie methods used in making these estimates on an experimental basis
48are not entirely comparable to the processing of cane in commercial mills and do not involve the extraction of sugar, either raw or purified*
The method adopted in this dissertation for determining sugar per ton of cane of the 80 experimental clones and check varieties in the replicated yield trial was a modification of the procedure which has been in use for many years at the Houma Station. Since the principles upon which the procedure is based are somewhat complex and a description of development of the procedure is not readily available* it appeared to be desirable to describe in some detail not only the procedure itself but also the steps that were followed in its development and the principles upon which it is based.
It may appear that the number of pounds of sugar which, through processing, could be extracted from a ton of cane can be calculated simply from the percent of sucrose in the cane x 2000 pounds. However, there are many variables Which affect the yield of sugar per ton of cane. For one thing, the percent sucrose determined in milling quality tests does not represent the percentage of sugar in the cane but pertains to the percent sucrose in the juice.
The product produced by mills which process sugar- can«— raw sugar--is not pure sucrose but also contains water and several impurities. Consequently, sugar per ton of cane
49ia calculated and expressed as the weight in pounds of raw sugar per ton of cane. in the calculation, a standard of 96 percent recoverable sucrose in the raw sugar product, commonly designated 96 pol sugar, is utilized.
Another factor which influences the amount of sugar that can be obtained from a ton of cane is that part of the sucrose present in the cane bound in various ways with certain non-sucrose solids also dissolved in the Juice.Since the sucrose that is bound with non-sucrose solids cannot be distinguished from the free sucrose by the polarlscope, it is included in the sucrose percentage, but Is not separated from the non-sucrose solids in processing, hence cannot be recovered as pure sugar. Any reliable estimate of the amount of sugar that can be removed from a ton of cane must make appropriate allowance for the sucrose that is tied up with non-sucrose solids, otherwise, the amount of sugar per ton of cane that can be recovered in milling will be seriously overestimated.
Still another Important factor affecting the sugar obtainable from a ton of cane is the influence of fiber in the cane on the extraction of sugar in the milling process. Even in the most efficient commercial mills, all of the sugar present in the cane cannot in any practical way be separated from the fiber, resulting in a loss of an appreciable quantity of sugar in the bagasse. This problem is complicated further in certain types of research by marked
50differences between varieties in the proportion of sugar in the cane that can be extracted feasibly, lftese varietal differences are caused by variation in the amount and nature of fiber in the cane. More sugar is lost in the bagasse of high-fibered varieties than in that of low-fibered ones.
Another feature of the estimation of sugar per ton for large numbers of small samples of sugarcane is the practical necessity of making the estimates from crusher Juice analyses rather than normal juice, which requires more complete milling of the cane. (Crusher Juice is that obtained from a single passage through a small sample mill or through the first set of rollers of a commercial mill, while normal juice is the juice as it occurs in the sugarcane) . The sucrose and brix content of crusher juice Is somewhat higher than that of normal juice. Consequently, in estimating the amount of sugar in a ton of cane from crusher Juice data an adjustment must be made to avoid overeatimation.
A final problem in the calculation of available sugar per ton of cane arises from the fact that the boiling house operation of commercial mills is not 100 percent effective in extracting sugar from the Juice after it is removed from the cane. However, this ia not a varietal effect and is ignored in the calculation of sugar per ton in research. in the computation the efficiency of the boiling house operating is assumed to be 100%.
51The method being used by the Houma Station to cal
culate the yield of sugar per ton of cane for a large number of varieties each season was devised by Arceneaux (3, 4, 5) and is designed to take into acoount the effects of non-sucrose solids and fiber on the amount of sucrosein the cane that can be removed as pure sugar in the millingprocess and utilizes data from crusher juice samples. Arceneaux began with the elementary fact that the number of pounds of 96 pol sugar obtainable from a ton of cane for each one percent of sucrose in the normal juice wouldbe 20.8333 if it were assumed: (1) that none of the sucroseof the normal juice was combined with non-sucrose solids,(2) that all of the juice in the cane, hence all of the sucrose, could be extracted in milling, and (3) that the boiling house efficiency was 100 percent. The computation involved is as follows:
2000 x .01 x 1.00 x 1.00 - 20.83333 pounds.-----------T5S----------In order to adjust for the effect of non-sucrose
solids in the juice on the amount of recoverable sugar, Arceneaux adopted the observation of Winter in Java that, as an average, each pound of non-sucrose solids will tie up 0.4 pound of sucrose and expressed Winter's formula for the calculation of amount of sugar recoverable from the Juice of sugarcane in the following relatively simple form:
I. s - e - /74 (f-ej_7 ,

52where
S ■ pounds of recoverable sugar In a given weight of juice extracted from cane;
e =* pounds of sucrose contained in the given weight of juice involved, and
f - pounds of total soluble solids (sucrose and non-sucrose) in the given weight of Juice,
If 8 is calculated as the pounds of 96 pol sugar recoverable from the juice of one ton of cane, the value of e in equation I will be estimated from the number of 1 percent sucrose increments in the normal Juice x 20.83333pounds. (As pointed out earlier, 20,83333 lathe number of pounds of 96 pol sugar in the normal juice of a ton of cane for each 1 percent of sucrose.) of course, the number of 1percent increments of sucrose in the Juice is Indicateddirectly by the sucrose percent of the juice.
Based on the assumption that each pound of nonsucrose solids in the juice will tie up 0.4 pound of sucrose, the number of pounds of 96 pol sugar that will be tied up in an unavailable form in 1 ton of cane by each 1 percent of non-sucrose solids will be
2000 x .01 x .4 » 8.33333 pounds.----------755-------
The number of 1 percent increments of non-sucrose solids inthe normal juice of the cane is equal to the number of 1percent increments of total solids, indicated by brix

53reading, minus the number of 1 percent increments of sucrosef indicated by sucrose percent. Consequently, if S in equation I is calculated as the number of pounds of 96 pol sugar recoverable per ton of cane, the /74 (f-e|7 portion of the equation can be expressed as number of 1 percent increments of non-sucrose solids x 8.33333 pounds.
Letting S 96° represent pounds of recoverable 96pol sugar per ton of cane, *n represent number of 1 percentIncrements of sucrose in the normal juice, n represent number of 1 percent increments of total solids in the normal juice, and bn - 8n represent the number of 1 percent Increments of non-sucrose solids in the normal juice, equation I can be rewritten in the following forin
II. S 96° - ®n (20.833333) - - ®n> 8-333337.Equation XI can be simplified to:
S 96° - 8n (20.83333) - bn (8.33333) +8n (8.33333)
and finally to:S 96° - 8n (29.16667) - bn (8.33333).It should be noted that the 8n and bn values in
equation II are not sucrose percent and brix, respectively, although they are commonly stated as such. Rather than percentages, or numbers of parts in 100, they are absolute values representing numbers of 1 percent Increments of sucrose an<J total solids in the Juice. However, they are derived in a simple and direct manner from the sucrose

54percent and brix of the juice. For example, normal juice having 12 percent sucrose and 16 brix will have *n and ton values of 12 and 16, respectively, rather than .12 and .16.
As pointed out earlier, the assumptions made in equations I and il that all of the juice contained in the cane can be extracted in milling and that feasible methods are available to determine the sucrose percent and brix of normal juice for large numbers of cane Bamples from experimental plots are not valid. Application of equation II in computing sugar per ton of cane would, consequently, result in overestimation and would not give recognition to varietal differences.
Even in the most efficient commercial mills some juice present in the cane is not removed in milling and the sucrose in it is lost in the bagasse. Consequently, in the calculation of sugar per ton of cane it is necessary to make adjustments to correct for the sugar that is retained in the bagasse. This is particularly important in experimental work involving difference varieties because of major differences among varieties in the proportion of normal juice and sucrose that can be extracted in milling. in making the necessary adjustments, the values of 29.16667 and 8.33333 in equation II are reduced according to the percentage of the normal juice that can be extracted in milling- -deslgnated normal juice extraction percent.
The normal Juice extraction percent is a varietal

55characteristic and must be determined separately for each variety Involved if the calculations of sugar per ton of cane are to be reliable, in experimental work this determination is based on the results obtained from small scale milling tests conducted with an experimental mill. A milling test at the Houma Station Involves passing an 80 pound sample of fresh, handcleaned cane four times through a three roller hydraulic mill with 32 tons of pressure on the top roller. Before each of the second, chlrd and fourth millings of the sample, 5 1/3 pounds of cold water, termed maceration or saturation water, are sprinkled on the bagasse to increase degree of juice and sucrose extraction. Data obtained from the milling teBt are simply the weight, brix and sucrose percent of the crusher Juice (juice from the first passage through the mill) and weight, brix and sucrose percent of the combined juice from the other three passages.
The normal juice extraction percent of the variety involved in the preceding milled sample is determined from the data obtained. First, the brix of the normal juice in the cane is estimated from the brix of crusher juice x a constant of .985. (The constant of .985 used for all varieties is called the brix reduction factor. It is used to adjust the brix of crusher Juice, which is higher than that of the normal juice, downward to provide a reliable estimate of the brix of normal Juice. The constant of
56.985 was obtained by Arceneaux from the results of a large number of dry milling tests— without addition of maceration water— conducted with the then standard variety Co. 281.He found that the average brix of Juice from four millings without addition of maceration water, and assumed to represent normal juice, divided by the average brix of crusher juice from numerous tests was .985).
Next, what is designated the brix product, or number of pounds of soluble solids in the total juice obtained from the 80 pound sample of cane, is calculated from (weight of crusher juice x brix of crusher juice) + (weight of oomblned Juice from other three millings x brix of this juice).Then, the brix product is divided by the normal Juice brix to provide an estimate of the weight in pounds of normal juice that was present in the 80 pound cane sample. Finally, the normal Juice extraction percent is obtained by dividing the estimated weight of the normal juice in the sample by 80, the original weight of the cane sample. Normal juice extraction percentages usually range for different varieties between 75 and 85 percent, depending on the amount and nature of fiber in the cane.
Before utilizing the normal juice extraction percent to adjust the values of 29.16667 and 8.33333 in equation II, Arceneaux also determined adjustment factors needed to permit use of sucrose percent and brix from crusher juice analyses in equation II instead of sucrose percent and brix of normal

57
juice. Two adjustment factors are needed to correct for the difference between normal juice and crusher juice, one for sucrose and the other for brix. The former is now termed the sucrose reduction factor and the latter the brix reduction factor. Like the normal juice extraction percent, the sucrose and brix reduction factors are devised to adjust the values of 29.16667 and 8.33333 in equation II.
Determination of the brix reduction factor was outlined previously, and it was pointed out that Arceneaux adopted a constant value of .985 for all varieties based on the results obtained with Co. 281. The sucrose reduction factor is derived from the data obtained in the experimental milling test by a process of estimation. The weight in pounds of sucrose in the total juice obtained from the 80 pound sample of cane, designated the sucrose product, is estimated from (weight of the crusher, juice x sucrose percent in the crusher juice) + (weight of combined juice from other three millings x sucrose percent of this juice). Then, the purity of the normal juice, or percent of all soluble solids in the normal juice that is sucrose, is obtained by dividing the sucrose product by the brix product, dealt with earlier. Next, the percent of sucrose that was present in the normal Juice of the sample is estimated from the brix of the normal juice x purity of the normal Juice. Finally, the sucrose reduction factor is derived from the relationship between percent of sucrose
58
in the normal juice and the percent of sucrose in the crusher Juice by dividing the former by the latter. A sucrose reduction factor is calculated separately for each variety in contrast to the use of a constant value of .985 as the brix reduction factor for all varieties. Among current varieties, the sucrose reduction factor varies from .969 to .982.
Although the procedures used in obtaining the normal juice extraction percent, brix reduction factor and sucrose reduction factor may appear to be lengthy and somewhat complex, they actually are not. Note that one— the brix reduction factor--is a constant and the others are derived from the weight, brix and sucrose percent of juice milled from an 80 pound cane sample and the constant brix reduction factor.
After computing the normal juice extraction percent and brix and sucrose reduction factors for a particular variety from milling test data, Arceneaux used them to make adjustments in equation II in order to provide specific allowance in each variety for the proportion of normal Juice that is extracted by normal milling procedures and to permit substitution of crusher juice sucrose percent and brix for the normal juice sucrose percent and brix required by the equation. Hie adjustments involve modifications in the 29.16667 and 8.33333 values of equation II. In calculating sugar per ton of cane for a particular variety, the
59following adjustment is made in the first of these valueei 29.16667 x normal juice extraction percent x sucrose reduc- tion factor. The adjusted value obtained was designated the x value by Arceneaux. It is always less than 29.16667. The second value in equation II is adjusted in the following manner: 8.33333 x normal Juice extraction percent x brixreduction factor. This amended value, always less than 8.33333, was designated the y value. In recent years the x and y values of Arceneaux have been called sucrose and brix factors, respectively.
Following the adjustments described in previous paragraphs, equation II was converted by Arceneaux to the following:
oIII. S 96 » s x sucrose factor - b x brix factor,owhere S 96 is still the pounds of recoverable 96 pol
sugar per ton of cane, s is the number of 1 percent increments of sucrose in the crusher juice, b is the number of 1 percent increments of total solids in the crusher juice and the sucrose and brix factors are values obtained by adjusting 29.16667 and 8.33333, respectively, in the manner outlined in the previous paragraph.
Because the milling tests required to determine the sucrose and brix factors of a variety are time-consuming, it is obvious that separate sucrose and brix factors cannot feasibly be calculated for each of the hundreds of plots of
60experimental varieties which are grown in various yield trials during a growing season. Consequently, only a few milling tests are oonducted with each variety and the average sucrose and brix factors from these are utilized in all sugar per ton of cane computations. However, it is feasible to determine sucrose percent and brix of crusher juice from small samples, usually 20 stalks, collected from each experimental plot. Thus, in calculating the sugar per ton of cane for an experimental plot in a varietal yield trial, the values of s and b for equation 111 are derived from the sucrose percent and brix of crusher Juice obtained from a small sample of cane taken from the plot and milled at the Houma Station. The sucrose and brix factors substituted in the equation are obtained from a limited number of milling tests which have been conducted with cane of the variety involved.
Arceneaux recognized an additional problem arising from the procedure outlined in the previous paragraph of using a few milling tests to derive sucrose and brix factors for general use in the sugar per ton of cane equation.During any harvesting season the sucrose and brix factors adopted for each of the numerous varieties represent averages derived from varying numbers of milling tests in which the cane was grown in different years under widely different environmental conditions. These environmental conditions influence markedly the values of the sucrose and brix
61factors, causing appreciable variation within as well as among varieties. Consequently, serious bias would be introduced if the sugar per ton estimated for a variety from sucrose and brix factors representing averages of 10 milling tests was compared with that estimated for another variety from sucrose and brix factors derived from only 1 or 2 of these tests. In order to solve this problem, Arceneaux devised a set of what he termed varietal correction factors.
The procedures followed in development of the varietal correction factor system for calculating sugar per ton of cane can be described most readily by classifying them into two phases: 1. The determination of a standardset of sucrose and brix values for each of a series of varietal correction factors on the basis of milling tests conducted with a standard variety, Co - 281, and 2. lbe assigning of a varietal correction factor to each of the numerous experimental varieties being evaluated in yield trials.
In carrying out the first phase, Arceneaux adopted Co. 281 as a standard variety because it had been grown widely in the state and results from a large number of milling teats spread over several years were available.On the basis of all milling tests oonducted, Co. 281 had an average normal juice extraction of 76 percent, an average sucrose reduction factor of .970 and an average brix reduction factor of .985. These milling data led to
62an average sucrose factor of 29.16667 x .760 x .970 “21.5017 and an average brix factor of 8.33333 x .760 x .985 ■ 6.2383. These average sucrose and brix factors of Co. 281 were adopted as standards for milling quality and together were assigned a value of 1.00. This value of 1.00, representing simply sucrose and brix factors of 21.5017 and6.2383, respectively, became the varietal correction factor of the standard variety, Co. 281.
Prom the relationship of the varietal correction factor of 1.00 to sucrose and brix factors of 21.5017 and6.2383, Arceneaux calculated standard sucrose and brix factors for a range of varietal correction factors: .92, .94, .96, .98, 1.02, 1.04, and 1.06. This was accomplished simply by multiplying the standard sucrose and brix factors for a varietal correction factor of 1.00 by each of the additional varietal correction factors. As examples, the sucrose and brix factors for a varietal correction factor of 1.02 were found to be 21.5017 x 1.02 ■ 21.9317 and 6.2383 x 1.02 « 6.3631, respectively, while the sucrose and brix factors for a varietal correction factor of .98 were21.5017 x .98 - 21.0717 and 6.2383 x .98 - 6.1135. Later use of the varietal correction factors at the Houma Station led to an extension of the range to include values of 1.08, 1.10 and 1.12.
in developing the second phase of the varietal correction factor system— assigning of varietal correction
63factors to experimental varieties— Arceneaux used data from milling tests in which the experimental varieties and the standard, Co. 281, were evaluated simultaneously for milling quality. To accomplish this he grew the experimental varieties along with Co. 281 under comparable conditions at the Houma Station and conducted a milling test with cane of each. Based on the sucrose and brix factors obtained for an experimental variety and the sucrose percent and brix of crusher juice of this variety in the milling test, he calculated pounds of sugar per ton of cane. Then, he recalculated pounds of sugar per ton of cane for this variety using the same sucrose percent and brix of crusher juice as in the first computation but substituting the sucrose and brix factors obtained for Co. 281 from the milling test of cane grown under comparable conditions, (These sucrose and brix factors for Co. 281 were usually appreciably different from the average ones based on many milling tests and adopted for a varietal correction factor of 1.00.)
The second calculation provided an estimate of the yield of sugar per ton of cane for the experimental variety if it had had the same milling quality as Co. 281. Finally, the varietal correction factor for the experimental variety was obtained by dividing the first calculated number of pounds of sugar per ton of cane, based on the actual milling quality of the variety, by the second calculated value of sugar per ton of cane, based on the milling quality of Co.
64281. Thus, the varietal correction factor assigned to a variety was merely an Index of Its milling quality, expressed as sucrose and brix factors. In relation to that of the standard, Go. 281, when grown under comparable conditions.
Unpublished data from the Houma Station involving the unreleased variety L. 60-1 can be used to Illustrate the procedure followed In assigning a varietal correction factor to a new e?, erimental clone. Results from a millingtest with an 80 t 3 sample of L. 60-1 provided thefollowing milling quality values*
Brix of crusher Juice » 18.40 Sucrose percent of crusher Juice ■ 16.22 Normal Juice extraction percent ■* 79.89 Brix reduction factor « .985 (constant)Sucrose reduction factor * ,978Sucrose factor ■ 29.16667 x .7989 x .978 » 22.789 Brix factor - 8.33333 x .7989 x .985 « 6,558 Using these values in equation III,S96° - 16.22 x 22.789 - 18,40 x 6.558 - 249 pounds.
At the time that the milling test with L. 60-1 was conducted, the original standard variety, Co. 281, was no longer being grown. However, a standard variety, C.P.44-101, was grown in the same test with the sample of L. 60-1, and the relationship between Co. 281 and C.P.44-101 had been established through earlier tests. Based on the performance of C.P.44-101 when grown in the same test with L. 60-1, it
65was calculated that under these conditions Co. 281 would have had a sucrose factor of 23.042 and a brix factor of 6*604. Substitution of these sucrose and brix factors along with the sucrose percent and brix of crusher juice of I<* 60-1 in equation ill leads to the following:
396° * 16.22 x 23.042 - 18.40 x 6.604 - 252 pounds The value of 252 represents an estimate of the
pounds of sugar per ton of cane that L. 60-1 would have produced in the test if it had possessed the same milling quality as Co. 281. Finally, the varietal correction factor assigned L. 60-1 is obtained from 249 ▼ 252 ■ 0.988. Which is rounded to 0.98. The varietal correction factor values computed for L. 60-1 in other milling tests are averaged with 0.98. Consequently, the varietal correction factor actually used in determining sugar per ton of cane for L. 60-1 may have differed somewhat from the 0.98 computed in this single milling test.
Varietal correction factors may be assigned to experimental varieties on the basis of one milling test; however, in the case of varieties which remain in the testing program for several years, they represent the averages of several milling tests, with 9 or 10 tests considered to be adequate for highly reliable results.
In practice, the calculation of sugar per ton of cane for an experimental plot of a variety is based only Indirectly on the results of milling tests— sucrose and

66brix factors— conducted with cane of the variety. The sucrose and brix factors which are substituted in equation III are not those actually obtained in the milling tests, instead, the milling test data for a variety are used only in assigning it a varietal correction factor in the manner described previously. To calculate sugar per ton of cane for a sample. Arceneaux used the assigned varietal correction factor to select corresponding standard sucrose and brix factors which had been computed entirely from numerous milling tests conducted with Co, 281 along with sucrose percent and brix from a crusher juice analysis of the cane sample.
Unpublished data from the Houma Station for the variety C.P.44-101 will serve to illustrate calculation of sugar per ton of cane. Based on the results of milling tests, c.P.44-101 has been assigned a varietal correction factor of 1.02. As indicated earlier. Arceneaux found that Co. 281. with a varietal correction factor of 1.00. had average sucrose and brix factors of 21.5017 and 6.2383. respectively, from which he concluded that a variety having a varietal correction factor of 1.02 will have standard sucrose and brix factors of 21.9317 and 6.1135. A sample of crusher Juice from sugarcane harvested from an experimental plot of C.P.44-101 had sucrose percent of 13.04 and brix of 16.35. Substituting these values in equation III.S 96° - 13.04 x 21.9317 - 16.35 x 6.1135 - 182 pounds of

67sugar per ton of cane.
Incidentally, this estimate of sugar per ton of cane differs appreciably from that obtained for the plot from sucrose and brix factors obtained for C.P.44-101 in a milling test conducted during the same season in which the experimental plot was grown. The milling test data for C.P.44-101 for the particular harvesting season involved led to sucrose and brix factors of 23.618 and 6.769, respectively, Substituting these in equation III, S 96° - 13.04 x 23.618 - 16.35 x 6.769 * 197 pounds of sugar per ton of cane. The estimate of 182 pounds is based on the apparent milling quality that a variety like c.P.44-101 would have as an average of several years, while the latter estimate of 197 pounds is based on the milling quality which the variety had in the single season involved. (It is obvious from this difference In estimates that use of varietal correction factors, and their sucrose and brix factors derived from numerous milling tests spread over many years, does not provide a reliable estimate of the pounds of available sugar per ton of cane for a particular plot. This can only be arrived at from milling test data with the variety Involved conducted with cane grown under comparable climatic and other environmental conditions as the experimental plot. Instead, a calculation of available sugar per ton of cane made by use of varietal correction factors i8 an estimate of the average number of pounds of

63sugar* that this variety \*?uld produce per ton of cane over a period of several years if the juice quality--sucrose percent and brix— remained constant and equal to that from the experimental plot involved).
In recent years workers at the Houma Station have made several modifications in the procedure devised by Arceneaux for estimating sugar per ton of cane. it appeared that the estimates were higher than the actual amounts of sugar being obtained for varieties by raw sugar mills in Louisiana. in order to lower the estimates, the brix reduction factor assumed for Co. 281 was reduced from .985 to .971. This caused the sucrose reduction factor for Co. 281 to be lowered from .970 to .950. However, these adjustments weze not considered to be sufficient, and in a later change the values used for sucrose and brix factors for a standard variety— varietal correction factor « 1.00— were set somewhat arbitrarily to provide estimates of sugar per ton more nearly in agreement with the sugar yields of commercial mills. 'The sucrose and brix factors in current usage for a varietal correction factor of 1.00 are 20.549 and 5.962, respectively, in place of 21.5017 and 6.2383 adopted by Arceneaux. Sucrose and brix factors for the other varietal correction factors were computed from the new values.
As a consequence of the change in basic sucrose and brix factors for the various varietal correction factors.
69the calculated number of pounds of recoverable sugar per ton of cane for the sample of C.P,44-101 cited earlier as an Illustration would now be 174 pounds in contrast to the 182 pounds estimated from Arceneaux1 data. However, except for the use of .971 instead of .985 as a constant brix reduction factor for all varieties, the procedure devised by Arceneaux for assigning varietal correction factors to new experimental varieties is still followed.
Because Co. 281 is no longer grown as an agricultural variety in the state, it has not been feasible to continue to include this variety as the standard in milling tests. Consequently, it has been replaced as the standard variety in milling tests by either C.P.44-101 or C.P.52-68, varieties which had been assigned a varietal correction factor of 1.02 in comparison with Co. 281. in currently conducted milling tests, the sucrose and brix factors calculated for the new standard varieties are adjusted to equivalent values for a varietal correction factor of 1.00 by dividing each by 1.02. Then, these amended sucrose and brix factors, adjusted to the presumed performance of Co. 281, are used as standards in obtaining varietal correction factors for the experimental varieties included in the same milling test through the procedure devised by Arceneaux and described previously.
in 1945 Arceneaux (4) stated that there was a consistent negative relationship between fiber content and
70varietal correction factors; therefore, from a knowledge of the fiber contents of different varieties, comparatively good estimates of their relative milling qualities could be made. Again, in 1956, Arceneaux (6) cited the close negative relationship between fiber percent of the cane and varietal correction factors. He reported a significant negative correlation coefficient of .99 for a group of varieties.
It was not feasible to conduct milling tests on the 200 experimental clones in the 15-foot clonal plots or the 77 experimental clones tested in the yield trial in order to assign a varietal correction factor to each of the clones for the purpose of estimating the yield of sugar per ton of cane, instead, the fiber percentages obtained for these clones in the 15-foot clonal plots and in the yield trial were used to assign varietal correction factors. Based on the close negative correlation coefficient between fiber percent and varietal correction factors reported by Arceneaux and the fact that Co. 281 with a varietal correction factor of 1.00 had an average fiber content of 12.57 percent, clones which had fiber percentages of 10.50 or less were given a varietal correction factor of 1.04.Clones with fiber percentages in the range 10.51 to 12.50, inclusive, were given a varietal correction factor of 1.02. Those clones with fiber percentages in the range 12.51 to 13.50, inclusive, were given a varietal correction factor

of I.00, Finally, those clones with fiber percentages of 13.51 or higher were given a varietal correction factor of .98. For the check varieties, varietal correction factors, as assigned by several complete milling test in previous years were used. The conventional sucrose and brix factors currently used by the Houma station for these four varietal correction factors were adopted in estimating sugar per ton of cane for the experimental clones, using equation III.
13. Yield of sugar per acre.The yield of sugar produced per acre in pounds was
estimated for all 81 entries in each of the three replications by multiplying pounds of sugar per ton of cane times the tons of cane per acre obtained in the yield trial.
14. Erectness of stalks.Erectness of stalks was based on a rating scale in
use at the Houma Station, as illustrated by Hebert and Henderson (27). The scale is as follows: 1 — very superior2 * superior: 3 « average; 4 ■ inferior; and, 5 * very inferior.
This rating scale was used in the first stubble crop on each of the single stools, each of the 6- and 15- foot clonal plots, including each plot of the check varieties, and in all three replications of each clone in the replicated yield trial. Ratings were made in every case

72in the fall of the year prior to harvest.
15. Mosaic infection.The percent mosaic infection was determined in the
stubble crop of each of the 6-foot clonal plots and in each plot of the increase material from which the material used to plant the replicated yield trial was obtained. Check varieties were included in the determination of the amount of mosaic. Mosaic infection, when expressed as percent, was calculated by dividing the number of diseased stools, obtained by visual observation, by the total number of stools in the plot, then multiplying by 100. The number of stools showing symptoms of mosaic in the plant cane crop of the 15-foot clonal plots was recorded; however, the total number of stools was not determined and the percentage of diseased stools could not be calculated. An indication of the amount of mosaic in each plot of the replicated yield trial was obtained by counting the number of stalks in the plant cane crop showing symptoms of mosaic. ifris observation was made during August of 1968.
Analysis of DataAll possible phenotypic correlation coefficients
were determined for each test among the characters studied. Tor the stubble crop of the single stools, all possible phenotypic correlation coefficients were calculated among number of mi liable stalkB per stool, mean stalk length.
73mean stalk diameter, mean weight per stalk, erectness of stalks, and vigor rating. For the 6-foot clones all possible phenotypic correlation coefficients were calculated for the number of millable stalks per plot, mean stalk length, mean stalk diameter, mean weight per stalk, erectness of stalks, brix, sucrose percent, purity, bagasse percent, and shoot or stand counts. For the 15- foot clonal plots phenotypic correlation coefficients calculated were between the number of millable stalks per plot, mean stalk length, mean stalk diameter, mean weight per stalk, erectness of stalks, brix, sucrose percent, purity, bagasse percent in cane, fiber percent in cane, yield of sugar per ton of cane, and shoot or stand counts.
All possible phenotypic, genotypic, and environmental correlation coefficients were computed according to the formulas set forth by Miller et a_l. (43) for yield of sugar per acre, yield of cane per acre, yield of sugar per ton of cane, number of millable stalks per acre, mean weight per stalk, erectness of stalks and shoot or stand counts in the replicated yield trial. It is a necessary requirement for the calculation of genotypic and environmental correlation coefficients that each plot of the replicated yield trial be sampled.
Also all possible phenotypic correlation coefficients were obtained among mean stalk length, mean stalk diameter, brix, sucrose percent, purity, bagasse percent in cane, and

74fiber percent in cane for the replicated yield trial; however, only one plot of each clone was sampled for measurement of these characters. All possible phenotypic correlation coefficients were computed among the means of the characters where each plot was sampled in the yield trial and the characters where only one plot of each clone was sampled in the yield trial.
Furthermore, all possible phenotypic correlation coefficients were calculated for the same characters between the different seasons and for the different characters between different seasons.
In several cases, in order to understand more clearly the relationship between certain components, scatter diagrams were prepared showing the distribution according to the performance of the two components. Also, a regression line was determined to indicate the best fit for the dots in the scatter diagrams.
Check varieties were not used for obtaining any of the correlation coefficients. All characters measured for the check varieties in both the 6- and 15-foot clonal plots were analyzed by an analysis of variance for each character separately to determine if significant differences, as indicated by the F Test, could be found.
Where measurements were taken on each of the replicated plots for all clones in the yield trial for yield of sugar per acre, yield of cane per acre, yield of sugar per
75ton, number of millable stalks per acre, mean weight per stalk, erectness of stalks, and shoot or stand counts, analyses of variances and covariances were calculated for the complete block design with three replications. All analyses were calculated on the complete block design rather than the lattice design because several plots were damaged through cultivation in the spring of 1968. Two plots of one experimental clone were severely damaged; therefore, the clone had to be dropped from the experiment thus disrupting the lattice design. Por 10 other plots of different clones which were damaged, an estimated value was determined for all characters measured.
All data were keypunched and the bulk of the mathematical computations were obtained from the LSU Computer Research Center*
An indication as to significant differences among the clones in the replicated yield trial was obtained through the use of the F Test where an analysis of variance was calculated. The test of significance for mean differences was accomplished through the use of the Duncan Multiple Range Test.
All the usual cultural practices were followedduring the growing season on all test series of the experiment. Nitrogen in the form of anhydrous ammonia was appliedon all tests at Leighton Plantation at the recommended rate per acre. No other fertilizer materials were applied.
76
In the replicated yield trial Sinbar (Terbacil) was applied at the rate of 3/4 pound per acre in the spring of 1968 for pre-emergence control of grass seedlings. 2,4-D was applied by airplane during the summer of 1968 for the control of broadleaf weeds. Beginning on June 29, 1968, the replicated yield trial was sprayed every two weeks with Azodrin at the rate of 0.75 pound actual toxicant per acre per application for the control of the sugarcane borer. Three applications were made.

RESULTS
As indicated earlier in the Materials and Methods section, a wide variety of data were obtained during the four-year period 1965 - 1968, primarily involving associations between different traits and between the same traits in different sizes of plots. One of the primary objectives of the research was to study the association of yield of sugar per acre and yield of cane per acre with their various components. These associations will be presented and discussed first.
Association Between Yield of Sugar Per Acre and Its Components
In the replicated yield trial described under Materials and Methods, the 76 experimental clones and 4 check varieties included in the test were classified in all three replications for yield of sugar per acre and for the following yield components: yield of cane per acre,yield of sugar per ton of cane, number of millable stalks per acre, and mean weight per stalk. Since yield of sugar per acre and these components of it are subject to considerable environmental variation, an analysis of variance was calculated for each trait in order to determine whether
77

78
sufficient genetic variation occurred among the experimental clones to permit detection of genetically controlled associations between yield of sugar per acre and these components. For each trait a significant F value was found for the treatment, or among clones, value in the analysis of variance, providing statistical proof that a detectable degree of genetic variation occurred among the clones for each of the characters.
The following yield components were also measured for each of the 80 clones and varieties in the yield trialbut only in one of the replications: mean length perstalk, mean diameter per stalk, brix, sucrose percent, and purity. Due to the nature of these characters, it was felt that data from only one replication would be adequate for studying their association with yield of sugar per acre, previous research by many workers, including Legendre et a_l. (36), has shown that most of these traits are not affected greatly by soil heterogeneity; however, in all cases the measurements obtained for these traits represented means of two or more samples taken from a single plot, as described in Materials and Methods.
The general means and ranges among means of theclones for yield of sugar per acre and its components areshown in Table l. Ranges among the latter five traits were comparable to those for the characters described earlier where an analysis of variance was conducted, providing

Table 1. General means and mean ranges for yield and yield components.
Characters studied General Mean range 2/means W —
Yield of sugar per acre 3/Yield of cane per acre 37 Yield of sugar per ton 7/Number millable stalks
per acre 3/Weight per stalk 3/Stalk length 4/Stalk diameter 4/Brix 4/Sucrose percent 4/Purity 4/
7,828 3,108 - 13,19340.1 15.8 - 63.5193 133 - 239
33,063 15,972 _ 49,2072.46 1.34 — 4.0676 45 - 9625.5 20.1 - 34.216.9 14.2 — 19.714.1 10.7 - 17.183 71 - 91
1/ Indicates general means for the 80 entries in the experiment. 7/ Lowest and highest means for the 80 entries in the experiment. 3/ Experimental data collected from three replications.Z/ Experimental data collected from one replication.
80
evidence on wide genetic diversity among the 80 clones and varieties in respect to length per stalk, diameter per stalk, brix, sucrose percent, and purity.
Before considering the associations between yield of sugar per acre and its components, it is important that consideration be given to the reliability of the yield data for the individual clones since this will affect interpretation of the associations. it should be emphasized that the yields were obtained from a single experiment. Although recognized principles of good field plot technique were followed carefully in conducting the experiment several unavoidable factors are known to exist which influence the reliability of the yields obtained as indicators of the relative performance of the clones as an average of many experiments, involving different locations and seasons.
One factor of considerable importance is that the experimental material represented the plant cane crop. It is recognized that many experimental clones yield well in plant cane but are only mediocre or poor in stubble crops. Consequently, it can be assumed that some of the clones which produced high yields of sugar per acre in the present experiment would not have produced high average yields if stubble crop data had been included. However, in sugarcane breeding programs the initial selection for high yielding ability is made from plant cane data, and it can be assumed that yields in the plant cane crop are correlated
a i
strongly with yields in stubble crops. clones with low yields in plant cane will also produce low yields in stubble crops.
A second factor affecting reliability of the yield data is that they were obtained from a single experiment.It is a well established fact that strong interactions occur between varieties and various environmental conditions such as rainfall, temperature and soils and that only yield data for varieties representing numerous experiments at different locations and years can be considered as highly reliable evidence of the potential yielding ability as agricultural varieties. However, such extensive testing is not feasible for basic research of the nature Involved in the present study.
Due to the limitations described in the preceding paragraphs, any expressions of yield components which were associated with high yielding ability should be interpreted with considerable caution. Many of the clones which were high yielding in this single experiment would not be superior in stubble crops and in other tests in plant cane.On the other hand it does appear probable that yield component expressions which were associated with low yielding ability in the present study can be used reliably in discarding clones which are low or mediocre in yielding ability. clones which produced low yields in the present study would undoubtedly not produce satisfactory yields under most other conditions.
82The association of yield of sugar per acre with each
of its components that were measured in this study was investigated through calculations of correlation coefficients.
Two types of correlation coefficients were calculated where measurements were made on each of the replicated plots for the 80 clones. The types of correlation coefficients computed were: phenotypic and genotypic.
The phenotypic correlation coefficient indicates the tendency for two variables to vary together due to both genotypic and environmental variation; however, since the means of the three replications were used in calculating these phenotypic correlation coefficients, it is probable that they were determined primarily by genetic variation.
The genotypic correlation coefficient is calculated in a manner to eliminate the influence of environmental variation. It thus measures the tendency for two variables to vary together through genetic variation alone.
Normally, if environmental variation had affected the phenotypic correlation coefficient, it would have caused the phenotypic correlation coefficient to differ appreciably from the genotypic correlation coefficient, in this study, the phenotypic and genotypic correlation coefficients were of approximately the same magnitude. This close similarity between the genotypic r values for yield of sugar per acre and its components is not surprising and probably means only that the so-called phenotypic r value.
83being based on means of three replications for each trait, is almost entirely a measure of the genetic association. Therefore, the strong similarity between the phenotypic and genotypic r values probably does not indicate absence of environmental association between yield of sugar per acre and its components.
Basically, the number of pounds of sugar that can be produced per acre is dependent upon two general constituents or components: (1) number of tons of cane produced per acre and (2) number of pounds of sugar obtainable per ton of cane. It is possible, through plant breeding, to develop varieties which are improved in both components.
Phenotypic and genotypic correlation coefficients between yield of sugar per acre with yield of cane per acre, yield of sugar per ton of cane, number of millable stalks per acre, and mean weight per stalk are shown in Table 2.
The genotypic correlation coefficient between yield of sugar per acre and yield of cane per acre, .90, is positive, significant and approximately the same magnitude as the phenotypic correlation coefficient, .92. it is very high and indicates a very close association between yield of sugar per acre and this component.
The association between yield of sugar per acre and yield of cane per acre is also presented as a scatter diagram in Figure 1. An examination of Pigure 1 Indicates, as expected, an almost straight line function between the
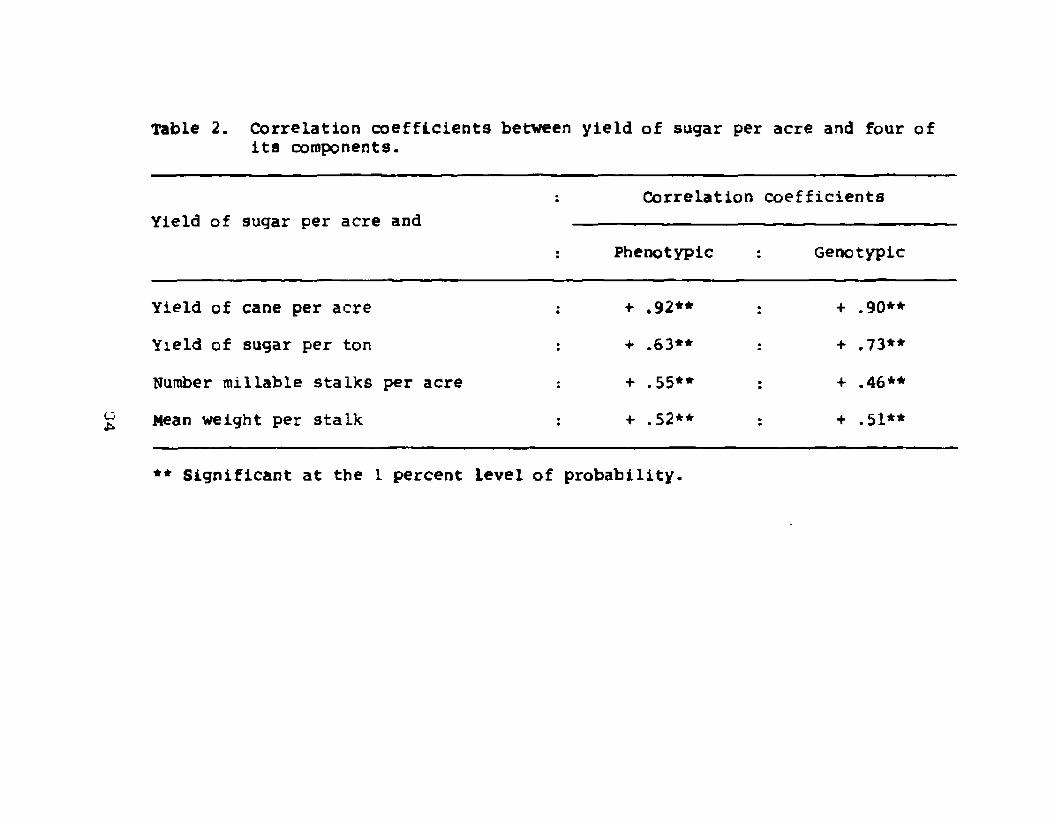
Table 2. Correlation coefficients between yield of sugar per acre and four of its components.
Yield of sugar per acre andCorrelation coefficients
Phenotypic : Genotypic
Yield of cane per acre + .92** : + .90**Yield of sugar per ton + .63** : + .73**Number millable stalks per acre + .55** : + .46**Mean weight per stalk + .52** : + .51**
** Significant at the L percent Level of probability.
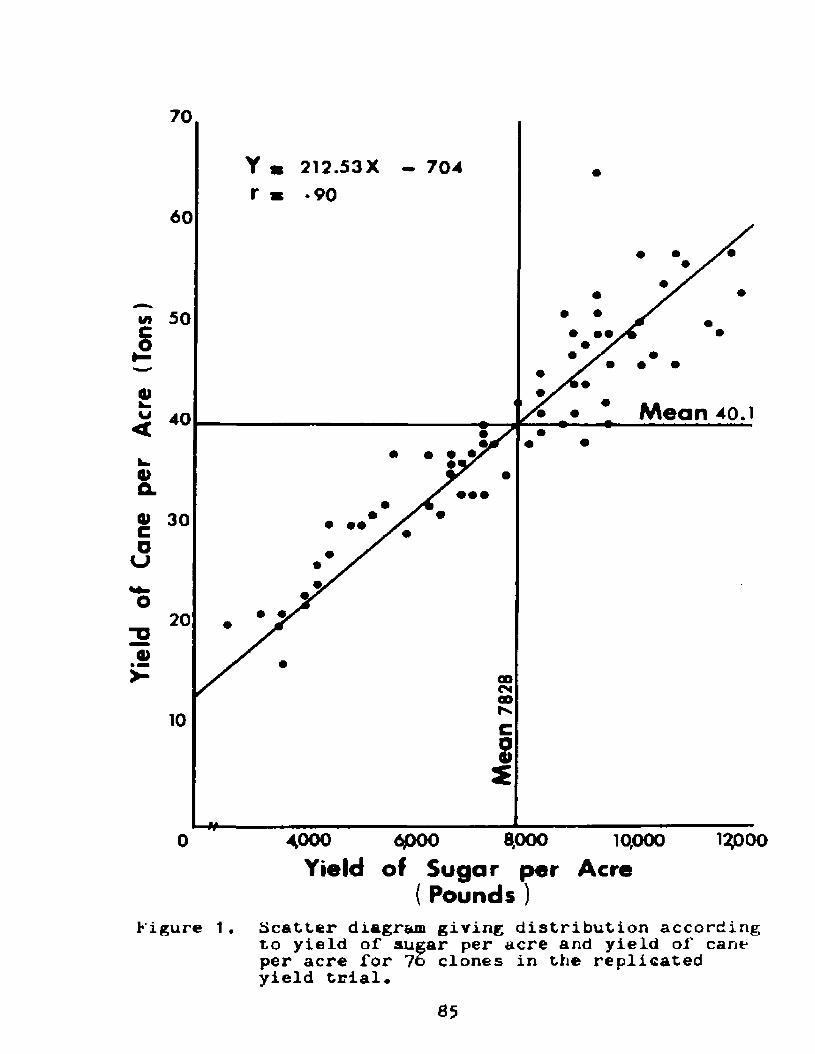
Yield
of
Cane
pe
r Ac
re (T
ons)
70
Y m 2 1 2 .5 3 Xr * *90
7 0 4
6 0
5 0
4 0
3 0 • ••
20
coCMGO
8,000 10,00040000Yield of Sugar per Acre
( P o u n d s)Figure 1* Scatter diagram giving distribution according
to yield of sugar per acre and yield of cane per acre for 7o clones in the replicated yield trial.
85
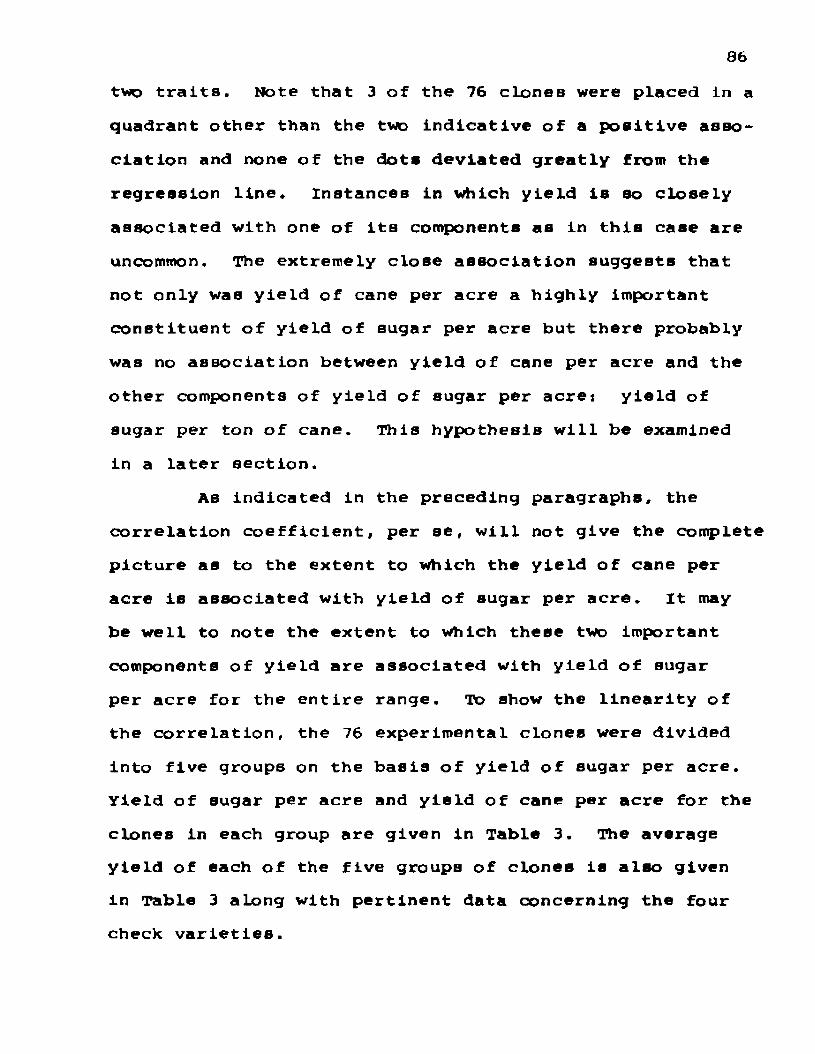
86two traits. Note that 3 of the 76 clones were placed in a quadrant other than the two indicative of a positive association and none of the dots deviated greatly from the regression line. instances in which yield is so closely associated with one of its components as in this case are uncommon. The extremely close association suggests that not only was yield of cane per acre a highly important constituent of yield of sugar per acre but there probably was no association between yield of cane per acre and the other components of yield of sugar per acre* yield of sugar per ton of cane. This hypothesis will be examined in a later section.
As indicated in the preceding paragraphs, the correlation coefficient, per se, will not give the complete picture as to the extent to which the yield of cane per acre is associated with yield of sugar per acre. it may be well to note the extent to which these two important components of yield are associated with yield of sugar per acre for the entire range. To show the linearity of the correlation, the 76 experimental clones were divided into five groups on the basis of yield of sugar per acre. Yield of sugar per acre and yield of cane per acre for the clones in each group are given in Table 3. The average yield of each of the five groups of clones is also given in Table 3 along with pertinent data concerning the four check varieties.
Table 3. Yield characteristics of the 4 check varieties and 76 experimental clones in the replicated yield trial.
Sugar per Yield of Sugar per Number Mean MightClone acre cane per ton of cane stalks per stalk
(pounds) acre (tons) (pounds) per acre (pounds)Average all clones in test
7,828 40.1 193 33,063 2.46
ChecksC.P.33-224 5,235 27.1 190 20,247 2.66C.P.48-103 8,588 37.7 228 27,765 2.75C.P.44-101 8,541 41.2 207 29,282 2.34C.P.52-68 10,977 48.2 2 28 35,574 2.71
Group I. Sixteen clones lowest in yield of sugar per acre.97 2,653 19.9 133 18,553 2.21100 3,108 21.0 148 31,621 1.34142 3,543 20.6 172 15,972 2.58162 3,642 15.8 230 20,489 1.5214 3,930 22.8 173 27,346 1.6722 4,017 21.7 185 16,859 2.5921 4,119 26.3 157 20,347 2.604 4,251 23.8 179 23,071 2.04
40 4,432 30.2 146 39,527 1.5552 4,433 26.9 165 33,315 1.6283 4,779 29.6 162 27,507 2.17197 5,018 30.3 166 29,605 2.05
continued
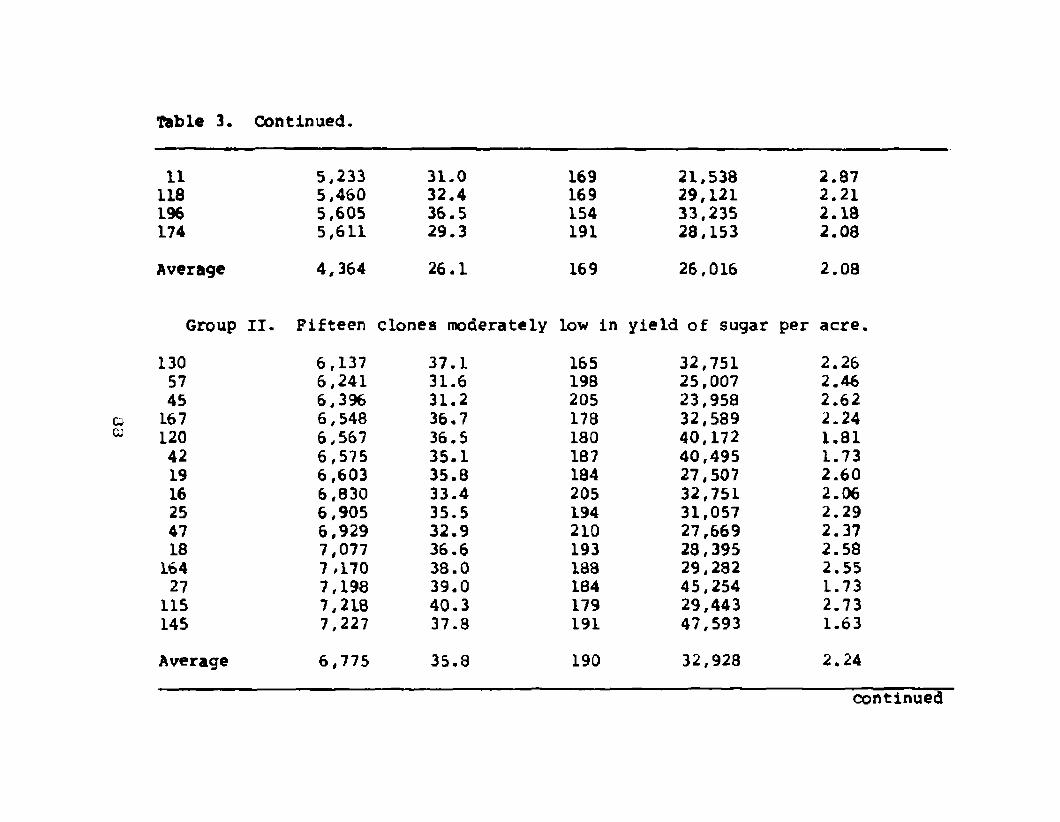
Table 3. Continued.
11 5,233 31.0118 5,460 32.4196 5,605 36.5174 5,611 29.3Average 4,364 26.1
Group II. Fifteen clones moderately
130 6,137 37.157 6,241 31.645 6,396 31.2167 6,548 36.7120 6,567 36.542 6,575 35.119 6,603 35.816 6,830 33.425 6,905 35.547 6,929 32.918 7,077 36.6
164 7 *170 38.027 7,198 39.0115 7,218 40.3145 7,227 37.8Average 6,775 35.8
169 21,538 2.87169 29,121 2.21154 33,235 2.18191 28,153 2.08169 26,016 2.08
low in yield of sugar per acre.
165 32,751 2.26198 25,007 2.46205 23,958 2.62178 32,589 2.24180 40,172 1.81187 40,495 1.73184 27,507 2.60205 32,751 2.06194 31,057 2.29210 27,669 2.37193 28,395 2.58138 29,282 2.55184 45,254 1.73179 29,443 2.73191 47,593 1.63190 32,928 2.24
continued
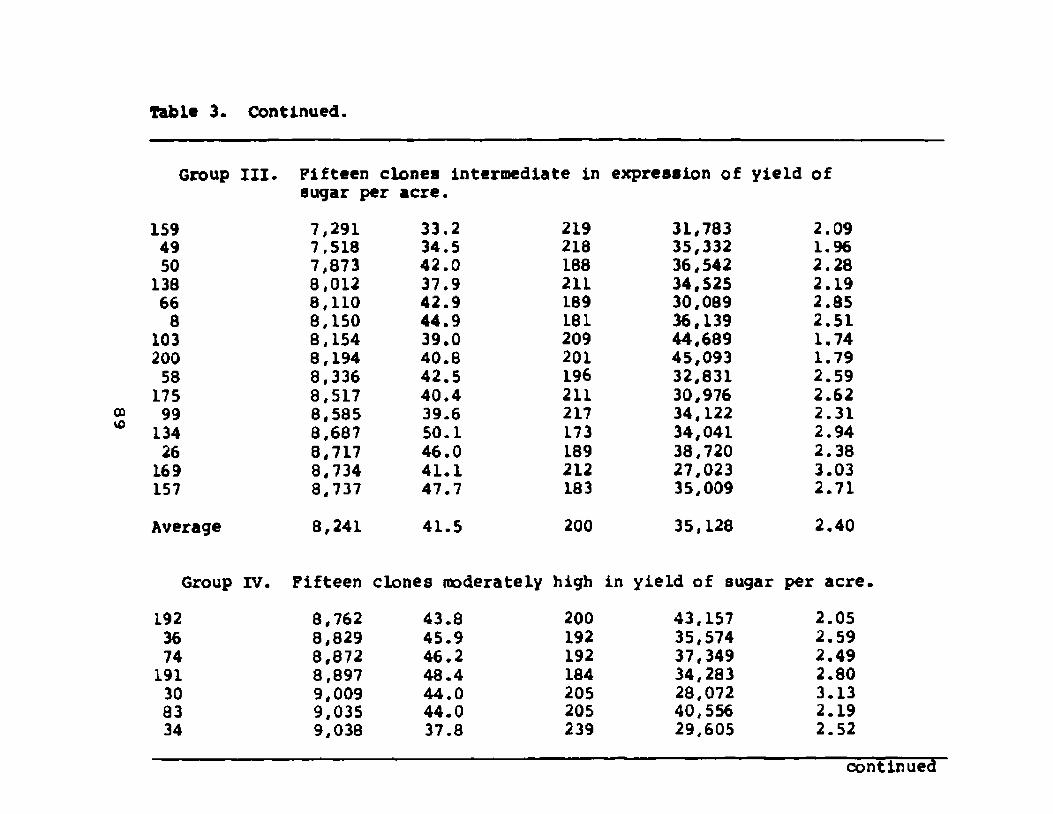
Table 3. Continued.
Group III. Fifteen clones intermediate in expression of yield of sugar per acre.
159 7,291 33.2 219 31,783 2.0949 7,518 34.5 218 35,332 1.9650 7,873 42.0 188 36,542 2.28138 8,012 37.9 211 34,525 2.1966 8,110 42.9 189 30,089 2.858 8,150 44.9 181 36,139 2.51
103 8,154 39.0 209 44.689 1.74200 8,194 40.8 201 45,093 1.7958 8,336 42.5 196 32,831 2.59175 8,517 40.4 211 30,976 2.6299 8,585 39.6 217 34,122 2.31134 8,687 50.1 173 34,041 2.9426 8,717 46.0 189 38,720 2.38169 8,734 41.1 212 27,023 3.03157 8,737 47.7 183 35,009 2.71Average 8,241 41.5 200 35,128 2.40
Group IV. Fifteen clones moderately high in yield of sugar per acre192 8,762 43.8 200 43,157 2.0536 8,829 45.9 192 35,574 2.5974 8,872 46.2 192 37,349 2.49191 8,897 48.4 184 34,283 2.8030 9,009 44.0 205 28,072 3.1383 9,035 44.0 205 40,556 2.1934 9,038 37.8 239 29,605 2.52
continued

Table 3. Continued
12 9,068 47.438 9,178 47.885 9,221 51.628 9,244 50.1127 9,247 63.5117 9,331 45.2140 9,338 39.671 9,345 42.4
Average 9,094 46.5
Group V. Fifteen clones highest i7 9,404 47.9
110 9,747 47.59 10,021 44.653 10,077 56.2
173 10,112 45.7144 10,452 52.923 10,541 55.889 10,566 45.4152 10,702 55.0129 10,901 48.5
5 11,192 47.6166 11,462 56.035 11,565 52.470 12,782 59.1193 13, 193 56.9Average 10,848 51,4
191 33,880 2.80192 34,929 2.74179 26,378 3.92134 29,282 3.42146 32,347 3.91207 38,963 2.34236 34,122 2.30220 42,027 2.07198 34,702 2.75
yield of sugar per acre.196 38,720 2.48205 42,753 2.22225 32,993 2.71179 27,588 4.06221 32,186 2.83198 32,751 3.30189 29,605 3.76233 36,784 2.46195 45,173 2.43225 49,207 1.98235 31,218 3.02205 39,607 2.33221 38,075 2.74216 35,251 3.39232 43,237 2.61212 37,010 2.85

91As expected, several of the experimental clones,
which had not been subjected to any selection, were extremely low in yield of sugar per acre when compared with the four check varieties (Note clones In Group I, Table 3). However, the fact that several of the 76 randomly chosen clones were exceptionally high in yield of sugar per acre in comparison with the check varieties is surprising. More than 30 of the unselected clones had yields as high as or higher than the C.P.48-103 parent. This unexpectedly high number of clones with yields of sugar per acre as high as that of the high yielding parent of the cross can be traced to their exceptionally high yields of cane per acre, and this in turn was caused by unusually high numbers of stalks per acre. in fact, more than half of the clones had average numbers of stalks per acre which exceeded the higher C.P. 48-103 parent. The effect of the unusual number of clones with higher yields of sugar per acre than expected on the association between this trait and its component yield of cane per acre is unknown but probably not serious.
The very strong and highly linear association between yield of sugar per acre and yield of cane per acre is readily apparent in Table 3. Note that the means of the five groups of clones, which are arranged in ascending order based on their yields of sugar per acre, in respect to tons of cane per acre are 26.1, 35.8, 41.5, 46.5, and 51.4 tons. Without exception, the 16 clones which were lowest in yield of
92
sugar per acre (Group I) were also low in yield of cane per acre, while the 15 clones which were highest in yield of sugar per acre were also very high in tons of cane per acre. All clones which produced less cane per acre than C.P.48-103 appeared to be inferior in yield of sugar per acre. A few clones produced relatively high yields of cane per acre yet only mediocre in yield of sugar per acre, but such clones were uncommon.
In a sense the strong association between yield of sugar per acre and yield of cane per acre merely confirms what has been known and practiced in sugarcane breeding programs for many years: the importance of high yield ofcane per acre as an objective and a selection criterion in sugarcane breeding. However, the strength of the association might be used as a basis for emphasizing two conclusions. One is that clones in line trials should be selected rigidly for all other traits than yield of cane in order to make certain that the few which can be entered into yield trials are acceptable in all other respects. This will permit selection for high yield among a maximum number of clones. it also emphasizes the importance of selecting in single stools and line trials for any yield components which are associated with yield of cane per acre and possess high enough heritability to permit effective selection.This would assure that the small number of clones placed into yield trials would include a greater frequency of high
93yielding clones than a randomly chosen group.
Hie other basic component of yield of sugar per acre, sugar per ton of cane, was also found to be correlated significantly and positively with yield of sugar per acre. The .73 genotypic correlation coefficient (Table 2) indicated that yield of sugar per acre was dependent upon the amount of sugar found per ton of cane to a large extent. Again, it will be important to find if this close association is found throughout the range of both yield of sugar per acre and yield of sugar per ton of cane.
The correlation coefficient of .73 between yield of sugar per acre and sugar per ton of cane shows a close relationship among the clones for this component also.There obviously was a strong tendency for clones with high sugar per ton of cane to produce high yields of sugar per acre and for those low in sugar per ton of cane to produce low yields.
The association between these traits is presented as a scatter diagram in Figure 2. The scatter diagram provides additional confirmation of the strong positive association. Only 21 of the 76 clones are in the two negative quadrants.
Data on pounds of sugar per ton of cane for each of the 76 clones are given in column 4 of Table 3. Eleven of the clones had averages for sugar per ton of cane of 225 poundB or higher and might be considered equal to the high
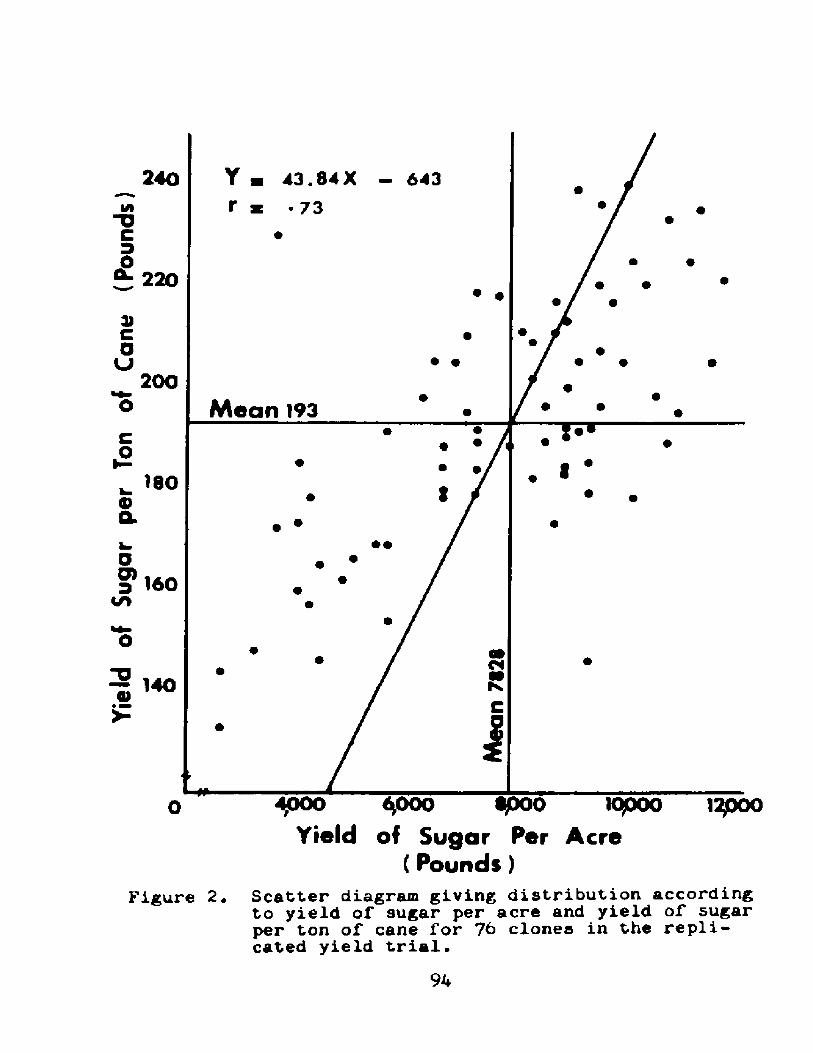
Yield
of
Suga
r pe
r To
n of
Cane
(P
ound
s)
240 4 3 . 8 4 X 6 4 3
220
200M ean 193
180
160
<Na*K140
4000 4000Yield of Sugar Per AcrePer
( Pounds)Figure 2. Scatter diagram giving distribution according
to yield of sugar per acre and yield of sugar per ton of cane for 76 clones in the replicated yield trial.

95parent, C.P.48-103. Seven of these clones were In Group V, the highest yielding clones in sugar per acre, and 3 clones were in Group IV, the second highest yielding clones. Thus, only 1 of the 11 high sugar per ton of cane clones could be considered as unacceptably low in yield of sugar per acre.
Although the correlation coefficient between yield of sugar per acre and sugar per ton of cane was not as high as that discussed previously between yield of sugar per acre and yield of cane per acre, the association is probably as important in the development of varieties which excel in yield of sugar per acre. High levels of sugar per ton of cane can be selected effectively at early stages in a breeding program, through sucrose percent and brlx determinations, while highly effective selection for satisfactory yield of cane per acre cannot be carried out until the yield trial stage is reached. Due to the known differences between yield of cane per acre and sugar per ton of cane, it is essential that selection be practiced first for high sugar per ton of cane.
It should be pointed out that several of the highest clones in yield of sugar per acre, (Group V, Table 3), were only intermediate or low in sugar per ton of cane. Examples are clones 166, 152, 23, 144, and 53. These clones produced high yields of sugar per acre despite their mediocre to low sugar per ton of cane because of very high yields of cane per acre and the predominant Influence of this component on

96yield of sugar per acre. However, of the two components of sugar per acre, the yield of cane per acre determined in this single experiment involving the plant cane crop is a considerably less reliable Indication of the potential performance of the clones in both plant cane and stubble crops over a period of years at different locations in the sugarcane producing areas of the state. Consequently, it is probable that high yield of sugar per acre in the single experiment Involved here due in part to high sugar per ton of cane, shown by such clones as 193, 35, 5, 129, and 89, is a more reliable indication of potential performance of the clones as varieties than that of the clones having exceptionally high yield of cane per acre and low sugar per ton of cane.
Furthermore, even if two clones, such as 89 and 23 in Group V, Table 3, proved on further testing to be identical in yield of sugar per acre, clone 89 with high sugarper ton of cane would be preferable as a variety of sugarcane for several reasons. The grower and processor would have to handle less cane of clone 89. The yield of sugarper acre of clone 89 should prove more stable over widelyvarying environmental conditions due to locations and years than that of clone 23 since its yield of sugar per acre is affected more strongly by the relatively stable component sugar per ton of cane.
Although the stage at which selection should be

97practiced for the two components of yield of sugar per acre should differ somewhat, with the strongest selection exerted for high sugar per ton of cane during the single stool and Line trial stages and the strongest selection for high yield of cane per acre Limited of necessity to the yield trial stage, it is apparent from the strong association between yield of sugar per acre and each of its components that at some point in a breeding program rigid selection should be practiced for both components. Obviously, the maximum attainable yield of sugar per acre in a new variety will have to be the result of a combination of the maximum attainable yield of cane per acre and the maximum attainable sugar per ton of cane. it appears that this combination essential for maximum yield of sugar per acre can most likely be reached by starting with progenies from crosses in which one parent represents the maximum currently available germ plasm for yield of cane per acre and the other parent represents the maximum currently available germ plasm in respect to sugar per ton of cane. Then, rigid selection should be practiced in the single stool, first and second line trial stages for a level of sugar per ton of cane at least as high as that of the high parent in respect to this component. At these early stages this selection will have to be done for high sucrose percent and/ or brix. During this period there should also be some degree of selection for any plant characteristics which are known

98to be associated positively with high yield of cane per acre. The result of this phase of selection should be the development of a moderate number of clones which already possess the highest sugar per ton of cane attainable from the crosses. These would finally be tested extensively in the infield and outfield yield trial programs in order to Identify the clones with the highest attainable yield of cane per acre.
The importance of both cane per acre and sugar per ton of cane in yield of sugar per acre can be illustrated by experiences with certain varieties and experimental clones in sugarcane production and the breeding programs.The variety C.P.44-101 was formerly a major variety in Louisiana and for several years was grown on a larger acreage than any other variety. It is not recommended for planting at present and its percentage of the acreage had dropped in 1969 to only 4%. This change in status of C.P. 44-101 has occurred despite the fact that in yield trials it still yields as much or more cane per acre as any new variety. The sugar per ton of cane of C.P.44-101 is lower than in the newer varieties causing it to produce less sugar per acre. Thus, the development and release of varieties having higher sugar per ton of cane but no higher yield of cane per acre has led to the replacement of C.P.44-101.
The continuing importance, though, of a capacity for high yield of cane per acre among sugarcane varieties
99is demonstrated by recent experiences in the varietal testing program with such experimental clones as L.61-67 and C.P. 61-39. These clones were extremely high in sugar per ton of cane. However, they were somewhat low in yield of cane per acre and consequently, were not released as varieties due to the effect of this deficiency on their yield of sugar per acre.
The component of yield of sugar per acre designated yield of cane per acre is itself a complex, being composed of number of millable stalks per acre and average weight per stalk. Since yield of cane per acre was associated strongly with sugar per acre, it is of Interest and Importance to examine the association of each of these components of yield of cane per acre with sugar per acre.
The genotypic correlation coefficient between yield of sugar per acre and number of millable stalks per acre,.46, as shown in Table 2 was positive, significant and moderate in magnitude, indicating a genetic association of some importance. In Table 3, it can be seen that the association is even more pronounced at the extremes as in Group 1 where the average yield of sugar per acre was only 4,364 pounds, the average number of millable stalks was 26,016* For Group 5 the average yield of sugar per acre was 10,846 pounds while the average number of millable stalks was 37,010. In the intermediate groups there was considerable overlap of expression causing the correlation
100coefficient to be somewhat lower than might have been expected. Since the association between yield of sugar peracre and number of stalks per acre is caused directly by therelationship of yield of cane per acre to each of these, the correlation between yield of sugar per acre and number of stalks per acre will not be examined in detail. instead it will be considered in a later section througn the association of yield of cane and number of stalks per acre.
The genotypic correlation coefficient between the yield of sugar per acre and mean weight per stalk, .51, was moderate and significant. The magnitude of the coefficient of correlation between these two traits was approximately the same as the correlation coefficient between number ofmillable stalks per acre and yield of sugar per acre. Thus,the data suggest that the components of yield of cane per acre - number of millable stalks and weight per stalk - showed similar moderate genetic association with sugar per acre.
In examining Table 3, it can be seen that for Group 1 the average weight per stalk was 2.08 pounds while for Group 5 the average weight per stalk was 2.85 pounds. The average for all clones was 2.46 pounds. However, if only an observation were made as to the range of each group, erroneous conclusions could be drawn.
Like number of millable stalks per acre, the mean weight per stalk influences yield of sugar per acre through

101the fact that it is a component of yield of cane per acre. Consequently, a more detailed discussion of this association will be given later in considering the relationship between yield of cane per acre and average weight per stalk.
Correlation coefficients between yield of sugar per acre and five other traits which can be considered as components of yield are presented in Table 4. Because these traits are not influenced greatly by the environment, data were collected for each from one replication only, and, therefore only phenotypic correlation coefficients could be calculated for these traits. it is felt, however, that since the measurement of each trait involved several stalks, the phenotypic correlation coefficients in Table 4 probably represent reliable estimates of the genetic association between yield of sugar per acre and each of the traits in- volved.
The traits mean length per stalk and mean stalk diameter are more specifically components of average weight per stalk. Consequently, their associations with yield of sugar per acre will be dealt with only briefly in this section, and a detailed consideration of them will be given later.
The moderately high, positive correlation coefficient of .61 between yield of sugar per acre and mean length per stalk Indicates an important relationship, probably due to the association between mean length per stalk and yield
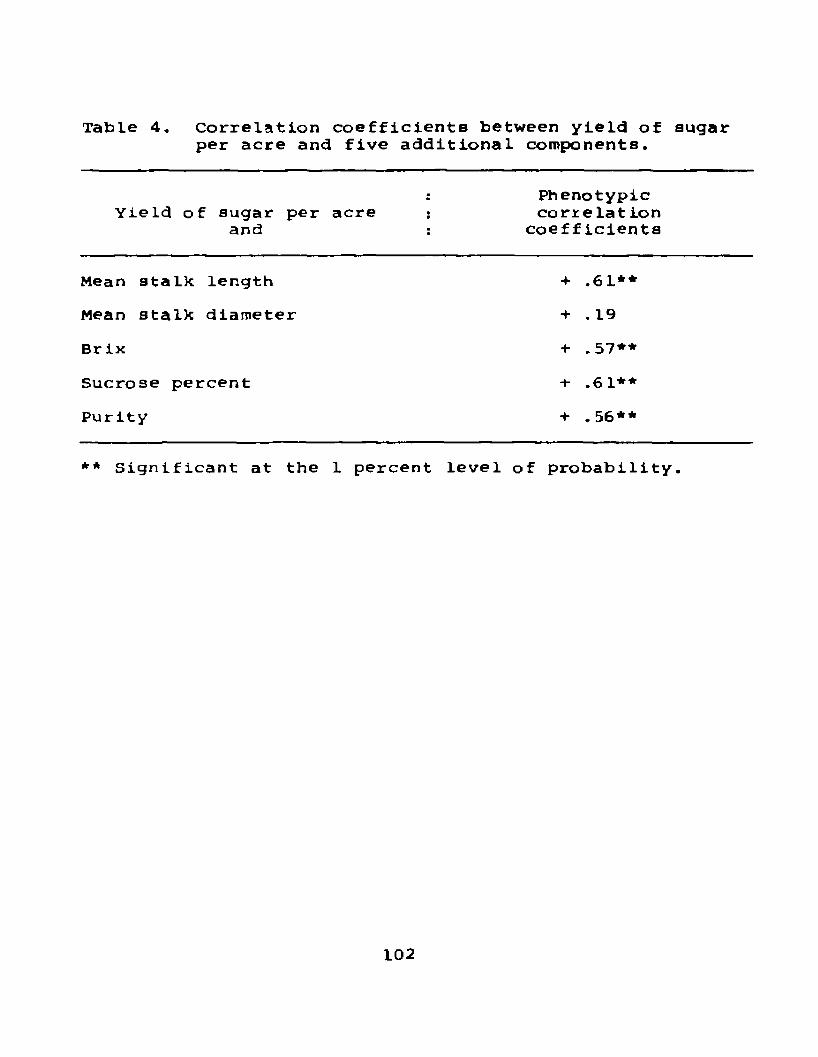
Table 4. Correlation coefficients between yield of sugar per acre and five additional components.
Yield of sugar per acre : and :
Phenotypic correlat ion
coefficients
Mean stalk length + .61**Mean stalk diameter + . 19Br ix + .57**Sucrose percent + .6 1**Purity + .56**
** Significant at the 1 percent level of probability.
102

103of cane per acre. On the other hand, the correlation coefficient between yield of sugar per acre and mean diameter per stalk was low and non-significant, providing evidence that this trait was not associated with yield of sugar per acre.
As shown in Table 4, there were moderately strong, positive correlations between yield of sugar per acre and the three traits involved in quality of the juice: brix,sucrose percent and purity. Since these Juice quality traits can be evaluated at early stages in the breeding program with large numbers of plants or clones, the correlation coefficients are highly important. However, these juice quality traits exert their effects on the yield of sugar per acre through their relationship to sugar per ton of cane* Consequently, these correlation coefficients will also be dealt with in a later section involving the association of juice quality with sugar per ton of cane.
In summary, it should be pointed out that yield of sugar per acre for the 76 clones was found to be correlated positively and to an important degree with several traits for which selection can be made effectively among large numbers in the single stool and/or line trial stages. These traits include mean weight per stalk, mean length per stalk, sucrose percent, and brix. The moderate positive correlation between yield of sugar per acre and number of millable stalks per acre also focuses attention on this yield component and
104indicates a need for experimental evidence on the effectiveness with which selection can be made for this trait in the first and second line trial stages. On the other hand, the correlation coefficients suggest that selection for large diameter per stalk would not be effective in obtaining clones with higher than average yield of sugar per acre.
Association Between Yield of Cane per Acre and Its Components
In the replicated yield trial described under Materials and Methods, the 76 experimental clones and four check varieties included in the test were classified in all three replications for yield of cane per acre and for the following yield components: number of millable stalks per acreand mean weight per stalk. As stated earlier in the Results section, an analysis of variance was calculated for each trait in order to determine whether sufficient genetic variation occurred among the experimental clones to permit detection of genetically controlled associations between yield of cane per acre and these components. For each trait a significant F value was found for the treatment, or among clones, value in the analysis of variance, providing statistical proof that a detectable degree of genetic variation occurred among the clones for each character.
Also, the following components of yield of cane per acre were measured for each of the 80 clones and varieties in the yield trial but only in one of the replications:

105mean length per stalk and mean diameter per stalk. As stated, earlier in the Results section, due to the nature of these two characters, it was felt that data from only one replication would be adequate for studying their association with yield of cane per acre. The general means and ranges among means of the clones for yield of cane per acre and its components provides evidence of wide genetic diversity among the 80 clones and varieties in respect to length of stalk and diameter of stalk.
It was shown in the previous section that yield of cane per acre was highly correlated with yield of sugar per acre; therefore, since the sugarcane breeder has as a primary objective developing a variety high in sugar per acre, the next step would be to consider the components or constituents of yield of cane per acre which would lead him to obtaining a clone high in tons of cane per acre, consequently, high in yield of sugar per acre.
The basic components or constituents of yield of cane per acre are the number of millable stalks per acre ard mean weight per stalk. However, it can not be assumed that selection for either of these components will be effective in isolating high yielding clones unless an association can be shown among clones in a yield trial.
Phenotypic and genotypic correlation coefficients are shown in Table 5 between yield of cane per acre and number of millable stalks per acre and between yield of cane

Table 5. Correlation coefficients between yield of cane per acre and two of its components.
Yield cane per acre9 Correlation coefficients• Phenotypic : Genotypic
Number millable stalks per acre .54** .42**
Mean weight per stalk .63** .67**
** Significant at the 1 percent level of probability.
106
107
per acre and mean weight per stalk for the 76 experimental clones tested.
The genotypic correlation coefficient between yield of cane per acre and number of millable stalks per acre, .42, was positive, significant, and indicates a moderate association between these traitB. The data suggest that in breeding for high tonnage, it would be important to select for high number of stalks per acre but one must be cautious as not to select only on the basis of stalk number. The correlation coefficient suggests that only part of the clones with high stalk populations were also high in yield of cane per acre.
A scatter diagram showing the association between yield of cane per acre and number of stalks per acre is given in Figure 3. It is readily apparent from Figure 3 that a tendency occurred for clones which were low in number of stalks per acre to also be low in yield of cane per acre while clones high in stalk population tended also to have high yield of cane. For example, approximately three- fourths of the clones above average in number of stalks per acre were also above average in yield of cane. However, it is also apparent from Figure 3 that the association between yield of cane and stalk population was not complete and that some of the high stalk population clones did not produce high yield of cane.
In order to investigate the association between yield

Num
ber
of M
illab
le
Stalk
s pe
r A
cre
Y s . 00074 X + 15.66Q0OCL
4Q0OO
TV
2Q00C
30 50 6040200Yield of Cane per Acre
(Tons)Figure. 3. Scatter diagram giving distribution according
to yield of cane per acre and number of millable stalks per acre for 76 clones in the replicated yield trial.
108
109of cane per acre and number of stalks per acre more thoroughly, the 76 experimental clones are presented In Table 6 arranged in ascending order based on their mean yields of cane in tons per acre. For aid in interpretation, the clones are divided into five groups, also based on yield of cane. The mean yield of cane and the mean number of stalks per acre are given for each clone individually as are the averages for each of the five groups. Yield of cane and number of millable stalks per acre are also presented for the four check varieties, including the parents, C.P.33-224 and C.P.48-103.
As indicated in an earlier section of the Results, the data obtained for the 76 randomly chosen clones was unusual in that more than half of the clones equalled or exceeded c.P.48-103, the higher tonnage parent in yield of cane per acre. it is evident in Table 6 that this unusually high frequency of high yielding clones was caused by a surprisingly high frequency of clones which exceeded both parents in number of stalks per acre. In fact, 50 of the 76 clones produced more than 30,000 mature stalks per acre, while the higher parent, C.P.48-103, had only 27,265 stalks per acre. Also, the average number of millable stalks per acre for the 76 clones was 33,063. At the same time, the mean weight per stalk, representing the other component of yield of cane per acre, of the 76 clones was not exceptionally high. Mean weight per stalk of the clones
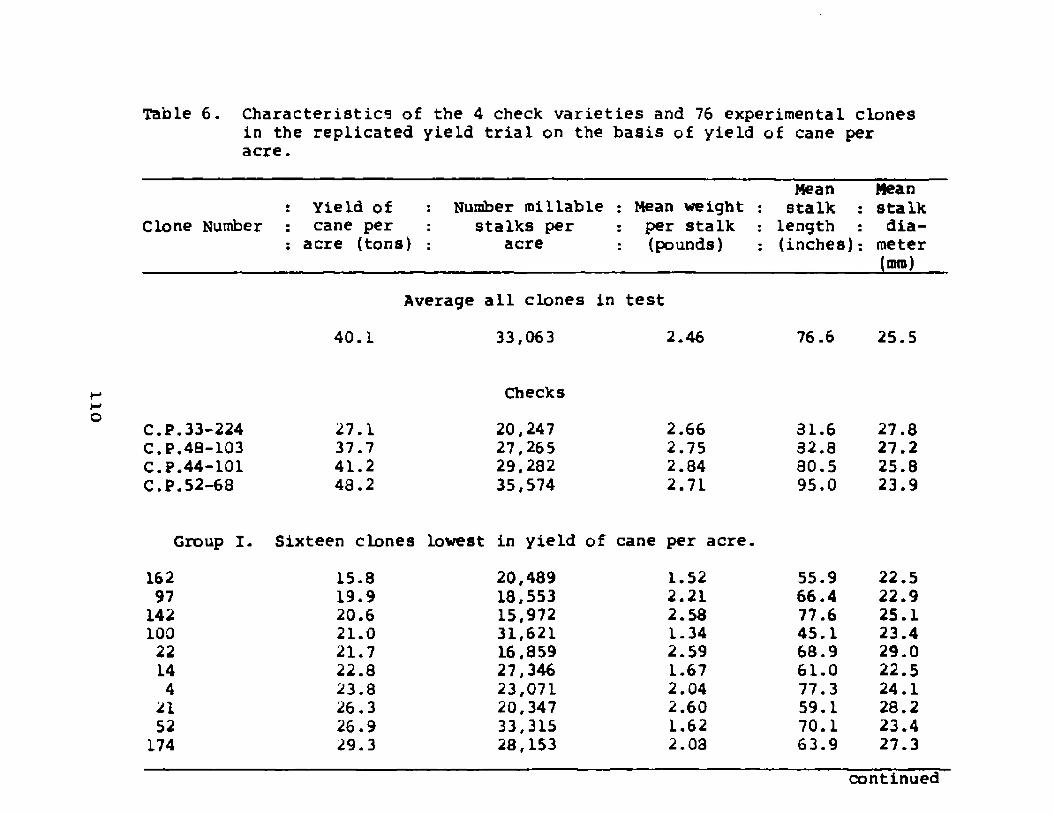
Table 6. Characteristics of the 4 check varieties and 76 experimental clones in the replicated yield trial on the basis of yield of cane per acre.
Mean: Yield of : Number millable Mean weight stalk :
Clone Number : cane per : stalks per per stalk length :: acre (tons) : acre (pounds) (inches);
Meanstalkdia
meter(imp)
Average all clones in test40.1 33,063 2.46 76.6 25.5
ChecksC.P.33-224 27.1 20,247 2.66 31.6 27.8C.P,48-103 37.7 27,265 2.75 32.8 27.2C.P.44-101 41.2 29,282 2.34 30.5 25.8C.P.52-68 43.2 35,574 2.71 95.0 23.9
Group I. Sixteen clones lowest in yield of cane per acre.162 15.8 20,489 1.52 55.9 22.597 19.9 18,553 2.21 66.4 22.9142 20.6 15,972 2.58 77.6 25.1100 21.0 31,621 1.34 45.1 23.422 21.7 16,859 2.59 68.9 29.014 22.8 27,346 1.67 61.0 22.54 23.8 23,071 2.04 77.3 24.121 26.3 20,347 2.60 59.1 28.252 26.9 33,315 1.62 70.1 23.4174 29.3 28,153 2.03 63.9 27.3
continued
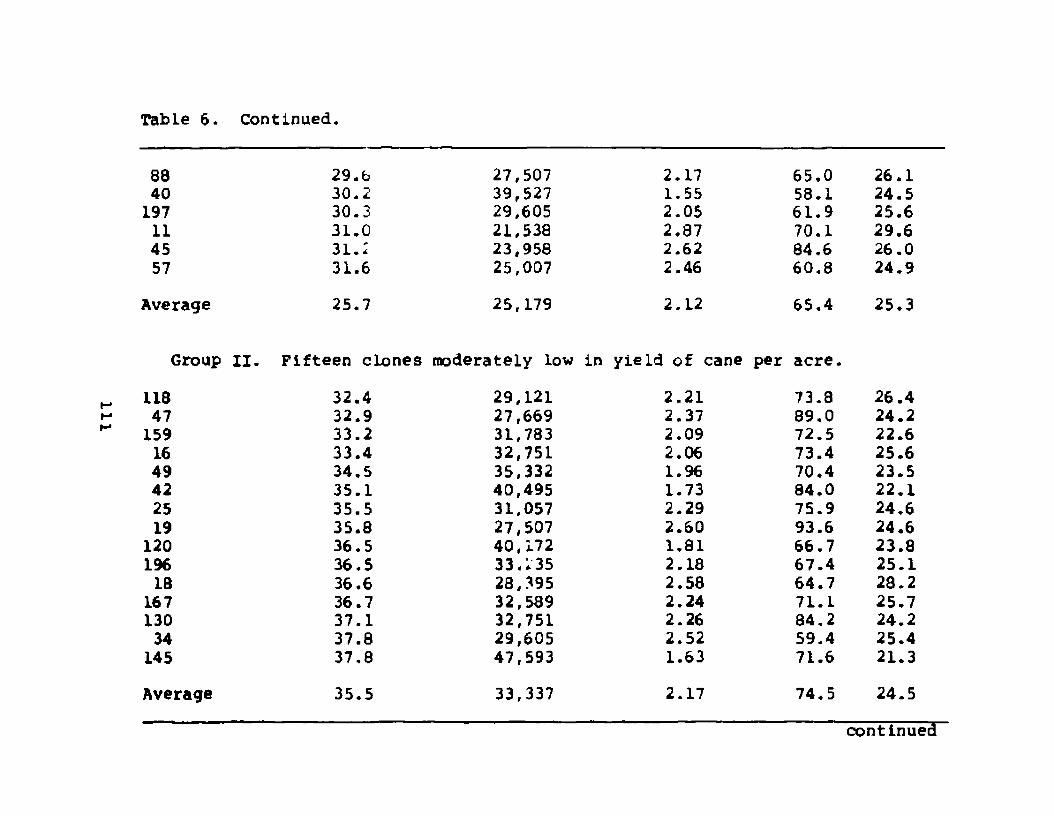
Ill
Table 6. Continued,
88 29. 6 27,50740 30.2 39,527197 30.3 29,60511 31.0 21,53845 31.; 23,95857 31.6 25,007
Average 25.7 25,179
Group II. Fifteen clones moderately low118 32.4 29,12147 32.9 27,669159 33.2 31,78316 33.4 32,75149 34.5 35,33242 35.1 40,49525 35.5 31,05719 35.8 27,507
120 36.5 40,172196 36.5 33.23518 36.6 28,395
167 36.7 32,589130 37.1 32,75134 37.8 29,605
145 37.8 47,593Average 35.5 33,337
2.17 65.0 26.11.55 58.1 24.52.05 61.9 25.62.87 70.1 29.62.62 84.6 26.02.46 60.8 24.92.12 65.4 25.3
in yield of cane per acre.2.21 73.8 26.42.37 89.0 24.22.09 72.5 22.62.06 73.4 25.61.96 70.4 23.51.73 84.0 22.12.29 75.9 24.62.60 93.6 24.61.81 66.7 23.82.18 67.4 25.12.58 64.7 28.22.24 71.1 25.72.26 84.2 24.22.52 59.4 25.41.63 71.6 21.32.17 74.5 24.5
continued
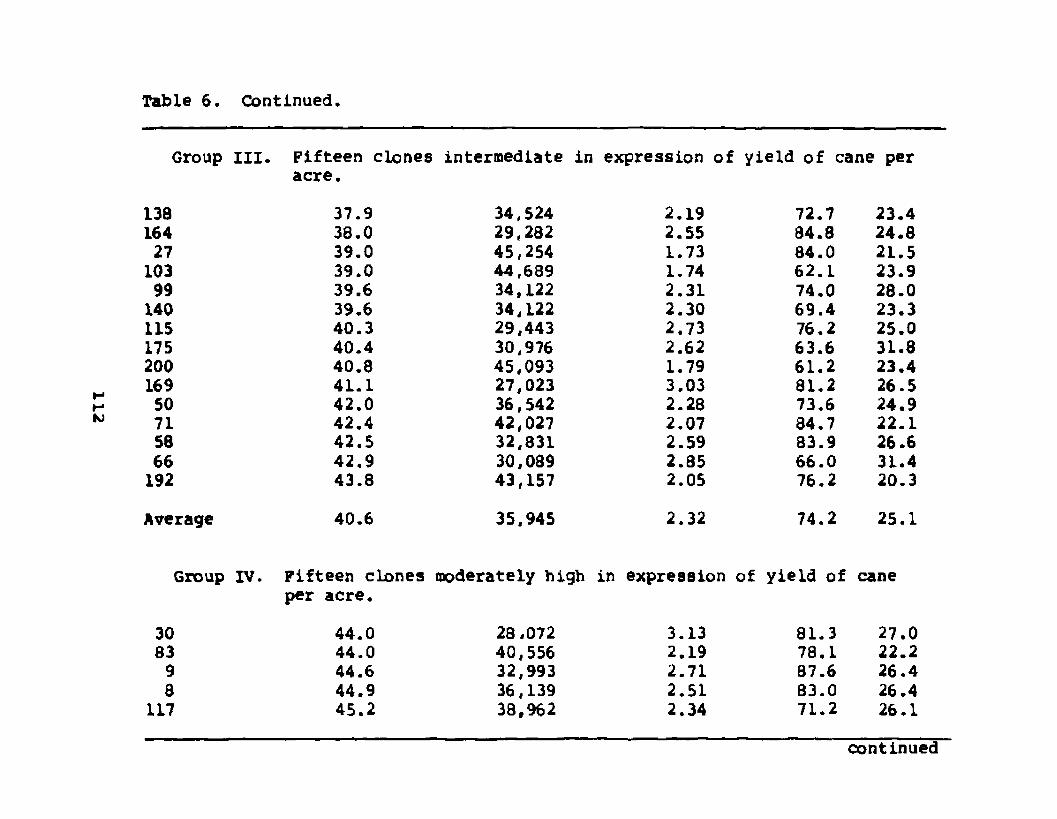
Table 6. Continued
Group III. Fifteen clones intermediate in expression of yield of cane per acre.
138 37.9 34,524 2.19 72.7 23.4164 38.0 29,282 2.55 84.8 24.827 39.0 45,254 1.73 84.0 21.5103 39.0 44,689 1.74 62.1 23.999 39.6 34,122 2.31 74.0 28.0140 39.6 34,122 2.30 69.4 23.3115 40.3 29,443 2.73 76.2 25.0175 40.4 30,976 2.62 63.6 31.8200 40.8 45,093 1.79 61.2 23.4169 41.1 27,023 3.03 81.2 26.550 42.0 36,542 2.28 73,6 24.971 42.4 42,027 2.07 84.7 22.158 42.5 32,831 2.59 83.9 26.666 42.9 30,039 2.85 66.0 31.4192 43.8 43,157 2.05 76.2 20.3
Average 40.6 35.945 2.32 74.2 25.1
Group IV. Fifteen clones moderately high in expression of per acre.
yield of cane
30 44.0 28 *072 3.13 81.3 27.083 44.0 40,556 2.19 78.1 22.29 44.6 32,993 2.71 87.6 26.48 44.9 36,139 2.51 83.0 26.4
117 45.2 38,962 2.34 71.2 26.1continued

cnTable 6. Continued.
89 45.4 36,784 2.46 75.7 24.5173 45.7 32,186 2.83 92.1 26.936 45.9 35,574 2.59 95.4 22.826 46.0 38,720 2.38 96.3 23.774 46.2 37,349 2.49 67.7 25.012 47.4 33,880 2.80 87.3 27.3
110 47.5 42,753 2.22 88.4 25.05 47.6 31,218 3.02 84.2 25.8
157 47.7 35,009 2.71 73.4 27.438 47.8 34,029 2.74 86.8 26.0
Average 46.0 35,675 2.61 84.6 25.5
Group V. Fifteen clones highest in expression of yield of cane per acre.
7 47.9 38,720 2.48 75.5 25.1191 48.4 34,283 2.30 76.4 25.8129 48.5 49,207 1.98 88.1 21.128 50.1 29,282 3.42 86.6 27.3134 50.1 34,041 2.94 75.8 27.885 51.6 26,378 3.92 78.4 34.235 52.4 38,075 2,74 81.1 25.9144 52.9 32,751 3.30 93.0 26.4152 55.0 45,173 2.43 84.9 25.123 55.8 29,605 3.76 87.1 30.7166 56.0 39,607 2.83 90.7 25.753 56.2 27,588 4.06 89.0 32.2193 56.9 43,237 2.61 88.1 25.970 59.1 35,251 3.39 86.2 26.8127 63.5 32,347 3.91 94.4 28.0Average 53.6 35,703 3.10 85.0 27.2
114is also given in Table 6. Note that the average weight per stalk of the experimental clones was 2.46 pounds compared with 2.66 and 2.75 pounds for the parents. The results suggest that a strong degree of hybrid vigor occurred among the progeny of the C.P.48-103 X C.P.33-224 cross in respect to number of millable stalks per acre. The number of these clones that would have continued to produce exceptionally high numbers of stalks per acre in stubble crops is unknown.
The 16 clones with the lowest yields of cane per acre (Group I , Table 6) had a low average number of millable stalks per acre of only 25,179 and 8 of the clones had fewer than 25,000 stalks per acre. Furthermore, only 5 of the 30 higher yielding clones (Groups IV and v, Table 6) had fewer than 30,000 stalks per acre. Thus, if effective selection had been practiced during the line trial stages for high stalk population and, consequently all clones which produced fewer than 30,000 stalks per acre had been discarded, very few clones which were capable of producing high yields of cane per acre would have been lost. This emphasizes the value of selection prior to the yield trial stage for relatively high number of stalks per acre.
On the other hand, the data in Table 6 suggest strongly that rigid selection among clones during the line trial stage for extremely high number of millable stalks per acre would not have had a desirable effect on yield of cane per acre. Note that the average numbers of stalks of clones
115In the Intermediate, moderately high, and highest yielding groups (Groups III, IV, and V, respectively, Table 6) were essentially identical, approximately 35,000 stalks per acre. These results indicate that selection for ability to produce 35,000 or more mature stalks per acre would have eliminated very low yielding clones but would not have tended to eliminate clones with intermediate yields of cane per acre.
In fact, the data in Table 6 suggest that selection for ability to produce extremely high numbers of stalks per acre, 40,000 or higher, would have produced undesirable effects. Thirteen clones produced 40,000 or more mature stalks per acre. With one exception, clone 193 (Group V, Table 6), these extremely high population clones were distinctly lower than the check varieties in mean weight per stalk and most would have been obviously too small in stalk size to have been acceptable as varieties. Note clones 42,120, and 145 of Group II, clones 27, 103, 200,71, and 192 of Group III, clone 83 of Group IV and clone 129 of Group V. The tendency in the clones included in this experiment for those which produced exceptionally high numbers of stalks per acre to have unacceptably small size of stalk - compared to the checks - should be investigated in other crosses. If it proves to be a general phenomenon, it may be desirable to discard clones that are abnormally high in number of stalks per acre.
116As shown in Table 5, there was a moderately strong,
positive association between yield of cane per acre and its other component, mean weight per stalk, with a genotypic correlation coefficient of .67. This indicates that among the 76 clones there was a marked tendency for the high yielding clones to be high in stalk weight and for the low yielding ones to be low in stalk weight. That this was the case is shown by the data on yield of cane per acre and mean weight per stalk of the clones in Table 6. It will be recalled that arrangement of the clones into groups was based on yield of cane per acre, with Group I containing the 16 lowest yielding clones and Group V the 15 highest yielding ones. Note that the mean weight per stalk of Groups I, n , III, IV, and v were 2.12, 2.17, 2.32, 2.61, and 3.10, respectively. Thus, there was a definite tendency for yield of cane per acre of the five groups to be related positively to the mean weight per stalk. Although only 22 of the clones had means for weight per stalk of 2.70 or above, which was the approximate stalk weight of the checks, 11 of these 22 clones were in the highest group - Group V - in respect to yield of cane and another 7 were in Group IV for yield of cane.
There is no doubt that effective selection for mean weight per stalk equal to or above that of the check varieties grown in the test prior to the yield trial would have proved highly effective in discarding clones which proved

117
to have low yield of cane and Keeping ones which proved to have high cane yields. However, there are several factors which complicate interpretation of the correlation between yield of cane and weight per stalk in terms of selection for high stalk weight in a breeding program, one factor is that mean weight per stalk of clones and varieties is influenced strongly by two separate constituents: diameter per stalkand length per stalk. It is distinctly possible that only one of these constituents of mean weight is correlated with yield of cane per acre. If so, this v*>uld not be detectable in the yield of cane per acre and mean weight per stalk data in Table 6, yet it would have an important bearing on selection. A second complicating factor arises from the fact that the data were obtained from the plant cane crop and may not be reliable for drawing conclusions about performance in stubble crops. it is possible, even probable, that exceptionally large weight per stalk of clones is associated with poor yield performance in stubble crops, unpublished data obtained by the Department of Agronomy,Louisiana Agricultural Experiment Station, suggest that clones having exceptionally high weight per stalk may tend to undergo a relatively sharp decrease in stalk weight in stubble crops compared to the stalk weight in plant cane.
The associations between yield of cane per acre and the two constituents of mean weight per stalk, diameter per per stalk and length pejr stalk, were studied in detail for

118the 76 clones. The phenotypic correlation coefficients are presented in Table 7. The correlation coefficient between yield of cane per acre and length per stalX was .66, indicating a moderately strong, positive association, while that with diameter per stalX was positive and significant but low - .30. Thus, the correlation coefficients indicate that an important difference did exist in the degree to which yield of cane per acre was associated with diameter and length per stalX. Interpretation of the association between yield of cane per acre and weight per stalX is obviously complicated by this difference, requiring that these constituents of weight per stalX be considered separately.
Actually, the correlation coefficient between yield of cane per acre and length per stalX was as high as that between yield of cane and weight per stalX. it is apparent from this that essentially all of the association between yield of cane per acre and weight per stalX is due to the effect of stalX length. A scatter diagram of the relationship between yield of cane per acre and length per stalX is presented in Figure 4, and data on the average length per stalX for the 76 clones are given in Table 6.
Hie scatter dlagrar in Figure 4 again indicates the moderately strong relationship between the traits. it suggests, however, that the degree of association was stronger for the clones having shorter than average stalX

Table 7. Correlation coefficients between yield of cane per acre and two other of its components.
Yield of cane per acre Phenotypic correlation coefficients
Mean sta lk length .66 **Mean stalk diameter .30 *
* Significant at the 5 percent level of probability. ** Significant at the 1 percent level of probability.
119
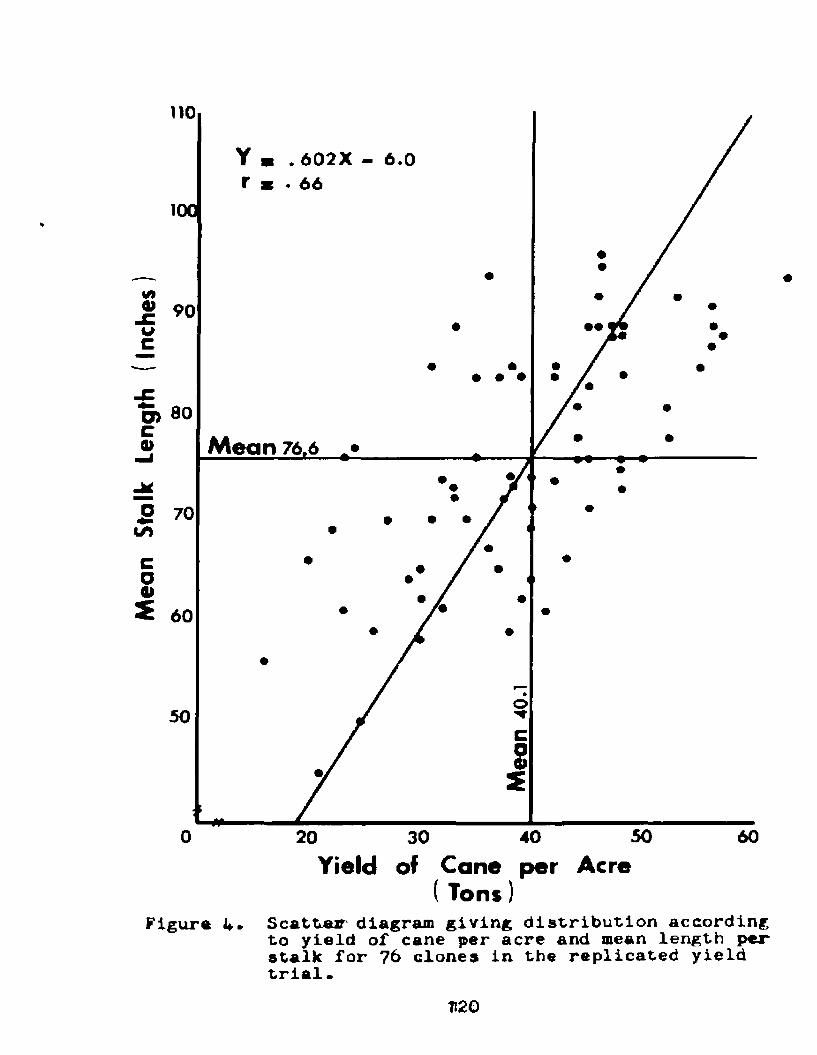
Mea
n St
alk
Leng
th
(inc
hes)
110
m . 6 0 2 X - 6 .0 x • 66
10C
9 0
eoM ean 76.6
70
60
o50
500 3 0 6020 40
Yield of Cane per Acre ( Tons)
figure 4. Scatter- diagram giving distribution according to yield of cane per acre and mean length per stalk for 76 clones in the replicated yield trial•
U20

121
length than for the relatively tall clones. Note that among the taller clones several were below average in yield of cane.
The data on yield of cane per acre and mean stalk length in Table 6 are more informative than the correlation coefficient and the scatter diagram. For one thing, they reveal that although the 76 clones varied widely in mean stalk length, ranging from 45.1 inches for clone 100 to96.3 inches for clone 26, none of the clones would be considered extremely tall. The check variety C.P.52-68 had an average stalk length of 95.0 inches. However, several clones were appreciably taller than the parents of the croBS, both of which are short varieties. It should be emphasized that any conclusions drawn from the 76 clonesin this experiment can be applied only to clones in which the stalk length of the tallest does not exceed that of C.P.52-68. Many of the new experimental clones now being developed in the Louisiana breeding programs are considerably taller than C.P.52-68.
Examination of the clones in Group I, which were the lowest in yield of cane per acre, reveals the very strong tendency for the clones which were most inferior in yield of cane per acre to be exceptionally low in stalk length.The average stalk length of the clones in Group I was only65.4 inches compared to the approximately 82 inch stalk length of the parents. All except one of the 16 clones

122
were short. Groups II and III were similar in average length of stalk, 74.5 and 74.2 inches, respectively, and exceeded Group I by almost 10 inches. However, the average stalk lengths of these two groups, which were moderately low and intermediate in yield of cane per acre, were well below those of the parents and check varieties. it is of some interest that the clones in Group III yielded as much cane per acre as the higher yielding C.P.48-103 parent and more than the C.P.33-224 parent despite the fact that they were on the average 8 inches shorter in stalk length than the parents.This oddity was caused by the relatively high number of stalks per acre. However, there is no interest from the practical standpoint in clones which yield no more cane per acre than C.P.48-103.
The moderately high yielding clones in Group IV and the highest yielding ones in Group V had mean stalk lengths of 84.6 and 85.0 inches, respectively, thus were the tallest groups of clones in the experiment. Furthermore, 17 of the 30 clones in Groups IV and v, were 85 inches or higher in mean stalk length. This frequency may not appear high but is impressive in view of the fact that only 19 of the 76 clones were 85 inches or higher in mean stalk length.
There is one aspect of mean length per stalk separate from its association with yield of cane per acre which would require consideration in a breeding program: the occurrenceof clones which are too short to be acceptable for mechanical
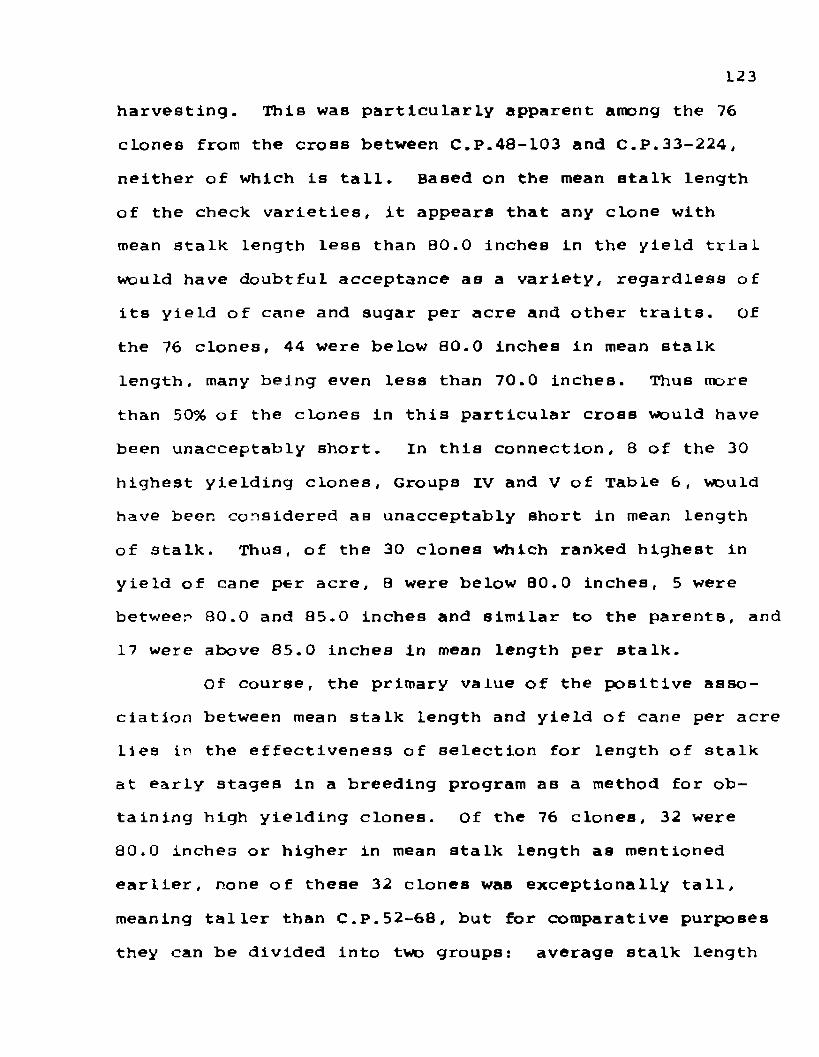
123harvesting. This was particularly apparent among the 76 clones from the cross between C.P.48-103 and C.P.33-224, neither of which is tall. Based on the mean stalk length of the check varieties, it appears that any clone with mean stalk length less than 80.0 inches in the yield trial would have doubtful acceptance as a variety, regardless of its yield of cane and sugar per acre and other traits. Of the 76 clones, 44 were below 80.0 inches in mean stalk length, many being even less than 70.0 inches. Thus more than 50% of the clones in this particular cross would have been unacceptably short. In this connection, 8 of the 30 highest yielding clones, Groups IV and V of Table 6, would have been considered as unacceptably short in mean length of 3talk. Thus, of the 30 clones Which ranked highest in yield of cane per acre, 8 were below 80.0 inches, 5 were between 80.0 and 85.0 inches and similar to the parents, and 17 were above 85.0 inches in mean length per stalk.
Of course, the primary value of the positive association between mean stalk length and yield of cane per acre lies in the effectiveness of selection for length of stalk at early stages in a breeding program as a method for obtaining high yielding clones. Of the 76 clones, 32 were80.0 inches or higher in mean stalk length as mentioned earlier, none of these 32 clones was exceptionally tall, meaning taller than C.P.52-68, but for comparative purposes they can be divided into two groups: average stalk length
124
(80.0 - 85.0 inches) and above average stalk length (above85.0 inches). Among the 32 clones of acceptable stalk length, mean stalk length of 80.0 inches or above, 13 would have been classed as having average stalk length and 19 as being above average. The 13 average stalk length clones had an average yield of cane per acre of 42.4 tons and included only 2 clones that were in the highest group (Group V) in yield of cane. The 19 clones with above average length of stalk were considerably superior to the average stalk length class. The average yield of cane per acre for these 19 clones was 49.4 tons and 9 of these clones were in Group V in respect to yield of cane.
It is obvious from the preceding data that effective selection for above average length of stalk would have proved extremely valuable in obtaining clones which had high yields of cane per acre. This fact is especially important since reasonably effective selection can, and is currently being made by visual means in the single stool and line trial stages of the breeding programs. Whether rigid selection for extremely tall clones may introduce complications through association with other undesirable characteristics should be investigated. This topic will be considered to some degree in a later section of this dissertation.
Although a significant, positive correlation coefficient was found between yield of cane per acre and diameter per stalk among the 76 clones, the r value was low

125
(.30) and does not suggest that selection for large stalk diameter would be of much value in obtaining high yielding clones. Note that the averages of stalk diameter for the five yield groups in Table 6 were Group I = 25.3, Group II = 24.5, Group III - 25.1, Group IV = 25.5, and Group V = 21.2,
Among the 76 clones, 16 had mean diameter per stalk of 27.0 mm or above. Four of the 16 clones were ir. th ? lowest group (I) in respect to yield of cane per acre, one of these 16 clones was in Group II, 3 were in Group III, 2 were in Group IV, and 6 were in Group V. Thus, if effective selection had been practiced earlier and only those 16 clones which had mean stalk diameter of 27.0 mm or higher had been retained, virtually nothing would have been accomplished In terms of selection for high yield of cane per acre. The data suggest strongly that from the standpoint of breeding for high yield of cane per acre there is little or no value in selecting clones which exceed such varieties as c.P.44-101 and C,P.52-68 in mean diameter per stalk. It is obvious, however, that selection should be practiced to eliminate clones which are unacceptably small in stalk diameter from the standpoint of processing by raw sugar mills.
Association Between Yield of Sugar per Ten of Cane and Its Components
As indicated earlier in this manuscript, the two basiccomponents or constituents of yield of sugar per acre are yieldof cane per acre and yield of sugar per ton of cane. seldom,

126If ever, is the yield of sugar per acre measured by actually obtaining sugar yield data from an entire acre. in nearly all cases, yield of sugar per acre is calculated from a measurement of the yield of cane per acre and an estimate of the sugar per ton of cane. Both components are determined from the performance of a clone or variety on a small plot. Yield of cane per acre is based on the weight of cane from the small plot adjusted to an acre and yield of sugar per ton of cane is based on standard sucrose and brix factors, as described in Materials and Methods, and determinations of the brix and sucrose percent from crusher juice samples.
As indicated in Table 1, the estimated yield of sugar per ton of cane for the 76 experimental clones varied from 133 to 239 pounds. The extent of the variation found indicated a strong degree of genetic variation among the clones in respect to sugar per ton of cane. Several characteristics of the 76 clones were measured which are related to sugar per ton of cane and might be expected to show an association with it. Part of these traits are not distinct components of sugar per ton of cane in the sense that number of stalks per acre is a component of yield of cane per acre but can be indirectly or in part considered to be constituents of sugar per ton of cane. The traits included in this category are sucrose percent of crusher Juice, brix of crusher juice, purity of the cruBher Juice, and percent fiber in cane. All of these traits were determined

127from 20-stalk samples harvested from each experimental plot of one replication. Each of these four characteristics can be evaluated reliably for large numbers of experimental clones prior to the yield trial stage. Consequently, any strong association between one of these traits and sugar per ton of cane will indicate that selection of this trait would prove valuable in obtaining clones with high yields of sugar per ton of cane.
Correlation coefficients were calculated between sugar per ton of cane and each of the four traits related to it and are presented in Table 8. The correlation coefficients in Table 8 are phenotypic. However, due to the nature of data and of the traits involved, it is probable that they provide reliable Indications of the genotypic associations.
The correlation coefficient between sugar per ton of cane and sucrose percent of crusher Juice was an almost perfect .96, indicating a virtually complete association.It is not surprising that a strong positive association occurred between these traits in view of the fact that sucrose percent is used in the estimation of sugar per ton of cane. However, the extreme closeness of the association is somewhat surprising. It suggests that a simple method of computing sugar per ton of cane based more completely on sucrose percent of crusher juice samples, such as that being used in the infield varietal testing program at the
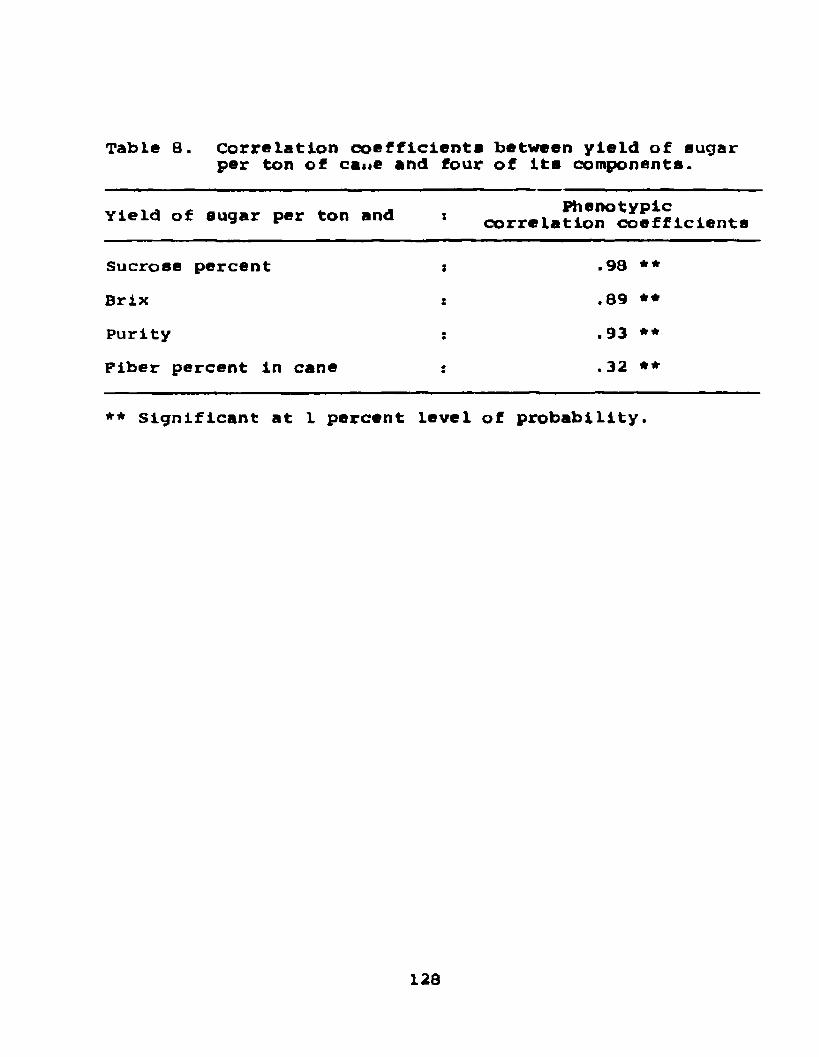
Table 8. Correlation coefficients between yield of sugar per ton of cane and four of its components.
Yield of sugar per ton and : Phenotypic correlation coefficients
Sucrose percent i .9a **Brix t .89 **Purity •• .93 **Fiber percent in cane • .32 **
** significant at 1 percent level of probability.
128
*
129Louisiana Agricultural Experiment Station, would be sufficiently reliable. The complex system involving an extensive set of milling quality tests and voluminous calculation each harvesting season, as described in the Materials and Methods section, may not be necessary in obtaining reasonably accurate estimates of sugar per ton of cane,
Ifre relationship between sugar per ton of cane and sucrose percent is shown in the form of a scatter diagram in Figure 5. The distribution of the swarm denotes the extremely close association. All of the dots are near the regression line. Thus, in none of the 76 clones was there a major disagreement between the sugar per ton of cane and sucrose percent results.
In an effort to demonstrate more clearly the degree of association between sugar per ton of cane and sucrose percent, the 76 experimental clones were divided into five groups on the basis of sugar per ton, from lowest to highest in expression. The sugar per ton and sucrose percent of each clone and averages of the five groups are presented in Table 9 along with the four check varieties.
One fact of interest and importahce concerning the data in Table 9 is that a number of the clones were distinctly lower than the low parent in sucrose percent, consequently in sugar per ton of cane, but none of the clones was distinctly higher than the C.P.48-103 parent. In fact, only about 12 to 15 of the clones could be considered as being

Sucr
ose
Perc
ent
Y . \540. !2 X - 2 3 .6 9
2402202000 160 180
Yield of Sugar p e r Ton of C ane(Pounds J
Figure 5. ScatAer diagram giving distribution according to yield of sugar per ton of cane and sucrose percent for 76 clones in the replicated yield trial.
130
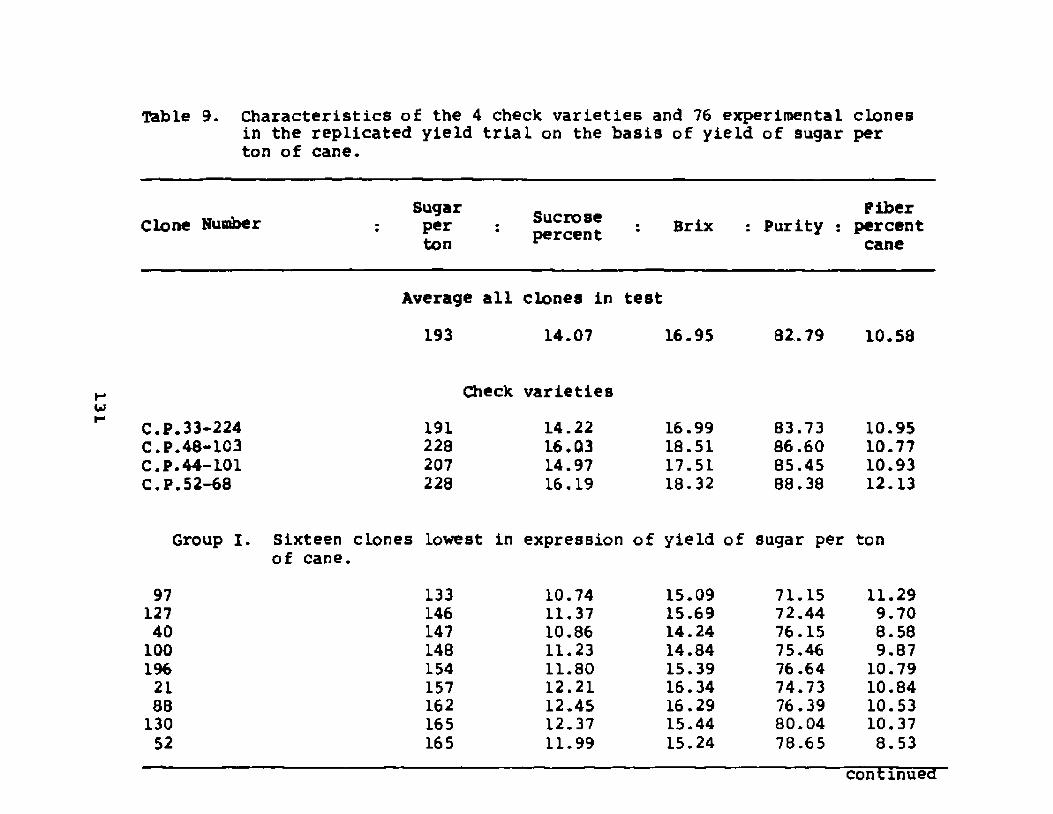
13 L
Table 9. Characteristics of the 4 check varieties and 76 experimental clones in the replicated yield trial on the basis of yield of sugar per ton of cane.
Clone Number S^ J r Sucrose - .: per : : Brix ton Percent : Purity :Fiber
percentcane
Average all clones in test 193 14.07 16.95 82.79 10.58
Check varietiesC.P.33-224 191 14.22 16.99 83.73 10.95C.P.48-103 228 16.03 18.51 86.60 10.77C.P.44-101 207 14.97 17.51 85.45 10.93C.P.52-68 228 16.19 18.32 88.38 12.13
Group I. Sixteen clones of cane.
lowest in expression of yield of sugar per ton
97 133 10.74 15.09 71.15 11.29127 146 11.37 15.69 72.44 9.7040 147 10.86 14.24 76.15 8.58100 148 11.23 14.84 75.46 9.87196 154 11.80 15.39 76.64 10.7921 157 12.21 16.34 74.73 10.8488 162 12.45 16.29 76.39 10.53130 165 12.37 15.44 80.04 10.3752 165 11.99 15.24 78.65 8.53
continued
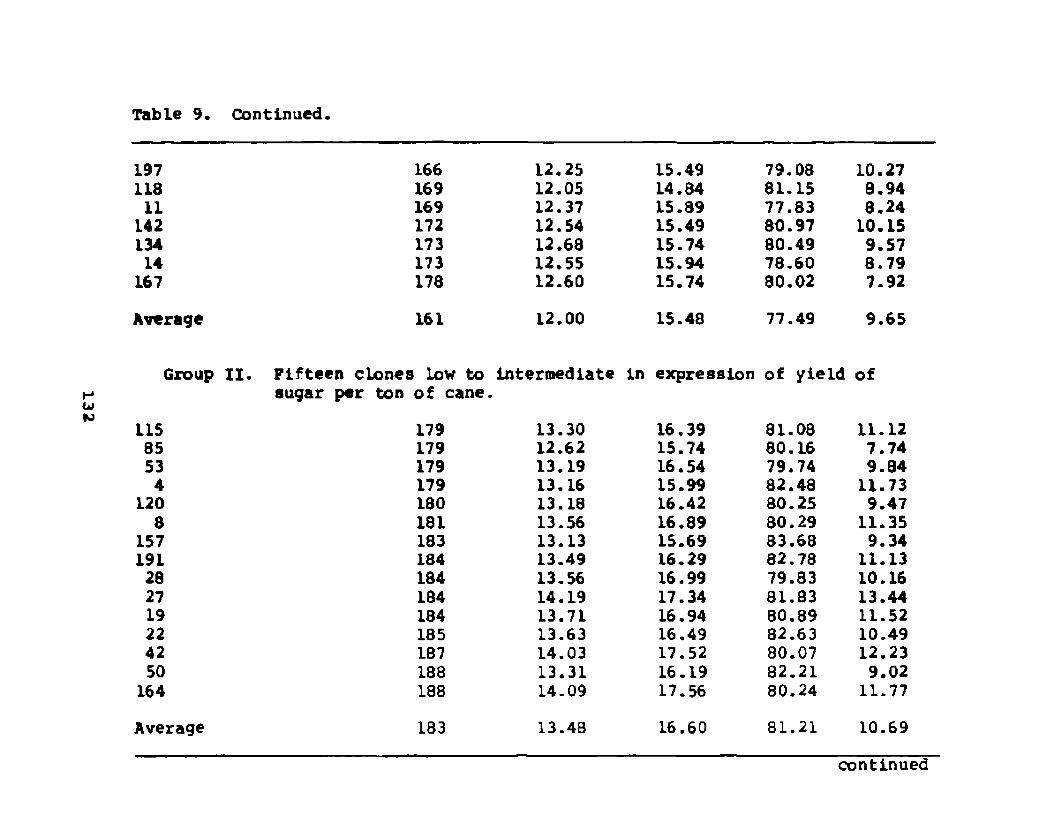
Table 9. Continued
197 166 12.25 15.49 79.08 10.27118 169 12.05 14.84 81.15 8.9411 169 12.37 15.89 77.83 8.24
142 172 12.54 15.49 80.97 10.15134 173 12.68 15.74 80.49 9.5714 173 12.55 15.94 78.60 8.79
167 178 12.60 15.74 80.02 7.92Average 161 12.00 15.48 77.49 9.65
Group 11. Fifteen clones low to sugar per ton of cane.
Intermediate in expression of yield of
115 179 13.30 16.39 81,08 11.1285 179 12.62 15.74 80.16 7.7453 179 13.19 16.54 79.74 9.844 179 13.16 15.99 82.48 11.73
120 180 13.18 16.42 30.25 9.478 181 13.56 16.89 80.29 11.35
157 183 13.13 15.69 83.68 9.34191 184 13.49 16.29 82.78 11.1328 184 13.56 16.99 79.83 10.1627 184 14.19 17.34 81.83 13.4419 184 13.71 16.94 80.89 11.5222 185 13.63 16.49 32.63 10.4942 187 14.03 17.52 80.07 12.2350 188 13.31 16.19 82.21 9.02164 188 14.09 17.56 80.24 11.77Average 183 13.48 16.60 81.21 10.69
continued

Table 9. Continued
Group III. Fifteen clones intermediate in expression of yield of sugar per ton of cane.
66 189 13.52 16.14 83.73 9.3526 189 14.20 17.79 79.84 11.4223 189 13.67 16.67 82.01 9.2212 191 14.08 17.08 82.46 11.02
174 191 13.27 15.99 82.29 7.90145 191 13.98 16.74 83.47 10.7474 192 13.97 16.59 84.17 10.4138 192 14.16 17.23 82.18 11.2936 192 14.21 16.74 84.87 13.0218 193 13.94 16.89 82.48 9.4325 194 14.25 17.14 83.14 10.90152 195 14.27 17.17 82.93 10.6658 196 14.32 17.13 83.53 11.427 196 14.40 17.37 82.87 10.57
144 198 14.63 17.91 81.66 12.07Average 193 14.06 16.97 82.78 10.63
Group IV. Fifteen clones intermediate to high in expression of yieLd of sugar per ton of cane.
57 198 14.40 17.13 84.07 10.78192 200 14.45 16. r* 85.53 10.46200 201 14.13 83.66 8.83166 205 14.84 1 /. ■» / 84.92 12.37110 205 14.92 17.68 84.36 11.55
continued
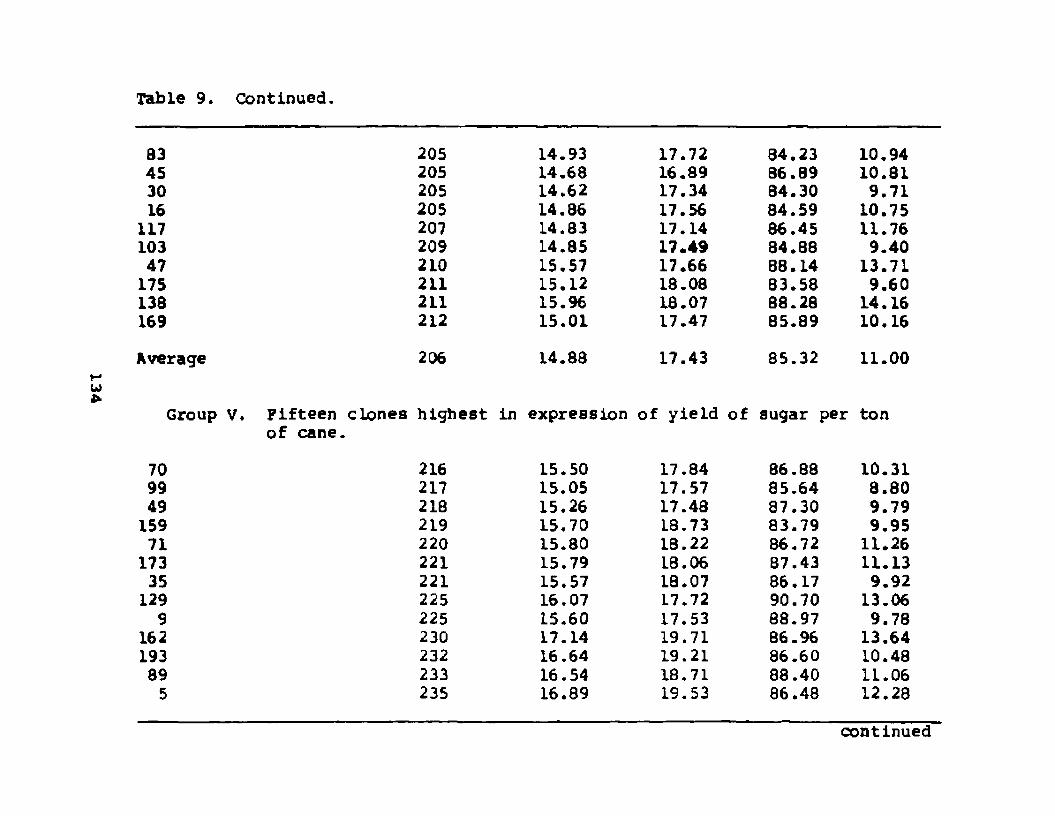
134
Table 9. Continued,
83 20545 20530 20516 205
117 207103 20947 210175 211138 211169 212Average 206
Group V. Fifteen clones highest of cane.
70 21699 21749 218159 21971 220173 22135 221129 2259 225
162 230193 23289 2335 235
14.93 17.72 84.23 10.9414.68 16.89 86.89 10.8114.62 17.34 84.30 9.7114.86 17.56 84.59 10.7514.83 17.14 86.45 11.7614.85 17*49 84.88 9.4015.57 17.66 88.14 13.7115.12 18.08 83.58 9.6015.96 18.07 88.28 14.1615.01 17.47 85.89 10.1614.88 17.43 85.32 11.00
expression of yield of sugar per ton
15.50 17.84 86.88 10.3115.05 17.57 85.64 8.8015.26 17.48 87.30 9.7915,70 18.73 83.79 9.9515.80 18.22 86.72 11.2615.79 18.06 87.43 11.1315.57 18.07 86.17 9.9216.07 17.72 90.70 13.0615.60 17.53 88.97 9.7817.14 19.71 86.96 13.6416.64 19.21 86.60 10.4816.54 18.71 88.40 11.0616.89 19.53 86.48 12.28
continued

135
Table 9. Continued.
140 23634 239
Average 226
16.9216.47
18.77 90.12 12,9518.21 90.43 10.11
16.06 18.36 87.51 10.97

136equal to the C.P.48-103 parent in these traits.
The means of the five groups of clones in sucrose percent were; I « 12.00%, II - 13.48%, III - 14.06%, IV - 14.88%, and V ■ 16.06%. This also stresses the closeneas of the association between sugar per ton of cane and sucrose percent. Fifty-seven of the clones produced cane which was estimated to yield less than 210 pounds of sugar per ton of cane, in comparison to 207 pounds estimated for C.P.44-101 and 228 pounds for C.P.48-103, and could be considered as low sugar per ton clones. All of these 57 clones had less than 15.00% sucrose and would have been judged as low in sucrose percent. Only 10 clones were estimated as producing cane with more than 220 pounds of sugar per ton and all of these had sucrose percentages above 15.50.
As expected from the extremely strong correlation between sugar per ton of cane and sucrose percent, if effective selection had been practiced for high sucrose percent and only clones capable of producing above 16.00% sucrose in the test had been selected, only 7 clones would have been kept, but all would have had high sugar per ton estimates of 225 pounds or higher.
With the data on sucrose percent in Table 9 and on yield of sugar per acre in Table 3, it is possible to examine more intensively the important association between these traits, correlation coefficient equals .61, that was reported in the first section of Results. if through selection at

137earlier stages only the 15 clones had been kept which produced above 15.50% sucrose (Groups IV and V, Table 9}, 11 would have produced clones which were classed in this experiment as high in yield of sugar per acre (Groups IV and V, Table 3), and only 4 clones would have proved mediocre to poor in yield of sugar per acre. As in the case of length per stalk, effective selection at an early stage in the progeny of the C.P.48-103 X C.P.33-224 cross for high sucrose percent would have proved highly valuable in obtaining clones which were capable of producing high levels of sugar per acre in plant cane.
The correlation coefficient between sugar per ton of cane and brix, .89, was also high, indicating a strong association. This association is due to the well-known relationship between brix and sucrose percent. Although the importance of the association between sugar per ton of cane and brix will be discussed in detail in a later section dealing with brix and sucrose percent, it can be pointed out here that effective use may be made of this association in material where sucrose percent cannot be determined in order to select for high yield of sugar per ton of cane. 'Ails would appear to be limited primarily to the single stool stage. in material where sucrose percent can be determined, selection based on this rather than brix vtould appear to be preferable.
Rie association between sugar per ton of cane and
138purity of the crusher Juice, although very high, is also an indirect one due to the relationship between each of these and sucrose percent, varieties which are high in sucrose percent are also high in purity of juice. The association between sucrose percent and purity of Juice will also be discussed in a later section.
Included as a component of yield of sugar per ton was fiber percent in cane. Tfriough not necessarily thought of as a component of sugar per ton Itself, fiber percent in cane influences the amount of extraction of juice contained in the cane, consequently influencing yield of sugar per ton of cane.
The association between sugar per ton and fiber percent in cane, .32, was positive and significant; however, the magnitude of the association leaves doubt that the association was of importance. The percent of fiber found in the cane of the check varieties and 76 experimental clones is given in the last column of Table 9. It will be recalled that the clones are arranged in Table 9 on the basis of their estimated yield of sugar per ton of cane and are divided into five groups on this basis. in examining the association more closely, by use of Table 9, it can be seen that the association is a very loose one, at the most. As sugar per ton consistently increases for the averages of Group I through Group V, there is little evidence of a consistent increase in the percent fiber. The average percent

139fiber for the five groups was as follows: Group I = 9.65%,Group II - 10.69%, Group III - 10.63%, Group IV - 11.00%, and Group V ■ 10.97%. Thus, the low degree of association between sugar per ton of cane and fiber percent was due primarily, if not entirely, to a tendency for the clones which were very low in sugar per ton (Group I, Table 9) to also be somewhat below average in percent fiber. However, the clones which were mediocre to high in sugar per ton of cane did not appear to show any relationship between this trait and percent fiber.
Presumably because both parents were average to low in fiber content, few of the 76 clones had high percent fiber. This may be the explanation for the low and unimportant association between fiber percent and sugar per ton of cane. However, it should be pointed out that among the 11 clones which exceeded 12.00%, in fiber percentage, 2 were in Group II, 2 in Group III, 3 in Group IV, and 4 in Group V for sugar per ton of cane. Among the 15 clones which were highest in sugar per ton of cane, there were more clones which were lower than the parents in fiber percent than the number higher than the parents. The data suggests that in the C.P.48-103 X C.P.33-224 cross, the association between sugar per ton of cane and fiber percent in the cane was too low to be a handicap in the breeding program. However, in a cross in which one of the parents was objectionably high in fiber content and, consequently.

140a sizeable proportion of the progeny had high fiber percent, it appears probable that a stronger and more serious association would occur.
Associations Among the Yield Components in addition to the associations between the various
aspects of yield and their components, described and discussed in previous sections of the chapter on Results, an intensive study was made from the yield trial data of the 76 experimental clones of associations between pairs of the various yield components. in respect to application, these associations between pairs of yield components indicate the effect that selection for one component would have on another and consequently on yield of the selected clones. For example, if components A and B are negatively associated with each other and A is more strongly correlated with yield than B is, selection for B prior to effective selection for A would have a detrimental effect on yield rather than a beneficial one.
The associations between the various components of yield were measured by calculation of correlation coefficients. For convenience of presentation these have been divided into three groups. In Table 10 are given correlation coefficients between yield of cane per acre and five traits related to sugar per ton of cane. It will be recalled that the components yield of cane per acre and sugar per ton of

Table 10. Correlation coefficients between yield of cane per acre and traits related to yield of sugar per ton of cane.
Yield of cane per acre andi Correlation : Phenotypic
coefficients : Genotypic
Yield of sugar per ton of cane .30 * .37 **Sucrose percent .29 * —Brix .30 * —Purity .25 * —Fiber percent in cane .03 —
* Significant at the 5 percent level of probability. **Significant at the 1 percent level of probability.
141
142
cane were both highly associated with yield of sugar per acre. If a negative association exists between these basic components of yield of sugar per acre, it would constitute a serious handicap in sugarcane breeding and could make it impossible to produce higher yielding varieties by combining maximum favorable expression of both components.
Fortunately, as shown in Table 10, there was no evidence of negative associations between yield of cane per acre and sugar per ton of cane or any of its constituents: sucrose percent, brix, purity, and percent fiber in cane.In fact, there were low but significant positive correlation coefficients between yield of cane per acre and sugar per ton of cane, sucrose percent, brix, and purity. Close study of the data suggested that the positive correlation coefficients were caused primarily by a tendency for clones low in sugar per ton, sucrose percent, and brix to also be low in yield of cane per acre. A possible explanation for the low positive correlation coefficients is that the unselected clones which were very lacking in vigor w u l d tend to produce less sugar per given weight of cane as well as less cane per acre.
If it generally occurs in other sugarcane crosses, the positive correlation between yield of cane per acre and traits related to sugar per ton of cane would be beneficial even though the association is low. selection practiced in early stages for high sucrose percent and brix would
143have the extra benefit of eliminating some clones which would prove if retained to be extremely low in yield of cane per acre. However, there is doubt that the positive association will occur in crosses where one parent is high in yield of cane per acre but average to low in sucrose while the other parent is low in yield of cane but high in sugar per ton of cane.
At least, the correlation coefficients in Table 10 provide evidence that the two basic components of yield of sugar per acre - yield of cane per acre and sugar per ton of cane - are not negatively correlated and that it should be possible to combine high levels of both components in varieties.
Hiere was no evidence of an association betweenyield of cane per acre and fiber percent in the cane. Itappears that effective selection for desirable expression of either of these traits would not have a detrimental effect on the other trait. Thus, the sugarcane breeder should be able to develop varieties which are high in yield of cane per acre without concern that they will tend to be undesirably high In fiber content.
As pointed out earlier, a low but significant positive correlation occurred between yield of cane per acre and sugar per ton of cane as well as with its constituents.It is of interest to examine the associations of sugar perton of cane with the individual components of yield of cane.
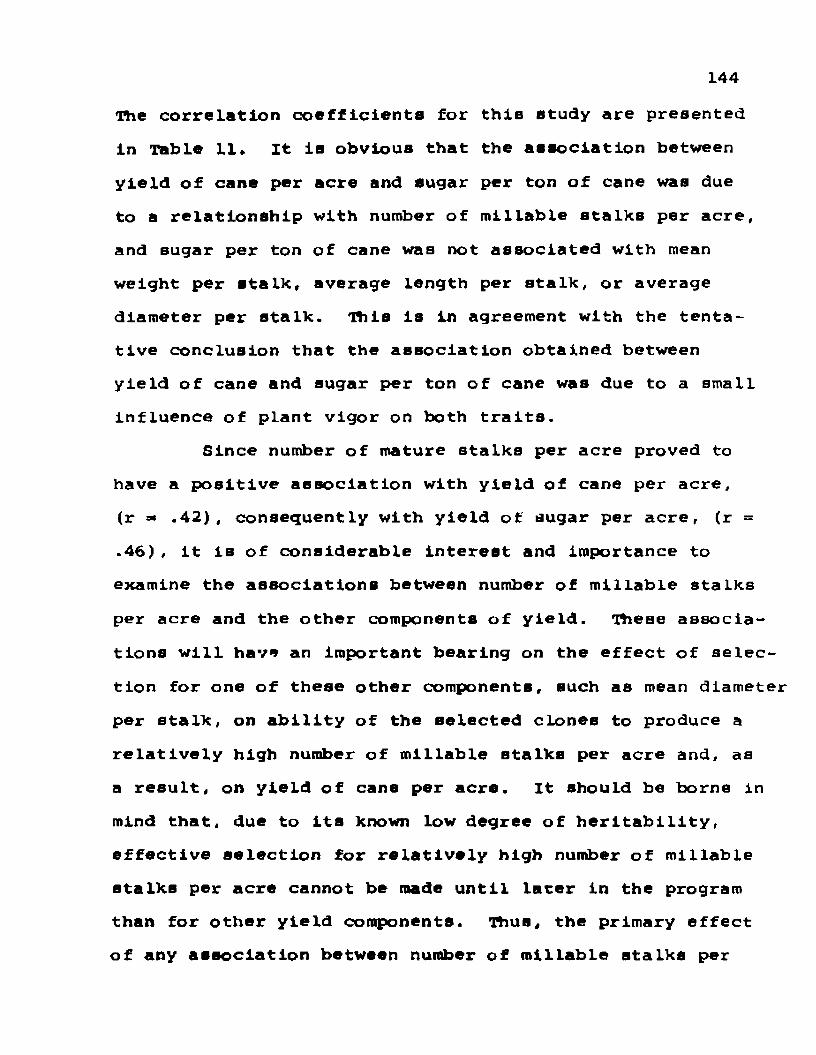
144The correlation coefficients for this study are presented in Table 11. It is obvious that the association between yield of cane per acre and sugar per ton of cane was due to a relationship with number of millable stalks per acre, and sugar per ton of cane was not associated with mean weight per stalk, average length per stalk, or average diameter per stalk. nils is in agreement with the tentative conclusion that the association obtained between yield of cane and sugar per ton of cane was due to a small influence of plant vigor on both traits.
Since number of mature stalks per acre proved to have a positive association with yield of cane per acre,(r » -42), consequently with yield of sugar per acre, (r = .46), it is of considerable interest and importance to examine the associations between number of millable stalks per acre and the other components of yield. These associations will have an important bearing on the effect of selection for one of these other components, such as mean diameter per stalk, on ability of the selected clones to produce a relatively high number of millable stalks per acre and, as a result, on yield of cane per acre. it should be borne in mind that, due to its known low degree of heritability, effective selection for relatively high number of millable stalks per acre cannot be made until later in the program than for other yield components. Thus, the primary effect of any association between number of millable stalks per
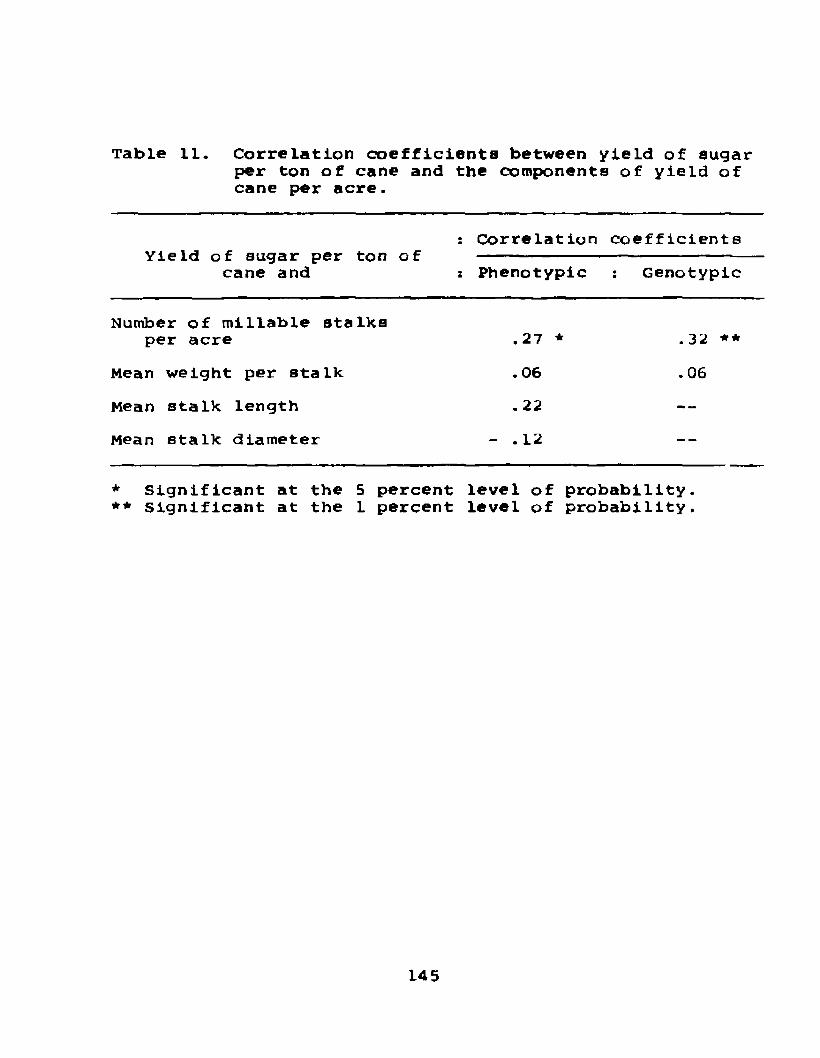
Table 11. Correlation coefficients between yield of sugar per ton of cane and the components of yield of cane per acre.
Yield of sugar per ton of cane and
: Correlation : Phenotypic
coefficients : Genotypic
Number of millable stalks per acre .27 * . 32 **
Mean weight per stalk .06 .06Mean stalk length . 22 __
Mean stalk diameter - .12 —
* Significant at the 5 percent level of probability. ** significant at the 1 percent level of probability.
145

146acre and another yield component will be on the ability to produce a desired number of stalks per acre rather than on the other component involved.
The occurrence of a low but significant, positive correlation between number of stalks per acre and sugar per ton of cane was given in Table 11 and was discussed earlier. Correlation coefficients between number of stalks per acre and seven other yield traits are presented in the upper part of Table 12. The correlation coefficient with mean length per stalk was not significant, (r * .23). There was no evidence among the clones of the cross involved of any association. This means that selection for above average length per stalk would not have had any influence on the stalk population of the selected clones. It should be possible to combine through selection higher than average length per stalk with above average number of stalks per acre.
The significant negative correlation coefficient of -.43 found between number of millable stalks per acre and mean diameter per stalk, indicating a moderate negative association between these two components of yield of cane per acre, represents one of the most important associations found in the study since it has considerable significance in sugarcane breeding. Negative correlation coefficients of this magnitude or higher have been reported consistently in unpublished data from studies conducted by the Department
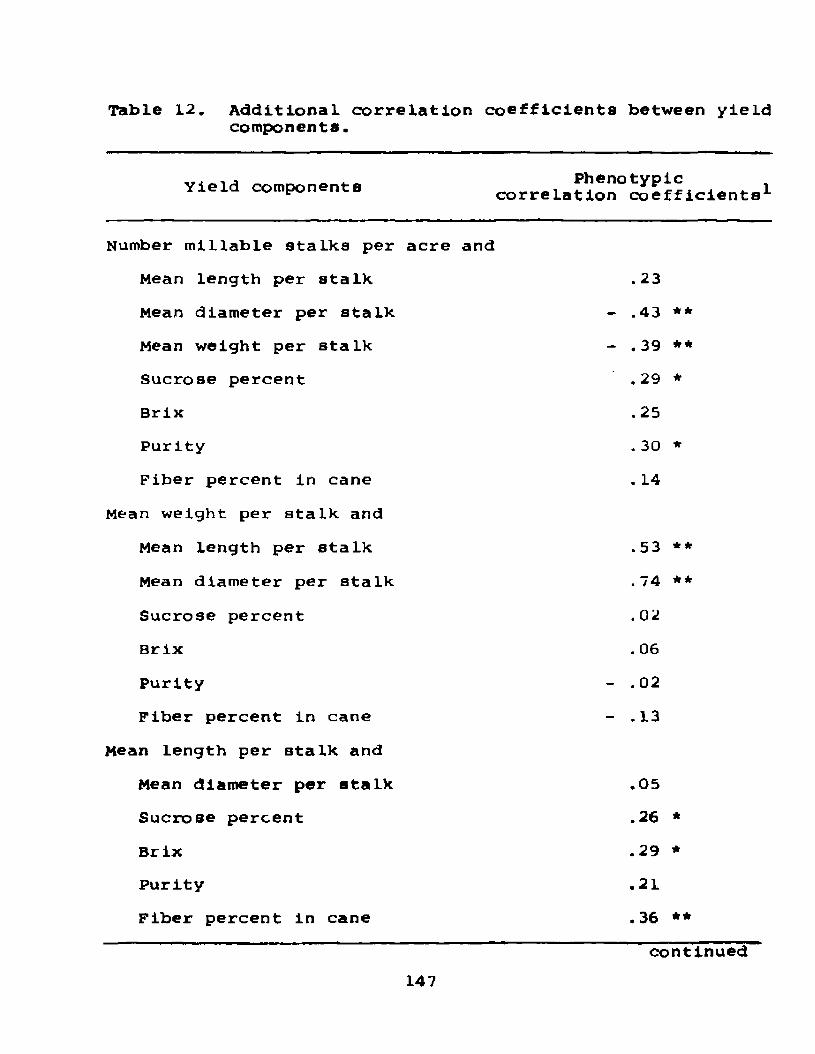
Table 12. Additional correlation coefficients between yield components.
Yield components correlation°coefficients1
Number millable stalks per acre andMean length per stalk .23Mean diameter per stalk - .43 **Mean weight per stalk - . 39 **Sucrose percent .29 *Brix .25Purity .30 *Fiber percent in cane .14
Mean weight per stalk andMean length per stalk .53 **Mean diameter per stalk .74 **Sucrose percent .02Brix .06Purity - .02Fiber percent in cane - .13
Mean length per stalk andMean diameter per stalk .05Sucrose percent .26 *Brix .29 *Purity .21Fiber percent in cane .36 **
147continued

Table 12. Continued.
Mean stalk diamet er andSucrose percen t - .19Brix - .17Purity - . 16Fiber percent in cane - .46 **
Sucrose percent andBrix .95 **Purity .90 **Fiber percent in cane .48 **
Brix andPurity .72 **Fiber percent in cane .52 **
Purity andFiber percent in cane . 35 **
* Significant at the 5 percent level of probability.** Significant at the 1 percent level of probability.•'•All correlation coefficients shown are phenotypic except for the relationship between number of millable stalks per acre and mean weight per stalk which is genotypic.
148
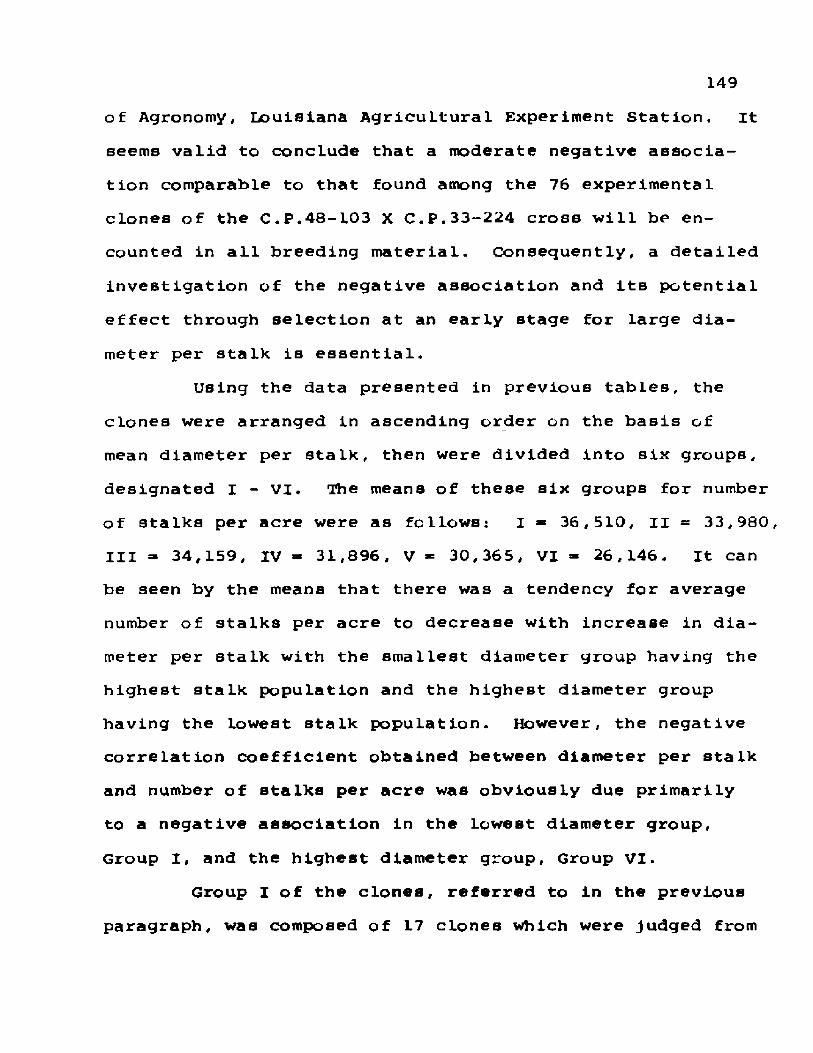
149of Agronomy, Louisiana Agricultural Experiment Station. it seems valid to conclude that a moderate negative association comparable to that found among the 76 experimental clones of the C.P.48-103 X C.P.33-224 cross will be en- counted in all breeding material. Consequently, a detailed investigation of the negative association and its potential effect through selection at an early stage for large diameter per stalk is essential.
Using the data presented in previous tables, the clones were arranged in ascending order on the basis of mean diameter per stalk, then were divided into six groups, designated I - VI. The means of these six groups for number of stalks per acre were as follows: I « 36,510, II = 33,980, III - 34,159, IV - 31,896, V - 30,365, VI = 26,146. It can be seen by the means that there was a tendency for average number of stalks per acre to decrease with increase in diameter per stalk with the smallest diameter group having the highest stalk population and the highest diameter group having the lowest stalk population. However, the negative correlation coefficient obtained between diameter per stalk and number of stalks per acre was obviously due primarily to a negative association in the lowest diameter group,Group I, and the highest diameter group, Group VI.
Group I of the clones, referred to in the previous paragraph, was composed of 17 clones which were judged from
150comparison with the check varieties to be too small in stalk diameter to be acceptable as varieties. They were all lower than C.P.52-68 in mean stalk diameter and in a breeding program would have been discarded on the basis of small stalk diameter alone. Ibis group of clones which were unacceptably small in stalk diameter were of interest because it included 8 of the 13 clones that produced more than40.000 stalks per acre. it was pointed out earlier that most of the clones which were unusually high in stalk population should have been discarded early in a breeding program due to their extremely small stalk size, principally diameter.
Group VI of the clones, those having larger stalk diameter than the parents and other check varieties, did not include a single clone that produced as many stalks per acre as did the check variety C.P.52-68 or equal to the average stalk population of all 76 experimental clones. It is apparent that if selection had been practiced in this cross for mean stalk diameter exceeding that of the checks there would have been a tendency to select clones with below average number of stalks per acre and to discard clones with a higher than average number of stalks per acre.
If it is assumed on the basis of the correlation coefficients of yield of cane per acre with number of stalks per acre (r » .66) and with mean stalk diameter (r - .30) that a group of clones Which still contains a modest proportion with ability to produce higher than average stalk

151populations will prove superior as a source of high yielding clones than a group which does not contain any with above average stalk populations, it appears reasonable to conclude that rigid selection in single stool and first line trial stages for stalk diameter exceeding that of current varieties will prove harmful. It is apparent that selection must be practiced at an early stage to eliminate clones having unacceptably small stalk size-diameter and length. However, the current research provides evidence that for moat effective results the selection for stalk diameter should be restricted to a range covered by current varieties, which might be designated average.
The moderate negative correlation coefficient between number of millable stalks per acre and mean weight per stalk shown in Table 12 was apparently caused by the negative association between stalk population and mean stalk diameter. The negative association means that, as in the case of large stalk diameter, selection for exceptionally high weight per stalk would tend to cause the sugarcane breeder to select clones which were undesirably low in number of stalks per acre.
The correlation coefficients involving number of stalks per acre and the juice quality traits of sucrose percent, brix, and purity were positive and low but significant, Indicating a low degree of association. This indicates that the Loose association between yield of cane per acre
152and sugar per ton of cane In the C.P.48-103 X C.P.33-224 cross was due to a tendency for clones low in number of stalks per acre to produce lower than average sucrose percent, while the clones high in stalk number produced above average percent sucrose. As indicated earlier, the explanation for this association cannot be determined from the experiment conducted here but the most probable one is that sucrose production by the plant and stalk population are in part determined by the degree of plant vigor.
Number of millable stalks per acre was not associated in the cross studied with percent of fiber In the cane, as shown by the low, non-significant correlation coefficient of .14. It is apparent that in this cross selection for high stalk population would not have produced clones with high fiber.
Part of the associations between mean weight per stalk and the other components have been discussed previously. The remainder are presented in the second section of Table 12. As shown by the correlation coefficients, there were moderate to high associations between mean weight per stalk and both stalk length and stalk diameter. These associations were expected since stalk length and diameter are components of weight per stalk. These associations do not appear to have important applications in sugarcane breeding. Tbe value of selecting for length per stalk and diameter per stalk in sugarcane breeding has already

153been discussed in detail.
SucroBe percent and the other Juice quality traits, brix and purity, did not show any association with weight per stalk. Rigid selection for high sucrose percentage would not have any effect, detrimental or advantageous, on weight per stalk.
Mean weight per stalk was not associated with percent of fiber in the cane. selection for either of these components would not affect the other.
•The remaining correlation coefficients between length per stalk and the other yield components are presented in the third section of Table 12. The correlation coefficient indicates that no association occurred between stalk length and Btalk diameter. Selection for either of these traits would not have any effect on the other.
Length per stalk showed a low, positive correlation with sucrose percent. It is noteworthy that sucrose percent had a low, positive correlation with two Important components of yield of cane per acre: number of millablestalks per acre and length per stalk. in the cross studied here these associations would have* proved advantageous in obtaining clones which were capable of producing high yields of cane combined with high sucrose percent. It is doubtful that positive associations involving these yield components will occur in all sugarcane crosses. Moreover, the fact that these associations were not negative suggests that no

154
special difficulty should be encountered in combining high yield of cane with high levels of sucrose content. Rigid selection in early stages of the breeding program for high sucrose percent will not tend to eliminate clones which are superior in such components of yield of cane per acre as high number of stalks per acre and length per stalk. incidentally, the positive association between length per stalk and sucrose percent is further evidence for the tentative conclusion drawn earlier that both vegetative growth and sucrose production are in part influenced by degree of plant vigor.
There was a positive, significant correlation coefficient of .36 between length per stalk and percent fiber in the cane for the 76 clones, indicating that the relatively tall clones tended to be above average in fiber content.A positive association between these traits was also found in the unpublished results of two experiments with 74 clones derived from a large number of crosses included In the annual report of studies by the Department of Agronomy, Louisiana Agricultural Experimental Station. The consistent occurrence of a positive association between length per stalk and percent fiber In the cane among experimental clones is potentially of great importance, and its effect in the current study needs to be Investigated more fully.
in considering the results it should be kept in mind that both parents were relatively short in respect to stalk

155length and below the average of current varieties in percent fiber. As a consequence, only a few clones were above average in stalk length, none exceeding C.P.52-68, and very few could be considered unacceptably high in percent fiber. it is apparent that in this cross the positive association between length per stalk and percent fiber could not cause selection for longer than average stalks to lead to a high frequency of clones which were unacceptably high in percent fiber. However, the results can be indicative of the seriousness of this problem in material in which one parent contributes genes for high fiber content.
Only 7 of the 76 clones tested had mean stalk length of 90 inches or higher. These 7 clones exceeded the parents by 8 - 14 inches although none was exceptionally tall. Hie average percent fiber of these 7 tall clones was 11.59, compared to approximately 11.00 percent for the parents and10.58 percent for all 76 clones, and 3 of the clones were above 12 percent in fiber content. Thus, there was a marked tendency for the few relatively tall clones to be above average of the material tested in percent fiber. Hie results suggest that in crosses involving parents with high fiber content, rigid selection for tallness would probably lead to a serious tendency for the selected clones to be undesirably high in percent fiber. This problem should be investigated more critically, particularly in view of the current practice of selecting for extreme length of stalk

156
beginning as early as the single stool stage.Most of the associations between diameter per stalk
and the other yield components have been covered earlier.The remainder are given in the fourth section of Table 12. The correlation coefficients between stalk diameter and the juice quality traits - sucrose percent, brix, and purity - were non-significant, suggesting that rigid selection for high sucrose percent or brix would not have any adverse effect on the stalk diameter of the selected clones.
The correlation coefficient between stalk diameter and fiber percent was a significant -.46, indicating a moderate tendency for small diameter clones to be high in fiber content and large diameter clones to be low. Hits association was expected. It indicates that, if other relationships could be ignored, clones which are larger in stalk diameter than current varieties would contain a higher frequency with low fiber content than a group small in diameter of stalk. This was true of the 76 clones. Eight clones were above 28.0 mm in mean stalk diameter. These 8 clones had an average fiber percent of 9.90, compared with10.58 percent for all 76 clones and approximately 11.00 percent for the parents. Furthermore, only 1 of the clones which had a minimum acceptable stalk diameter - 24.0 -25.0 mm - was appreciably lower than average in fiber percent. The data suggest that, if selection of a high frequency of clones similar to C.P.52-68 in mean stalk diameter

157la continued, any new varieties developed will probably not prove to be exceptionally low in fiber and some experimental clones will prove to be unacceptably high in fiber content. For clones relatively small in stalk diameter which were derived from crosses in which one parent was high in fiber content, it would appear valuable to test for fiber percent as early as possible and, at least, prior to choice of clones to be included in infield yield trials.
As shown in Table 12, the correlation coefficient between sucrose percent and brix was .95, indicating an almost perfect association. The strong correlation between sucrose percent and brix has been found consistently in earlier studies and is a well known relationship. It is caused by the fact that sucrose is the principal constituent of the soluble solids in the juice of sugarcane, composing 70 - 80 percent or more of these solids.
The close association between sucrose percent and brix has special significance in sugarcane breeding since it provides a practical means of selecting among several thousand individuals in the single stool stage for high sucrose percent through the determination of brix with the hand refractoroeter. It can also be useful in the preliminary screening of clones in first and second line trials in choosing a limited number of clones for the determination of sucrose percent. The use of brix determination in screening large numbers of single stools and clones in line

158trials for high sucrose content can be highly valuable in a breeding program in view of the major importance of sucrose percent as a component of yield of sugar per acre.
Due to the close association between sucrose percent and brix. it was expected that sucrose percent would show a strong association with purity of the juice. The correlation coefficient was .90 (Table 12) and is highly significant.The strong association is advantageous in a breeding program since it assures that clones which are selected for high sucrose content will prove acceptable to the processor in purity.
There was a significant, moderate, positive association between sucrose percent and percent of fiber in the cane, with a correlation coefficient of .48. If such an association between these traits is of general or common occurrence among the clones derived from numerous crosses in a breeding program, it will constitute a handicap. Rigid selection for high sucrose percent would tend to produce clones with above average fiber content, some of which might be unacceptably high in fiber. of the 76 clones tested, 7 were above 16.00 in sucrose percent. These relatively high sucrose clones averaged 11.94 in percent fiber in the cane, and 4 of these clones were higher than C.P.52-68 in fiber percent although such high fibered clones constituted only 13 percent of the total tested. It should be emphasized that part of the high sucrose clones were low
159ur average in fiber content. Ilowever, the marked tendency for clones having high sucrose to be above average in fiber content along with the tendency cited earlier of taller than average clones to be high in fiber point to a need to screen clones at an early stage in order to discard thoce which are unacceptably high in fiber and replace them with clones which are acceptable if not low in percent fiber.
The associations of brix ana purity of Juice with percent fiber, indicated by correlation coefficients in Table 12, are caused by the relationship between sucrose percent and fiber content and do not require discussion.

SUMMARY
Evidence of genetic variation waa found for each of 1L traits measured in the replicated yield trial. Significant F values from analysis of variance were found for among clones for each trait, providing statistical proof that a detectable degree of genetic variation occurred among the clones for each of the characters.
For the 76 clones in the replicated yield trial, positive, strong genotypic correlation coefficients were found between yield of sugar per acre and each of its basic components: yield of cane per acre and yield ofsugar per ton of cane. The conclusion drawn from the association between yield of sugar per acre and its two basic components, yield of cane per acre and yield of sugar per ton of cane, is that, even though the stage at which selection should be practiced for the two components of yield of sugar per acre should differ somewhat, with the strongest selection exerted for high sugar per ton of cane during the single stool and line trial stages and the strongest selection for high yield of cane per acre limited of necessity to the yield trial stage, at some point in the breeding program rigid selection should be practiced for both components.
160

161
The associations between yield of cane per acre and four of its components, number of millable stalks per acre, mean weight per stalk, mean length per stalk, and mean diameter per stalk, were determined. Moderate, positive correlation coefficients were found between yield of cane per acre and three of these components; number of millable stalks per acre, mean weight per stalk, and mean length per stalk. A significant, but low, correlation coefficient occurred with mean diameter per stalk. Essentially all clones which were exceptionally high in stalk number, exceeding 40,000 stalks per acre, were too small in stalk size — length or diameter — to be acceptable as varieties.
The results indicated that in order to obtain clones which will prove to be high in yield of cane per acre, selection should be practiced at early stages for greater than average length per stalk and a stalk diameter that will be acceptable to processors. Selection for exceptionally large stalk diameter did not appear to be valuable. Selection should also be made by the second line trial stage for higher than average number of stalks per acre combined with an acceptable stalk size.
The associations of yield of sugar per ton of cane and four traits related to it — sucrose percent, brix, purity, and fiber percent in cane — were also determined.The correlation between yield of sugar per ton of cane and sucrose percent was an almost perfect one, indicating a
162nearly complete association. Selection beginning at the earliest feasible stage for high sucrose percent would undoubtedly prove highly valuable in obtaining clones which were capable of producing high levels of sugar per ton of cane.
The relationship between yield of sugar per ton and brix was also very close due to the well-known relationship between brix and sucrose percent. Effective use of the association between yield of sugar per ton and brix can be made in material where sucrose percent can not be determined in order to select for high yield of sugar per ton of cane.
There was found a low, but significant, positive correlation between yield of sugar per ton of cane and percent fiber in cane. Th 1s may cause a serious problem to the breeding program if this relationship exists in most sugarcane crosses.
There was essentially no association between any of the following characters as Indicated by non-significant or low correlation coefficients among the yield components:
a. Yield of cane per acre and yield of sugar per ton of cane
b. Yield of cane per acre and sucrose percent, brix, and purity
c. Yield of cane per acre and fiber percent in caned. Yield of sugar per ton of cane and number of
millable stalks per acre

163e. Yield of sugar per ton of cane and mean weight per
stalkf. Yield of sugar per ton of cane and mean length per
stalkg. Yield of sugar per ton of cane and mean diameter
per stalkh. Number of millable stalks per acre and mean length
per stalki. Number of millable stalk per acre and sucrose per
cent, brix, and purityj. Number of millable stalks per acre and fiber percent
in canek. Mean weight per stalk and sucrose percent, brix,
and purity1. Mean weight per stalk and fiber percent in canem. Mean length per stalk and mean diameter per stalkn. Mean length per stalk and sucrose percent, brix,
and purityo. Mean diameter of stalk and sucrose percent, brix,
and purity.The lack of important association between these com
ponents of yield indicate that no special complications would be encountered in combining any of these pairs of traits in a breeding program. It is especially noteworthy that yield of cane per acre and its components were not negatively associated with sugar per ton of cane or sucrose percent.
Several associations having significance in sugarcane breeding occurred among the yield components. One was a moderate negative association between number of millable stalks per acre and mean diameter per stalk. Selection for

164exceptionally large stalX diameter would tend to eliminate clones with above average stalX population, hence might have a detrimental effect on yield of cane per acre.
Both length per stalX and sucrose percent showed a Low, positive association with percent fiber in the cane. These associations may cause serious problems unless clones are evaluated for fiber content at an early stage since rigid selection for longer than average stalXs and high sucrose percent could lead to the development of many clones which were undesirably or unacceptably high in fiber percent.
As expected, a moderate negative association was found between mean diameter per stalX and percent fiber in the cane. If clonet, of relatively small diameter, comparable to C.P.52-68, are retained in the breeding programs, they will tend to be above average in fiber content unless the clones are evaluated and selected also for acceptable levels of fiber.
The well known strong association between sucrose percent and brix also occurred in these studieB. it emphasizes the importance of selecting for high brix levels in material before sucrose percent can be measured such as in the single stool stage.
BIBLIOGRAPHY
Anzalone, L. , Jr., and T, J. DiVitorrio, 1969. New sugarcane varieties selected in 1968. Report to the American Sugar Cane League for the year I960, pp. 15-21.
Anzalone, L-, Jr., M. Giamalva, and S.J.P. Chilton.1967. Methods used to select disease resistant varieties of sugarcane at the Louisiana State University. Int. Soc. Sug. Tech. Proc, 12:1165- 1173.
Arceneaux, George. 1935. A simplified method of makingtheoretical sugar yield calculations in accordance with the Winter-Carp-Geerligs formula. Int. Sug. Jour. 37:264-265.
Arceneaux, George. 1945. Generalized factors for computing varietal yields of sugar from results of fieldtest with sugarcane. Sugar Bull. 23:186-191.
Arceneaux, George. 1954. Some neglected aspects ofexperimental procedure in making comparative tests of sugarcane varieties. int. Soc. Sug. Tech. Proc. 6:429-440.
Arceneaux, George. 1956. A universal equation forindicated available sugar in cane. Int. Soc. Sug. Tech. Proc. 9:737-749.
Barber, C. A. 1915. Some difficulties in the improvement of Indian sugarcanes. Ann. Appl* Biol. 6 (3,4): 211-221.
Barber, C. A. 1916. Studies in Indian sugarcane, No.2, sugarcane seedlings, including some correlation between morphological characters and sucrose in Juice. Memoirs of the Dept, of Agriculture in India. 8:102-199.
Bell, A. F. 1938. The selection of second year seed lings. Int. Soc. Sug. Tech. Proc. 6:710-714.
16610.
11.
12.
13.
14.
15.
16 .
17.
18 .
19.
20 .
21.
Breaux, R. D ., P. H. Dunckelman, and S. J. P. Chilton. 1956. Effectiveness of selecting for brix among individual stools of first stubble seedlings.Sugar Bull. 34 (19):288-293.
Breaux. R. D., and H. P. Fanguy. 1967. Breeding behavior of resistance to mosaic in sugarcane progenies and its association with some agronomic characters. Int.Soc. Sug. Tech. Proc. l2:773-779.
Breaux, R. D., L. P. Hebert, and H. P. Fanguy. 1963.Defects for which sugarcane seedlings are eliminated at the U. S. Sugar Cane Field Station, Houma, Louisiana. Int. Soc. Sug. Tech. Proc. 11:421-424.
Brown, A. H. D . 1967. Correlation between brix injuice and fiber in commercial hybrid sugarcane populations. Int. Soc. Sug. Tech. Proc. 12:754-759.
Buzacott, J. H. 1967. Selection criteria for cane varieties to be harvested mechanically and their likely effect on yield. Int. Soc. Sug. Tech. Proc. 12:294-298.
Coleman, o. H . , J. L. Dean, and D. M. Broadhead. 1963. Evaluation of sugarcane crosses. Int. Soc. Sug.Tech. Proc. 11:483-488.
Craig, N. 1934. A note on the quantitative characters of first year sugarcane seedlings. Tropical Agric.X I :244—245.
de Sornay, A. 1938. Seedling selection in Mauritius, int. Soc. Sug. Tech. Proc. 6:718-726.
Ethirajan, A, S. 1965. Evaluation of plant attributes concerned with yield in sugarcane and assessing their behavior in succeeding clonal populations. Thesis. Univ. Madras. pp. 119. (Plant Breeding Abstracts 37(1):1068. 1967).
Falgout, R. N., N. I. James, and E. R. Rice. 1968.Development of new sugarcane varieties for Florida. Sugar Bull. 46(23):7-12.
Gangopadhyaya, M. , and Sarkar, R. P. 196 3. A correlation study on crop-weather relationships-sugarcane. Indian J. Sugarcane Res. Developm. 8:1-12.
George, E. F. 1959. Effects of the environment oncomponents of yield in seedlings from five Saccharum crosses. Int. Soc. Sug. Tech. Proc. 10:755-765.

16722.
23.
24.
25.
26 .
27.
28.
29.
30.
31.
32.
George, E. P. 1963. A further study of Saccharumprogenies in contrasting environments. int. Soc.Sug. Tech. Proc. 11:488-497.
George, E. F. 196 7. An experiment to assess the effectof competition between sugarcane clones at the microplot stage of selection. int. Soc. Sug. Tech. Proc. 12:920-930.
Giamalva, M. J. , L. Anzalone, Jr., and S. j. p. ChilLor.. 1967. Evaluation of methods of seedling selection at Louisiana State university. Int. Soc. Sug.Tech. Proc. 12:916-919.
Hebert, L. P. 196 3. Estimating cane yields in evaluating sugarcane seedling selections. Crop Sci.3:277-278.
Hebert, L- P. 1967. Association between yield components and yield of sugarcane varieties in Louisiana. Int. Soc. Sug, Tech. Proc. 12:760-763.
Hebert, L. P., and M. T. Henderson. 1959. Breeding behavior of certain agronomic characters in progenies of sugarcane crosses, u. S. D. A. Tech.Bull. NO. 1194, 54 pp.
Hebert, L. P., and B. S. Newton. 1960. Bunch planting of sugarcane seedlings at the u. S. Sugar Cane Field Station, Houma, Louisiana. Int. Soc. Sug.Tech. Proc. 10:715-720.
Henderson, M. T. , B. L. Legendre, D. P. Viator, and J. A. Mariotti. 1968. Preliminary investigations of a simple technique for estimating fiber content in sugarcane. Sugar Bull. 46]13):8-15.
Hill, A. G. 1935. The maintenance of first year characters in new sugarcane clones. Int. Soc.Sug. Tech. Proc. 5:563-567.
Hogarth, D. M . , and J. C. Skinner. 1967. A sampling method for measuring yields of sugarcane in replicated trials. Bureau of Sugar Experiment Stations, Queensland, Tech. Communications No. 1. 24 pp.
Inniss, B. deL. 1953. The methods and policy used in sugarcane breeding and selection at the B.W.I.Central Sugar cane Breeding Station and the results achieved to-date. Int. Soc. Sug. Tech. Proc. 8: 452-462.
16833.
34.
35.
36.
37.
38.
39.
40.
41.
42.
43.
44.
James, N. 1., and r . n . Falgout. 1968. Association offive characters In progenies of four sugarcane crosses. Crop Sci. 9:88-91.
Khaphaga, E. E., M. K. Eladawl, M. A. Elsmei, A. H. Nour, and T. M. Fayed. 1966. Correlation studies in sugarcane. Agric. Res. Rev., Cairo. 44:57-62. (Plant Breeding Abstracts 38(1):1025. 1968).
Legendre, B. L., D. P. Viator, and M. T. Henderson. 1968. The association among experimental varieties of sugarcane between stand or shoot counts during the growing season and number of mature stalks at harvest. Sugar Bull. 46(24):5-7.
Legendre, B. L., D. P. Viator, and M. T. Henderson.1969. Choice of sample size in measuring weight, length, and diameter per stalk in sugarcane experiments. Sugar Bull. 47(17):10-12.
Loupe, D. T . , L. Anzalone, Jr., and M. J. Giamalva.1962. An evaluation of the effectiveness of selecting sugarcane varieties from plant and first stubble crops. Assoc. Sou. Agr. Wkrs., Proc. 59:64-65.
Luna, A. L. 1967. Study of some characters of the progeny in four crosses of sugarcane. Int. Soc.Sug. Tech. Proc. 12:764-772.
Mangelsdorf, A. J. 1935. Sugarcane breeding in Hawaii. Int. Soc. Sug. Tech. Proc. 5:348-357.
Matherne, r . j ., E. C. Simon, T. J. Stafford, and H. P. Fanguy. 1967. Criteria for evaluation of sugarcane varieties in advanced tosts in Louisiana.Int. Soc. Sug. Tech. Proc., 12:965-968.
McIntosh, A. E. S. 1933. Report of the geneticist for the year 1932-33. Barbados Agrl. Jour. 2 (3):1-26.
Meade, G. P. 1964. Spencer-Meade Cane Sugar Handbook.9th ed. New York: John Wiley and Sons, Inc.
Miller, P. A., J. C. Williams, jr., H. F. Robinson, and R. E. Comstock. 1958. Estimates of genotypic and environmental variances and covariances in upland cotton and their implications in selection. Agron. Jour. 50:126-131.
Morrill-Olavarrieta, C. A. 1964. Studies in selection of sugarcane seedlings from initial populations in
169
45.
46.
47.
48.
49.
50.
51.
52.
53.
54.
55.
56.
the field at Louisiana State university. unpublished M.S. Thesis. Louisiana State University.
Price. Sam. 196 3. Cytogenetics of modern sugarcanes. Econ. Bot. 17:97-106.
Price, Sam. 1967. Interspecific hybridization in sugarcane breeding. int. Soc. Sug. Tech. Proc.12:1021-1025.
Raghaven, T. S., and S. Govindaswamay. 1956. Sugarcane as a material for genetical studies. Int.Soc. Sug. Tech. Proc. 9:677-694.
Rao, J. T. 196 7. Current breeding techniques andselection procedures adapted at Coimbatore. int.Soc. Sug. Tech. Proc. 12:839-843.
Singh, H. N. 1956. Breeding behavior of fiber in sugarcane. Unpublished Ph.D. Dissertation,Louisiana State University.
Skinner, J. C. 1957. Sugarcane selection experiments.1. Bunch planting. Bur. Sug. Exp. Sta., Queensland. Tech. Comm. No. 1.
Skinner, J. C. 1960. selecting for resistance tolodging in sugarcane. Proc. Qld. Soc. Sug. Cane Tech. 27 pp.
Skinner, J. C. 1967. Grading varieties for selection. Int. Soc. Sug. Tech. Proc. 12:938-949.
Smith, C. E. M. 1967. The variety selection programme in Jamaica. int. Soc. Sug, Tech. Proc. 12:956-964.
Stevenson, G. C. 1954. Reflections on the evolution of Hawaii's philosophy of sugarcane breeding.Sugar 49 (6):51-56,65.
Van Breeman, J. P., T. 0. Ellis, and George Arceneaux. 1967. Sugarcane breeding at Central Romana. Int. Soc. Sug. Tech. Proc. 12:976-984.
Varma, H. P. 1963. A study of certain correlations between yield and growth factors in sugarcane.Proc. 31st Ann. Convent. Sug. Tech. Asa. India.Pt. 1:33-41. (Plant Breeding Abstracts 36 (2):2357. 1966).
170
57.
58.
59.
60.
61.
62.
63.
64.
Venkatraman, T. S. 1927. Sugarcane breeding - indications of Inheritance. Men. Dept. Agric. India,Bot. Ser. 14:113-129.
Venkatraman, T. S. 1935. Methods of selecting seedlings as adapted at Coimbatore. Int. Soc. Sug. Tech, Proc. 5:344-348.
Walker, D. I. T. 1966. Selection criteria for thefuture. Proc. of the 1966 meetings of the British West Indies Sug. Tech. pp. 21-24.
Walker, D. I. T. 1967. Some correlations in sugarcane selection in Barbados. Int. Soc. Sug. Tech. Proc. 12:950-955.
Warner, J. N. 1954. The philosophy of sugarcanebreeding in Hawaii. Int. Soc. Sug. Tech. Proc. 8:410-414.
Warner, J. N. 1956. Breeding for increased yield in sugarcane. Int. Soc. Sug. Tech. Proc. 9:586-593.
Watkins, C. D. 1967. Some practical aspects of sugarcane selection in British Guiana. Int. Soc. Sug. Tech. Proc. 12:931-937.
Yang, T.-C., C.-C. Chu, and S.-T. Lin. 1963. Herita- bility and genetic correlation of characters of major importance in the F2 of a sugarcane cross. Taiwan Tangyeh Shikyeneo, Yendchiu Huiyen / Rep. Taiwan Sug. Exp. Sta., No. 31:1-11. (Plant Breeding Abstracts 34 (2):2636. 1964).

VITA
Benjamin Leighton Legendre was born August 22, 1943, in Thibodaux, Louisiana.
He received his primary education up to the fourth grade at Thibodaux Elementary School and completed hla primary and secondary education at Thibodaux College High School (now Edward Douglas White Catholic High School) in Lafourche Parish, graduating in May of 1961.
Except for attending Nicholls State College in Thibodaux during the summer semesters of 1961 and 1962, he was enrolled full time in Louisiana State university at Baton Rouge in September of 1961 and received a Bachelor of Science degree in agronomy in May of 1965.
In January of 1965 he married the former Nell Louise Talbot of Houma and is the father of two children - Lisa L., age 3 and Benjamin, Jr., age 14 months.
He entered the Graduate School at Louisiana State University in June of 1965 as a graduate assistant in the Department of Agronomy from which he received his Master of Science degree in January of 1967.
He continued his post-graduate studies that same year in the Department of Agronomy where he is now a candidate for the degree of Doctor of Philosophy.
171
EXAMINATION AND THESIS REPORT
Candidate: B en ja m in L e i g h t o n L e g e n d r e
Major Field: Agronomy
Title of Thesis: Associations Involving Yield of Sugar Per Acre and Its ComponentsIn Sugarcane
Approved:
hi] . /,M a j o r P i 'o t t ’s s o r a n i l C h a i r m a n
Dean ut I hi t j r a d u a t c Sihool
EXAM IN ING COMMITTEE;
hi± f ? Ll /jj. ?. 1 L-CL l
1}
D ate of Examination:
J a n u a r y 1 2 . 1970