Jenn Salfi RN, PhD McMaster University Patty SolomonPT, PhD McMaster University (Mentor)

MCMASTER UNIVERSITY
DEPARTMENT OF FACILITY SERVICES
ASSET MANAGEMENT PLAN VERSION 02 – DEC 2012
Dr. Mohamed Attalla, Assistant Vice President
Craig MacDonald, Director
Robert Dunn, Director
Supporting the priorities and principles outlined in the President’s letter to the McMaster community
‘Forward With Integrity’

2 | P a g e
Table of Contents
Preamble ....................................................................................................................................................... 3
1. Background – Facilities Condition Assessment Program (FCAP) .......................................................... 4
2. Facilities Assets Portfolio ...................................................................................................................... 6
3. Current Funding .................................................................................................................................. 11
3.1 Current Funding – Academic, Ancillary and Infrastructure Portfolio ......................................... 11
3.2 Current Funding - Residences ..................................................................................................... 15
4. Proposed Comprehensive Plan ........................................................................................................... 17
4.1 Funding for a fixed RI ................................................................................................................... 17
4.2 Funding for a fixed FCI ................................................................................................................ 18
4.3 Funding for a fixed DM backlog .................................................................................................. 19
5. Proposed Prioritized Plan .................................................................................................................... 21
6. Funding the Proposed Prioritized Plan ............................................................................................... 22
7. Conclusion ........................................................................................................................................... 24
Appendices:
Appendix A – McMaster University Facility Condition Index – Owned Buildings and Infrastructure w/o
Residences- 2012
Appendix B – McMaster University Facility Condition Index of Residences - 2012
Appendix C – Re-Audit dates
Appendix D – Critical Deferred Maintenance Requirements - Examples

3 | P a g e
Preamble
The Asset Management Plan (AMP), Version 01, was prepared and presented to the Planning and
Building Committee on September 5, 2012. This plan relied on building survey and audit data that was
between five and nine years old. An audit of McMaster buildings and infrastructure for the purpose of
updating the deferred maintenance requirements of the campus was underway at that time. Facility
Services had arranged for an audit of all campus buildings. Phase 1 of the audit began in March 2012
and Phase 2 in June 2012. The uploading of data and information acquired during the audits was
completed in October 2012. The review and validation was then completed in November 2012. This
basis of the audit, and evaluation of the building components, was consistent with past audits of the
McMaster facilities.
With accurate and current deferred maintenance requirement information, Facility Services is able to
update Version 01 of the AMP to reflect the condition of the campus facilities as of 2012.
In addition to data contained within the most recent audits, Version 02 of the AMP also took into
account readjusted value and requirements for the McMaster University Medical Centre (MUMC,
Building #37) that reflect the current use of 40% of that facility by the University. With the Wilson
Building scheduled for construction in 2013 at the site of the current Wentworth House building,
Version 02 of the AMP does not consider the condition of Wentworth House in any of the calculations
reported herein, as the building is slated for demolition this coming year.
The structure and layout of Version 02 of the AMP has remained consistent with Version 01. As a result
of the new audit data, the report includes updated numbers, calculations and figures. The text in a
number of the sections has remained unchanged, but in others it has been altered to reflect the current
condition of the campus.
It is the intention of Facility Services to audit the campus on a continual basis in order to ensure no
building condition data is older than five years. Future versions of the AMP will be issued on a schedule
that is appropriate to guarantee the campus is aware of the health of the facilities. An update or
summary of the main reportable data contained within the AMP will be done on an annual basis to track
and benchmark progress made by the University in funding the deferred maintenance for McMaster.

4 | P a g e
1. Background – Facilities Condition Assessment Program (FCAP)
In 1999, the Council of Ontario Universities (COU), through the Council of Senior Administrative Officers
(CSAO) and the Ontario Association of Physical Plant Administrators (OAPPA), agreed to develop a
Facilities Condition Assessment Program (FCAP) to catalogue infrastructure requirements associated
with deferred maintenance, system and equipment renewal, and the required funding for the
adaptation and on-going maintenance of the capital physical infrastructure of Ontario Universities.
Deferred maintenance is defined as work on the maintenance of physical facilities that has been
postponed on a planned or unplanned basis to a future budget cycle or until funds become available. To
avoid increasing the size of deferred maintenance backlogs, it is necessary to carry out replacement of
facility components on an annual basis.
In June 1999, the University’s Facility Services initiated a FCAP when it was agreed that 20% of the
portfolio would be audited each year. Condition Assessments and populating the asset management
software VFA started in 2002 and continued over the last decade. The FCAP provides a consistent
approach to capturing, quantifying, prioritizing and reporting on deferred maintenance liabilities. The
program includes academic, administrative, and Health Sciences (MUMC) buildings; the residences; and
the campus utilities infrastructure.
Each asset is audited and assigned a numeric score reflecting the building’s condition. This is called the
Facility Condition Index (FCI). This index is a ratio of the value in dollars of Deferred Maintenance (DM)
required for completion and the Current Replacement Value (CRV) of the building: thus, the lower the
FCI, the better the condition of the building or portfolio.
FCI =
To add a qualitative rating to the FCI, three ranges have been defined to reflect the conditions of the
buildings, and are shown below in tabular and graphical form.
Buildings with a FCI ranging from 0 – 5% Excellent condition
Buildings with a FCI ranging from 5 – 10% Good condition
Buildings with a FCI over 10% Fair to Poor condition
(OUS - Ontario Universities Standard)
Like FCI, the Requirement Index (RI) is another tool that is used by VFA to indicate the condition of the
facility. Unlike FCI, RI uses DM items as well as short-term and long-term capital improvements and

5 | P a g e
grandfathered code items in its calculations, such as replacement of equipment that has not yet reached
their end of service life.
RI =
In December 2011, members of the Senior Management Team participated in workshops over three
days to detail the key risks to the University in the broad categories of reputational, strategic,
operational, financial, and compliance risks. These risks were selected based on their “impact on the
University’s ability to achieve its core mission, strategic priorities and objectives, and the advancement
of the President’s letter – Forward with Integrity.” The operational risk of Physical Infrastructure was
determined to be the highest risk in the list of critical risks; it was one of only two risks to be in the
highest category for both Severity and Likelihood of Occurrence. As this process is ongoing, there will be
refinement of the risk ratings. There is, however, no doubt that Physical Infrastructure Risk will remain a
top five risk for the University. The summary graph of the findings from the risk exercise is featured
below.

6 | P a g e
The Canadian Universities Reciprocal Insurance Exchange (CURIE) provides McMaster University with a
yearly report on loss ratios related to its property and liability coverage. Loss ratio is calculated by
dividing the incurred losses by premiums paid. It indicates the percentage of premium dollars that has or
is expected to be used towards the cost of settling claims. The report generated by CURIE dated
September 2011 for the 2006-2010 period included rankings for its 58 member universities; it is shown
below.
58 Universities – period 2006-2010 Liability Ranking Property Ranking
Loss Ratio 39 53
Total Loss Dollars 49 56
McMaster University ranked extremely low because of the fire in Brandon Hall in 2008, but also its high
number of sudden equipment and building component failure claims.
On June 24, 2011, the Government of Ontario released its long-term infrastructure plan, Building
Together. The Plan makes it a requirement for all Ontario post-secondary institutions to produce an
Asset Management Plan as a prerequisite for receiving infrastructure funding. The Province has also
indicated that deferred maintenance will receive a higher proportion of capital allocations over the
coming years. The significance of this report is, therefore, evident.
2. Facilities Assets Portfolio
McMaster University’s Portfolio of physical assets and current enrollment data is shown in Table 1.

7 | P a g e
Table 1 – Campus building statistics, enrollment and employee compliment
(Including Residences) (Excluding Residences)
Total number of buildings 56 44
Total Gross Area of buildings 568798 m2 475054 m2
Number Area Number Area
Buildings less than 10 years old 10 105866 m2 8 82,435 m2
Buildings 10 – 39 years old 8 45560 m2 7 35,872 m2
Buildings 40 – 49 years old 19 281993 m2 14 237,828 m2
Buildings over 50 years old 19 133199 m2 15 118,919 m2
Total number of students (2012) 28,962 (includes 4072 Graduate students)
Total number of staff (2012) 6,289
Based on the current building audit data including all of its owned buildings and infrastructure,
McMaster’s overall CRV is $1.75 billion and the FCI is at 18.2%. The overall DM backlog (Priority 1, 2, and
3) across campus is estimated at $317 million. Including priorities 4 and 5 to the DM backlog list revises
this figure to $335 million. These revised values represent a significant deterioration from Version 01,
which can primarily be attributed to working with new and updated data. On average, the data
contained within Version 02 is 5 years more current in its evaluation.
Excluding Residences, the campus CRV changes to $1.56 billion and the revised FCI is 18.9%. DM backlog
(Priority 1, 2 and 3) for buildings and infrastructure excluding residences is estimated at $295 million.
Adding Priority 4 and 5 items which are not included in the DM backlog calculation, revises the total
requirements estimate to $307 million. This is a standardized estimate based on rates established by

8 | P a g e
COU across the Province. A detailed summary of McMaster owned buildings and infrastructure
excluding Residences and their individual CRV, FCI, etc. is outlined in Appendix ‘A.’ A similar set of data
for Residences is included in Appendix ‘B’.
A comparison of McMaster with the five peer Ontario Universities that comprise the G6 Universities (the
others being Ottawa, Queen’s, University of Toronto, Waterloo and Western) was performed using data
from the COU report dated February 2010. The average FCI for these five universities is 8.4%. When
Version 01 of this plan was released, the McMaster FCI was slightly higher than the average at 8.7%. The
FCI based on the new current data indicates that McMaster, at 18.9%, is well above this average. As
McMaster has undertaken the re-auditing of the campus, so have other G6 institutions. This will mean
that the average FCI for these other 5 institutions will rise, but currently, this information is not available
for comparison. It is safe to conclude that an increase from 8.7% to 18.9% is consistent with the
deterioration of the physical infrastructure of the campus over the last 5 years, and this increased FCI
trend will be consistent at the other Ontario G6 Universities, but cannot be quantified at this time.
It is important to note that the total DM figures in this report are accurate for the reporting of the
deferred maintenance requriements, but due to the data keeping and reporting functions of the VFA
database, there are several items that are not considered in the values reported. These are:
1. The VFA audits include a review of the existing building systems and not the systems that should
be in the building. Capital renewal items, which address requirements to meet current fire
codes; accessibility standards; or the cost to modernize the buildings to present day heating,
ventilation or air conditioning standards are not included. These upgrades are defined by the
COU as “adaptive renewal” and are excluded from the database.
2. The current VFA cost estimates for Requirements does not include other construction related
costs and cannot be used in isolation for budgeting purposes. For example, soft costs, such as
consulting fees and permit costs (which can add 15% to 25% to the overall cost of a project) are
not included in the database figures.
3. Secondary effects needed to complete some of the repairs, such as asbestos removal, are also
not included in the database figures. This is estimated to add up to 50% to the estimated cost of
repairs. This is significant because about 70% of the buildings on campus are assumed to have
designated substances present in them.
4. The data and life cycle determinations do not take into account the enrollment growth or facility
use. Growth results in increased use of the facilities, adding pressure on the buildings and
infrastructure, while decreasing the life cycle of many building components. This means that
some items, usually in the category of finishes, should be considered critical and due for
replacement ahead of standard life cycle schedules. The enrollment figures from 2002/03 to
2012/13 are shown in Figure 1, and represent a 47% increase in 11 years.
5. Using a campus-wide FCI may be misleading since the addition of new space to the campus
contributes to the overall reduction of the FCI by increasing the CRV, without any improvements
to the conditions of the older buildings. If we exclude eight newer buildings on campus from the
9 | P a g e
FCI calculations the resulting FCI would be 25%. This suggests that a more realistic FCI would be
in the range of 18.9% to 25%. The calculation detail is included in Appendix ‘C.’
Figure 1: Growth of enrollment from 2002/03 to 2012/13
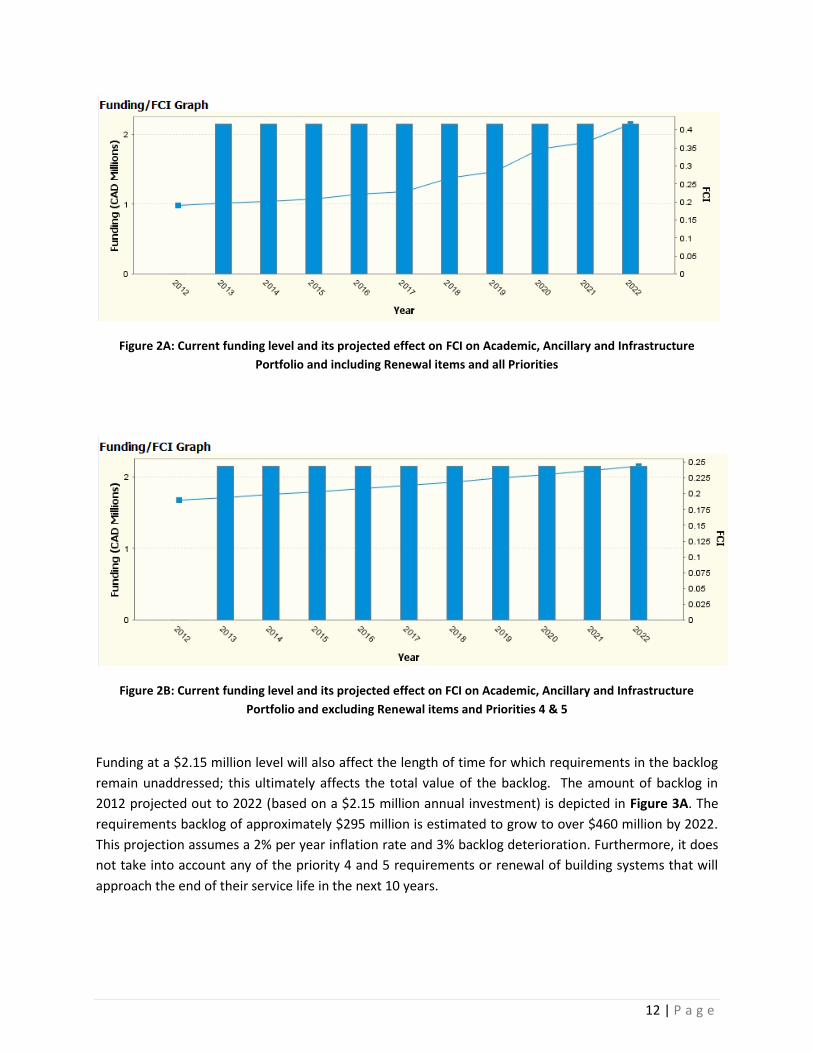
Table 2 (below) summarizes the number of buildings in the broad categories of “excellent,” “good,” and
“fair to poor” condition; the size of the buildings and the percentage of campus space are also listed in
their respective categories. It should be noted that excluding residences, 26 buildings, comprising 69%
of the total square footage of buildings, are in the “fair to poor” condition.
Table 2 – FCI ratings for campus buildings
Including Residences Excluding Residences
FCI Rating Range Number of
Buildings
Total Gross
Area
% of Total
Gross
Area
Number of
Buildings
Total Gross
Area
% of Total
Gross
Area
0 – 4.99% (Excellent) 14 152,287m2 27% 12 128,856 27%
5 – 9.99% (Good) 9 39,327m2 7% 6 17,159 4%
10% and up (Fair to Poor) 33 377,184m2 66% 26 329,039 69%
20056 22064 23234 24664 25458 26172 26781 27703 28482 28962 29411
0
5000
10000
15000
20000
25000
30000
35000
Academic Year
Enrollment
Enrollment

10 | P a g e
Facility Condition by Building Gross Area (excluding Residences)
Facility Condition by Building Gross Area (including Residences)
The FCAP not only identifies deficiencies, but also classifies DM items into priorities, ranging from 1 to 5.
Table 3 (below) summarizes the various priorities assigned to the Requirements.
Table 3 – Requirements definitions
Priority level Description Timeframe to complete requirement
1 Critical Immediate to within one year
2 Potentially critical One to three years
3 Necessary, but not yet critical Three to five years
4 Recommended Not required to meet basic function of facility,
but would improve overall usability and/or
reduce long-term maintenance
5 Does not meet current code
or standard
Requirement does not conform to current
code, but items grandfathered in existing
condition
Requirements are classified as priority 1 if they are still in operation and are operating beyond their
designed and useful life. Items in this category would include mechanical systems such as pumps, fans,
and piping systems; electrical systems, including distribution and safety items; building envelope, such
as windows, roofing and foundations; building finishes, such as flooring, acoustic ceilings and painting;
and large utility items, such as steam or cooling generating equipment. These items have a high risk of
failure, a high operating maintenance cost, and in their current condition, a profound impact on building
occupants and the core function of the building’s operation.

11 | P a g e
Priority 2 and 3 requirements include the same building components and systems as priority 1, but they
are not yet at the end of their useful life. Their impact on the building and occupants will not be seen
for between 1 and 5 years, depending on their priority classification.
Priority 4 requirements include improvements to a facility, such as adding redundancy or energy-
efficient upgrades. Priority 5 requirements include existing grandfathered code items, such as
compliance to the latest barrier free standards.
It is important to note that McMaster’s total DM backlog classified as critical (priority 1) amounts to
$28.86million and by definition should be corrected within the next year. The deferred maintenance
classified as potentially critical and necessary but not yet critical (priorities 2 & 3) totals over
$266million and should be addressed within the next 5 years.
3. Current Funding
As reported in the February 2010 COU report, the generally accepted minimum industry standard of re-
investment in buildings and infrastructure is 1.5% of the CRV per year. When the actual funding is
consistently less than 1.5%, as has been the case at most Canadian universities for an extended period
of time, the volume of deferred maintenance will grow. The failure to adequately address deferred
maintenance results in substandard facilities, and the breakdown of critical building systems and
infrastructure. Based on the current replacement value of our facilities excluding Residences ($1.56
billion) and the 1.5% reinvestment in capital, annual spending on major maintenance for campus
buildings should be at $23.4 million. In 2011, Facility Services was allocated a total of $2.15 million for
deferred maintenance, which represents just over 9% of the required industry-standard funding level or
0.14% of the CRV. This allocation was reduced to the current level by the Province in 2010-11.
3.1 Current Funding – Academic, Ancillary and Infrastructure Portfolio
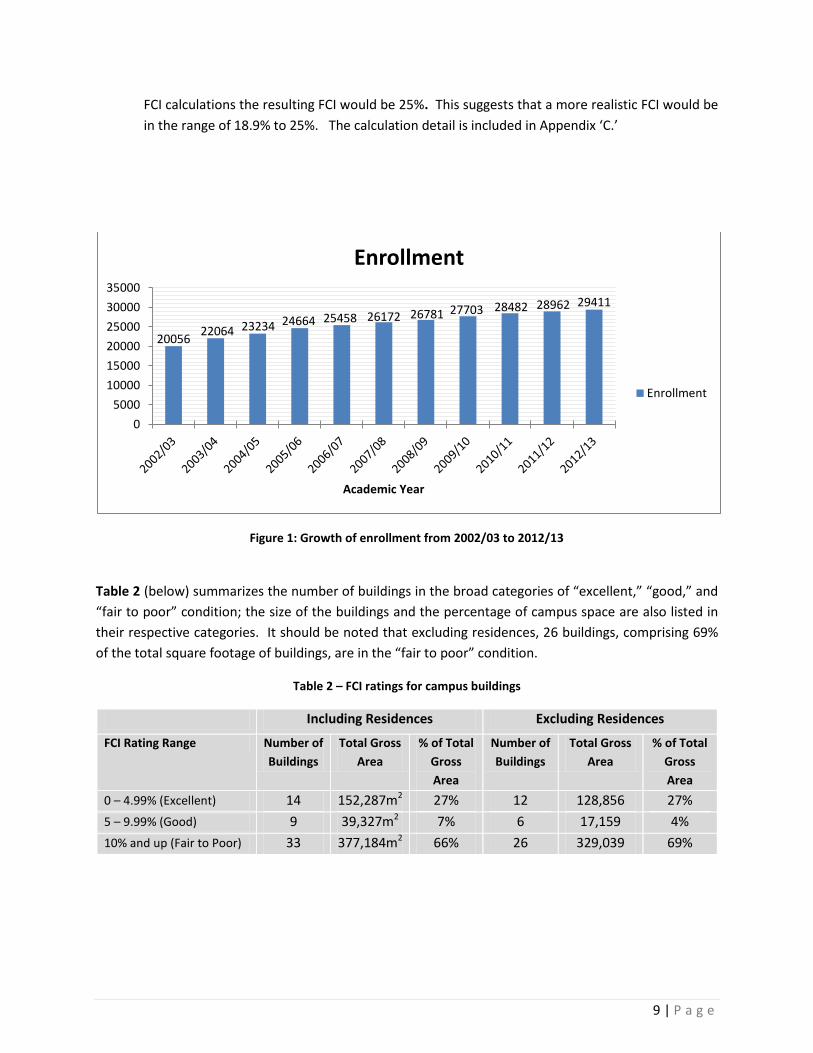
Using the requirements in the VFA database, and projecting 10 years forward based at the current
funding levels of $2.15 million/year, the FCI for the existing buildings and infrastructure, excluding
Residences, will increase from 18.9% to 24.3% (excluding building systems renewal approaching their
end of service life and Priorities 4 and 5) or 41.6% (including building systems renewal approaching their
end of service life and Priorities 4 and 5), and buildings will deteriorate at a serious rate. Figure 2A and
2B shows the current funding level and its effect on FCI for both scenarios, including and excluding
system renewal and priorities 4 and 5.
12 | P a g e
Figure 2A: Current funding level and its projected effect on FCI on Academic, Ancillary and Infrastructure
Portfolio and including Renewal items and all Priorities
Figure 2B: Current funding level and its projected effect on FCI on Academic, Ancillary and Infrastructure
Portfolio and excluding Renewal items and Priorities 4 & 5
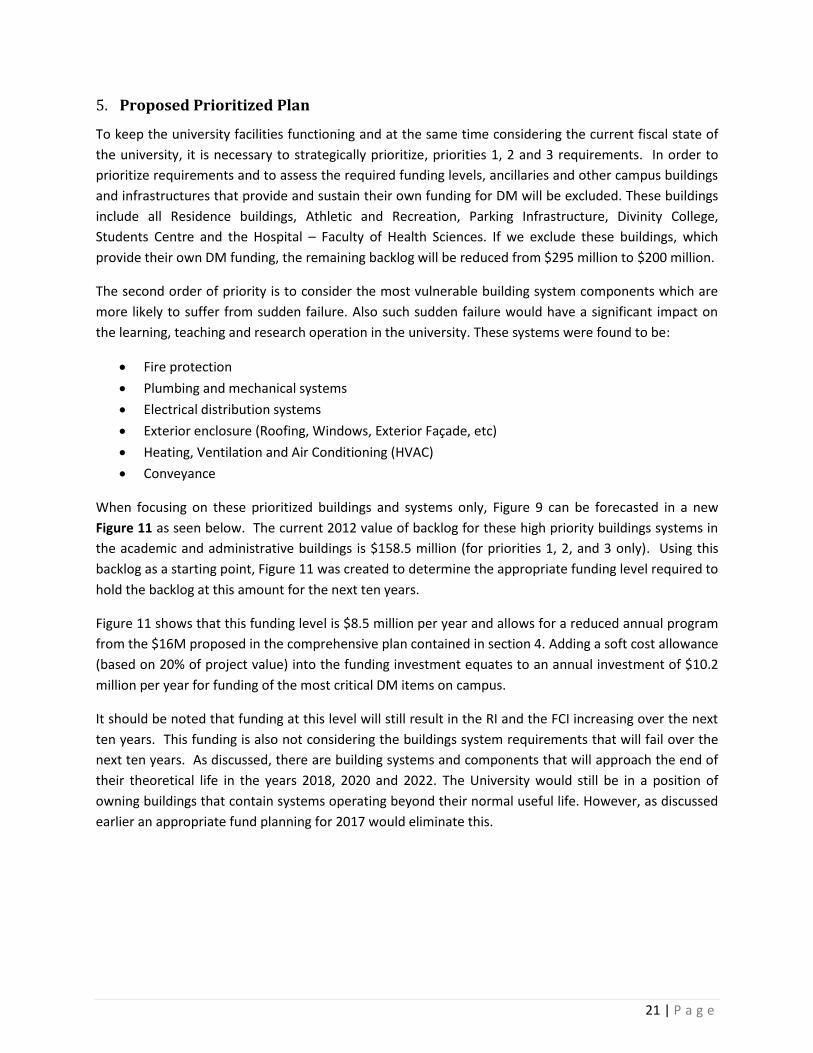
Funding at a $2.15 million level will also affect the length of time for which requirements in the backlog
remain unaddressed; this ultimately affects the total value of the backlog. The amount of backlog in
2012 projected out to 2022 (based on a $2.15 million annual investment) is depicted in Figure 3A. The
requirements backlog of approximately $295 million is estimated to grow to over $460 million by 2022.
This projection assumes a 2% per year inflation rate and 3% backlog deterioration. Furthermore, it does
not take into account any of the priority 4 and 5 requirements or renewal of building systems that will
approach the end of their service life in the next 10 years.

13 | P a g e
Figure 3A: Current funding level and its projected effect on Backlog Requirements (excluding Renewal Items)
If renewal of building systems that will approach their end of service life in the next 10 years is included
in the projection, total backlog dollars will to grow to $808 million in 2022, for the $2.15 million yearly
funding scenario. This is depicted in Figure 3B.
Figure 3B: Current funding level and its projected effect on Backlog Requirements (including Renewal items)
It is important to note that the provincial government, through various, one-time capital funding
programs, has recognized the importance of capital funding. In 2007/08, the Province supplemented
the regular Facilities Renewal Program (FRP) of $1.8 million with the Campus Renewal Program (CRP) at
$9.16 million and the University Campus Renewal Fund (UCRF) at $13.5 million. These programs
reinforced the Government’s commitment to capital funding and deferred maintenance, and this
($460M)
$0
$50
$100
$150
$200
$250
$300
$350
$400
$450
$500
$0.00
$0.50
$1.00
$1.50
$2.00
$2.50
2012 2013 2014 2015 2016 2017 2018 2019 2020 2021 2022
Bac
klo
g $
- M
illio
ns
Fun
din
g $
- M
illio
ns
Funding
Backlog $
($808M)
$0
$100
$200
$300
$400
$500
$600
$700
$800
$900
$0.00
$0.50
$1.00
$1.50
$2.00
$2.50
2012 2013 2014 2015 2016 2017 2018 2019 2020 2021 2022
Bac
klo
g $
- M
illio
ns
Fun
din
g $
-M
illio
ns
Funding
Backlog $

14 | P a g e
funding contributed to McMaster’s ability to sustain the FCI at the current levels. However, this one-
time funding has not stopped the growth in the total value of the DM backlog.
Table 4 depicts the historical funding of DM for the Academic Portfolio on campus from 2003 to 2012.
Table 4 – Historical funding levels for deferred maintenance
Fiscal Year FRP
DM (University-funded) Other MTCU Programs TOTAL
2003/04 $2,118,380 $1,000,000 $3,118,380
2004/05 $1,755,310 $1,000,000 $2,755,310
2005/06 $1,755,310 $1,000,000 $2,755,310
2006/07 $1,810,900 $1,000,000 $2,810,900
2007/08 $1,810,900 $1,000,000 $9,160,000.00 CRP $25,483,900
$13,513,000.00 UCRF
2008/09 $1,810,900 $1,000,000 $2,810,900
2009/10 $1,782,800 $1,000,000 $2,782,800
2010/11 $1,155,100 $600,000 $1,755,100
2011/12 $1,155,100 $1,000,000 $2,155,100
2012/13 $1,155,100 $1,000,000 $2,155,100 Note: Table 4 excludes DM expenditures on: Residences, MUMC, MUSC, and off-Campus Buildings.
In order for Facility Services to maintain the current FCI level and to address the requirements in the DM
backlog (valued at approximately $290 million), a significant funding increase is required over the next
decade. In its 2010 report, the Council of Senior Administrative Officers (CSAO) and the Ontario
Association of Physical Plant Administrators (OAPPA) indicated that Ontario’s deferred maintenance
backlog was at $1.97 billion, and the annual required investment to keep the current level was $380
million, or 19% of the backlog. Also, in order to improve the FCI to 5%, an annual investment of $586
million would be required, which represents about 30% of the backlogged deferred maintenance.
Comparatively, other universities in the G6 are investing in their deferred maintenance at a level far
higher than McMaster’s. Figure 4 illustrates this comparison.

15 | P a g e
Figure 4: Comparison of funding received by 4 Universities over the last 4 years
The University of Ottawa is funding at $26 million per year, Western University at $11 million per year,
and the University of Toronto at $10.8 million (but proposing an increase to $16 million) per year. A
comparison between McMaster, Ottawa and Western is shown in Table 5. Residence data is not
included in this table.
Table 5 – comparison of building conditions between McMaster, Ottawa and Western
McMaster Ottawa Western
Total Building Area (m2) 475,054 485,587 524,175
Area in Excellent Condition (%) 27 50 41
Area in Fair Condition (%) 4 19 7
Area in Poor Condition (%) 69 31 52
Weighted average age of campus buildings (yrs) 38.96 35.0 38.0
Current annual investment in DM ($) 2.15M 26M 11M
On campus, the McMaster University Student Centre (MUSC) is currently setting aside $55,000 per year
to fund DM in that building. This money is augmenting the existing DM fund for MUSC that is presently
at $3.5 million and is in addition to the $2.15 million funding per year.
3.2 Current Funding - Residences
The Residences currently dedicate an annual funding of $3.0 million from their cost of operations for
deferred maintenance. Using the existing requirements in the VFA database for the Residence portfolio
and projecting out 10 years based on the current funding levels, Figure 5 shows the overall Residences
FCI is projected to decrease from 11.8% to 4.4% in the next 10 years. This projection assumes a 2% per
$0
$1
$2
$3
$4
$5
$6
2008-2009 2009-2010 2010-2011 2011-2012
Mill
ion
s
Years
University of Toronto
Western University
University of Ottawa
McMaster University

16 | P a g e
year inflation and 3% backlog deterioration. Furthermore, it does not take in to account priority 4 and 5
items or renewal of building systems that will approach the end of their service life in the next 10 years.
The amount of backlog for Residences is projected to decrease to $6.09 million in the next 10 years based on current funding.
Figure 5: Current funding level and its projected effect on FCI on Residences
Figure 6: Current funding level and its projected effect on Backlog Requirements on Residences
Table 6 shows the historical funding of DM for the Residences Portfolio on campus from 2003 to 2012.
($6M)
$0
$5
$10
$15
$20
$25
$30
$0.0
$0.5
$1.0
$1.5
$2.0
$2.5
$3.0
$3.5
2012 2013 2014 2015 2016 2017 2018 2019 2020 2021 2022
Bac
klo
g $
- M
illio
ns
Fun
din
g -
Mill
ion
s
Funding
Backlog $

17 | P a g e
Table 6 - Historical funding levels for deferred maintenance for Residence portfolio
Fiscal Year Capital Renewal Fund Additional funding TOTAL
2003/04 $1,299,931 $252,219 (for new residence) $1,552,150
2004/05 $1,552,219 - $1,552,219
2005/06 $1,552,100 - $1,552,100
2006/07 $1,647,706 - $1,647,706
2007/08 $1,647,700 - $1,647,700
2008/09 $1,734,700 - $1,734,700
2009/10 $1,834,705 - $1,834,705
2010/11 $3,114,706 - $3,114,706
2011/12 $3,114,706 - $3,114,706
2012/13 $3,114,706 - $3,114,706
4. Proposed Comprehensive Plan
The current data indicates that the DM backlog relating to critical, potentially critical, and necessary but
not yet critical requirements (Priority 1, 2 and 3), excluding Residences amount to approximately $295
million. Based on the forecast for the next 10 years, by 2022 the DM backlog has the potential to exceed
$460 million (refer to Figure 3A), and this does not include priority 4 and 5 requirements or renewal of
building systems that will approach the end of their service life in the next 10 years.
If the renewal items, which are building system components that will reach the end of their theoretical
useful life at some point over the next 10 years, are included into the projections, the DM maintenance
backlog will approach $808 million by 2022 (refer to Figure 3B).
As part of this proposed comprehensive plan, three different funding proposals were considered. Each
one focused on the period 2012-2022. One model funds the DM at a fixed annual rate, with the
intention of holding the RI relatively fixed over this period. The second model considered the required
annual funding to hold the FCI at a fixed value while the third funds DM at a fixed annual rate to hold
the backlog of priority 1, 2 and 3 items at the current level.
4.1 Funding for a fixed RI
The first funding proposal concentrates on keeping the campus RI value for all buildings and
infrastructure except Residences, relatively constant in the next 10 years. Figure 7 shows the effect of
various funding scenarios on the resulting overall campus RI Value. The graph indicates that $40 million
per year funding will be required to keep the RI value in the current range. This includes all Priorities (1,
2, 3, 4, & 5) and building system renewal costs that is assumed to reach their end of service life in the
years 2018 – 2022.

18 | P a g e
Figure 7: Various funding scenarios and their effect on RI values for the next 10 years
4.2 Funding for a fixed FCI
A second funding proposal considered is depicted in Figure 8 and Table 7 and represents the yearly
funding required to keep the campus FCI value in the current range over the next 10 years. This
projection includes all Priorities (1, 2, 3, 4 & 5) and building system renewal costs that will approach
their end of service life in the years 2018 – 2022.
Figure 8: Annual funding required to maintain FCI in the current range
0.00
0.05
0.10
0.15
0.20
0.25
0.30
0.35
0.40
0.45
2012 2013 2014 2015 2016 2017 2018 2019 2020 2021 2022
RI for $2.15M Funding
RI for $5M Funding
RI for $10M Funding
RI for $20M Funding
RI for $40M Funding

19 | P a g e
Table 7 – Annual funding required to maintain FCI in the current range
Year Funding Required Projected FCI
2013 $15.7 Million 18.8%
2014 $16.5 Million 18.4%
2015 $18.2 Million 18.0 %
2016 $28.6 Million 17.6%
2017 $17.7 Million 17.1%
2018 $67.6 Million 17.1%
2019 $36.1 Million 16.9%
2020 $91.2 Million 17.8%
2021 $34.7 Million 17.3%
2022 $86.2 Million 17.6%
When considering Figure 8, the building system renewal costs remain relatively constant from years
2013 to 2017. In years 2018, 2020 and 2022 there are significant spikes of required funding required to
hold FCI constant, as during these years, large expensive building systems are scheduled to reach the
end of their theoretical life. The effect of these building system failures of RI during these specific years
can also be seen in Figure 7. Looking at the $40M funding scenario of Figure 7, the value of RI is driven
down by surplus funding in the years 2013-2017. With the funding fixed, the RI starts to increase from
2018 onward as the funding level is below the actual system requirements for three years within the
2018-2022 timeframe, i.e. 2018, 2020 and 2022. The net result when considering the $40M over this
ten year period is a value of RI equal to the 2012 value in 2022.
4.3 Funding for a fixed DM backlog
A third funding proposal is considered in Figure 9 below. The DM backlog forecast ($), for requirements
identified for the next 5 years only, is depicted below. Various funding scenarios including the current
funding of $2.15 million and higher amounts of funding are plotted. This scenario was generated after
excluding Priorities 4 and 5 and all building system renewal items which are anticipated to reach their
end of service life in the years 2018 – 2022. Further assessment of McMaster University buildings and
infrastructure assets in 2017 could reconsider these items but a funding strategy could be helpful.
According to these projections, a funding allocation of $16 million per year for the next 10 years is
required in order to keep the deferred maintenance backlog at its current level accounting for the yearly
inflation and backlog deterioration.
A funding investment of $16 million per year will allow us to keep the campus FCI in the current range
for the next 5 years as depicted in Figure 10. This graph incorporates all priority requirements and
building systems that are approaching their end of service life. The projection indicates that the

20 | P a g e
upcoming building system renewals may push the campus FCI higher during the latter half of the next 10
years.
Figure 9: Various funding scenarios and their effect on backlog dollars (for Priorities 1, 2 & 3) for the next 10
years
Figure 10: Effect of $16 million per year funding on FCI (including all priorities and building system renewals)
It is the recommendation of Facility Services that we strive to maintain the backlog value of $295M
constant over this ten year period. To do this, a comprehensive funding plan would be in the amount of
$16M per year plus associated soft costs.
Appendix ‘D’ provides examples of a few of the DM projects that are either underway or required in the
immediate term. All of these requirements are currently considered critical and deemed to have a very
high risk factor if not performed. Pictures have been included to show the extent and severity of the
requirement.
$457M
$422M
$362M
$295M $291M
$0
$50
$100
$150
$200
$250
$300
$350
$400
$450
$500
2012 2013 2014 2015 2016 2017 2018 2019 2020 2021 2022
Bac
klo
g $
in M
illio
ns
Backlog $ - For $2.15M Funding
Backlog $ - For $5M Funding
Backlog $ - For $10M Funding
Backlog $ - For $16M Funding
21 | P a g e
5. Proposed Prioritized Plan
To keep the university facilities functioning and at the same time considering the current fiscal state of
the university, it is necessary to strategically prioritize, priorities 1, 2 and 3 requirements. In order to
prioritize requirements and to assess the required funding levels, ancillaries and other campus buildings
and infrastructures that provide and sustain their own funding for DM will be excluded. These buildings
include all Residence buildings, Athletic and Recreation, Parking Infrastructure, Divinity College,
Students Centre and the Hospital – Faculty of Health Sciences. If we exclude these buildings, which
provide their own DM funding, the remaining backlog will be reduced from $295 million to $200 million.
The second order of priority is to consider the most vulnerable building system components which are
more likely to suffer from sudden failure. Also such sudden failure would have a significant impact on
the learning, teaching and research operation in the university. These systems were found to be:
Fire protection
Plumbing and mechanical systems
Electrical distribution systems
Exterior enclosure (Roofing, Windows, Exterior Façade, etc)
Heating, Ventilation and Air Conditioning (HVAC)
Conveyance
When focusing on these prioritized buildings and systems only, Figure 9 can be forecasted in a new
Figure 11 as seen below. The current 2012 value of backlog for these high priority buildings systems in
the academic and administrative buildings is $158.5 million (for priorities 1, 2, and 3 only). Using this
backlog as a starting point, Figure 11 was created to determine the appropriate funding level required to
hold the backlog at this amount for the next ten years.
Figure 11 shows that this funding level is $8.5 million per year and allows for a reduced annual program
from the $16M proposed in the comprehensive plan contained in section 4. Adding a soft cost allowance
(based on 20% of project value) into the funding investment equates to an annual investment of $10.2
million per year for funding of the most critical DM items on campus.
It should be noted that funding at this level will still result in the RI and the FCI increasing over the next
ten years. This funding is also not considering the buildings system requirements that will fail over the
next ten years. As discussed, there are building systems and components that will approach the end of
their theoretical life in the years 2018, 2020 and 2022. The University would still be in a position of
owning buildings that contain systems operating beyond their normal useful life. However, as discussed
earlier an appropriate fund planning for 2017 would eliminate this.

22 | P a g e
Figure 11: Various funding scenarios and their effect on backlog dollars for the next 10 years on the prioritized
plan
6. Funding the Proposed Prioritized Plan
Funding strategy options under consideration include:
An annual allocation from unfunded priorities in the annual budget cycle. This was
possible in the 2012-13 budget to the extent of $1.802 million. However, this solution
will never reach required levels and is unreliable because it is conditional.
Under the new budget model, receive an annual allocation from the university fund
and/or consider an increase in the rent charge to build an annual, reliable allocation.
Under the current or new budget model, adopt a plan to phase in an annual increase of
$2 million per year until the DM fund reaches the $10.2 million level.
Borrow for this purpose.
The most feasible option is the one that sees an incremental budget allocation of $2M per annum until
the DM fund reaches the necessary recommended $10.2M annual level. If this option is approved, it
would see the Deferred Maintenance for the academic portfolio increase to $10.2M in four years.
Figure 12 shows the effect on backlog for the prioritized priority 1, 2 and 3 requirements if this
incremental funding model is applied. It is important to note that of the $10.2M allocated funds, only
$8.5M is being applied to the backlog each year. The balance of $1.7M is used to cover the soft costs of
design, permits, asbestos abatement etc. that are associated with the annual program. This $8.5M
funding is consistent with the proposed funding scenario presented in Figure 11.
($234M)
($200M)
($159M) ($159 M)
$0
$50
$100
$150
$200
$250B
ackl
og
$ in
Mill
ion
s
Backlog $ - For $2.15M Funding
Backlog $ - For $5.0M Funding
Backlog $ - For $8.5M Funding

23 | P a g e
Figure 12: DM funding from present level to $10.2Million funding in $2M annual increments and its effect on
backlog (for the Prioritized Priority 1, 2 and 3 requirements) for 2012-2022.
Given the approved funding in 2012-13 for DM as well as the allocated funds from ancillaries and other
self-funded buildings, funding for 2012-13 is shown in Table 8:
Table 8 – Deferred Maintenance Funding, all sources, for fiscal year 2012-13
DM Fund / Building Group $
Deferred Maintenance / MTCU $4,707,100
Residence $3,114,000
Athletics $50,000
Health Science Centre $600,000
Roadways and Parking $358,000
McMaster University Student Centre $55,000
Total $8,884,100
If adopted, the $2M annual increase to the academic portfolio DM fund would increase the annual
campus DM allocation to over $14M by 2016-17 budget cycle. The proposed DM fund for future years
and the various other allocated funds (ancillaries and other self-funded building groups) are captured in
Table 9.
($159M)
($177M)
$0
$50
$100
$150
$200
$250
2012 2013 2014 2015 2016 2017 2018 2019 2020 2021 2022
Bac
klo
g $
in M
illio
ns
Backlog $ - ForIncremental IncreaseOf Funding to $10.2M

24 | P a g e
Table 9 – Proposed Deferred Maintenance Funding, all sources, for fiscal year 2016-17
DM Fund / Building Group $
Deferred Maintenance / MTCU $10,200,000
Residence $3,114,000
Athletics $50,000
Health Science Centre $600,000
Roadways and Parking $358,000
McMaster University Student Centre $55,000
Total $14,377,000
7. Conclusion
Priority 1, 2, and 3 deficiencies amount to over $295 million excluding residences. With a prioritized plan
focusing on high priority buidling systems only, the DM deficiencies for the academic and administrative
buildings for the prioritized building components is $158.5 million. The historical $2 to $3 million annual
allocation for deferred maintenance will not address the existing deferred maintenance backlog or
provide an appropriate Asset Management Plan for the University. Funding the backlog at the current
levels will result in the FCI increasing, pushing the University further down the poor condition rating
continuum. This growing liability will continue to pressure Facility Services’ ability to maintain the
current condition of the buildings and will increase the potential of unforeseen building and system
failures, which threatens the normal operation of the University.
A $10.2 million annual investment will maintain control of the priority 1, 2 and 3 requirements and will
also put McMaster in compliance with the provincial government’s Building Together guidelines. This
plan will also enable Facility Services to support the President’s initiative, Forward with Integrity,
through the provision of enhanced facilities that supports the student’s learning experience and
advanced research environment.

25 | P a g e
Appendix A: McMaster University Facility Condition Index – Owned Buildings
and Infrastructure excluding Residences – 2012
Bldg # Asset Name Area
(sq.m) Replacement
Value Currently
Critical Potentially
Critical Necessary Total FCI
Cost FCI
1 University Hall 4,520 $18,804,872 $1,446,442 $2,251,057 $5,036,539 $8,734,036 0.46
2 Hamilton Hall 4,818 $20,044,663 $29,559 $103,476 $1,307,852 $1,440,887 0.07
4 Refectory 2,171 $6,554,879 $112,883 $163,451 $701,823 $978,158 0.15
7 Alumni House 606 $803,295 $104,429 $9,872 $181,382 $295,683 0.37
8 Alumni Memorial Hall 1,306 $3,943,193 $53,574 $3,154 $308,150 $364,876
0.09
9 Nuclear Research Building 5,853 $24,350,646 $35,430 $1,808,500 $1,785,186 $3,629,117
0.15
10
Mills Memorial Library / Museum of Art 22,169 $38,914,798 $1,047,897 $822,769 $4,760,836 $6,631,505
0.17
11 Burke Science Building 18,246 $75,910,111 $37,356 $518,177 $1,483,259 $2,038,793
0.03
12 E.T. Clarke Centre 4,967 $56,368,347 $1,251,668 $14,129,201 $6,410,527 $21,791,393 0.39
15 Nuclear Reactor 2,261 $9,406,597 $53,010 $657,566 $665,162 $1,375,738 0.15
16
John Hodgins Engineering Building 23,056 $95,921,491 $452,948 $11,249,136 $7,992,502 $19,694,585
0.21
17 Divinity College 3,544 $14,744,351 $180,709 $1,933,227 $3,542,839 $5,656,776 0.38
20 Gilmour Hall 8,373 $17,490,862 $214,875 $3,589,530 $4,465,706 $8,270,112 0.47
22 General Sciences Building 5,535 $23,027,648 $806,930 $6,525,927 $1,801,367 $9,134,225
0.40
23 Chester New Hall 8,163 $33,961,100 $700,117 $2,336,187 $6,778,566 $9,814,870 0.29
24 Ivor Wynne Centre 22,943 $37,859,850 $299,010 $6,953,826 $5,316,742 $12,569,580
0.33
25 A.N. Bourns Science Building 26,893 $111,884,830 $2,069,722 $8,071,278 $12,534,460 $22,675,463
0.20
28 Commons Building 5,244 $15,833,157 $536,703 $1,421,234 $3,430,139 $5,388,075
0.34
29 Togo Salmon Hall 13,050 $27,260,928 $2,216,578 $3,611,509 $6,159,972 $11,988,057 0.44
30 Biology Greenhouse 778 $3,236,768 $174,244 $665,105 $839,346
0.26
31 Campus Services Building 4,825 $10,079,232 $227,240 $1,172,637 $2,294,709 $3,694,589
0.37
32
Tandem Accelerator Building 3,390 $14,103,654 $0 $548,963 $886,551 $1,435,511
0.10
33 Applied Dynamics Building 1,996 $8,304,099 $0 $487,734 $1,239,207 $1,726,939
0.21
34 Psychology Building 8,410 $34,988,712 $38,105 $833,119 $2,997,371 $3,868,596
0.11
37 Health Sciences 118,268 $221,138,952 $3,320,098 $15,638,767 $59,553,983 $78,512,848 0.36

26 | P a g e
Centre
38 Kenneth Taylor Hall 11,798 $49,084,045 $1,678,427 $2,173,296 $4,960,899 $8,812,623
0.18
39 Life Sciences Building 9,927 $41,299,993 $1,291,093 $8,234,192 $3,805,816 $13,331,103
0.32
42
H. G. Thode Library of Science & Engineering 8,156 $14,316,798 $481,305 $3,218,781 $360,733 $4,060,816
0.28
43
Communications Research Laboratory 2,681 $11,153,952 $23,120 $345,250 $629,953 $998,322
0.09
46
Michael G. DeGroote School of Business 6,914 $28,764,798 $117,292 $929,186 $1,249,763 $2,296,241
0.08
47 CIM Building 1,284 $5,341,915 $0 $166,335 $222,373 $388,708 0.07
48
Institute for Applied Health Sciences 16,485 $68,583,699 $2,226 $12,759 $36,751 $51,736
0.00
49
Information Technology Building 11,494 $47,819,293 $0 $0 $80,130 $80,130
0.00
51
McMaster University Student Centre 13,511 $40,726,342 $217,813 $7,688 $92,353 $317,854
0.01
52
Michael DeGroote Centre for Learning & Discovery 28,254 $117,547,094 $36,038 $58,569 $2,061,268 $2,155,873
0.02
54 David Braley Athletics Centre 13,051 $54,296,989 $113,850 $703,633 $817,484
0.02
55 Ron V. Joyce Stadium 5,290 $8,729,399 $0 $200,551 $0 $200,551
0.02
56
Engineering Technology Building 11,669 $48,547,358 $8,390 $22,329 $0 $30,719
0.00
57 Ron Joyce Centre 9,624 $26,824,000 $0 $0 $0 $0 0.00
T13 Preliminary Medical Bldg. 2,143 $8,915,673 $0 $640,286 $1,228,815 $1,869,102
0.21
T18 Dramatic Arts 156 $298,545 $7,467 $9,641 $17,108 0.06
T26 Scourge Building 196 $815,433 $1,626 $25,991 $27,618 0.03
T28 T28 - Temporary Lecture Hall 472 $903,290 $0 $5,137 $9,596 $14,734
0.02
T29 T29 - Temporary Lecture Hall 564 $1,079,355 $0 $5,137 $11,081 $16,219
0.02
Zones 1-7 Elec-Zone 1-7
$9,425,000 $6,443,360 $973,560 $31,273 $7,448,193 0.79
1-00 Tunnels 1-01 TO 1-03
$2,028,886 $40,955 $16,223 $280,153 $337,331 0.17
10-00 Tunnels 10-01 TO 10-02
$1,883,965 $23,549 $66,827 $127,437 $217,814 0.12

27 | P a g e
2-00 Tunnels 2-01 TO 2-04
$3,260,709 $61,494 $2,606 $76,684 $140,784 0.04
3-00 Tunnels 3-01 TO 3-03
$1,666,585 $16,517 $3,257 $41,697 $61,472 0.04
4-00 Tunnels 4-01 TO 4-19
$14,781,881 $231,854 $310,694 $1,440,280 $1,982,828 0.13
5-00 Tunnels 5-01 TO 5-07
$4,383,842 $98,428 $25,207 $427,396 $551,030 0.13
6-00 Tunnels 6-01 TO 6-02
$960,098 $20,947 $7,297 $35,182 $63,427 0.07
7-00 Tunnels 7-01 TO 7-08
$4,601,223 $78,355 $36,259 $522,518 $637,131 0.14
8-00 Tunnels 8-01 TO 8-02
$2,391,187 $31,618 $12,964 $72,123 $116,707 0.05
9-00 Tunnels 9-01 TO 9-03
$2,499,877 $29,466 $11,728 $73,947 $115,141 0.05
Zone 1 Zone 1 - INF - M and E
$702,975 $41,701 $33,840 $5,864 $81,404 0.12
Zone 2 Zone 2 - INF - M and E
$1,953,912 $48,012 $14,691 $161,577 $224,279 0.11
Zone 3 Zone 3 - INF - M and E
$2,712,969 $135,309 $124,279 $54,583 $314,171 0.12
Zone 4 Zone 4 - INF - M and E
$172,404 $1,470 $159,606
$0
$161,076 0.93
Zone 5 Zone 5 - INF - M and E
$246,873 $165,707 $70,245 $12,414 $248,366 1.01
Zone 6 Zone 6 - INF - M and E
$3,222,039 $2,217,615 $367,007 $11,727 $2,596,349 0.81
Zone 7 Zone 7 - INF - M and E
$2,024,789 $79,961 $1,449,228 $10,424 $1,539,614 0.76
Total 475,054 $1,558,904,217 $28,864,772 $104,835,031 $161,174,010 $294,873,815 0.19

28 | P a g e
Appendix B: McMaster University Facility Condition Index – Residences – 2012
Bldg # Asset Name Area
(sq.m) Replacement
Value Currently
Critical Potentially
Critical Necessary Total FCI
Cost FCI
05 Edwards Hall 2,325 $4,835,650 $28,209 $138,673 $1,070,593 $1,237,475 0.26
06 Wallingford Hall 2,180 $5,006,573 $22,502 $65,466 $633,251 $721,219 0.15
18 Moulton Hall 5,453 $13,613,985 $23,120 $894,332 $566,187 $1,483,639 0.11
19 Whidden Hall 6,502 $11,059,655 $0 $140,587 $564,804 $705,391 0.06
26 Matthews Hall 5,742 $13,605,622 $1,108,012 $205,983 $2,038,678 $3,352,673 0.25
27 McKay Hall 6,208 $14,013,959 $92,679 $54,150 $3,187,249 $3,334,168 0.24
35 Woodstock Hall 5,978 $12,434,335 $23,120 $308,643 $801,374 $1,133,137 0.09
36 Brandon Hall 10,996 $19,797,902 $1,077,269 $84,571 $929,139 $2,090,979 0.11
40 Bates Residence 15,241 $27,902,958 $728,749 $874,601 $3,900,238 $5,503,588 0.20
45 Hedden Hall 9,688 $1,617,475 $71,549 $0 $1,199,508 $1,271,057 0.08
50 Mary Keyes 13,582 $28,327,158 $0 $0 $1,183,391 $1,183,391 0.00
53 Les Prince Hall 9,849 $20,576,720 $0 $36,408 $0 $36,408 0.00

29 | P a g e
Appendix C: Building Audits
Batch 1 – Completed in June 2012
Bldg. # Building Name
Construction Year
Original Audit Year
Original FCI
Academic Portfolio
9 Nuclear Research Building 1950 2005 0.07
11 Burke Sciences Building 1953 2005 0.01
12 E.T. Clarke Centre 1954 2005 0.45
16 J.H. Engineering 1958 2005 0.08
22 General Sciences Building 1962 2005 0.07
25 Arthur Bourns Building 1968 2005 0.03
34 Psychology Building 1970 2003 0.05
38 Kenneth Taylor Hall 1971 2009 0.09
39 Life Sciences Building 1970 2005 0.03
43 Communications Research Laboratory 1983 2009 0.04
48 Institute for Applied Health Sciences 2000 2008 0
49 Information Technology Building 1955 2008 0
52 Centre for Learning and Development 2004
Not Audited
0
Residences Portfolio
5 Edwards Hall 1931 2006 0.08
6 Wallingford Hall 1930 2006 0.12
18 Moulton Hall 1961 2006 0.06
19 Whidden Hall 1961 2006 0.07
26 Matthews Hall 1965 2006 0.04
27 McKay Hall 1965 2006 0.06
35 Woodstock Hall 1970 2006 0.05
36 Brandon Hall 1970 2006 0.08
40 Bates Residence 1973 2006 0.02
45 Hedden Hall 1990 2006 0.04
50 Mary E. Keyes Residence 2003 2006 0
53 Les Prince Hall 2006
Not Audited
0

30 | P a g e
Batch 2 – Completed in September 2012
Academic and Ancillary Portfolio
1 University Hall 1929 2008 0.13
2 Hamilton Hall 1929 2008 0.01
4 Refectory Building 1929 2008 0.12
7 Alumni House 1929 2003 0.31
8 Alumni Memorial House 1949 2005 0.08
10 Mills Memorial Library 1962 2005 0.10
15 Nuclear Reactor 1957 2009 0.23
17 Divinity College 1959 2005 0.19
20 Gilmour Hall 1959 2005 0.20
21 Wentworth House 1959 2005 0.35
23 Chester New Hall 1964 2009 0.11
24 Ivor Wynne Centr 1964 2008 0.14
28 Commons 1965 2009 0.07
29 Togo Salmon 1965 2009 0.13
30 Biology Greenhouse 1967 2005 0.76
31 Campus Services Building 1968 2008 0.12
32 Tandem Accelerator 1966 2005 0.08
33 Applied Dynamics Laboratory 1967 2005 0.12
42 Thode Library 1976 2005 0.08
46 DeGroote School of Business 1990 2009 0.06
47 CIM 1983 2005 0.13
54 David Braley Athletics Centre 2007 2008 0.01
55 Ron V. Joyce Stadium 2008 2008 0
56 Engineering Technology Building 2009 2010 0
T13 Preliminary Medical Building 1967 2009 0.17
T18 Dramatic Arts 2000 2003 0.01
T26 Scourge Building 1989 2009 0.11
T28
2002 Not
Audited 0
T29
2003 Not
Audited 0
51 McMaster Student Centre 2011
0

31 | P a g e
Appendix D: Critical Deferred Maintenance Requirements - Examples:
Bldg. No. Bldg. Name Order of Magnitude Budget Estimate
N/A NF91 Substation $1,960,000
Scope Description Risks
Engineer the Substation replacement and Phase 1
of Substation replacement (A phased in
replacement is proposed - Phase 2 and 3 for years
2 & 3 respectively)
The Substation/Transformers are beyond their service
life. Failure will affect power supply to the whole
campus. This is a multiyear project. Hydro One has
stepped up their replacement of this vintage of
equipment due to failures.
Bldg. No. Bldg. Name Order of Magnitude Budget Estimate
12 E.T. Clarke Centre $4,000,000
Scope Description Risks
Replace Boiler # 4 – 150,000 mbh. The existing Foster Wheeler boiler is beyond its
service life (42+). Failure will affect the whole campus
as it supplies steam to all buildings on campus.

32 | P a g e
Bldg. No. Bldg. Name Order of Magnitude Budget Estimate
20 Gilmour Hall $744,000
Scope Description Risks
Replace Substation Transformer is overloaded and heats up. It could
fail at any time.
Bldg. No. Bldg. Name Order of Magnitude Budget Estimate
23 Chester New Hall $200,000
Scope Description Risks
Repair parapet walls on north side, repair parapet
wall on west side – low roof
Repair parapet walls that are in very poor
condition, affecting building integrity.

33 | P a g e
Bldg. No. Bldg. Name Order of Magnitude Budget Estimate
24 Ivor Wynne Centre $100,000
Scope Description Risks
Replace flat roof area Flat roof area is in very poor condition with many
active leaks and fully saturated insulation,
affecting building integrity.
Bldg. No. Bldg. Name Order of Magnitude Budget Estimate
29 Togo Salmon Hall $750,000
Scope Description Risks
Reengineer window detail and replace windows,
re-caulk exterior precast panels
Window detail and poorly caulked joints permit
water/moisture penetration affecting building
integrity.

34 | P a g e
Bldg. No. Bldg. Name Order of Magnitude Budget Estimate
1 University Hall $586,000
Scope Description Risks
Replace windows Windows are original – single pane leaded. They
are beyond their service life, not energy efficient
and require immediate replacement
Bldg. No. Bldg. Name Order of Magnitude Budget Estimate
12 E.T. Clark Centre $500,000
Scope Description Risks
Replace 3 roof sections and repairs to 2 sections 3 roof areas are in very poor condition and require
immediate replacement. 2 areas that were
replaced a few years back require repairs

35 | P a g e
Bldg. No. Bldg. Name Order of Magnitude Budget Estimate
38 Kenneth Taylor Hall $620,000
Scope Description Risks
Reengineer window detail and replace windows,
re-caulk exterior precast panels
Window detail and poorly caulked joints permit
water/moisture penetration affecting building
integrity.
Bldg. No. Bldg. Name Order of Magnitude Budget Estimate
39 Life Sciences Building $200,000
Scope Description Risks
Structural repairs to retaining wall in the patio
area. Re-caulk windows and concrete precast
panels.
Retaining wall is shifting pulling out the patio away
from the building and needs repairs. There is also
some serious water penetration on the north side
due to poorly caulked joints affecting building
integrity.

36 | P a g e
Bldg. No. Bldg. Name Order of Magnitude Budget Estimate
43 Communications Research Lab $25,000
Scope Description Risks
Replace radiation pump and add redundancy The only heating pump in this building is in poor
condition and if it fails there will not be heat in the
building.
Bldg. No. Bldg. Name Order of Magnitude Budget Estimate
7 Alumni Hall $188,000
Scope Description Risks
Exterior windows and exterior door replacement Windows are original – single pane leaded. They
are beyond their service life, not energy efficient
and require immediate replacement

37 | P a g e
Bldg. No. Bldg. Name Order of Magnitude Budget Estimate
22 General Sciences Building $542,000
Scope Description Risks
Exterior windows replacement Windows are original – single pane. They are
beyond their service life, not energy efficient and
require immediate replacement. Many are leaking
causing water damage on walls and sill

38 | P a g e
Bldg. No. Bldg. Name Order of Magnitude Budget Estimate
16 John Hodgins Engineering Building $450,000
Scope Description Risks
Exterior windows replacement on the south
façade, north side of the south block and west side
Windows are original – single pane. They are
beyond their service life, not energy efficient and
require immediate replacement