Asset Management Plan 2015-18 - Auckland Transport · Approves the Auckland Transport Asset...
23
Board Meeting| 27 July 2015 Agenda item no. 10.1 Open Session Asset Management Plan 2015-2018 Recommendation That the Board: i. Approves the Auckland Transport Asset Management Plan 2015-2018 as summarised in the Strategic Summary included as Attachment 1. ii. Authorises the issue of the Auckland Transport Asset Management Plan 2015-2018 to Auckland Council and other stakeholders. iii. Authorises the publication of the Auckland Transport Asset Management Plan 2015-2018 in hard copy and to the Auckland Transport internet site. Executive summary Auckland Transport (AT) manages the most complex and diverse transport network in New Zealand, connecting people and moving goods across New Zealand’s largest and fastest growing city. The road network provides for eight billion km of vehicle travel annually, with 2% to 6% of this travel being by heavy commercial vehicles moving over 62 million tonnes of freight. The road network has a value of just under $12 billion. The public transport network accommodates 79 million trips annually (2014/2015). It has a value just under $1.4 billion including physical infrastructure and rolling stock. The transport network is depreciating at a rate of $261 million annually or $715,000 daily. It is therefore critical that renewals and maintenance investment is given sufficient priority to “look after what we have”. Approximately 1% of the transport network is now in a “very poor” condition. This is equivalent to $157 million of backlog. The Asset Management Plan (AMP) recommends $2.88 billion of renewal investment over 10 years. This is a sustainable funding requirement. The Long Term Plan (LTP) constrains the level of funding for renewals to $2.13 billion over 10 years. While it sets the level of renewals funding at close to the recommended AMP levels for the first three years, it also creates a significant and widening funding gap from 2018/2019 onwards. Under this funding scenario 9.4% of transport assets would be in “very poor” condition after 10 years, equivalent to a backlog of $968 million. The level of renewal funding identified in the LTP will have minimal impact over the first three years (2015-2018). This will provide opportunity to revisit condition models to confirm trends and update asset management risk and intervention strategies. The revised information will be used to inform the next AMP and LTP covering the period 2018-2021.
Transcript of Asset Management Plan 2015-18 - Auckland Transport · Approves the Auckland Transport Asset...

Board Meeting| 27 July 2015 Agenda item no. 10.1
Open Session
Asset Management Plan 2015-2018
Recommendation
That the Board:
i. Approves the Auckland Transport Asset Management Plan 2015-2018 as summarised in the Strategic Summary included as Attachment 1.
ii. Authorises the issue of the Auckland Transport Asset Management Plan 2015-2018 to Auckland Council and other stakeholders.
iii. Authorises the publication of the Auckland Transport Asset Management Plan 2015-2018 in hard copy and to the Auckland Transport internet site.
Executive summary
Auckland Transport (AT) manages the most complex and diverse transport network in New Zealand, connecting people and moving goods across New Zealand’s largest and fastest growing city.
The road network provides for eight billion km of vehicle travel annually, with 2% to 6% of this travel being by heavy commercial vehicles moving over 62 million tonnes of freight. The road network has a value of just under $12 billion.
The public transport network accommodates 79 million trips annually (2014/2015). It has a value just under $1.4 billion including physical infrastructure and rolling stock.
The transport network is depreciating at a rate of $261 million annually or $715,000 daily. It is therefore critical that renewals and maintenance investment is given sufficient priority to “look after what we have”.
Approximately 1% of the transport network is now in a “very poor” condition. This is equivalent to $157 million of backlog. The Asset Management Plan (AMP) recommends $2.88 billion of renewal investment over 10 years. This is a sustainable funding requirement.
The Long Term Plan (LTP) constrains the level of funding for renewals to $2.13 billion over 10 years. While it sets the level of renewals funding at close to the recommended AMP levels for the first three years, it also creates a significant and widening funding gap from 2018/2019 onwards. Under this funding scenario 9.4% of transport assets would be in “very poor” condition after 10 years, equivalent to a backlog of $968 million.
The level of renewal funding identified in the LTP will have minimal impact over the first three years (2015-2018). This will provide opportunity to revisit condition models to confirm trends and update asset management risk and intervention strategies. The revised information will be used to inform the next AMP and LTP covering the period 2018-2021.

Board Meeting| 27 July 2015 Agenda item no. 10.1
Open Session
Strategic context
The Local Government Act 2002 (LGA) requires Auckland Transport (AT) to manage its transport assets in an effective manner. The AMP enables AT to demonstrate how it is meeting this requirement for renewals and maintenance activities. It forms the basis of:
The maintenance and renewals budgets and programmes in the Regional Land Transport Programme (RLTP) and LTP
AT’s eligibility for NZTA subsidy of its maintenance and renewals programmes
The AMP also contributes to all of AT’s strategic themes, and particularly to:
Building network optimisation and resilience
Ensuring a sustainable funding model.
Strategic planning for network growth and associated improvements to levels of service is led by the Integrated Transport Programme. The AMP contributes by setting out the financial impacts of growth and the whole-of-life costs of new transport assets.
Background
Auckland Transport is the guardian of one of New Zealand’s largest and most strategically important asset portfolios, comprising $13.4 billion of road and public transport assets that are essential to the social and economic well-being of New Zealand’s largest city.
The AMP optimises renewals and maintenance investment across AT’s asset portfolio by balancing cost, risk and levels of service to develop whole of life strategies to maintain assets and to renew at the optimal time.
This is the second AMP which AT has produced, the first being in 2012. The 2012-2015 AMP integrated the systems and data of eight legacy councils, and set out a plan to maintain the condition and value of AT assets.
This 2015-2018 AMP builds on earlier achievements and aligns AT with national and international best practice standards for asset management planning. The AMP is constructed as a set of linked documents:
A Strategic Summary, included as Attachment 1
The Asset Management Plan
15 Asset Class Management Plans, technical documents prepared mainly for internal use.
Annual updates of this AMP will be published in mid-year 2016 and 2017, with AT’s third AMP being published in 2018. This document will align AT’s roading network and levels of service with NZTA’s One Network Road Classification (ONRC), providing a greater emphasis on customer

Board Meeting| 27 July 2015 Agenda item no. 10.1
Open Session
satisfaction measures. NZTA expects that ONRC will be the basis for allocation of its contribution to maintenance and renewals of local roads from 2018 onwards.
Issues and options
Growth and demand
The AMP estimates that AT’s asset portfolio is growing by 1.5% per year, through a combination of vested assets from new development and AT capital projects. This calculation is based on past trends so could prove to be an underestimate if the rate of development increases as envisaged in the Auckland Housing Accord.
Growth in the asset base means that the cost of maintenance and asset-based operations increases by around 1.5% each year, adding a cumulative $119 million to opex funding requirements over 10 years.
The cost of renewals also increases over the 10 years of the AMP. Although the relationship between asset growth and costs is more complex for renewals than for maintenance, in the long term a growing asset portfolio inevitably means higher renewals costs. In part this is a consequence of past decisions on vested and growth related assets, and the passage of time between construction and the need for renewal work.
Recommended and approved funding – Renewals
The LTP has provided sufficient funding to keep up with network renewals in the three years from 2015/2016 to 2017/2018. This will enable AT to manage network assets to current levels of service, with less than 1% of network assets in very poor condition.
From 2018/2019 onwards, LTP funding does not allow AT to maintain assets in their current condition. It is expected that by 2025, 9.4% of transport assets will be in very poor condition. This represents a significant deterioration of the network and a loss of investment value.
Recommended and approved funding – maintenance
For roads, footpaths and parking, maintenance budgets as approved in the LTP are aligned with the AMP recommendation in 2015/2016, but do not increase at all thereafter.
For public transport, maintenance budgets increase by an average of 1.9% per year over the 10 years of the LTP.
The priority given to public transport maintenance budgets aligns with AT’s strategic themes and reflects the need for maintenance services to increase as patronage grows. Patronage grew in 2014/2015 by 9.4% to over 79 million trips, and LTP targets equate to a 3.4% year-on-year growth in patronage over the coming decade.

Board Meeting| 27 July 2015 Agenda item no. 10.1
Open Session
While the road network is growing in length through new development, use of the road network measured as vehicle kilometres travelled is not increasing. There were 8 billion km of vehicle travel on Auckland local roads in 2014, a figure that has not changed significantly since 2006.
The gap between asset needs and funding widens each year due to:
inflation
growth in the asset base
increased use of the road network as Auckland’s population and economy grows
public transport patronage growth (LTP patronage targets equate to an average of 3.4% growth per year over the coming decade.)
the impact on maintenance costs of the shortfall in renewals funding – assets in worse condition have higher maintenance requirements
Funding impacts on risk
Deteriorating asset condition resulting from the shortfall in maintenance and renewals budgets will increase network and organisational risk. This includes:
Health & Safety – increased risk of asset failure leading to injuries or impacts to staff, agents or the public.
Reputation – adverse media coverage, community concerns, legal challenges or damage to stakeholder confidence, risk to achieving the customer satisfaction measures in AT’s Statement of Intent.
Finance – increased whole of life costs because maintenance and renewals work is not done at the optimal time. Risk of loss of investment value and inability to rebuild that investment.
Environment – increased impacts on air, land and water. For example maintaining cesspits to a lower level of service leads to more pollutants entering waterways and to a higher risk of flooding and slips.
Service Delivery/Asset Management - an increasing proportion of assets in poor and very poor condition, for example road pavements which are noticeably rough, with potholes that allow water into the construction layers.
Next steps
Beginning in 2016/2017, there will be a gap between maintenance requirements and available funding which will widen each year. From 2018/2019, there will also be a gap between renewals requirements and funding.
To mitigate negative outcomes for the network, users and stakeholders, it will be necessary to:

Board Meeting| 27 July 2015 Agenda item no. 10.1
Open Session
Reprioritise work from lower-risk to higher-risk assets (for example from low volume roads to arterials)
Closely monitor network condition and customer satisfaction for negative trends
Enhance condition and network needs forecasting capability
Develop options for reducing levels of service and increasing the level of managed risk, in line with approved levels of funding
An annual update to the Asset Management Plan will be prepared and will inform the optimisation of maintenance budgets in 2016/2017 and 2017/2018.
AT will work closely with NZTA and Auckland Council in preparing for the 2018 LTP, to ensure that the consequences of approved funding levels are clear, and that the trade-offs between cost, risk and levels of service are transparent.
Attachment
Attachment Number
Description
1 Asset Management Plan Strategic Summary

Board Meeting| 27 July 2015 Agenda item no. 10.1
Open Session
Submitted by Siri Rangamuwa
AM Planning Manager
pp
Recommended by Andy Finch
Manager, Strategic AM and Systems
Recommended by Tony McCartney
Group Manager Road Corridor
Recommended by Greg Edmonds
Chief Infrastructure Officer
Approved for submission David Warburton
Chief Executive
Glossary
Acronym Description
AMP Asset Management Plan
AT Auckland Transport
LGA The Local Government Act 2002
LTP Long Term Plan
ONRC One Network Road Classification
RLTP Regional Land Transport Programme
NZTA New Zealand Transport Agency


Document control
File name File location Document version Document date
AMP Strategic Summary Sharpoint/Asset Management Plan 2015 - 2018
26 June 15
Name Signature Date
Written by
Anna Percy
ONRC Project Manager
Siri Rangamuwa
Asset Management Planning Manager
Reviewed by
Andy Finch
Manager Strategic Asset Management and Systems
Reviewed by
Tony McCartney
Group Manager Assets and Maintenance
Recommended by
Greg Edmonds
Chief Infrastructure Officer
Approved by David Warburton
Chief Executive

Table of Contents
The Asset Management Plan (AMP) at a Glance ............................................................................................... 1
1. Strategic Themes Alignment ....................................................................................................................... 2
2. The Transport Asset Portfolio ...................................................................................................................... 3
3. Levels of Service ......................................................................................................................................... 4
Customer Levels of Service ............................................................................................................................. 4
Technical Levels of Service ............................................................................................................................. 4
4. Asset Management Planning ....................................................................................................................... 5
5. Growth and Demand .................................................................................................................................... 6
Population and asset growth ........................................................................................................................... 6
Consequential opex ......................................................................................................................................... 7
6. Asset Investment and Funding .................................................................................................................... 8
Asset investment needs, maintenance and operations ................................................................................... 8
Approved funding, maintenance and operations ............................................................................................. 8
Asset investment needs, renewals .................................................................................................................. 9
Approved funding, renewals .......................................................................................................................... 10
7. Network Asset Risk .................................................................................................................................... 12
8. The One Network Road Classification ....................................................................................................... 13
9. Moving Towards AMP 2018 ...................................................................................................................... 13

1
The Asset Management Plan (AMP) at a Glance
Auckland Transport’s (AT’s) plan to improve transport starts with looking after what we have:
AT is responsible for transport assets with a replacement value of 13.4 billion1
Auckland’s road network (excluding motorways) is valued at $12 billion. These assets provide for 8 billion km of vehicle travel, over 180 million walking and cycling trips, and the movement of over 62 million tonnes of freight to, from and within Auckland each year.
Auckland’s public transport network assets are valued at $1.4 billion. The PT network will carry over 79 million trips in 2014/2015.
Transport network assets are depreciating with time and use – at a rate of $261 million per year or $715,000 per day.
Network levels of service have been stable 2012-2015, and customer satisfaction is high:
Customer satisfaction with roads is 71%, footpaths is 63%, public transport 81%
97% of network assets are in “Very Good”, “Good” or “Moderate” condition
Backlog (assets past their renewals intervention point) is manageable at $104 m
Transport networks are growing in line with population growth, by an estimated 1.5% per year.
The maintenance and operations of transport networks is the second largest item of AT operational expenditure each year, after public transport service contracts.
Public transport asset maintenance and operations for the coming 10 years2 is $0.72 billion
Road maintenance and asset-based operations for the coming 10 years $1.16 billion
Costs are increasing by around 1.5% per year, as more road and PT assets are added to the network.
Renewals will be AT’s largest item of capital expenditure over the coming 10 years (the City Rail Link is second). Renewals needs are assessed in the AMP based on providing a fit for purpose level of service and managing risk while optimising whole of life costs.
AT has spent close to $200 million on renewals each year from 2012-2015. Uninflated Inflated
Renewals funding recommended in the AMP over the coming 10 years is 2.88 b $3.44 b
Renewals funding approved in the Accelerated Transport Programme is 2.13 b $2.51 b
Approved Renewals funding is sufficient in first 3 years of the 10 year LTP.
The 2018 AMP is an opportunity to review fundling levels from 2018/2019, in order to maintain the agreed level of service from transport assets.
If renewals spend is $3.44 billion (recommended), then by 2025 there will be <1% of assets in very poor condition
If renewals spend is $2.13 billion (approved), then by 2025 there will be 9.4% of assets in very poor condition
If renewals are deferred, maintenance needs increase and levels of service decline.
1 Excluding land, corporate assets and intangibles (eg. software). Current, depreciated value of these assets is $9 billion.
2 All financial data is as per the adopted Auckland Council Long Term Plan
2
1. Strategic Themes Alignment
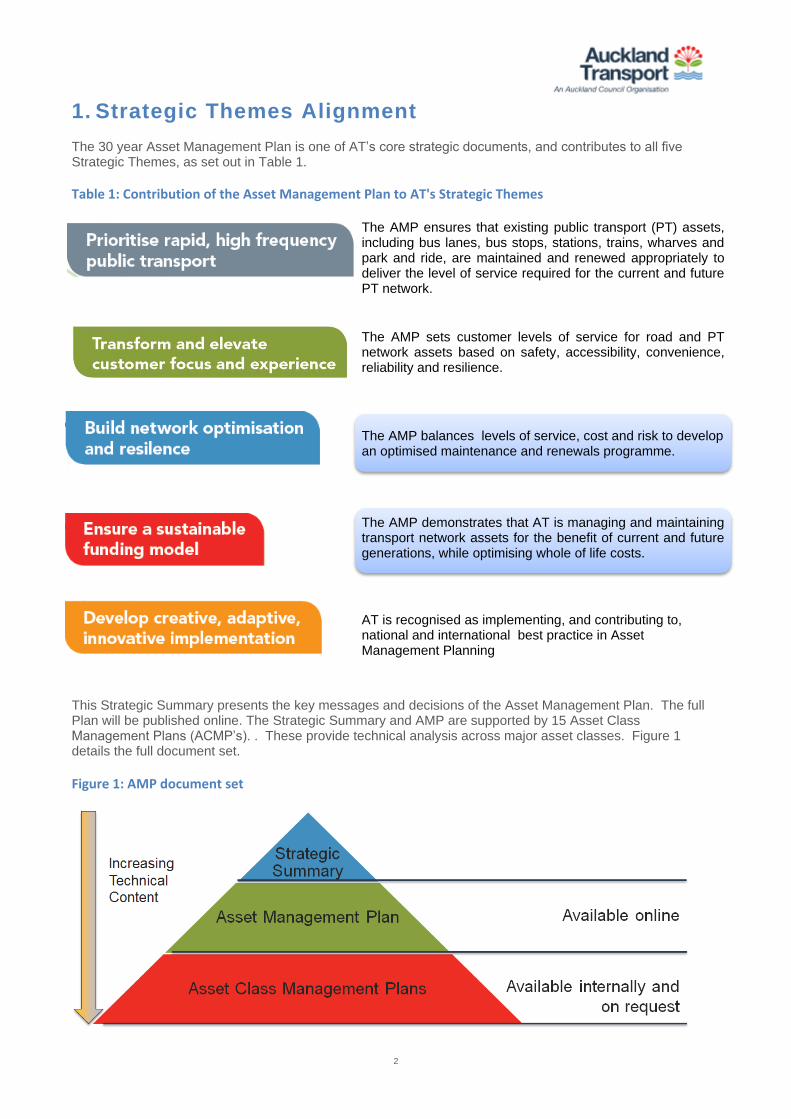
The 30 year Asset Management Plan is one of AT’s core strategic documents, and contributes to all five Strategic Themes, as set out in Table 1.
Table 1: Contribution of the Asset Management Plan to AT's Strategic Themes
The AMP ensures that existing public transport (PT) assets, including bus lanes, bus stops, stations, trains, wharves and park and ride, are maintained and renewed appropriately to deliver the level of service required for the current and future PT network.
The AMP sets customer levels of service for road and PT network assets based on safety, accessibility, convenience, reliability and resilience.
The AMP balances levels of service, cost and risk to develop an optimised maintenance and renewals programme.
The AMP demonstrates that AT is managing and maintaining transport network assets for the benefit of current and future generations, while optimising whole of life costs.
AT is recognised as implementing, and contributing to, national and international best practice in Asset Management Planning
This Strategic Summary presents the key messages and decisions of the Asset Management Plan. The full Plan will be published online. The Strategic Summary and AMP are supported by 15 Asset Class Management Plans (ACMP’s). . These provide technical analysis across major asset classes. Figure 1 details the full document set.
Figure 1: AMP document set

3
2. The Transport Asset Portfolio
AT manages the most complex and diverse transport network in New Zealand, connecting people and moving goods across NZ’s largest and fastest growing city.
Auckland’s local road network provides for 8 billion km of vehicle travel, over 180 million walking and cycling trips, and the movement of over 62 million tonnes of freight each year. Road assets managed by AT have a replacement value of $11.974 billion, and a current (depreciated) value of $7.684 billion as shown in Table 2.
Table 2: Road assets
ROADS Replacement value Current value
7,302 kilometres roads $6.910 billion $4.724 billion (68%)
12,000 km stormwater channel, 75,481 catch pits
$2.341 billion $1.524 billion (65%)
6,959 kilometres of footpaths, 321 km of cycleways
$0.865 billion $0.487 billion (56%)
1,020 bridges and major culverts
$0.819 billion $0.441 billion (54%)
Other road and parking assets $1.039 billion $0.659 billion (57%)
TOTAL VALUE ROAD ASSETS $11,974 billion $7.684 billion (65%)
Auckland’s public transport network assets are valued at $1.4 billion, and will enable over 79 million PT trips in 2014/2015. Public Transport assets are, on average, relatively new and overall current value is 83% of the assets’ replacement value (Table 3). An exception is wharves which have depreciated by around half.
Table 3: Public Transport assets
PUBLIC TRANSPORT Replacement value Current value
41 active rail stations, associated stabling and depot
$0.619 billion $0.478 billion (77%)
57 electric trains (EMUs), 10 Diesel Multiple Units
$0.504 billion $0.496 billion (98%)
6 Busway stations 2,342 bus shelters
$0.060 billion $0.046 billion (78%)
21 ferry wharves $0.110 billion $0.058 billion (53%)
AT HOP ticketing system $0.083 billion (inc. software)
$0.060 billion (72%)
TOTAL VALUE PT ASSETS $1.376 billion $1.138 billion (83%)

4
3. Levels of Service
Customer Levels of Service
Customers are more likely to be satisfied when the transport network is:
• Safe: the network is safer, and feels safer for all users over time
• Accessible: it is easy to access the network and get to your destination
• Convenient: the network is easy to use and travelling is a pleasant experience
• Reliable: travel times for people and freight are predictable and reliable
• Resilient: when things go wrong, other travel options are available and access is quickly restored
Generally Aucklanders are satisfied with the level of service provided by their transport network. Satisfaction with roads increased 2012-2014, and satisfaction with footpaths was stable, as shown in Figure 2. Satisfaction with PT services is high, but declined in 2014 due to a range of factors including rapid patronage growth. Future targets aim to maintain current satisfaction levels by ensuring that assets are maintained, operated and renewed as needed to deliver a fit for purpose level of service.
Figure 2: Customer Satisfaction trends 2012-2014 and targets 2015-2018
Satisfaction with the quality of roads
Satisfaction with the quality of footpaths
Satisfaction with public transport services
Technical Levels of Service
Underpinning the customer experience of safety, accessibility, convenience, reliability and resilience are Technical Levels of Service. For example the smoothness of road pavements, the facilities provided at public transport stops and interchanges, and footpaths that provide a nonslip surface all contribute to customer experience.
Technical Levels of Service are used throughout the AMP. The thresholds used in regular inspections of asset condition, and the intervention points for maintenance and renewals, are based on Technical Levels of Service.
AT’s approach to setting Technical Levels of Service includes consideration of strategic priorities set through the Integrated Transport Programme. Higher standards are set for some assets based on their role in the PT New Network, the Arterial Road network, the Freight Network, or the essential “lifelines” identified by the Auckland Infrastructure Lifelines Group.
In each of the past three years, the great majority of assets (97%) have been in “Very Good”, “Good” or “Moderate” condition. The AMP recommends continuing the trend of good asset condition, by steadily renewing assets at a rate that keeps pace with asset deterioration.

5
4. Asset Management Planning
AT prepared its first Asset Management Plan in 2012. The 2012 AMP:
Integrated the systems and data of eight legacy councils
Set out a plan to maintain the condition and value of AT assets
Developed a framework of Levels of Service in response to customer needs
Recommended maintenance and renewals budgets for inclusion in the Regional Land Transport Plan and in Auckland Council’s Long Term Plan to meet Auckland’s growth and economic development needs
The 2015 AMP is a major review of AT’s asset management practices and:
Uses best practice modelling systems to develop whole of life strategies to maintain assets and to renew at the optimal time
Includes more detailed consideration of Levels of Service for each class of asset. For example, bridges are renewed when they fall into “poor” condition, because the impacts of asset failure are so high. Less critical assets are renewed when their condition is “very poor”.
Calculates the consequential impacts of AT’s capital investments on long term maintenance and renewals costs
Advises on the consequences of different levels of funding for maintenance and renewals
Budgets for asset maintenance and renewals are linked to Levels of Service and Risks as shown in Figure 3. The main objective of Asset Management Planning is to achieve the right balance between these three drivers.
Figure 3: Asset Management Planning trade-offs

6
The links between asset condition, level of service, cost and risk are shown in Table 4 for the example of road pavements. This shows that as asset condition deteriorates with time and use, customer level of service declines, risk increases and the cost to bring the asset back to a fit for purpose condition increases.
Table 4: Links between level of service, cost and risk for road pavements
Condition Level of Service Cost Risk
90% of AT pavements are in Very Good, Good or Moderate condition
Customer expectations met
Needs routine maintenance only.
Cost: maintenance
$10,000 per km per year
Low risk
7% of AT pavements are in Poor condition
Defects noticeable but won’t change customer behaviour
Extent of surface problems means spot fixes are no longer adequate. Water may be entering the road construction layers.
Cost: pavement resurface $100,000 per km
Low risk
3% of AT pavements are in Very Poor condition
Poor customer experience
Wheel ruts and edge breaks indicate that road construction layers are damaged. Road is less comfortable for drivers and (especially) cyclists.
Cost: road rehabilitation $1,000,000 per km
On a fast and/or busy road, there could be a significant safety risk
5. Growth and Demand
Population and asset growth
In the three years from 2012-2015, the road network managed by AT grew by:
107 km additional local roads, with associated streetlights, footpaths, kerb & channel etc
19 additional bridges
17 additional signalised intersections
Transport asset growth occurs through:
• AT capital projects
• Vested assets – generally roads and associated assets such as streetlights in new growth areas. These are generally built by developers but the responsibility for operating, maintaining and renewing these assets is transferred to AT
• State Highway projects which can result in roads being transferred to AT to manage and maintain as local roads. Cycleways and shared paths constructed by NZTA are also transferred to AT to manage and maintain.
Table 5 shows past and projected growth in the AT asset base.

7
Table 5: Asset growth summary 2013-2018
Year Vested assets (excl. land)
AT new capital
Major assets added to network:
2012/13 $13 m $440 m Manukau Carpark building, State Highways revoked
2013/14 $39 m $518 m Tiverton/Wolverton, EMU depot and first trains
2014/15 $36 m $558 m EMU trains, AMETI, Panmure and Manukau stations
2015/16 $40 m $422 m Otahuhu Bus Interchange
2016/17 $40 m $493 m Pukekohe Interchange, Te Atatu Road
2017/18 $40 m $410 m Albany Highway Upgrade
Consequential opex
New transport assets, from whichever source, bring consequential operations, maintenance and renewals requirements. The AMP estimates that 1.5% more assets are added to the network each year. The financial impact of this is around $2 million in additional maintenance and operations funding requirements each year, just to keep up with growth in the asset base. Over the 10 years, consequential opex totals $119 million as shown in Table 6.
Table 6: Estimated consequential opex from asset growth
($million) 2015/ 2016
2016/ 2017
2017/ 2018
2018/ 2019
2019/ 2020
2020/ 2021
2021/ 2022
2022/ 2023
2023/ 2024
2024/ 2025
2016-2025 total
Consequential opex from asset growth 2.1 3.2 5.4 7.8 10.3 13.0 14.7 17.7 20.9 24.3 119.3
The rate of growth in transport assets will accelerate as Auckland’s population continues to grow and as initiatives including Strategic Housing Areas increase the supply of new housing. Preliminary calculations suggest that this will increase consequential opex requirements by $600 per dwelling per year. This suggests that the above consequential opex estimates, calculated based on past trends, could significantly underestimate the costs associated with connecting more than 10,000 new homes to the transport network each year, as envisaged by the Auckland Housing Accord.

8
6. Asset Investment and Funding
The AMP development has informed the renewal and maintenance components of the 2015 Long Term Plan and Regional Land Transport Plan. Key recommendations and decisions are summarised in Table 7.
Table 7: Summary of recommended AMP funding and approved ATP funding
Renewals are based on two funding scenarios: (10 year totals, inflated)
Recommended (AMP) renewals funding $3.44 billion
Accelerated Transport Programme (ATP) $2.51 billion
Maintenance and operations:
Roads, footpaths, parking $1.16 billion
Public transport asset maintenance and operations $0.72 billion
2016-2025 total AMP network needs $5.32 billion
(excludes PT services, corporate, and non-asset opex)
Asset investment needs, maintenance and operations
Maintenance and asset-based operations are the second largest item of AT operational expenditure each year, after public transport service contracts. Asset operations and maintenance requirements are assessed and prioritised in the AMP based on:
• For the road network:
o Asset maintenance and operations costs, based on competitively tendered service delivery contracts and known historical costs of delivering agreed Levels of Service
o Consequential operational and maintenance requirements of significant new infrastructure planned to be added to the network
o Non-asset operational costs (mainly road safety) which are not set in the AMP but are included for context
• For the public transport network:
o PT facilities maintenance and operations costs, based on the hours of operation, frequency of services, customer Levels of Service and other cost drivers as set in the Regional Public Transport Plan, and impact of approved changes to the current Levels of Service
o Bus, rail and ferry service costs which are not set in the AMP
Over the decade from 2016, consequential opex from growth as shown in Table 6 is the major factor driving maintenance and operations funding needs.
Approved funding, maintenance and operations
The approved ATP budget does not make any provision for the impact of consequential opex; road maintenance budgets do not increase at all over the coming 10 years as shown in Figure 4 and Table 8.

9
Figure 4: Maintenance and operations 2015/2016 to 2024/2025, Approved ATP funding
Table 8: Approved ATP funding for maintenance and operations
($million, inflated) 2015/ 2016
2016/ 2017
2017/ 2018
2018/ 2019
2019/ 2020
2020/ 2021
2021/ 2022
2022/ 2023
2023/ 2024
2024/ 2025
2016-2025 total
Roads maintenance and asset-based operations
116 116 116 116 116 116 116 116 116 116 1,163
Roads non-asset operations (mainly road safety)
24 24 24 24 24 24 24 24 24 24 237
PT maintenance and asset-based operations
66 65 69 70 72 73 74 75 77 78 720
PT non-asset operations (bus, rail and ferry services)
299 420 469 486 499 519 542 558 585 617 4,996
Asset investment needs, renewals
AT determines its recommended renewals programme by using a Renewals Optimisation Model to estimate the cost of renewing assets in future years based on:
• Renewing assets in the year in which they fall into “very poor” condition
• Renewing critical assets in the year in which they fall into “poor” condition. Critical assets include “front of house” PT assets and assets such as bridges where the impacts of asset failure are high.
• Accounting for new assets added to the road and PT networks
Renewals investment needs do not change steadily over time, because assets were not built at a steady rate in the past and have different condition profiles and expected lives.
Current spending on renewals is around $200 million each year and the AMP forecasts the need for spending at close to this level in each of the coming three years. From 2018/2019, renewals needs increase.
At the recommended AMP level of renewal funding, asset condition is maintained and the proportion of assets in very poor condition is maintained at 1% or less, as shown in Figure 5.
10
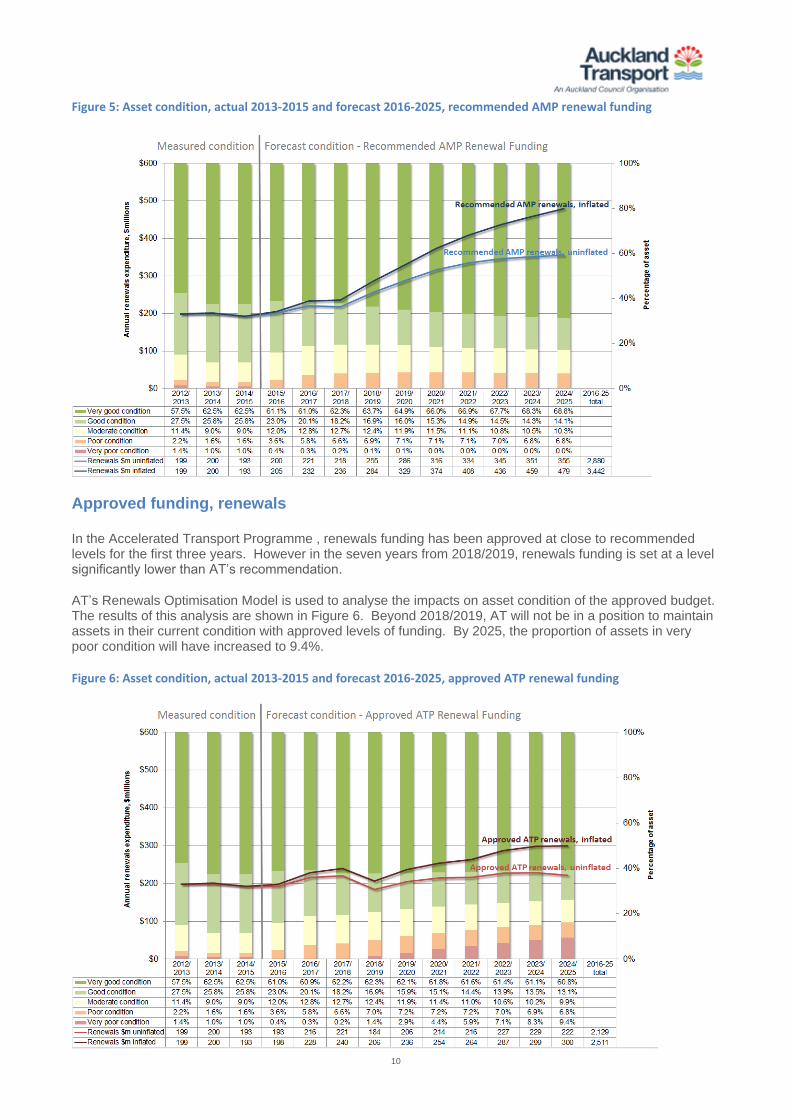
Figure 5: Asset condition, actual 2013-2015 and forecast 2016-2025, recommended AMP renewal funding
Approved funding, renewals
In the Accelerated Transport Programme , renewals funding has been approved at close to recommended levels for the first three years. However in the seven years from 2018/2019, renewals funding is set at a level significantly lower than AT’s recommendation.
AT’s Renewals Optimisation Model is used to analyse the impacts on asset condition of the approved budget. The results of this analysis are shown in Figure 6. Beyond 2018/2019, AT will not be in a position to maintain assets in their current condition with approved levels of funding. By 2025, the proportion of assets in very poor condition will have increased to 9.4%.
Figure 6: Asset condition, actual 2013-2015 and forecast 2016-2025, approved ATP renewal funding

11
Assets in “Very Poor” condition provide a lower level of service, reducing customer satisfaction. Reduced renewals expenditure may also bring higher risk and increased whole-of-life costs, through increased need for maintenance and through asset condition deteriorating more steeply because renewals did not take place at the optimal time.
The gap between recommended AMP renewals funding and approved ATP renewals funding is shown in Figure 7 and Table 9, in the context of asset depreciation.
Figure 7: Recommended AMP renewals funding and approved ATP renewals funding, in context of depreciation
Table 9: Recommended AMP renewals funding and approved ATP renewals funding
($million, inflated) 2012/ 2013
actual
2013/ 2014
actual
2014/ 2015
budget
2015/2016
2016/2017
2017/2018
2018/2019
2019/2020
2020/2021
2021/2022
2022/2023
2023/2024
2024/2025
2016-2025 total
Renewals AMP recommendation
n/a n/a n/a 205 232 236 284 329 374 408 436 459 479 3,442
Renewals ATP Total 199 200 193 198 228 240 206 236 254 264 287 299 300 2,129
Shortfall n/a n/a n/a 7 4 -4 78 92 120 144 149 160 179 1,313
Depreciation (network assets)
261 293 308 328 334 331 335 345 364 373 386 3,397
If renewals are funded at a lower level, asset condition deteriorates as shown in Figure 8. This compounds the shortfall in maintenance and operations funding, because assets in poor condition also cost more to operate and maintain.

12
Figure 8: Summary of condition impacts: recommended AMP renewals funding and approved ATP renewals funding
7. Network Asset Risk
Transport asset risks include death and serious injury risks. The list of negative outcomes that could result from transport asset failure includes:
• Injury or death to transport users, operators or members of the public
• Reduced customer satisfaction, through impacts on safety, accessibility, convenience, reliability and/or resilience
• Damage to infrastructure or property
• Reduced public transport patronage
• Increased operating and maintenance costs
• Environmental impacts (e.g. pollution of waterways, air or soil)
AT has prepared an Asset Risk Management Plan (ARMP) which identifies the key transport asset risks and sets out how those risks are managed and controlled by AT activities.
AT is represented on the Auckland Infrastructure Lifelines Group, which has identified priority routes and transport facilities and their potentially vital contribution in extreme events including earthquake, volcano, tsunami and cyclone hazards.

13
8. The One Network Road Classification
Network classification and priority setting has an increasing role in road asset management.
The One Network Road Classification (ONRC) is a joint initiative of NZTA and Local Government NZ to establish nationally consistent priorities to inform asset management planning, investment choices and maintenance and operational decisions.
AT has completed initial ONRC requirements in its AMP 2015-2018, including:
Classifying the Auckland road network based on the function of each road in the network
Measuring the current performance of the AT network using the ONRC performance measures
Developing a transition plan to guide full integration of ONRC into planning, management, financial and delivery processes in the 2018 AMP
The ONRC classification shows that Arterial and Regional roads make up 18% (1,314 km) of AT’s network by length, but carry 72% of traffic as shown in Figure 9.
Figure 9: ONRC classification of the AT network by road length and road use (vehicle km travelled)
Working to a nationally agreed road classification system is an opportunity for AT to further improve Asset Management Planning and to build the evidence linking costs, risks and levels of service.
NZTA expects that ONRC will be the basis for allocation of its contribution to maintenance and renewals of local roads from 2018 onwards. This represents a shift from subsidising AT’s programme, to co-investing in achieving a fit for purpose level of service on AT roads, based on their importance in the national network.
9. Moving Towards AMP 2018
For the first three years of the 2015 Long Term Plan, funding for renewals has been approved at levels close to the recommendations in the AMP. AT’s ongoing programme of asset condition monitoring and annual renewals work programming will allow re-prioritisation as necessary to continue to deliver levels of service and manage risk over this period.
The next Long Term Planning cycle, leading to publication of the 2018-2028 Asset Management Plan, provides an opportunity to address the significant issues raised by the proposed future shortfall in renewals funding from Year 4 of the ten-year Long Term Plan.

14
The asset management and risk mitigation tasks set out in Table 10 will ensure continuous improvement in Asset Management during the 2015-2018 period, and build the evidence base for a reassessment of renewals funding levels in the 2018 AMP.
Table 10: Asset management issues and risks 2015-2018
Issue/risk Management/mitigation tasks
Increased requirement for asset management planning
Additional monitoring, risk management and reporting activities to manage higher levels of risk and to meet new ONRC requirements
Annual updates of the AMP including key indicators such as customer satisfaction, health and safety issues, network condition and performance
Approved (ATP) maintenance and asset-based operations funding does not provide for the impacts of asset growth
Approved (ATP) renewals funding from 2018/2019 forward does not meet recommended (AMP) renewals needs
Reprioritising work from lower to higher risk impact assets eg. defer renewals of lower volume local roads in order to prioritise arterials and collectors, reduce maintenance standards for some assets
Analysis of the consequences resulting from the level of funding proposed in the LTP, and the impact of the shortfall relative to the needs identified in the AMP
Work closely with Auckland Council and NZTA to ensure that AT’s funding needs are clear, and that tradeoffs between cost, risk and level of service are transparent
Levels of service for some assets cannot be sustained at current levels of funding
Re-assess investment needs and levels of service. Consult on any proposed significant changes
Revisit the agreed levels of service and funding envelope consequences in the 2018-2021 funding round
Close monitoring of asset condition, network risk and customer satisfaction trends
Forecasting of the links between funding and trends in customer complaints and asset integrity