Auckland Transport active modes research
44
MEASURING AND GROWING ACTIVE MODES OF TRANSPORT IN AUCKLAND PREPARED FOR: AUCKLAND TRANSPORT JULY 2016
-
Upload
auckland-transport -
Category
Government & Nonprofit
-
view
191 -
download
0
Transcript of Auckland Transport active modes research
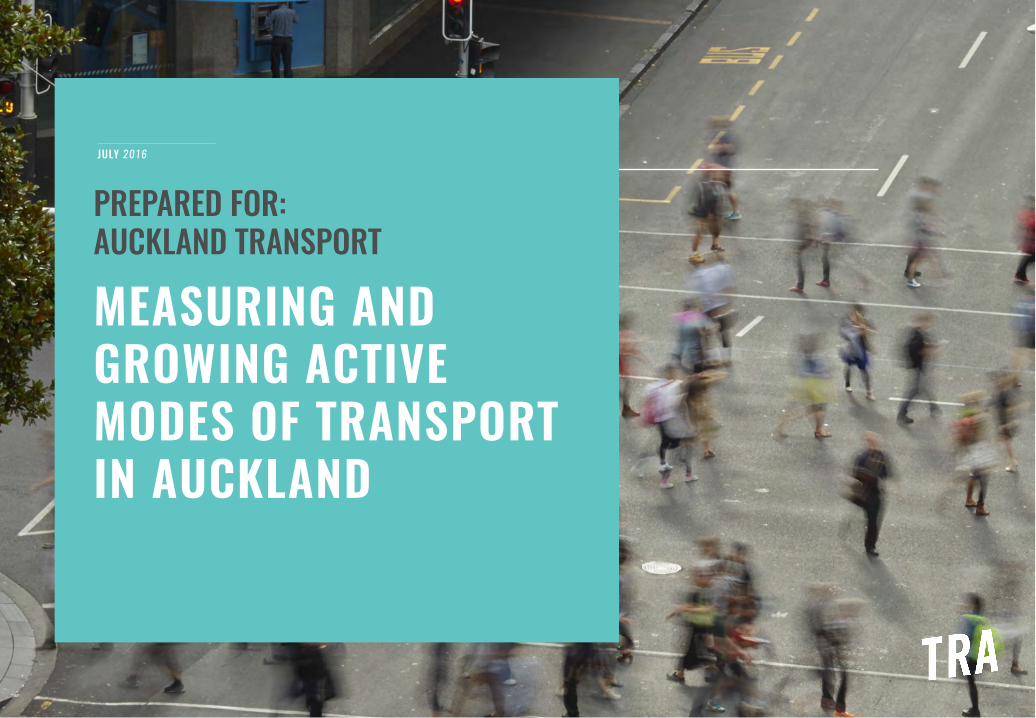
MEASURING AND GROWING ACTIVE MODES OF TRANSPORT IN AUCKLAND
PREPARED FOR: AUCKLAND TRANSPORT
JULY 2016

2W W W.TRA .CO.NZ CONFIDENT IAL © TRA 2016
MANAGE THE ROADING NETWORK BY MAKING THE RIGHT INVESTMENT AND PROMOTE DECISIONS TO ENCOURAGE BEHAVIOUR CHANGE OF AUCKLANDERS TO ACTIVE MODES OF TRANSPORT.
The overall business objective

3W W W.TRA .CO.NZ CONFIDENT IAL © TRA 2016
The annual Active Modes Survey plays an important role in measuring behaviour change
In order to drive a change in behaviour, Auckland Transport is developing a deep understanding of the decision-making process around walking and cycling.
The annual Active Modes Survey provides Auckland Transport with the opportunity to measure performance in these key travel modes and track progress over time.
It also provides insight into where investment and promotions should be targeted to provide the strongest return.
4W W W.TRA .CO.NZ CONFIDENT IAL © TRA 2016
AGENDA 01 Measuring progress for Active Modes
02 A deeper understanding of how Aucklanders travel
03 Opportunities to drive behaviour change
04 Bringing it all together

.01Measuring progress for Active Modes
6W W W.TRA .CO.NZ CONFIDENT IAL © TRA 2016
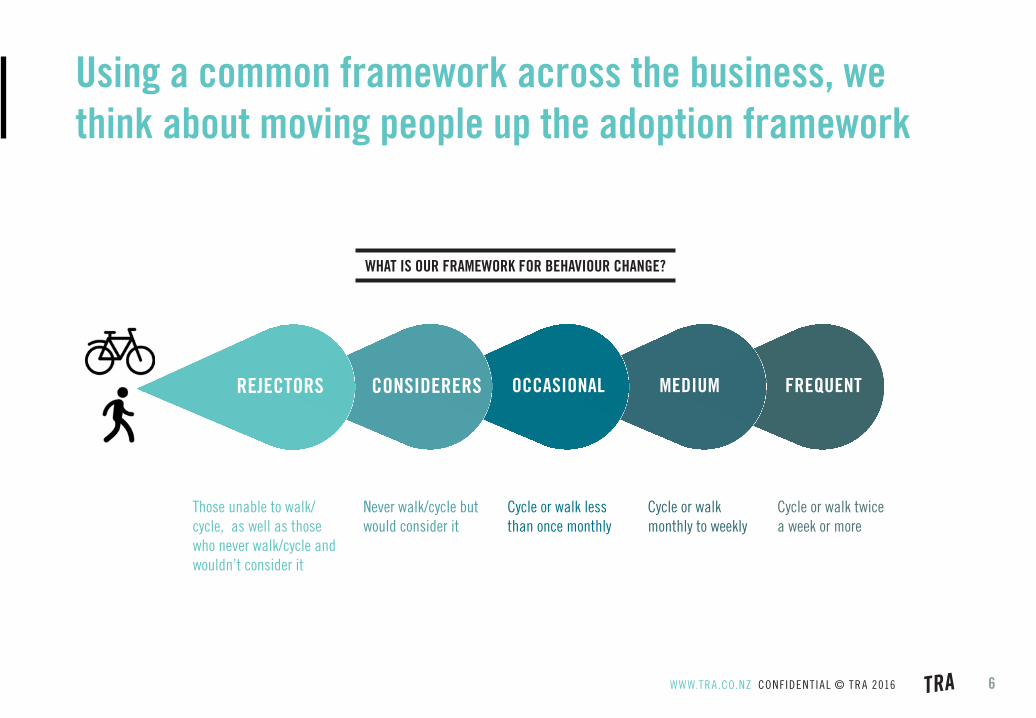
Using a common framework across the business, we think about moving people up the adoption framework
WHAT IS OUR FRAMEWORK FOR BEHAVIOUR CHANGE?
Those unable to walk/cycle, as well as those who never walk/cycle and wouldn’t consider it
Never walk/cycle but would consider it
Cycle or walk less than once monthly
Cycle or walk monthly to weekly
Cycle or walk twice a week or more
REJECTORS CONSIDERERS OCCASIONAL MEDIUM FREQUENT

7W W W.TRA .CO.NZ CONFIDENT IAL © TRA 2016
Aucklanders are bearing witness to a number of significant changes
BALANCING
TIME POORINCREASING COST OF LIVING
GROWING POPULATION (DRIVEN BY MIGRATION AND
URBANISATION)
WRESTLING FOR CONTROL
CHANGING HEALTH AND EXPECTATIONS
8W W W.TRA .CO.NZ CONFIDENT IAL © TRA 2016
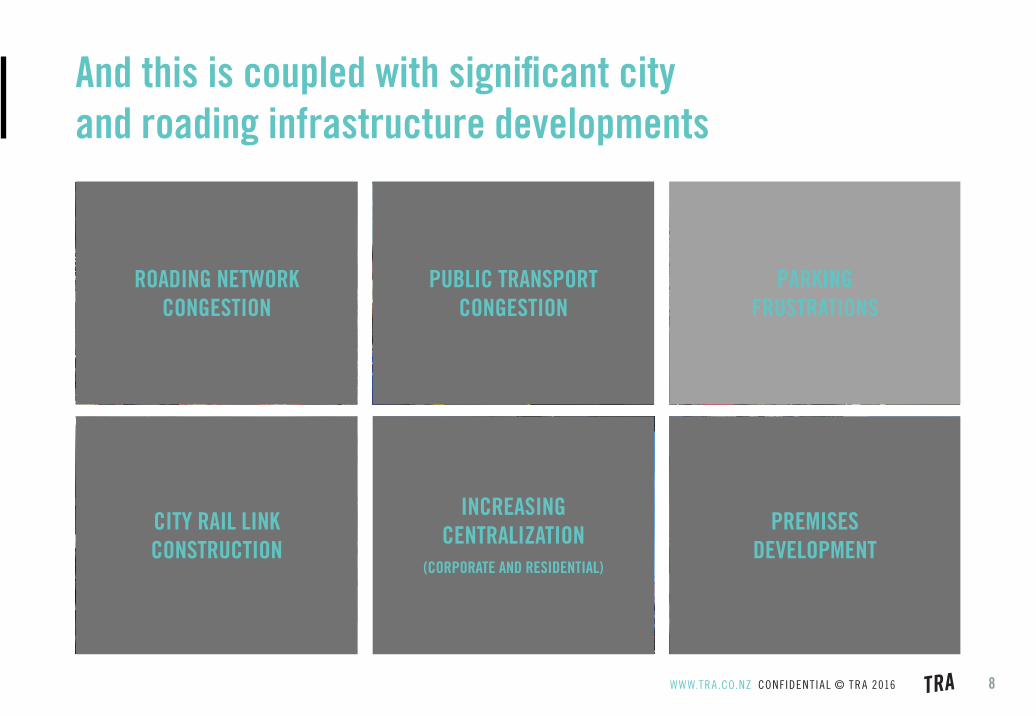
And this is coupled with significant city and roading infrastructure developments
PREMISES DEVELOPMENT
PARKING FRUSTRATIONS
PUBLIC TRANSPORT CONGESTION
INCREASING CENTRALIZATION
(CORPORATE AND RESIDENTIAL)
CITY RAIL LINK CONSTRUCTION
ROADING NETWORK CONGESTION

9W W W.TRA .CO.NZ CONFIDENT IAL © TRA 2016
IMPLICATION
IMPLICATION
THESE CHANGES REPRESENT A STRONG OPPORTUNITY TO GROW ACTIVE MODES OF TRANSPORT

10W W W.TRA .CO.NZ CONFIDENT IAL © TRA 2016
A6. On average, how often do you do each of the following, for any reason? Total sample (n=1,178)
10
The proportion of Aucklanders cycling has increased again in 2016
Significant progress has been made in this active mode over the past two years.
6%
11% 13%
20%
27%
31%
2014 2015 2016
CYCLING BEHAVIOUR (% of Aucklanders)
% cycling once a week or more Total % cycling

11W W W.TRA .CO.NZ CONFIDENT IAL © TRA 2016A6. Rejectors (unable or never cycle and wouldn’t consider). Considerer (never cycle but would consider), Occasional (less than monthly), Medium (monthly to weekly), Frequent (twice a week or more)
31% of Aucklanders in 2016 vs 27% in 2015
MORE AUCKLANDERS ARE CYCLING (up 4 points from 2015)
» With more Aucklanders now cycling, there is also an opportunity to get them doing more of the cycling journeys we want them to.
REJECTORS CONSIDERERS OCCASIONAL MEDIUM FREQUENT
46%
47%2015
2016 12%
8%
22%
26%
13%
12%
6%
6%
We are seeing some migration through the adoption framework

12W W W.TRA .CO.NZ CONFIDENT IAL © TRA 2016
A greater proportion of cyclists are now travelling by bike for key journeys
75% Within the repertoire of cycling occasions, most Aucklanders are cycling for recreation or fitness.
In 2016 there is an increase in those doing key point-to-point journeys (to/from work, study, public transport or the shops) by bike.
A7. What types of trips do you bike for? Cyclists (n=424)* Alignment of codeframe from 2015 to 2016 includes ‘Exercise + Fitness’ as a seperate code
To get to from/shops
To go to/from work
To get to/from school, college, university
To get to/from public transport
% OF CYCLISTS DOING THESE OCCASIONS
21%
23%
12%
4%
7%
7%
5%
13%
+2pts
+1pts
+3pts
+2pts
IN 2015
FROM
THIS YEAR31% 35%

13W W W.TRA .CO.NZ CONFIDENT IAL © TRA 2016Q24. Overall, how do you view the current state of cycling in Auckland? Able bodied (n=1,046)A5a. In general, how confident are you/would you be in riding a bicycle in the Auckland area? Able bodied (n=1,046)A26. How strongly do you agree, or disagree, with each of the following statements? Able bodied (n=1,046)
OVERALL STATE OF CYCLING
CONFIDENCE IN CYCLING
AUCKLAND HAS A WELL- CONNECTED CYCLE NETWORK
CYCLE LANES IN AUCKLAND ARE OF GOOD QUALITY
Don’t know 0-4 (Disagree) 5 (Neutral) 6-10 (Agree)
16% 16%
11% 11%
34% 34%
39% 16%Agree Agree
17% 4% 4% 5%
2016 2016 2016 2016
MEAN SCORE: 5.0 MEAN SCORE: 3.6
11%
14%16%
37%
16%
27%
16%
3%
58%
28%43%
31%Agree
AgreeAgree
Beyond an increase in behaviour, we are seeing positive changes in perceptions year on year

14W W W.TRA .CO.NZ CONFIDENT IAL © TRA 2016
Perceptions of cycling in the city are changing for the better
The work that has been conducted to date around improving cycling infrastructure, and then driving strong awareness of it, is playing a key role in improving perceptions.
As a result, we are seeing greater confidence in cycling and key changes in cycling behaviour; more people are cycling in general, people are cycling more frequently, and more people are doing the key point-to-point journeys we want them to.
Whilst there is still significant work to do, we are moving perceptions and behaviour in the right direction. There is a strong opportunity to continue to build on this momentum at a time when Aucklanders are increasingly looking for alternative transport solutions.
IMPLICATION

15W W W.TRA .CO.NZ CONFIDENT IAL © TRA 2016
A6. Rejectors (unable or never walk and wouldn’t consider). Considerer (never walk but would consider), Occasional (less than monthly), Medium (monthly to weekly), Frequent (twice a week or more)
REJECTORS CONSIDERERS OCCASIONAL MEDIUM FREQUENT
GETTING PEOPLE OUT OF THEIR CARS AND REPLACING THESE TRIPS WITH WALKINGTHE CHALLENGE FOR WALKING IS
Walking has a different challenge – it’s less about penetration
89% OF AUCKLANDERS vs 88% IN 2015
10% 4%1% 17% 68%
Nearly everyone is walking to some extent.

16W W W.TRA .CO.NZ CONFIDENT IAL © TRA 2016
We are also seeing more people engaged in walking for point-to-point journeys this year
»The opportunity is to continue to grow the number of people walking for the key point-to-point journeys – and also to increase how frequently they do them.
IN 2015 IN 201658% 68%
63%
45%
24%
16%
16%
13%
7%
10%
60%
51%
32%
21%
20%
16%
12%
12%
For recreation or fitness
To get to/from shops
To get to/from public transport
To go to/from visiting friends or family
To go to/from work
As part of my job
To get to/from school, college, university
To walk children to/from school
% of walkers doing these occasions
2015 2016
+6pts
+8pts
+4pts
+5pts
B3. What types of trips do you walk for? By walks, we mean walks of ten minutes or longer at a time. Walkers (n=1,052)

17W W W.TRA .CO.NZ CONFIDENT IAL © TRA 2016
* Population extrapolation based on 2013 Census figures for Auckland’s 15+ population.
28,000 108,000
45,600 11,400NEW CYCLISTS DOING POINT-TO-POINT TRIPS
WALKERS NOW DOING POINT-TO-POINT TRIPS
NEW CYCLISTS OVERALL
NEW WALKERS OVERALL
There has been a significant increase in the number of cyclists.
The proportion of people walking at all is steady year on year.
Auckland has seen incremental growth in active modes of transport year on year
IMPLICATION
.02A deeper understanding of how Aucklanders travel

19W W W.TRA .CO.NZ CONFIDENT IAL © TRA 2016
Gaining a deeper understanding of Aucklanders’ travel behaviour
This year the survey looks to expand on current knowledge and delve deeper into Aucklanders’ travel behaviour.
SPECIFICALLY:
What types of journeys have
Aucklanders made in the last week?
How many times did they make those trips in that week?
And what different travel modes did they use for those
trips?

20W W W.TRA .CO.NZ CONFIDENT IAL © TRA 2016
Q2. Thinking about the past week, how many times did you use each mode of transport when travelling for these occasions? Based on average trips made in past week. Total sample (n=1,178)
Volume of Trips (all Aucklanders)Car Walking Bus Train Cycling
Motor bike
Ferry TOTAL
To get to/from work 22%
To get to/from shops 20%
To get somewhere else 16%
To get to/from visiting friends or family 10%
To get to/from public transport 11%
As part of my job 8%
To get to/from school, college, university 7%
To take children to/from school or day-care 7%
TOTAL 58% 28% 7% 3% 2% 2% 1% 100%
Travel patterns are based on a multitude of journey types and travel modes
AUCKLANDERS ARE MAKING 24.4 TRIPS
PER WEEK ON AVERAGE

21W W W.TRA .CO.NZ CONFIDENT IAL © TRA 2016WO
RK
SHOPPING
Q2. Thinking about the past week, how many times did you use each mode of transport when travelling for these occasions? Based on average trips made in past week. Total sample (n=1,178)
»We will make the biggest difference targeting the journey types that are done most often.
»The key challenge is to reduce pressure on the roading network. This will come from targeting car journeys.
Top travel modes by trip volume Top journey types by trip volume
A valuable perspective of travel behaviour is gained by looking at trip volume
58%28%
22% 20%2%

22W W W.TRA .CO.NZ CONFIDENT IAL © TRA 2016
This provides direction on where to focus by sizing the overall opportunity
ACROSS TRAVEL OCCASIONS, THERE IS THE OPPORTUNITY TO
CONVERT CAR TRIPS TO WALKING AND/OR CYCLING.
TWO KEY OPPORTUNITIES ARE IDENTIFIED FOR AUCKLAND TRANSPORT.
With the ultimate goal of reducing pressure on
the roading network, incremental gains can
be made across journey types.
Gaining an understanding of current behaviour in terms of the number of trips travelled helps to identify where
the greatest opportunity for conversion may lie.

23W W W.TRA .CO.NZ CONFIDENT IAL © TRA 2016
OPPORTUNITY 1 Travelling to/from WORK
of Aucklanders travelled this journey
On average 5.3 TRIPS
trips travelled per week
For those who travelled this journey but didn’t cycle,
29% say they could cycle but don’t.
For those who travelled this journey but didn’t cycle,
29% say they could cycle but don’t.29+71+S 10+90+S
Cycling represents the greatest potential opportunity for growth in this space.
59+A59% 65+A65% 15+A15% 2+A2%
29% Say that it would be reasonable to cycle,
but don’t
Just 10% say that it would be reasonable to walk,
but don’t
% AUCKLANDERS: % TRIPS:
by CAR
by WALKING
by CYCLING

24W W W.TRA .CO.NZ CONFIDENT IAL © TRA 2016
OPPORTUNITY 2 Travelling to/from SHOPS
of Aucklanders travelled this journey
On average 4.9 TRIPS
trips travelled per week
For those who travelled this journey but didn’t cycle,
29% say they could cycle but don’t.
For those who travelled this journey but didn’t cycle,
29% say they could cycle but don’t. 24+76+S38+62S
This particular journey represents the strongest potential opportunity for walking.
The potential opportunity for cycling this journey appears strong. However, we know the barriers to cycling for this
journey are also very strong.
81+A81%
24% say that it would be reasonable to walk,
but don’t
38%say that it would be reasonable to cycle,
but don’t
% AUCKLANDERS: % TRIPS:
65+A65% 26+A26% 2+A2%by CAR
by WALKING
by CYCLING

25W W W.TRA .CO.NZ CONFIDENT IAL © TRA 2016
To drive greater adoption of active modes, we now have a place to focus
WALKING IS ABOUT THE
SHOPPING OCCASION
CYCLING IS ABOUT THE
WORKING OCCASION
IMPLICATION
Opportunities to drive behaviour change
.03

27W W W.TRA .CO.NZ CONFIDENT IAL © TRA 2016
* Population extrapolation based on 2013 Census figures for Auckland’s 15+ population.
Go to/from work but don’t cycle
Go to/from work Are not able to cycle to/from work
Impaired /disabled Don’t own, or have access to, a bike
Currently cycle Wouldn’t consider cycling
CYCLING OPPORTUNITY
421,477
45,664
115,342
34,248
27,83728,973
593,629
673,542
We have the potential to get an additional 28,973 people cycling to/from
work each week.
of Aucklanders currently go to/from work but don’t cycle in any given week
What could the opportunity for growth in CYCLING TO/FROM WORK look like?
Aucklanders travel to/from work59+A59%
52+A52%

28W W W.TRA .CO.NZ CONFIDENT IAL © TRA 2016
AT1. Pick the facial expression that best depicts how you feel about each of the different modes of transport – Cycling (n=1,178)
There is overwhelming evidence that emotion is the key driver of human behaviour
REJECTOR
8%
16%
CONSIDERER
29%
29%
OCCASIONAL
35%
32%
MEDIUM
54%
23%
FREQUENT
JOY
JOY74%
7%
Contempt
Contempt

29W W W.TRA .CO.NZ CONFIDENT IAL © TRA 2016
* Population extrapolation based on 2013 Census figures for Auckland’s 15+ population.
Go to/from shops but don’t walk
Are not able to walk to/from shops
Wouldn’t consider walking
WALKING OPPORTUNITY
282,545
37,673 56,509
376,277
We have the potential to get an additional 56,509 people walking to/from
shops each week.
of Aucklanders currently go to/from the shops but don’t walk in any given week
Go to/from shops Impaired /disabled Currently walk
79,912
376,727
924,693
Aucklanders travel to/from the shops81+A81%
33+A33%
What could the opportunity for growth in WALKING TO/FROM SHOPS look like?

Bringing it all together
.04

31W W W.TRA .CO.NZ CONFIDENT IAL © TRA 2016
THERE HAS BEEN POSITIVE CHANGE
IN PERCEPTION AND BEHAVIOUR
THERE HAVE BEEN VERY POSITIVE MOVEMENTS IN PERCEPTIONS OF CYCLING AND WALKING IN AUCKLAND, SPECIFICALLY:
CYCLE WAYS & INFRASTRUCTURE
CONFIDENCE
ALL RESULTING IN A POSITIVE SHIFT IN POINT-TO-POINT JOURNEYS,
28,000108,000
NEW CYCLISTS DOING POINT-TO-POINT TRIPS
PEOPLE WALKING FOR THESE POINT-TO-POINT JOURNEYS
ADDING
AND

32W W W.TRA .CO.NZ CONFIDENT IAL © TRA 2016
THERE ARE TWO KEY FOCUS AREAS WHICH WILL DRIVE FURTHER
INCREMENTAL GAINS
NEW OPPORTUNITY: 56,509 people NEW OPPORTUNITY: 28,973 people
WALKING FOR THE
SHOPPING OCCASIONS
CYCLING TO
WORK

33W W W.TRA .CO.NZ CONFIDENT IAL © TRA 2016
THERE ARE TWO CORE JOBS FOR AUCKLAND TRANSPORT TO DO
Facilitate the removal of perceived
FUNCTIONAL BARRIERS to encourage trial
Promoting and reinforcing the EMOTIONAL REWARDS of cycling and walking to work to encourage repeat
behaviour
01 02

Thanks for reading

APPENDIX

36W W W.TRA .CO.NZ CONFIDENT IAL © TRA 2016Base: Total sample (n=1,178)
HOW OFTEN DO YOU CYCLE?
Never/Virtually never
Occasionally(less than monthly)
Medium (monthly to
weekly)
Frequently (two days per week or more)
WHI
CH D
ESCR
IBES
YOU
R PR
EFER
ENCE
?
Would like to cycle less/only
if I have to47%
Rejector
3% New and
Occasional at risk
3% Medium at risk
1% Regular at risk
Happy with my use of bicycle
3% New and
Occasional
5% Medium
3% Regular
Would like to cycle more
21% Considerer
5% New and
Occasional –Opportunity
5% Medium –
Opportunity
2% Regular –
Opportunity
AT Adoption Framework – CYCLING

37W W W.TRA .CO.NZ CONFIDENT IAL © TRA 2016Base: Total sample (n=1,178)
HOW OFTEN DO YOU WALK FOR 10 MINS OR MORE?
Never/Virtually never
Occasionally(less than monthly)
Medium (monthly to
weekly)
Frequently (two days per week or more)
WHI
CH D
ESCR
IBES
YOU
R PR
EFER
ENCE
?
Would like to travel this way less/only if I
have to 10% Rejector
4% New and
Occasional at risk
4% Medium at risk
7% Regular at risk
Happy with my use of this travel mode
4% New and
Occasional
6% Medium
33% Regular
Would like to travel this way
more
1% Considerer
6% New and
Occasional –Opportunity
7% Medium –
Opportunity
28% Regular –
Opportunity
AT Adoption Framework – WALKING

38W W W.TRA .CO.NZ CONFIDENT IAL © TRA 2016
Q24. Overall, how do you view the current state of cycling in Auckland? Able bodied (n=1,046)A5a. In general, how confident are you/would you be in riding a bicycle in the Auckland area? Able bodied (n=1,046)
CONFIDENCE IN CYCLING
OVERALL STATE OF CYCLING
58%
66%
11%
9%
28%
24%
2016
2015
Don't know 0-4 (Not confident) 5 (Neutral) 6-10 (Confident)
3.6
Mean Score
3.2
11%
11%
34%
49%
16%
18%
39%
22%
2016
2015
Don't know 0-4 (Negative) 5 (Neutral) 6-10 (Positive)
5.0
Mean Score
4.1
Key Measures – CYCLING

39W W W.TRA .CO.NZ CONFIDENT IAL © TRA 2016A26. How strongly do you agree, or disagree, with each of the following statements? Able bodied (n=1,046)
16%
26%
16%
20%
5%
5%
10%
14%
15%
37%
36%
27%
31%
65%
71%
53%
62%
20%
16%
10%
14%
11%
10%
8%
14%
11%
15%
31%
27%
43%
38%
19%
15%
23%
13%
51%
2016
2015
2016
2015
2016
2015
2016
2015
2016
Don't know 1-4 (Disagree) 5 (Neutral) 6-10 (Agree)
Auckland has a well connected cycle network
Cycle lanes in Auckland are of good quality
Cyclists are sufficiently separated from traffic
There are enough cycle lanes and cycle paths in Auckland
A lot is being done to improve cycling in Auckland
Attitudes to Cycling Infrastructure

40W W W.TRA .CO.NZ CONFIDENT IAL © TRA 2016
B14/B15 In general, how safe do you feel / would you feel walking during the daytime/night time? Able bodied (n=1,046)Q24. Overall, how do you view the current state of walking in Auckland? (n=1,117)
5% 15% 16% 64% 2016
Don't know 0-4 (Negative) 5 (Neutral) 6-10 (Positive)
SAFETY – DAY
OVERALL STATE OF WALKING
SAFETY – NIGHT
6.4
Mean Score
7%
5%
6%
6%
86%
88%
2016
2015
Don't know 0-4 (Not safe) 5 (Neutral) 6-10 (Safe)
8.0
Mean Score
7.8
55%
50%
10%
11%
32%
38%
2016
2015
Don't know 0-4 (Not safe) 5 (Neutral) 6-10 (Safe)
4.0
Mean Score
4.3
Key Measures – WALKING

41W W W.TRA .CO.NZ CONFIDENT IAL © TRA 2016
5%
10%
15%
12%
3%
36%
19%
4%
6%
7%
6%
4%
25%
47%
4%
18%
14%
8%
9%
21%
26%
1%
2%
3%
4%
4%
26%
60%
Anger
Fear
Disgust
Sadness
Surprise
Contempt
Joy
Walking
Cycling
Driving
Public transport
5%
10%
15%
12%
3%
36%
19%
4%
6%
7%
6%
4%
25%
47%
4%
18%
14%
8%
9%
21%
26%
1%
2%
3%
4%
4%
26%
60%
Anger
Fear
Disgust
Sadness
Surprise
Contempt
Joy
Walking
Cycling
Driving
Public transport
Emotional Response to Modes of Transport

42W W W.TRA .CO.NZ CONFIDENT IAL © TRA 2016
Base: Total Sample (n=1178)Table displays % endorsement for each attribute, for each travel mode.
IMPLICIT ASSOCIATIONS% Endorsement for Yes / No across attributes
YES NO YES NO YES NO YES NO
Social 48% 38% 67% 20% 51% 35% 56% 30%
Fast 74% 15% 42% 44% 47% 39% 40% 46%
Convenient 76% 12% 65% 23% 52% 33% 50% 34%
Enjoyable 67% 21% 78% 13% 59% 27% 41% 46%
Difficult 32% 49% 23% 60% 41% 41% 39% 41%
Healthy 37% 47% 82% 9% 80% 12% 42% 41%
Expensive 60% 25% 17% 69% 24% 59% 51% 32%
Safe 67% 21% 67% 20% 40% 48% 61% 24%
Socially responsible 42% 38% 73% 12% 59% 22% 61% 20%
Brave 44% 40% 47% 37% 58% 27% 35% 49%
Inconsiderate 27% 51% 16% 65% 27% 51% 25% 51%
Obstructive 32% 50% 19% 65% 31% 51% 30% 50%
DRIVING WALKING CYCLING PUBLIC TRANSPORT
Associations with Travel Modes
DRIVING WALKING CYCLING PUBLIC TRANSPORT

43W W W.TRA .CO.NZ CONFIDENT IAL © TRA 2016
B21 Thinking about everything you have seen, read or heard about Auckland Transport, what are your overall perceptions of Auckland Transport? Total sample (n=1,178)
4% 7%
21%
26%
33%
9%
4%
8%
19%
29%
33%
8%
I don't know I feel very negative towards Auckland
Transport
I feel somewhat negative towards Auckland
Transport
I have no feelings either way
I feel somewhat positive towards Auckland
Transport
I feel very positive towards Auckland
Transport
2015 2016
Perceptions of Auckland Transport

44W W W.TRA .CO.NZ CONFIDENT IAL © TRA 2016
Q16 Have you seen, read or heard anything about Auckland Transport and the activity they are doing around walking and cycling in the city? (n=1,178)Q17 And what have you seen, read or heard about Auckland Transport? (n=401)
10%
17%
20%
21%
25%
65%
73%
Bike parking at major events (e.g. Pasifika)
Auckland Transport cycle training courses
Open Streets Auckland on K'Rd
The use of e-bikes around Auckland
Cycling events for families (e.g. bubs on bikes, family bike days)
New cycle routes
New cycle lanes
What activities are they aware of?
34% of Aucklanders have seen, read or heard about Auckland Transport and the activity they are doing around walking and cycling in the city.
Awareness of Auckland Transport Activity