
Software Asset Management: Software Asset Management: Playing ...

April 2016
CEE – Europe’s roaring workshop

Karoll Financial Group Mission
“Our goal is to create top-notch vehicles, tools and processes in helping international investors harness the exciting potential of Emerging Europe.”
Stanimir Karolev
Founder and Chairman,
Karoll Financial Group
2

Karoll Financial Group Product Offering
Bulgarian Capital Market
International Capital Markets
Brokerage
Wealth Management
• Advance Invest
• Advance Eastern Europe
• Advance Emerging Europe Opportunities
• Advance Global Trends
• Advance Conservative Fund
• Discretionary accounts
Institutional Mandates
• Eastern Europe
• Central Europe
• Balkan
• Thematic equity
• Mixed
Asset Management
IPO & SPO Activities
M&A Restructuring
Investment Banking
Real Estate
ADVANCE TerraFund
REIT
Private Equity
ADVANCE Equity Holding
3

Karoll Financial Group
Karoll Brokerage
Karoll Capital Management
Advance Terrafund
Advance Equity
Karoll Investment
Leader in number of transactions on BSE for 13 consecutive years 30% market share of of all transactions
Pioneered the first mutual fund in Bulgaria Strategic partner of Schroders for the local markets
Largest farm land REIT in the country IFC (World Bank) - key stakeholder
First Private Equity fund in the country
Executed the first IPO in Bulgaria (2004); Successfully raised capital through the stock exchange (BGN 160 mln)
23 EXCITING YEARS OF SUCCESS | TEAM OF 200 EXPERTS

Karoll Capital Management Overview
Unique heritage in CEE
Founded in Sofia in 2003, our roots are truly in Emerging Europe
Independent and skilled Eastern Europe-based team
Part of Karoll Financial Group with support of 200 professionals + 70 local offices
Steady business growth on solid reputation
AUM over EUR 200 mln.
Assets split in various mutual funds, real estate investment trusts, wealth mgt & mandates
Manages 5 UCITS funds and multiple private accounts
Crisp focus on Emerging Europe
Helping clients harness the potential of emerging Europe
Deep understanding of the cultures and dynamics of our markets
On-the-ground research coverage of strategically important holdings
Partnership with top international names
Local representative of Schroder Investment Management, UK
Partners with IFC (World Bank), European institutions and global players
International road-shows and conferences
5

Our Unique Value Proposition
“Emerging Europe offers a unique asset class with strong upside potential and low correlation to the developed world. It is a truly overlooked opportunity.
We pick out high-growth sectors in a high-growth region.
We generate alpha in the region while helping global investors overcome local barriers.”
Daniel Ganev
Managing Director,
Karoll Capital Management
Independent
Flexible
Entrepreneurial
Deep understanding
of local markets
6

Karoll Capital’s Investment Committee
Seasoned investment team with unique combination of skills >>>
Daniel Ganev, Managing Director
15+ yrs of experience in in fund management, financial products development and marketing, business development in emerging markets
Nadia Nedelcheva, CFA, Head of Portfolio Management
15+ yrs of experience in portfolio management, research, valuations and modeling in Central & Eastern Europe
Alexander Nikolov, Portfolio Manager
18+ yrs of experience in portfolio management, financial analysis, technical analysis on the US, European and CEE markets
Katerina Atanassova, Portfolio Manager
15+ yrs of experience in portfolio management, technical analysis and trading on the global developed and emerging markets
Georgi Georgiev, Portfolio Manager
13+ yrs of experience in research, fundamental analysis, valuations, portfolio management and trading in the global emerging markets and USA
Dimitrios Latitaris, Investment Analyst
4+ yrs of experience in research, investment banking, fundamental analysis, valuations in Central & Eastern Europe
Georgi Raykov, Investment Analyst
3+ yrs of experience in research, fundamental analysis, valuations in Central & Eastern Europe

Investment Process – the 4 S’s
Screen
The process starts with our on-the-ground analyst team screening the landscape in search of investment opportunities in Emerging Europe. We apply filters in terms of liquidity (time needed to enter/exit investment), market cap, transparency, corporate governance, etc. As a result, our investment universe comprises around 500 stocks out of some 3 000 listed companies in CEE. Our major advantage is the freedom to deviate from local indices based on our views. This gives us flexibility in our investment choice, regularly leading to superior results and outperformance of benchmarks and peers. Using proprietary analytical tools and exchange with local contacts, we seek to pinpoint stocks that are trading at a discount or that are in a position to undergo some fundamental change. Examples of such events are turnaround situations, management changes, financial results surprises, etc.
Study
The generation of investment ideas leads to the next step -- a thorough in-depth analysis conducted in house. Because of market inefficiencies we believe Emerging Europe is abundant with mispriced assets. In estimating the true value of a stock we study the firm’s business model and its ability to realize returns greater than the cost of capital, the shareholder structure and management capabilities, sector dynamics and overall market position. We strive to find companies with improving profitability margins and low debt levels that are traded at a discount to peers. On-site visits and regular contact with company representatives are a key part of research as well. In addition to employing valuation methods, we also consider investor psychology, liquidity and order flows. The outcome of the investment assessment is the analyst proposal to the investment committee, which summarizes the case, the rationale behind it, potential upside and associated triggers, as well as the risks involved.
Shape
Karoll Capital’s 4-member investment committee, supported by the analyst team, examines the selected investment proposals in view of portfolio construction. At the asset allocation level (asset class and geographic splits), we normally apply the Black Litterman model, which takes into account the market size, volatility, correlations and our convictions. The committee then debates whether a stock deserves to be included in the portfolio, when and what weight to be assigned to it. In the case of Karoll’s mutual funds the Portfolio Manager has the final say with regard to stock selection, while in the case of managed accounts / mandates the decision is collective. Likewise, the committee / PM decides on position weight changes and/or liquidations. At each stage, compliance with regulatory guidelines and client-tailored requirements are factored in.
Scrutinize
Finally, the investment portfolio is monitored with all different positions being systematically scrutinized. The investment team applies in-house processes and practices enabling it to adequately react to the different triggers causing distortions to the investment case. As part of the process our analysts and portfolio managers follow up with the companies’ management, screen the sector competitors and general business/political environment. Conducting attribution and risk management analysis on the portfolio holdings is essential. Any resulting concerns related to the investment case prompt reviews of the rationale behind the decision to add / hold/ reduce the stock as a portfolio component.
8

Our Investment Universe
3,000+ listed companies in CEE
Investment Universe – 1,500
750
500
250
Survivors
150
Selection Filters:
Sector Outlook & Company Competitiveness
Mkt cap & Liquidity
Corp Governance & Transparency
Financial Strength
In-house Valuation

Investment Capabilities & Results
4 main strategies offered to institutional investors:
Eastern Europe, Central Europe, Balkan, and Thematic, as well as mixed strategies
based on specific mandate
Karoll Capital’s Investment Committee aims to construct for our institutional clients
Managed Accounts / Mandates portfolios designed to take advantage of the L.T. trends
as well as hot opportunities in the market
We have identified a compelling theme as an excellent opportunity for our institutional clients:
“CEE – Europe’s roaring workshop”, comprising companies from the industrial, outsourcing
and ICT sectors with excellent upside potential
Model portfolios vs. benchmark, as of 15.04.2016 YTD 1 year 3 years,
annualized Volatility Beta Alpha
MSCI EFM Europe +CIS 9.44% -17.50% -9.32% 16.69%
MSCI EFM Europe +CIS ex RU 6.68% -17.65% -10.16% 14.40%
Balkan strategy -7.53% -13.96% 0.65% 10.77% 0.38 10.81%
Eastern Europe strategy 1.19% -9.95% 0.28% 8.90% 0.29 9.60%
Central Europe strategy 0.40% -8.52% -5.25% 10.42% 0.29 4.91%
Thematic strategy 6.20% 4.30% 12.80% 15.70% 0.25 22.12%

Emerging Europe thematic model portfolio “CEE – Europe’s roaring workshop”, comprising companies from the industrial, outsourcing
and ICT sectors with excellent upside potential
Ukraine
2%
Bulgaria 3%
Czech Republic
3% Hungary 4%
Romania 8%
Russia 19%
Turkey 27%
Poland 34%
Geographic breakdown Sector breakdown
Top 5 positions % of portfolio Country Sector
Tofas Turk Otomobil Fabrikasi AS 5.81% Turkey Automobiles & Multi Utility Vehicles
Arcelik AS 5.66% Turkey Household appliances
GMK Noril'skiy nikel' PAO 5.48% Russia Basic materials
Uniwheels AG 5.35% Poland Automotive supplies
Asseco Poland SA 5.10% Poland IT services and consulting
Model portfolio vs. benchmark, as of 15.04.2016 YTD 1 year 3 years,
annualized Volatility Beta Alpha
MSCI EFM Europe +CIS 9.44% -17.50% -9.32% 16.69%
Thematic strategy 6.20% 4.30% 12.80% 15.70% 0.25 22.12%
Agriculture 2%
Pharmaceutical 8%
Wood products/Furnit
ure 9%
Household appliances
11%
Machinery 11%
Chemical 12% IT services and
consulting 14%
Basic materials 16%
Automotive 17%
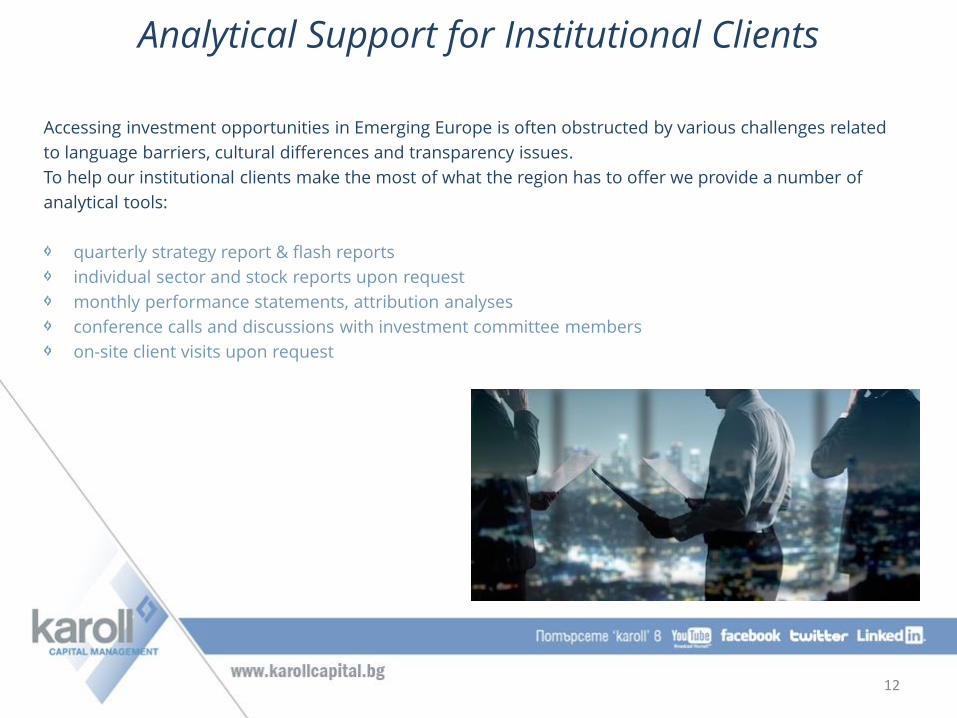
Accessing investment opportunities in Emerging Europe is often obstructed by various challenges related
to language barriers, cultural differences and transparency issues.
To help our institutional clients make the most of what the region has to offer we provide a number of
analytical tools:
quarterly strategy report & flash reports
individual sector and stock reports upon request
monthly performance statements, attribution analyses
conference calls and discussions with investment committee members
on-site client visits upon request
Analytical Support for Institutional Clients
12
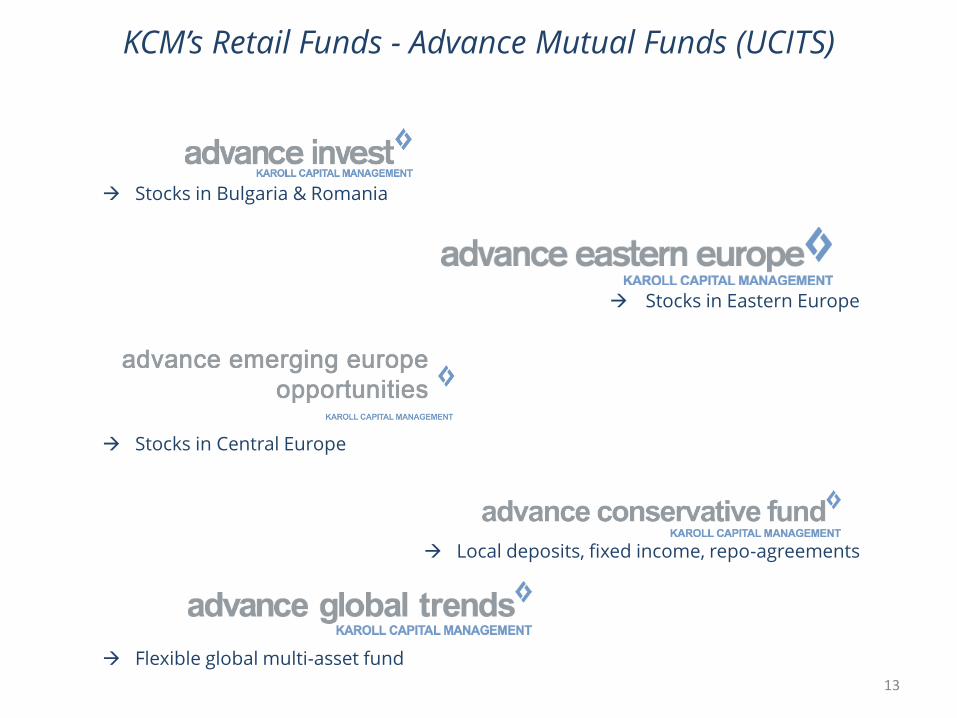
KCM’s Retail Funds - Advance Mutual Funds (UCITS)
Stocks in Bulgaria & Romania
Stocks in Eastern Europe
Stocks in Central Europe
Local deposits, fixed income, repo-agreements
Flexible global multi-asset fund
13

Emerging Europe – the Overlooked Opportunity
14
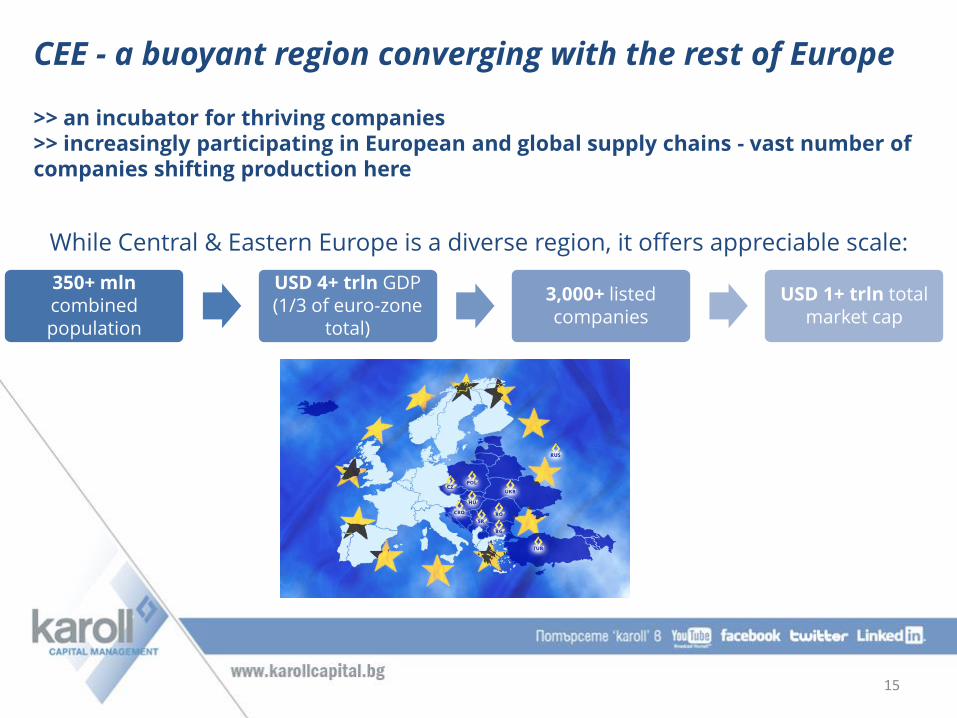
CEE - a buoyant region converging with the rest of Europe >> an incubator for thriving companies >> increasingly participating in European and global supply chains - vast number of companies shifting production here
While Central & Eastern Europe is a diverse region, it offers appreciable scale:
350+ mln combined population
USD 4+ trln GDP (1/3 of euro-zone
total)
3,000+ listed companies
USD 1+ trln total market cap
15

CEE now a major production & services hub for Western Europe
CEE countries have become major automotive producers 26% of motor vehicles in Europe are produced here Local suppliers steadily moving up the value chain CEE is Europe’s Silicon Valley IT sector rapidly increasing its share of GDP with fast growing number of employees Booming outsourcing sector CEE countries in top 20 ranking for Business Process Outsourcing
16

CEE growing much faster than developed Europe
GDP growth (%)
-6.0%
-4.0%
-2.0%
0.0%
2.0%
4.0%
6.0%
8.0%2
00
5
20
06
20
07
20
08
20
09
20
10
20
11
20
12
20
13
20
14
20
15
e
20
16
f
20
17
f
Euro area
Emerging and
developing
Europe
Source: IMF April 2016 outlook
Emerging Europe growing at a much faster pace vs. developed Europe: +3.5% on average b/n 2005 and 2015 vs. +0.8% for euro-area Trend expected to persist in the following years
GDP growth (%)
17

Low levels of GDP p.c. suggest solid catch-up potential
0 5 000 10 000 15 000 20 000 25 000 30 000 35 000
Euro area
Czech Republic
Estonia
Lithuania
Hungary
Poland
Latvia
Croatia
Russia
Turkey
Romania
Bulgaria
Serbia
Ukraine
GDP per capita (EUR)
Source: Eurostat
Rising but still very low levels of GDP per capita –b/n and 8 and 53% of euro-zone average
18

Compelling opportunities
Strategic location of the region ideally situated for building trade links between Western Europe, Middle East and Asia. Infrastructure has significantly improved in the past years with major investments planned in the mid term -> the region now deeply integrated with pan-European transport corridors
Most countries are current or future members of EU, OECD and NATO resulting in major changes in their economies and business environment. Some have already adopted the Euro. Legal, regulatory and business conditions have marked solid improvement; regulatory framework synchronized following EU accession.
CEE boasts well-educated and relatively inexpensive workforce labor force with tertiary education has been steadily increasing. Wages have been on the rise, but still far below EU average.
Favorable tax regimes significantly lower tax rates (e.g. 10% corporate income tax in Bulgaria)
19

Stable economies with low level of government debt
94%
92%
85%
76%
76%
50%
43%
41%
41%
40%
33%
27%
18%
10%
0% 10% 20% 30% 40% 50% 60% 70% 80% 90% 100%
Ukraine
Euro zone average
Croatia
Serbia
Hungary
Poland
Czech Republic
Lithuania
Latvia
Romania
Turkey
Bulgaria
Russia
Estonia
Government debt/GDP, 2014
Source: Eurostat, IMF
Government debt in CEE at comparatively low levels: below 50% of GDP for the region vs. 90 % for euro-zone
20
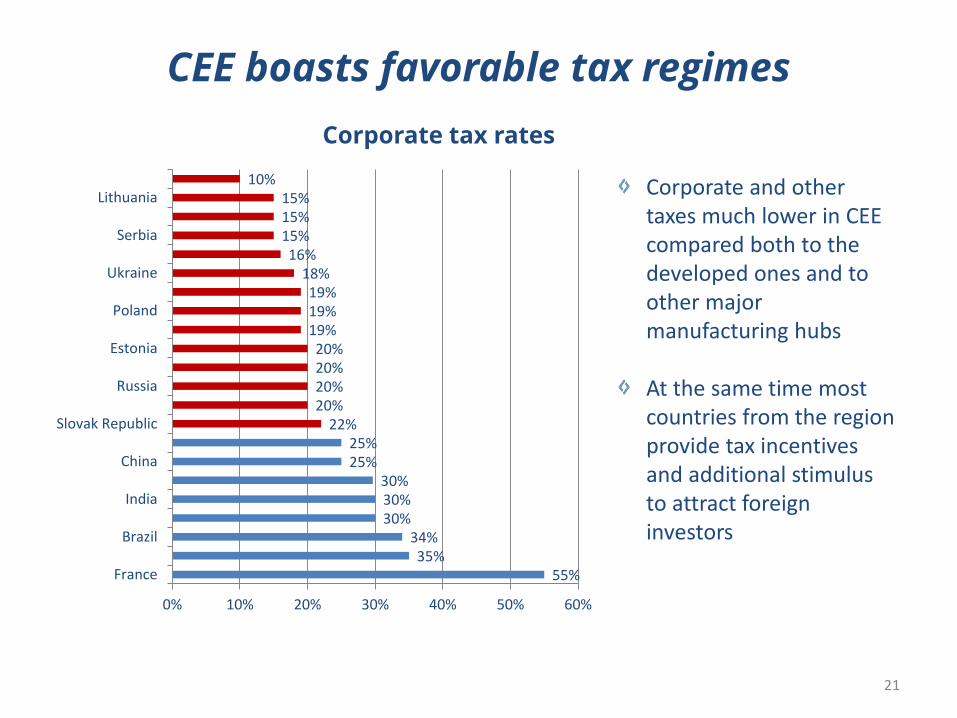
CEE boasts favorable tax regimes
Corporate tax rates
55% 35%
34% 30% 30% 30%
25% 25%
22% 20% 20% 20% 20%
19% 19% 19%
18% 16%
15% 15% 15%
10%
0% 10% 20% 30% 40% 50% 60%
France
Brazil
India
China
Slovak Republic
Russia
Estonia
Poland
Ukraine
Serbia
Lithuania Corporate and other taxes much lower in CEE compared both to the developed ones and to other major manufacturing hubs At the same time most countries from the region provide tax incentives and additional stimulus to attract foreign investors
21
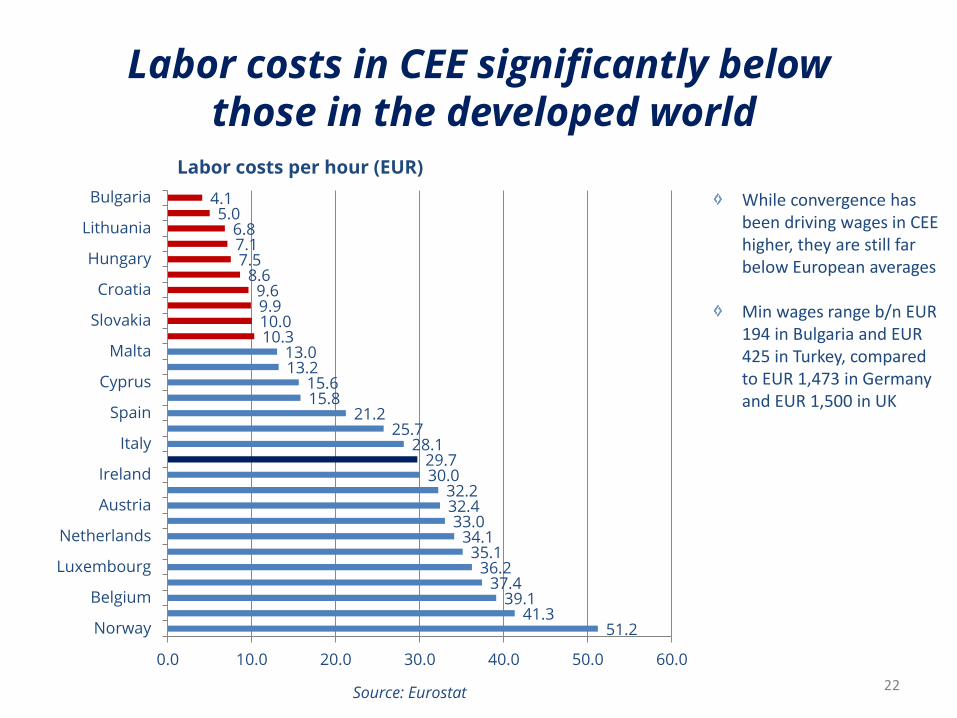
Labor costs in CEE significantly below those in the developed world
51.2 41.3
39.1 37.4
36.2 35.1
34.1 33.0
32.4 32.2
30.0 29.7
28.1 25.7
21.2 15.8 15.6
13.2 13.0
10.3 10.0 9.9 9.6
8.6 7.5 7.1 6.8
5.0 4.1
0.0 10.0 20.0 30.0 40.0 50.0 60.0
Norway
Belgium
Luxembourg
Netherlands
Austria
Ireland
Italy
Spain
Cyprus
Malta
Slovakia
Croatia
Hungary
Lithuania
Bulgaria
Labor costs per hour (EUR)
While convergence has been driving wages in CEE higher, they are still far below European averages Min wages range b/n EUR 194 in Bulgaria and EUR 425 in Turkey, compared to EUR 1,473 in Germany and EUR 1,500 in UK
Source: Eurostat 22

CEE boasts well educated and qualified workforce
17.1
24.1
35.3
15.1
9.2
15.1
11.7 9.5
7.5
26.5
33.1 32.7
27.8
24.3 23.9
20.9 19.7 18.6
14.7
0.0
5.0
10.0
15.0
20.0
25.0
30.0
35.0
40.0
2000
2015
People with tertiary education (% of population)
Share of people with tertiary education in CEE steadily on the rise
Source: Eurostat
23

Steady growth of employment in science and tech
37
42
35
31 28
33 32 31
28 29
21
45
50 47
41 40 38
36 36 35 33
26
0
10
20
30
40
50
60
2004
2014
Human resources in science and technology (% of population)
Science and technology play an increasing role in CEE economies with R&D expenditures rising fast The Czech Republic, Estonia, Hungary, Lithuania now spending over 1% of GDP on R&D while the figure still low compared to EU average of 2%, it is rapidly rising Source: Eurostat
24
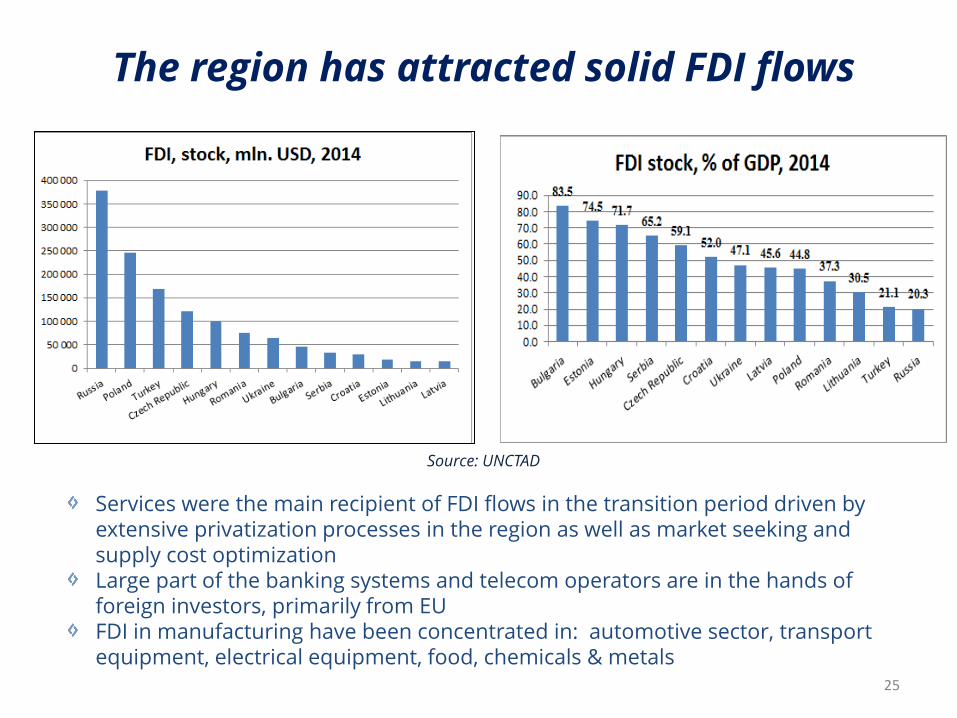
The region has attracted solid FDI flows
Services were the main recipient of FDI flows in the transition period driven by extensive privatization processes in the region as well as market seeking and supply cost optimization Large part of the banking systems and telecom operators are in the hands of foreign investors, primarily from EU FDI in manufacturing have been concentrated in: automotive sector, transport equipment, electrical equipment, food, chemicals & metals
Source: UNCTAD
25

EU accession provided abundant resources to CEE
Since the CEE countries became EU members, EU co-financing has become an essential factor for their development EU Structural and Cohesion Funds (SCF) accounted for 11.3 - 25% of annual GDP in 2007-2013 programming period, fostering regional cohesion
Large part of EU SCF financed major infrastructure projects, but also environment projects, renewable energy, SMEs, education & health, information society, increasing the adaptability of workers and enterprises, strengthening of institutional capacity, etc.
Poland Czech Republic Hungary Romania Slovakia Lithuania Bulgaria Latvia Slovenia Estonia Croatia*
EU funds, 2007-2013 (EUR, bln.) 67.19 26.3 24.92 19.18 11.65 6.77 6.67 4.54 4.1 3.4 1
EU funds/GDP (%) 17.2% 17.6% 25.4% 13.4% 16.2% 19.6% 16.7% 19.4% 11.6% 18.5% 2.3%
Total: EUR 175.7 bln = 16.2% of GDP on average
*Croatia joined the EU in July 2013 26

EU cohesion policy 2014-2020 to provide further boost to regional competitiveness
0
10
20
30
40
50
60
70
8077.6
32.8 28.6
23 22 21.9 21.5 19.2
15.9 15.5 14 11.8 8.6
7.6 6.8 4.5 3.6 3.1 2.3 2.1 1.5 1.4 1.2 1.2 0.7 0.7 0.6 0.1
EU cohesion policy 2014-2020, allocation by country (EUR bln)
CEE to receive over 50% of EU 2014-2020 Cohesion Policy = more than EUR 190 bln EU 2014-2020 Cohesion Policy targets: R&D, ICT sector, sustainable transport, SMEs, renewable energy & energy efficiency, environment, employment and education
27

Competitiveness of local economies steadily on the rise
Country Rank, 2006
Rank, 2016
Change of position
Estonia 18 16 2
Lithuania 22 20 2
Poland 56 25 31
Slovenia 42 29 13
Slovakia 32 29 3
Czech Republic 59 36 23
Romania 62 37 25
Mexico 58 38 20
Bulgaria 48 38 10
Hungary 46 42 4
Thailand 23 49 -26
Russia 95 51 44
Turkey 60 55 5
Croatia 115 65 50
Vietnam 75 78 -3
China 89 90 -1
Serbia 78 91 -13
Indonesia 114 114 0
India 116 130 -14
Competitiveness of local economies has registered solid advance as measured by the Ease of Doing Business Ranking by the World Bank Most CEE countries are in top 50 5 countries hold a position in top 30
28

CEE increasing role in European value chains
0.0
20.0
40.0
60.0
80.0
100.0
120.0
140.0
160.0
56.7
114.0
54.0
41.6 36.2
15.8
5.7 6.2 8.7 4.8 1.2 4.5 3.2
141.6 135.7
119.1
72.4
61.6
40.2
14.9 14.1 12.8 8.7 7.9 7.7 7.5
2005
2015
Export of CEE countries to EU (EUR bln)
Export of CEE countries to EU have jumped by more than 80% b/n 2005 and 2015 Share in total EU imports now above 37% (2005: 29.8%) and significantly lower before that Most countries export over 50% of production to EU
2015
Czech Republic 83.4%
Hungary 81.4%
Poland 79.2%
Estonia 75.2%
Romania 73.7%
Latvia 69.5%
Croatia 65.9%
Bulgaria 64.2%
Serbia 63.7%
Lithuania 61.3%
Turkey 44.5%
Russia 44.4%
Ukraine 24.2%
Share of export to the EU in total export (2015)
Source: Eurostat, KCM calculations

Eastern Europe becoming a major manufacturing
hub for multinationals In the past 15 years the regions has
seen massive inflows of foreign investors
The crisis has affected flows to the region, but now there is a clear trend of Eastern Europe establishing itself as a major manufacturing hub
Much lower total production costs – labor, office rentals, electricity, taxes, tax and other incentives many multinational corporations shifting production to Eastern Europe
Location becoming more important – proximity, both in geographical and cultural terms, favors Eastern Europe over other manufacturing hubs like Asia and Latin America
EU membership and accession make trading much easier
NEARSHORING becoming more and more popular
30

Eastern Europe vs. Asia
Eastern Europe is increasingly recognizing the importance of quality as a differentiator to low-cost Asian producers Wages have been growing robustly in Asia in the past years with wage gap between Eastern Europe and Asia narrowing; wages in China have more than tripled in the past decade Realizing the trend of nearshoring, even Asian companies are investing in the region Eastern Europe now moving up the value chain from low-cost manufacturing centers, regional economies now facing the challenge to become innovative knowledge-based economies
Rather than viewing the CEE region as a cheap production base, multinationals increasingly consider it to be a source of expertise. The trend will continue and a deep supplier base will emerge here as local companies become integrated into global supply chains. Production gains in CEE have come from better management rather than from growing population and capital investment (the Asian case).
31

Automotive sector in CEE
• Assessing the potential of the region, Western European and Asian companies invested in local automakers and established new companies. Fiat acquired Poland’s FSM in 1992; Volkswagen took over Škoda in the Czech Republic in 1991; and Renault bought Dacia in Romania in 1998. Audi, Opel, and Suzuki all opened plants in Hungary; Peugeot, Toyota, and Hyundai established operations in the Czech Republic; and Peugeot Citroën invested in Slovakia. Renault, Toyota, Hyundai, Honda, Ford and Fiat all have production facilities in Turkey. Russia is the top producer in the whole CEE region with sizable production by Hyundai, Renault, Volkswagen, Nissan, General Motors and others.
• Along with the automakers came automotive parts suppliers, creating automotive clusters across the region. The factory of Audi in Hungary is now the biggest car engines producer in the world.
• Nearly 2/3 of automotive exports go to EU-15 markets, and 60% of sales are concentrated in Germany, the UK, and France 32
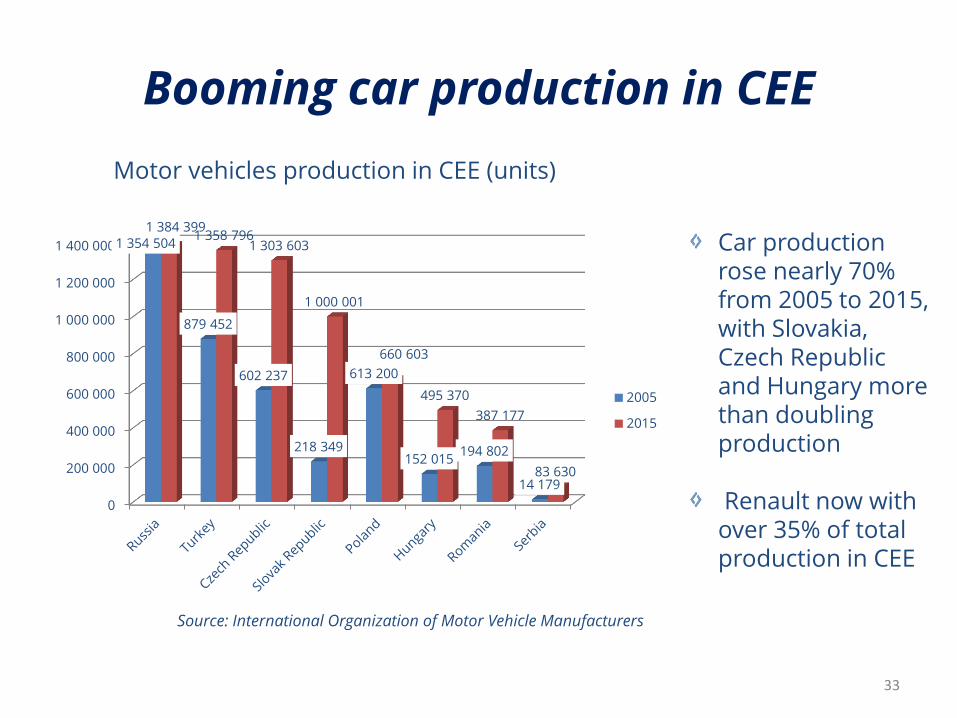
Booming car production in CEE
0
200 000
400 000
600 000
800 000
1 000 000
1 200 000
1 400 0001 354 504
879 452
602 237
218 349
613 200
152 015 194 802
14 179
1 384 399 1 358 796
1 303 603
1 000 001
660 603
495 370
387 177
83 630
2005
2015
Motor vehicles production in CEE (units)
Car production rose nearly 70% from 2005 to 2015, with Slovakia, Czech Republic and Hungary more than doubling production Renault now with over 35% of total production in CEE
Source: International Organization of Motor Vehicle Manufacturers
33

Eastern Europe – the new Silicon Valley
The human assets of the region make it a major player in technological innovation Forbes consistently ranks CEE at the top of the world in educational achievement in math, science & technology.
In 2013, 16 out of the 24 finalists of Google's annual Code Jam programming competition were from Central and Eastern Europe
Solid growth of number of employees in ICT sector (Estonia: +128% in the past 10 years, Romania: +120%, Bulgaria: +84%).
Many significant tech businesses have started in CEE:
- Skype founded by Estonians, acquired by Microsoft for $8.5 bln
- Whatsapp founded by Ukrainian, acquired by Facebook for $19 bln
- Prezi launched in Hungary as online tool for creating presentations
- Major cyber security companies - AVG Technologies, Avast and ESET, in the Czech Republic and Slovakia
Abundant EU funding supports start-ups from the tech sector
34

Pronounced success in outsourcing
Country European Ranking
Global ranking
Poland 1 10
Bulgaria 2 12
Romania 3 13
Russia 4 17
Latvia 5 18
Turkey 6 21
Ukraine 7 24
Czech Republic
8 26
A.T. Kearney’s Global Services Location Index. 2016
CEE countries climbing up the global rankings for Business Process Outsourcing (A.T. Kearney’s
Global Services Location Index includes the
top 55 countries for BPO) While low cost of well-qualified employees, with multi-language skills used to be main driver for outsourcing, now many CEE firms have grown into solid centers of competence, equal tech partners and value-added developers shift from outsourcing to outsharing CEE outsourcing industry projected to grow at CAGR of 10% and reach USD 1.6 trln by 2020
35

CEE stock markets lagging behind
Performance of MSCI EFM Europe+CIS
3M 11.56%
YTD 8.54%
1Y -20.14%
3Y, annualized
-10.88%
5Y, annualized
-10.06%
10Y, annualized
-6.59%
Change since 2007 peak
-56.1% 0.000
50.000
100.000
150.000
200.000
250.000
300.000
350.000
400.000
2004 2006 2008 2010 2012 2014
MSCI ACWI
MSCI EFM EUROPE + CIS
(E+C)
MSCI EM ASIA
MSCI EM LATIN
AMERICA
MSCI EUROPE
MSCI NORTH AMERICA
Lagging performance, high catch-up potential

Attractive valuation ratios across CEE
0
5
10
15
20
10.24
19.51
14.33 16.00 15.93 15.30
17.99
11.44
P/E, ttm
0.00%
1.00%
2.00%
3.00%
4.00%
5.00% 4.01%
2.53% 3.11%
4.45%
1.92% 1.71% 1.57%
3.71%
Dividend yield, %
0.00
0.50
1.00
1.50
2.00
2.50
3.00
3.50
0.93
2.60
1.54 1.64 1.50
2.80 3.13
1.30
P/B, mrq
Source: Reuters, KCM calculations 37

Compelling reasons to invest in CEE
-CEE turning into major manufacturing hub -> rising role in global value chains (over 50% of exports to EU) -Major global companies shift production here -> solid FDIs in automotive sector, transport equipment,
electrical equipment, food, chemicals & metals -CEE turning into the new Silicon Valley due to highly qualified IT specialists
-Booming outsourcing sector -> CEE countries in top 20 for Business Process Outsourcing.
-Buoyant region with appreciable scale converging with the West -Growing much faster than developed Europe
-Among lowest taxes in the world -Low labor costs –> 27% of euro-zone average -Well-educated & highly qualified workforce
-Abundant EU funding boosts competitiveness -Geographic & cultural proximity to the West
-Greater focus on quality vs. low cost Asian producers

Why invest in Emerging Europe now
Solid catch-up potential based on lagging performance in past years
Based on bright macroeconomic outlook and compelling data, the region is considered a safe haven.
Improving sentiment towards emerging markets as a whole to spark uptrend
Attractive valuation ratios with multiples lower than peers and historic averages
Low market penetration -> solid catch-up potential
Improving liquidity
39
Disclaimer This presentation is for information purposes only and does not represent a proposal for buying of selling securities. While reasonable care has been taken to ensure that the information contained herein is not untrue or misleading at the time of publication, Karoll Financial Group makes no representation that it is accurate or complete. The information contained herein is subject to change without notice. Karoll Financial Group makes no representations or warranties whatsoever as to the data and information provided in any third party referenced website and shall have no liability or responsibility arising out of or in connection with any such referenced website. Karoll Financial Group does not maintain a predetermined schedule for publication of research and will not necessarily update this presentation. Karoll Financial Group and any of its officers, employees, related and discretionary accounts may, to the extent not disclosed above and to the extent permitted by law, have long or short positions or may be otherwise interested in the investments or securities referred to in this document, or in options on such investments or securities, or in related investments (including other securities of the same issuer). Karoll, or its clients or customers, may trade as market maker in the investments or securities that are the subject of this document, or in related investments, and may have acted upon, bought for their own account or used the information contained in this document, before its publication. In addition, Karoll Financial Group may provide banking, insurance or asset management services for, or solicit such business from, any company referred to in this presentation. Any investments referred to herein may involve significant risk, may be illiquid and may not be suitable for all investors. Investors should note that income from such investments or other securities, if any, may fluctuate and that price or value of such securities and investments may rise or fall. Accordingly, investors may receive back less than originally invested. Past performance is not indicative of future results. Foreign currency rates of exchange may adversely affect the value, price or income of any security or related investment mentioned in this presentation. This presentation should not be regarded by recipients as a substitute for the exercise of their own judgment. Investors should make their own investigations and investment decisions without relying on this presentation. Only investors with sufficient knowledge and experience in financial matters to evaluate the merits and risks should consider an investment in any issuer or market discussed herein and other persons should not take any action on the basis of this presentation. Before entering into any transaction, investors should consult their advisors and understand the risks involved in these transactions. Investors should make themselves aware of any local laws governing such securities or investments.
40
Contacts:
Daniel Ganev Managing Director, Karoll Capital Management
E-mail: [email protected] Tel: +359 2 400 8 382
Nadia Nedelcheva, CFA Head of Portfolio Management, Karoll Capital Management
E-mail: [email protected] Tel: +359 2 400 8 386
Headquarters Sofia 1 Zlatovrah Str., Sofia 1164, Bulgaria | (+359 2) / 4008 382 | [email protected] www.karollcapital.bg