
Assessments of measures for the greening of transport ...the development of Sweden's transport...
107
CLOSER Lindholmen Science Park AB Box 8077 402 78 Göteborg Assessments of measures for the greening of transport logistics systems from three use cases in the Swedish section of the Scandinavian – Mediterranean corridor FINAL REPORT FROM THE PROJECT GET GREENER FRANS PRENKERT ÖREBRO UNIVERSITY SCHOOL OF BUSINESS MAGNUS SWAHN NTM/CONLOGIC
Transcript of Assessments of measures for the greening of transport ...the development of Sweden's transport...

CLOSER
Lindholmen Science Park AB Box 8077 402 78 Göteborg
Assessments of measures for the greening of transport logistics systems
from three use cases in the Swedish section of the Scandinavian –
Mediterranean corridor
FINAL REPORT FROM THE PROJECT GET GREENER
FRANS PRENKERT ÖREBRO UNIVERSITY SCHOOL OF BUSINESS
MAGNUS SWAHN NTM/CONLOGIC

2
Develop results from Swiftly Green & GreCOR in Sweden's part of the
Scandinavian-Mediterranean corridor During 2012-2015, the Swedish Transport Administration (Trafikverket) was involved in two major European projects called Green Transport Corridors, GreCOR and Swiftly Green. Both projects have were delivered with good judgment in the Interreg and TEN-T programs and ended in 2015. On behalf of the Swedish Transport Administration, Closer has produced the attached report which presents the potential to take care of and develop the results produced within the two mentioned projects. The work has consisted of studying how the best results can contribute to the development of Sweden's transport system. The project has also pointed out suggestions for how the knowledge produced can be managed, which can provide a valuable platform for future planning and create a more climate-neutral infrastructure (Swedish Transport Administration, vision 2050). The project has identified measures in the form of "low-hanging fruits", soft and hard, which alone or in combination can be implemented in the Scandinavian part of the Scan-Med corridor. The effects of the actions have been analyzed by the tools in the toolbox, developed from a Swedish perspective, but also with regard to the transport corridor as a whole. The aim of the work has been to develop different "packages" of measures that can be implemented in the near future, which at the same time can contribute to a greatly reduced environmental impact. Important in this regard has been the connection to the EU and TEN-T Scan-Med corridor. Within Swiftly Green, more than 120 actions were taken focusing on meeting the EU's climate goals, and in GreCOR another 6 actions were demonstrated. All actions are identified and mapped because they are of high relevance to the development of Green Transport Corridors. The measures were based on three parameters: Greening effects, Marketability and Corridor scope for high potential identification measures. Although all the actions are relevant for developing the transport system, the effect of implementation depends on local conditions. A measure that has a high ranking and has shown a great impact and easy implementation in one part of Europe may therefore be less suitable for implementation in Swedish conditions or vice versa. Commissioned; Annelie Nylander, Strategic Development, +4670-258 84 20 Lina Wells, Planning, +4670-003 22 29

3
© CLOSER and the authors 2017.
CLOSER encourage using the material in this report for personal and research use as
long as the source is acknowledged. Commercial use and/or reproduction in any form
prohibited without prior written consent from the copyright holders.
To reference this report:
CLOSER (2017). Assessments of Measures for the Greening of Transport Logistics Systems
from three Use Cases in the Swedish Section of the Scandinavian-Mediterranean Corridor.
Gothenburg: CLOSER.

4
Preface
This report constitutes the final reporting from the project GET Greener. GET Greener
started as an initiative by Trafikverket and CLOSER, and is financed by the Swedish
Transport Administration (Trafikverket). The project started in September 2016 and
ended in March 2017.
We wish to thank all the respondents in participating organizations for unselfishly
having shared their time, data and invaluable knowledge. We also acknowledge the
valuable input from the members of the project group during the entire project.
We are also indebted to input from the members of the reference group, which helped
ensure relevance and quality of the work.
Nicklas Blidberg, CLOSER

5
Table of Contents
Develop results from Swiftly Green & GreCOR in Sweden's part of the
Scandinavian-Mediterranean corridor ........................................................................ 2
Preface ............................................................................................................................ 4
Table of Contents ........................................................................................................... 5
Executive Summary ....................................................................................................... 7
Svensk sammanfattning .............................................................................................. 17
List of terms and abbreviations used ......................................................................... 26
1 Introduction .............................................................................................................. 28
2 Scope .......................................................................................................................... 29
2.1 Aim and purpose of GET Greener ..................................................................................................................... 29 2.2 Scope ............................................................................................................................................................................. 29 2.3 Environmental considerations ........................................................................................................................... 29 2.4 Organization of the project .................................................................................................................................. 30
3 Background - Sustainable logistics: opportunity or threat? ................................. 31
3.1 Shippers ....................................................................................................................................................................... 32 3.2 Transport costs and productivity ..................................................................................................................... 33 3.3 Climate change .......................................................................................................................................................... 36 3.4 Concluding remarks on sustainable logistics ............................................................................................... 39
4 Methodology ............................................................................................................. 40
4.1 Some fundamental assumptions ....................................................................................................................... 40 4.2 Definitions and limitations .................................................................................................................................. 40 4.3 The importance of lead-users ............................................................................................................................. 44 4.4 Case analysis .............................................................................................................................................................. 45 4.5 Assessing potential effects ................................................................................................................................... 46 4.6 Working with the toolbox and identifying measures ............................................................................... 47
5 The Road Use Case .................................................................................................... 51
5.1 Business rationales linked to profitability and GHG-emissions ........................................................... 51 5.1.1 Collaborative business models (FTL and LTL) ............................................................................................52 5.1.2 Introduction of LNG/LBG based propulsion ................................................................................................52 5.1.3 Proposed amendment of Directive 96/53/EC .............................................................................................53
5.2 High Capacity Transport (HCT) ......................................................................................................................... 54 5.3 Lead user: DB Schenker ........................................................................................................................................ 55
5.3.1 Challenges for the duo trailer .............................................................................................................................56 5.3.2. Facts on the duo trailer ........................................................................................................................................57 5.3.3 Conclusions ..................................................................................................................................................................58 5.3.4 Sensitivity analysis ...................................................................................................................................................60
5.4 Lead user: PostNord ............................................................................................................................................... 61 5.4.1 Challenges for the duo trailer vehicle .............................................................................................................62 5.4.2. Transport facts .........................................................................................................................................................62

6
5.4.3 Conclusions ..................................................................................................................................................................63 5.4.4 Sensitivity analysis ...................................................................................................................................................65
5.5 Discussion: Core issues from the Road cases ............................................................................................... 65
6 The Railway Use Case ............................................................................................... 69
6.1 Current issues for the railway system ............................................................................................................ 69 6.1.1 Lead user: ScandFibre Logistics (SFL) ............................................................................................................69 6.1.2 A dedicated railway system .................................................................................................................................71
6.2 Issues for SFL ............................................................................................................................................................. 72 6.2.1 Longer and Heavier Trains (LHT) ....................................................................................................................74 6.2.2 The digitization of the railway transportation system ...........................................................................75
6.3 Measures and performance assessments ...................................................................................................... 77 6.3.1 Longer Heavier Trains ...........................................................................................................................................77 6.3.2 Analysis of LHT ..........................................................................................................................................................78 6.3.3 Digitized railway ......................................................................................................................................................82 6.3.4 Analysis of digitized railway ...............................................................................................................................83 6.3.5 Sensitivity analysis ...................................................................................................................................................84
6.4 Discussion: Core issues from the Railway case ........................................................................................... 85 6.4.1 HCT Rail ........................................................................................................................................................................85 6.4.2 Digitization of Rail ...................................................................................................................................................86
7 The Infrastructure Use Case .................................................................................... 88
7.1 Lead user: Swedish Transport Administration ........................................................................................... 88 7.1.1 General aspects of traffic tunnels ......................................................................................................................88
7.2 The Varberg tunnel project ................................................................................................................................. 89 7.3 Identification of measures from the Trafikverket case ............................................................................ 91
7.3.1 A four-step guide for infrastructure projects ..............................................................................................91 7.3.2 Identifying measures ...............................................................................................................................................92
7.4 Analysis and performance assessments......................................................................................................... 93 7.5 Discussion: Core issues from the Infrastructure case .............................................................................. 95
8 Discussion ................................................................................................................. 97
8.1 Implications for the road use case .................................................................................................................... 98 8.2 Implications for the rail use case ...................................................................................................................... 99 8.3 Implications for Trafikverket .......................................................................................................................... 100 8.4 Implications for the Swedish part of the ScanMed corridor ............................................................... 101 8.5 Recommendations ................................................................................................................................................ 102
8.5.1 Recommendations for Trafikverket as the infrastructure owner ................................................... 102 8.5.2 Recommendation to shippers and service providers in the sector ................................................. 103
8.6 Post Script ................................................................................................................................................................ 103
References .................................................................................................................. 105
Appendix A: Summary of the Swiftly Green project ................................................ 107

7
Executive Summary
Introduction and purpose of GET Greener
While many initiatives and measures exist that hold the potential for greener transports
and logistics systems, studies show that the relative importance of environmental
efficiency for transport purchasing managers has been on the same level since the early
2000s.
This report describes the investigation of the existing measures from the projects
Swiftly Green (Sweden-Italy Freight Transport and Logistics Green Corridor) and
GreCOR in the project reported here called GET Greener. The investigation has been
commissioned and financed by the Swedish Transport Administration (Trafikverket)
This report accounts for the methodologies and results of GET Greener. The aim of the
project was to identify “low-hanging fruits” among the more than 130 measures
identified in the project Swiftly Green. These measures are also referred to as the
‘toolbox’.
The purpose of the project was to identify measures from the Swiftly Green collection of
measures that can be implemented within a near future in the Swedish section of the
ScanMed corridor and contribute to significant reductions in emissions of greenhouse
gases.
Overall results and recommendations
Implementing measures always entail costs. One issue to manage in these circumstances
is who will bear the cost for a given measure. This issue is generic and is emphasized
regardless of modality, measure or context.
At a general level, it is a question of how costs, benefits, responsibilities, ownership,
maintenance and investments are distributed among a set of heterogeneous actors in a
complex socio-technical-economic matrix. In this case it has to do with transports and
transport systems and the initiatives, measures and attempts that exist to make these
more sustainable. However, if these issues can be overcome, our results indicate some
considerable potential.
Our results indicate that by systematically and persistently implementing two or three
measures from the toolbox it is possible to reach the ambitious GHG-emissions targets
from transports set by the Swedish government already before 2030.

8
Combining High Capacity Transport-road measures such as longer trucks to allow for
34m1 vehicles fuelled by HVO with long and heavy 730m-trains (LHT) on the core
relation Malmö – Hallsberg of the ScanMed corridor alone creates reductions in GHG-
emissions on a scale that enables the transport sector to reach its emission targets.
This leads us to conclude that there are no significant technical obstacles hindering
achieving the targets. The obstacles that exist are more of legal, regulative,
organisational and economic character. To fully harness the potential identified in this
report, issues such as EU-regulation concerning HCT-road, the development of open
business models, neglected infrastructure maintenance and investments, and the
harmonizing of railway regulations and control across Europe must be dealt with.
The authors of this report have in dialogue with the reference group arrived at the
following recommendations:
Recommendations to Trafikverket:
Prioritize maintenance and investments in infrastructure to enable and
accelerate the expansion of HCT-road as well as longer-heavier-trains (LHT)
Expanded collaboration and co-loading can contribute to more systematically
coordinated cargo flows with the opportunity to utilize larger vehicles. We
recommend Trafikverket to continue to actively partake in creating opportunities
to elicit more and more developed collaboration among business actors in the
sector. This can be done by stimulating cooperation, enhancing positive effects
and initiating demonstration-projects in which new tools for continued
horizontal collaboration are identified and old ones further developed. The
current project on horizontal collaboration by CLOSER is a promising initiative in
this direction that can be enhanced further
Prioritize investments in rail infrastructure that enables an accelerated and
smooth shift from road to rail transports – for example through the following:
1 The HCT configurations in this report are 32 meters, but in order to enable two 45 feet containers, 34 meter is
needed.
By systematically implementing two measures (influencing the directive
controlling vehicle lengths and LHT) it might be possible to reach the
emission targets adopted by Sweden already ahead of 2030.
• HOWEVER – this assumes using renewable Swedish electricity (”Bra
Miljöval”) and that sufficient volumes of biomass are available for the
production of sustainable fuels, such as non-palm-oil-based HVO.
• AND that necessary investment in infrastructure is made and that
regulative and economic obstacles are managed and removed.

9
o Make the shunting yard in Hallsberg a state-of-the-art node in Scandinavia
concerning efficiency, capacity and quality which together contributes to
the productivity of the whole railway system
o Make the shunting yard in Sävenas an ocean gate
o Make the shunting yard in Malmö equipped to receive long heavy trains
from the continent
Use the measures above in combination with HCT road as ”Flagship” cases to
develop them towards implementation
Use the methodology from this in your own operations to identify potential
measures and assess their Technology Readiness Level (TRL) and Market
Readiness Level (MRL) in line with the assessments made in the toolbox
Introduce routines to harness results from climate analyses in prior
infrastructure projects when planning for new projects to avoid repeating
previous mistakes
Establish routines for systematic knowledge transfer across various
infrastructure projects
Initiate a road map with requirements on transports in terms of Key Performance
Indicators (KPIs) to be improved over time so as to achieve an efficient and fossil
free transport system. Such a system would enable early adopters to go forward
while putting laggards in the spotlight. Measures such as renewable fuels, vehicle
technology and (more) effective logistics are all measures that can be used to
improve performance. Its respective use is, however, determined among the
actors in the system based on what is suitable in specific situations and in certain
circumstances.
Stimulate projects in which solutions with inland and coastal sea freight
transports complements road and rail transports
Recommendations to shippers and service providers in the sector:
Increase the engagement in networks and the collaboration with other actors in
the Swedish transport sector to realize potentials and revenues that are
otherwise inaccessible and to strengthen your business model
Open up your business model to other actors in the sector without creating
unacceptable increases of business risk
Ensure that your business model is aligned with the development towards
greener transport systems
Use you role to create leverage in the transport system to create sustainable
systems
To achieve real change, public domain actors and policy makers needs to create long-
term systematic regulations that ensures that he rules of the game are coherent, stable
and geared towards creating a fossil free transportation system in 2045 at the latest.

10
How Trafikverket can use the methodology from this report
The method used here is based on use cases. This method can be used by Trafikverket to
ensure that policies and ambitions are anchored in a real context to drive change.
This means that Trafikverket can identify use cases that are considered important in
some aspect(s) and then identify measure(s) from the toolbox (and/or new ones) based
on the prerequisites in the use case that would lead to the desired outcomes. Such
analyses can preferably be accompanied by cost estimates and KPIs of various kinds as
well as a plan for how costs and benefits are to be shared and distributed among the
actors in the use case in question.
This would possibly increase the chances for Trafikverket’s policies and directives to
become more effective. A concrete example on one such use case that could be identified
and an associated measure is the road map for sustainable fuels for various transports
that have been pointed out previously in this report.
Results from the road use case
High Capacity Transport on road
In this case we have explored three measures in the toolbox. First, larger vehicles
through amendment of Directive 96/53/EC, where the potential cost and emission
savings are substantial. Second, Increasing load factor through a collaborative business
model (FTL and LTL), where our cases involved two large transport operators co-loading
the cargo of several shippers. Cargo volumes in both directions, that is, achieving
sufficient load factors is a pre-requisite for larger vehicles. Third, using alternative fuels
by introducing LNG-based propulsion indicates small climate gains as this fuel is based on
fossil gas. If the gas is based on biomass it has a substantial reduction potential. Another
drawback is that a compression engine requires a certain fraction of diesel for ignition.
Since gas fuels are incompatible with fluid fuels the study also looked into HVO as an
optional renewable fuel that is easier to introduce, as it is fully compatible with present
diesel fuel and engines. This fuel indicates very high saving potentials.
To summarize: Obstacles to reach the emission targets are not of technical character. Rather they are of legal, regulatory, organizational and economic character. To realize the potential identified here, issues on EU-regulations of HCT-road, the development of open business models, lack of infrastructure maintenance and investment, as well as the harmonization of railway regulation within Europe, must be addressed and managed.

11
Conclusions from the HCT-road
General conclusions from the road use case are:
From a cost saving perspective the duo trailer vehicle provides a better solution
as 100 % more volume cargo can be loaded in comparison to the Tractor and
single semitrailer and 30 % more volume cargo can be loaded in comparison to
the 25.25 m vehicle meanwhile it only requires one driver. Equipment also seems
to be less expensive and is useful in other applications.
Coordination of cargo flows is needed to utilize larger HCT-vehicles
For swift introduction of renewable fuels it needs to fit smoothly into the present
propulsion systems
Traffic safety is not significantly affected by the duo semitrailer.
Functionality of services is fairly similar. One advantage may be that the semi-
trailer can be delivered to the shipper early in the day for loading and picked up
in the afternoon.
Quality is not influenced since this contains the same handling and service.
Minor operational challenges occur when connecting and disconnecting the road
train.
A concluding remark is that we presently seem to have relevant knowledge and tools to
de-carbonize the long-haul transport. The challenging question is how to scale this up in
a sustainable way.
Results from the rail use case
Long heavy trains (LHT):
Our results show that while LHT alone creates very small aggregated savings, this
measure does create a more environmentally efficient solution as the GHG-emissions
per ton cargo transported decreases. This means that by increasing this LHT operation
itself, the total CO2-emissions increase but it assumes that it will eliminate other
transport solutions with higher GHG-emissions. The CO2-emissions per ton goods
transported decreases through the LHT, however these decreases are quite small as
compared to the effects from this in combination with a shift from road to rail. Our
scenario-analysis from the rail use case clearly shows a potential for GHG-emissions
savings, especially when cargo is shifted from road to rail.
When going from a relatively small shift to a larger with increasing volumes of cargo
going from road to rail, the savings is linear in relation to the amounts of cargo volumes
transferred. This is because the relative share of GHG-emissions from rail compared to
road is so small, and because the length of the stretch is assumed equal for both road
and rail.
A 10 % shift results in 28 169 tonnes CO2e in annual savings.
A 30 % shift results in 84 505 tonnes CO2e in annual savings.
A 50 % shift results in 140 843 tonnes CO2e in annual savings.

12
Conclusion from LHT:
Due to the linear relationship between cargo volumes and GHG-savings in the Swedish
part of the ScanMed RFC, the total GHG-emissions savings equals that of the magnitude
of the shift itself. Our results show that a 10 % shift from road to rail renders a 10 %
decrease in GHG-emissions, a 30 % shift renders a 30 % decrease, and a 50 % shift
renders a 50 % decrease. This conclusion is valid for both the use case as well as for the
Swedish part of the ScanMed corridor with reasonable reliability because it is largely
(within reasonable frames) scale-independent.
This means that as cargo shifts from road to rail, the savings from decreased emissions
from road transports are so significant and the increase in emissions from rail so
insignificant so that the total GHG-emissions savings equals that of the magnitude of the
shift itself.
Digitization of rail:
The digitization of the railway in itself create little or immeasurable direct effects on
GHG-emissions. However, the indirect effects are measureable.
Our results show that in the current use-case scenario derived from an estimated
modest 2 % shift from road to rail, 773 tons GHG-emissions would be saved every year.
If the shift is 10 % the saving is 3 864 tons annually in this use case.
Conclusions from the digitization of rail:
The main argument for investing in the digitization of the railway is not primarily
because its direct greening effects. However, indirect positive environmental effects can
be identified. For example the European Rail Traffic Management System (ERTMS)
enables rail management authorities to increase the number of train paths which
arguably might enable the shifting of cargo from road to rail. Much of the argument is
based on a perceived need to constantly increase the service level of the transport
offering to customers in order to make rail a more attractive option for transport
buyers. Their main requirement is service reliability. If this is neglected, there is a risk
that the rail option becomes less attractive.
Results from the infrastructure use case
The Varberg tunnel
Infrastructure projects are initiated by numerous societal needs but politically decided
and publicly funded. This suggests the involvement of many environmental dimensions
– not least when it comes to railway infrastructure such as the tunnel underneath the
city of Varberg. Most environmental aspects are considered during the environmental
consequences analysis phase (“miljökonsekvensbeskrivning” in Swedish) that together
with the railway investigation (“järnvägsutredning” in Swedish) and the railway plan
constitutes decision support when deciding on infrastructure projects.

13
Based on the railway investigation and the railway plan the environmental
consequences of the new tunnel have been assessed influencing the conditions that need
to be fulfilled by the construction. Many constraints exist: local, regional and national.
On top of local and regional requirements the national railway requirements is a major
constraint that must be fulfilled. This creates various forms of more or less far-reaching
compromise solutions. Although there is a formal requirement to carry out a final
climate analysis of rail tunnel projects, presently it seems that other considerations are
perceived as more important. One manifestation of this is that, at the moment, there are
no stringent format requirements on this report that would make feedback more
accessible. There are in other words still risks that previously made mistakes could be
repeated.
In addition, in the process of procurement of material and construction processes there
is a general concern to not exceed regulations linked to public procurement regulations.
There is an anxiety to establish conditions that may cause competitive distortion that
can be appealed. In general this seems to be an area that can be improved to enable
knowledge transfers from other types of public procurement processes.
Conclusions from the Varberg tunnel:
Our results show that every infrastructure project has its unique characteristics when it
comes to geography, geology, demography and political processes. Acknowledging this,
the planning and construction process overall is good although the construction seems
to be traditional and highly dependent on certain individuals and their skills and
experiences from earlier projects in Sweden. However, this can make the project
vulnerable and susceptible to inconsistent practices and lacking of systematic
knowledge transfers.
While there exist international benchmarking on how comparable traffic infrastructure
projects are carried out and on how specific requirements have been solved, it seems
that this is not harnessed in a systematic way in the Varberg tunnel use case. The
measures in the toolbox on these issues remain unknown and unused when it comes to
this type of infrastructure issues. While experience from other national tunnel projects
are used, structures for systematic feedback of experiences from previous international
tunnel projects are not fully in place.
Methods: How we arrived at the results
This project is based on a case-study methodology and comprises three cases each one
with its individual characteristics, issues and contexts, but with the common
denominator that they all relate to the cargo flows in the ScanMed corridor in Sweden.
The three cases chosen are that of a road use case; a rail use case and an infrastructure
use case. For each use case some lead-users were identified. Lead-users are actors that
are on the forefront of developments in its respective field, and that can be considered
forerunners regarding technologies, organisation, volumes or responsibilities. They are

14
actors that have a say in the sector in which they operate. These lead users and the use
cases serve as contexts against which measures in the toolbox are assessed for ease of
implementation. The table below summarizes the use cases and the lead users of this
project.

15
Case Use case Use case
illustration
Measure in toolbox
Road HCT Road
DB Schenker
Collaborative business models (FTL
and LTL)
Introduction of LNG-based
propulsion
Amendment of Directive 96/53/EC
PostNord
Collaborative business models (FTL
and LTL)
Introduction of LNG-based
propulsion
Amendment of Directive 96/53/EC
Rail HCT Rail ScandFibre
Logistics (SFL)
Marathon - Longer and heavier
trains (LHT)
Digitization of Rail ScandFibre
Logistics
(Transwaggon)
Digital enquiry form for freight
wagons (RFID chip)
Arrival estimation for freight
vehicles (freight vehicle tracking
devices using GPS)
Infra Green Infrastructure Trafikverket Recycling of tunnel spoil
Thermal use of drainage water
Unreinforced tunnel inner lining
Tunnel lining potential energy
exploitation
3D temperature mountain mapping
Tunnel 3D surface mapping
We used the use cases as a backdrop against which the measures in the toolbox were
assessed for relevance and ease of implementation.
To assess the readiness for implementation we used the technology- and market
readiness level scales (TRL/MRL) from the Swiftly Green toolbox. For a measure to be
considered having an implementation potential it must score at least a level 7 (pilot test)
in relation to the specific use case in question, to be eligible.
Once the measure was identified we assessed the effects of its implementation at two
levels: First, for the specific cases in question; and second, for the Swedish part of the
ScanMed corridor as a whole. This latter assessment was made with the respective case
as a basis, however results from such an up scaling must always be interpreted with care

16
and depends heavily on the assumptions made. These assumptions are accounted for
and discussed in detail when this analysis is performed and in the methods section.

17
Svensk sammanfattning
Introduktion och syftet med GET Greener
Det finns en mängd initiativ och åtgärder med potential för grönare transporter och
logistiksystem. Trots detta visar studier att för transportköpare ligger den relativa
betydelsen av miljörelaterade effekter av transporter på samma nivå som sedan början
av 2000-talet.
Trafikverket har med FoI-medel finansierat en genomgång av de existerande
åtgärder som identifierades i projekten Swiftly Green (Sweden-Italy Freight Transport
and Logistics Green Corridor) och GreCOR. I denna rapport redogörs för de metoder och
resultat som GET Greener genererat. Målsättningen med projektet var att identifiera så
kallade ”lågt hängande frukter” bland de mer än 130 olika åtgärder som identifierades i
Switfly Green. Dessa åtgärder hänvisas också till som “verktygslådan”.
Syftet med projektet var att identifiera åtgärder ur Swiftly Greens verktygslåda som har
potential att implementeras inom en inte allt för avlägsen framtid i den svenska delen av
ScanMed-korridoren och som bidrar till en signifikant minskning av utsläpp av
växthusgaser.
Övergripande resultat och rekommendationer
Att implementera åtgärder medför alltid kostnader. En viktig fråga att hantera i dessa
sammanhang är vem som bär kostnaderna för en given åtgärds implementation. Denna
fråga är generisk och betonad oavsett modalitet, åtgärd eller kontext.
På en generell nivå är det en fråga om hur kostnader, nyttor, ansvar, ägarskap, underhåll
och investeringar distribueras bland ett antal heterogena aktörer i ett komplext socio-
tekniskt-ekonomiskt sammanhang. I detta projekt handlar det om transporter och
transportsystem och de initiativ, åtgärder och försök att göra dessa mer hållbara som för
närvarande existerar. Kan man hantera dessa frågor så visar resultaten från projektet på
en icke oväsentlig potential.
Resultaten pekar på att genom att systematiskt och ihärdigt implementera två eller tre
åtgärder från verktygslådan så är det möjligt att nå de ambitiösa utsläppsmålen från
transporter uppsatta av den Svenska regeringen, redan före 2030.
Genom att kombinera åtgärder för så kallade hög-kapacitetstransporter – High-Capacity
Transports (HCT) på väg i form av långa lastbilar och tillåta 32-metersbilar som går på
HVO-bränsle med åtgärder för Långa Tunga Tåg (LTT) som 730-meterståg på

18
kärnrelationen Malmö – Hallsberg i ScanMed så kan man enbart med dessa åtgärder
möjliggöra att nå sektorns utsläppsmål.
Detta leder till slutsatsen att det inte är tekniska hinder som utgör hinder för att nå
utsläppsmålen. De hinder som existerar är snarare av legal, regulativ, organisatorisk och
ekonomiskt karaktär. För att till fullo realisera den potential som identifieras här så
måste frågor om EU-regleringar av HCT väg, utvecklingen av öppna affärsmodeller,
eftersatt infrastrukturunderhåll och investeringar, och harmonieringen av järnvägens
reglering och styrning i Europa, lyftas upp och åtgärdas.
Författarna till rapporten har i dialog med referenspersoner kommit fram till följande
rekommendationer:
Rekommendationer för Trafikverket:
Prioritera underhåll och investeringar i infrastruktur som möjliggör och
accelererar en expansion av HCT väg och LTT.
Utökat samarbete och samlastning kan bidra till mer systematiskt
synkroniserade och koordinerade varuflöden och möjlighet att utnyttja större
fordon. Vi rekommenderar att Trafikverket tar en roll i att skapa möjligheter för
att fler samarbeten mellan affärsdrivande organisationer och företag i branschen
ska komma till stånd. Detta kan ske genom att stimulera samverkan, synliggöra
positiva effekter och initiera demonstrationsprojekt, där verktyg tas fram för
fortsatta horisontella samarbeten.
Prioritera investeringar i järnvägsinfrastruktur som möjliggör ett utökat och
smidigt skifte från väg till järnväg – exempelvis genom:
o att göra Hallsbergs rangerbangård till en state-of-the-art nod i
Skandinavien avseende effektivitet, kapacitet samt kvalitet vilket
sammantaget ökar hela järnvägssystemets produktivitet.
o att göra Sävenäs rangerbangård i Göteborg till en ocean gate
o att utrusta Malmö rangerbangård för att ta emot LTT från kontinenten
Använd åtgärderna ovan i kombination med HCT väg som ”Flagship”-fall i
ScanMed-korridoren för att vidareutveckla dem mot implementation.
• Genom att systematiskt implementera två åtgärder (påverkan av direktivet
som styr fordonslängder samt LTT) så är det möjligt att nå utsläppsmålen
från transporter uppsatta av den svenska regeringen, tom före 2030
• MEN – det bygger på antaganden om användning av förnybar svensk
elektricitet (”Bra Miljöval”) samt tillräckliga mängder biomassa som
möjliggör produktion av hållbara drivmedel, exempelvis HVO utan palmolja
• SAMT att nödvändiga investeringar görs och att regulativa och ekonomiska
hinder undanröjs

19
Använd metodologin med fokus på konkreta användarfall (use cases) från detta
projekt i Trafikverkets verksamhet för att identifiera potentiella åtgärder och
bedöm dess TRL (Technology Readiness Level) och MRL (Market Readiness
Level) för lämplighet och potentiellt införande
Inför rutiner för att omhänderta resultat från klimatanalyser i genomförda
infrastrukturprojekt i planeringen av nya för att undvika att tidigare gjorda
misstag upprepas
Inför rutiner för systematisk kunskapsöverföring mellan infrastrukturprojekt
Initiera en färdplan med nivåkrav på transporter i form av KPI:er som ska
förbättras över tid för att nå ett effektivt och fossilfritt transportsystem. Med ett
sådant system ges föregångare möjlighet att gå före och erhålla fördelar medan
eftersläntrare synliggörs. Åtgärder som förnybara bränslen, fordonsteknik samt
effektiv logistik är alla medel för att förbättra prestanda. Deras respektive
användning bestäms av systemets aktörer efter vad som passar dem bäst i varje
givet sammanhang
Stimulera fler projekt där lösningar med kustnära sjöfart som ett alternativ till
väg- och järnvägstransporter utforskas och testas
Rekommendationer till varuägare och logistikaktörer:
Öka engagemanget i nätverk och samverkan med andra aktörer i den svenska
transportsektorn för att realisera potentialer som annars är oåtkomliga och för
att stärka upp affärsmodeller
Öppna upp era affärsmodeller till andra aktörer i branschen utan att skapa
oacceptabelt höga affärsrisker
Säkerställ att er affärsmodell ligger i linje med utvecklingen mot grönare
transportsystem
Använd er roll för att skapa hävstångseffekter i transportsystemet för att skapa
hållbara system
För att kunna åstadkomma reella förändringar måste offentliga aktörer och
policymakare skapa långsiktigt systematiska regleringar av branschen som
säkerställer att det finns enhetliga, stabila och meningsfulla regelverk som syftar till
att skapa ett fossilfritt transportsystem senast 2045.

20
Hur Trafikverket kan använda metoden från denna rapport
Den metod som använts i denna rapport bygger på så kallade användarfall. Denna metod
kan användas av Trafikverket för att säkerställa att policy och ambitioner förankras i en
verklig kontext för att åstadkomma förändring. Det betyder att Trafikverket kan
identifiera användarfall som anses viktiga i någon aspekt och sedan utifrån de
förutsättningar som råder i dessa användarfall identifiera åtgärder från Swiftly Greens
verktygslåda och eller andra (helt nya) förändringar som i sin tur skulle leda till
önskvärda effekter. Sådana analyser kan med fördel åtföljas av kostnadsberäkningar och
KPI:er av olika slag samt en plan för hur kostnader och nyttor fördelas mellan de i
användarfallet ingående aktörerna.
På så sätt ökar sannolikt chanserna för att Trafikverkets policyer och styrning blir
effektivare. Ett konkret exempel som pekas ut i denna rapport är en färdplan med
nivåkrav på transporter.
Resultat från väg-fallstudien
HCT-väg
I detta fall har vi utforskat tre åtgärder från verktygslådan. Den första är större fordon
genom tillägget till direktivet 96/53/EC där de potentiella kostnadsbesparingarna och
utsläppsminskningarna är avsevärda. Den andra handlar om att öka fyllnadsgrader
genom samarbetsorienterade affärsmodeller (FTL, Full Truck Loads; och LTL, Less Than
Truck Loads). Här studerar vi två speditörer som samlastar gods från flera varuägare i
långa och tunga bilar. Den tredje handlar om alternativa bränslen. Att introducera LNG-
baserade framdriftsystem tyder på små miljöeffekter då detta alltjämt är en
fossilbaserad energikälla. Om gasen är gjord på biomassa har det däremot en avsevärd
reduktionspotential. Men en nackdel är att en kompressionsmotor kräver en fraktion av
vanlig diesel i bränslet för att kunna antända bränsleblandningen. Eftersom gas-
baserade bränslen är inkompatibla med flytande så har vi istället tittat på HVO som ett
alternativ som är enklare att introducera eftersom det är fullt ut kompatibelt med
Sammanfattningsvis: Det är inte tekniska hinder som gör att man inte når utsläppsmålen De hinder som existerar är snarare av legal, regulativ, organisatorisk och ekonomiskt karaktär För att realisera den potential som identifieras här måste frågor om EU-regleringar av HCT väg, utvecklingen av öppna affärsmodeller, eftersatt infrastrukturunderhåll och investeringar, samt harmonieringen av järnvägens reglering och styrning i Europa, lyftas upp och åtgärdas

21
existerande dieselbränslen och motorer. Detta bränslealternativ är helt biobaserat och
visar på stor reduktionspotential.
Slutsatser från HCT väg
De allmänna slutsatserna från HCT väg är följande:
Från ett kostnadsperspektiv är duo-trailerfordonet en bra lösning då 100 % mer
volym last kan lastas i jämförelse med en bil med semitrailer, och 30 % mer last
kan tas jämfört med 25,25-metersfordonet trots att det endast kräver en förare.
Utrustningen verkar dessutom vara billigare och är också användbar i andra
applikationer.
Koordinering av varuflöden krävs för att kunna utnyttja större HCT-fordon
Introduktionen av förnybara bränslen måste passas in i befintliga lösningar på ett
smidigt sätt
Trafiksäkerheten påverkas inte nämnvärt av duo-semitrailern
Servicefunktionaliteten är ganska lika i de olika alternativen, men semitrailern
har en fördel med att den kan anlända till en varuägare på förmiddagen, lastas
under dagen och sedan hämtas upp igen på eftermiddagen
Kvaliteten påverkas inte eftersom samma hantering och service krävs för alla
alternativ
Mindre operativa utmaningar uppstår i samband med att vägtåget kopplas ihop
och isär
Avslutningsvis noterar vi att vi för närvarande verkar ha de nödvändiga kunskaperna
och verktygen för att kunna skapa fossilfria långväga transporter. Frågan är hur vi får
det att ske i stor skala på ett hållbart sätt.
Resultat från järnvägs-fallstudien
Långa tunga tåg (LTT)
Resultat från såväl användarfallsanalysen och korridoranalysen pekar på att även om
LTT i sig knappast skapar några större aggregerade utsläppsbesparingar om det jämförs
med andra redan miljövänliga tåglösningar, så medför LTT miljömässigt mer effektiva
lösningar då växthusgasutsläppen per transporterat ton last minskar. Detta betyder att
de totala CO2-utsläppen ökar, men att CO2-utsläppen per ton transporterat gods minskar.
Denna minskning är dock förhållandevis liten i jämförelse med de effekter som detta har
i form av överflyttning från väg till järnväg. Våra scenarioanalyser från järnvägsfallet
visar på en potential för minskade utsläpp, särskilt då last flyttas över från väg till
järnväg.
Om man går från ett ganska litet skifte till ett större så är besparingen linjär i
förhållande till de volymer av gods som överflyttas. Detta på grund av att den relativa
andelen av utsläpp från järnväg i förhållande till väg är små och på grund av att sträckan
antas vara lika lång för väg och järnväg.

22
En 10 % överflyttning resulterar i en årlig utsläppsbesparing om 28 169 ton
En 30 % överflyttning resulterar i en årlig utsläppsbesparing om 84 843 ton
En 50 % överflyttning resulterar i en årlig utsläppsbesparing om 140 843 ton
Slutsatser från LTT:
Som ett resultat av det linjära sambandet mellan fraktvolymer och utsläppsbesparingar i
den Svenska delen av ScanMed korridoren så utgör magnituden av de totala
utsläppsbesparingarna motsvarande storleken på skiftet som sådant. Resultaten visar
att om 10 % gods skiftas så får man en 10 % minskning av utsläpp. Om 30 % skiftas
minskar man 30 % i utsläpp och om 50 % skiftas så minskar man 50 % i utsläpp.
Detta betyder att då gods skiftar från väg till järnväg så är minskningen av utsläpp från
insparade vägtransporter så signifikanta att ökningen av utsläpp från järnvägen som
skiftet medför nästan blir helt icke-signifikant vilket gör att de totala
utsläppsbesparingarna är i samma storleksvolym som skiftet i sig. Denna slutsats gäller
för såväl användarfallet som för den svenska delen av ScanMed korridoren med rimlig
tillförlitlighet eftersom den är i hög grad skaloberoende (inom rimliga gränser).
Digitaliseringen av järnvägen
Digitaliseringen av järnvägen i sig självt skapar mycket små näst intill omätbara direkta
utsläppseffekter. Indirekta effekter kan dock identifieras.
Våra resultat visar att scenariot med en överflyttning av gods från väg till järnväg
uppgående till 2 % av volymen skulle medföra en utsläppsbesparing om 773 ton
växthusgaser per år. En överflyttning om 10 % av volymen skulle medföra en
utsläppsbesparing om 3 864 ton växthusgaser per år.
Slutsatser från digitaliseringen av järnvägen
Huvudargumentet för att investera i digitalisering av järnvägen ligger inte primärt i dess
hållbarhetseffekter. Dock finns det indirekta positiva miljöeffekter av digitalisering till
exempel innebär ERTMS (European Rail Traffic Management System) att det är möjligt
att öka antalet tåg, vilket bör kunna leda till överflyttning från väg till järnväg. Många
argument ligger i ett uppfattat behov av att kontinuerligt öka service-nivåerna i
transporterbjudandet gentemot kunderna, för att på så sätt göra alternativet mer
attraktivt som transportalternativ. Om man bortser från detta finns en risk att
järnvägsalternativet blir mindre attraktivt.
Resultat från infrastruktur-fallstudien
Varbergstunneln
Infrastrukturprojekt är politiskt initierade och beslutade och omfattar ett flertal
miljödimensioner – inte minst vad gäller järnvägsinfrastruktur så som tunneln under
Varberg. Flera av dessa tas i beaktande under arbetet med

23
miljökonsekvensbeskrivningar som tillsammans med järnvägsutredningarna och
järnvägsplanerna utgör beslutsunderlag för beslut om infrastrukturprojekt.
Baserat på järnvägsutredningarna och planerna så har miljökonsekvenserna av den nya
tunneln bedömts och konstruktionsarbetet har anpassats utifrån krav från dem. En hel
mängd begränsningar existerar: lokala, regionala och nationella – ovanpå lokala och
regionala krav utgör nationella järnvägskrav restriktioner som måste uppfyllas. Detta
skapar olika former av mer eller mindre långtgående kompromisslösningar. Även om
det finns formella krav på att genomföra en avslutande klimatanalys av
järnvägstunnelprojekt så verkar det som om andra frågor uppfattas som viktigare för
närvarande. En manifestation av detta är att det för närvarande inte finns några
stringenta formella krav på denna rapport som skulle möjliggöra återkoppling av
erfarenheter. Det finns med andra ord fortsatt en risk att tidigare gjorda misstag
repeteras.
Slutsatser från Varbergstunneln
Våra resultat visar att varje infrastrukturprojekt är unikt och särpräglat avseende
geografi, geologi, demografi och politiska processer. I ljuset av detta får planeringen och
genomförandeplanerna sägas vara goda även om tillvägagångssättet tycks vara ganska
traditionellt och starkt beroende av vissa individer och deras kunskap och kompetens
från tidigare Svenska projekt. Detta kan dock göra projektet sårbart för inkonistent
handlande och för bristande systematisk kunskapsöverföring.
Även om det finns internationella jämförelser för hur liknande
trafikinfrastrukturprojekt genomförts och hur specifika krav har hanterats så tycks det
som om detta inte fångas in på ett systematiskt sätt i Varbergtunnelprojektet. De
åtgärder som finns i verktygslådan om detta förblir okända och oanvända i denna typ av
infrastrukturprojekt i Sverige. Låt vara att nationella erfarenheter från andra
tunnelprojekt tillvaratas, men det saknas strukturer för systematisk återkoppling från
andra internationella tunnelprojekt.
Hur vi kom fram till resultaten
Detta projekt baseras på en fallstudiemetod (case) och omfattar tre fallstudier med sin
respektive individuella karaktäristik, problem och kontexter, men med den
gemensamma nämnaren att de alla relaterar till godsflöden i ScanMed-korridoren.
De tre fallstudier (eller fall, kort och gott) som valts är ett väg-fall, ett järnvägs-fall och
ett infrastruktur-fall. För varje fall har några ”lead-users” identifierats. Lead-users är
aktörer som ligger långt framme i sina respektive sammanhang och som kan betraktas
som föregångare vad gäller teknologi, organisation och volym eller ansvar. De är aktörer
som har något att säga till om i sitt respektive fält. Dessa föregångare och deras så
kallade ”use cases” (användarfall) fungerar som sammanhang mot vilka åtgärderna i

24
verktygslådan bedöms med avseende på grad av implementerbarhet. Tabellen nedan
summerar de användarfall och föregångare som använts i detta projekt.

25
Fall Användarfall Illustration av användarfall
Åtgärd i verktygslådan
Väg HCT väg
DB Schenker
Kollaborativa affärsmodeller (FTL och LTL)
Introduktion av LNG-baserad framdrift
Tillägg till direktiv 96/53/EC PostNord
Kollaborativa affärsmodeller (FTL och LTL)
Introduktion av LNG-baserad framdrift
Tillägg till direktiv 96/53/EC Järn-väg
HCT järnväg ScandFibre Logistics (SFL)
Marathon – Långa och tunga tåg (LTT)
Digitalisering av järnvägen
ScandFibre Logistics (Transwaggon)
Digital förfrågan för järnvägsvagnar (RFID)
Ankomstbedömning av vagnar (godsvagns spårning med GPS-sändare)
Infra-case
Grön Infrastruktur Trafikverket Återanvändning av tunnelmassor Termisk användning av spillvatten Icke förstärkt tunnel-liner Energiutvinningspotential från
tunel-lining 3D temperatur bergskartläggning Tunnel 3D yt-kartläggning
Användarfallen användes som en bakgrund mot vilka de olika åtgärderna i
verktygslådan utvärderades med avseende på relevans och implementerbarhet.
För att bedöma implementerbarheten så använde vi de teknologi- och
marknadsberedskaps-skalor (TRL/MRL) som tagits fram i samband med arbetet med
verktygslådan i Swiftly Green-projektet. För att en åtgärd skall betraktas ha tillräcklig
potential för implementation så måste den nå minst nivå 7 (pilottest) i förhållande till
det specifika användarfallet för att komma i fråga för analys i detta projekt.
När en åtgärd har identifierats med potential utvärderas effekterna av åtgärdens
implementation på två nivåer: Först på den specifika fall-nivån i respektive användarfall
i fråga, och sedan på en makro-nivå i form av den svenska delen av ScanMed-korridoren
som helhet. Makro-utvärderingen gjordes med respektive fall som bas, men resultaten
från en sådan utvärdering måste alltid tolkas med stor försiktighet och medvetenhet om
de antaganden som ligger till grund för densamma. Dessa antaganden redovisas och
diskuteras i detalj i anslutning till respektive analys och i metod-delen.

26
List of terms and abbreviations used
3PL Third-Party Logistics Provider: An actor that organizes a logistical system for its customer’s and uses its own infrastructure or vehicles.
4PL Fourth-Party Logistics Provider: An actor that organizes a logistical system for its customer’s flows, but owns no infrastructure or vehicles.
Biodiesel See FAME and RME. A non-fossil diesel fuel made of long chains of alkyl esters.
CH4 Methane: A greenhouse gas. CLOSER The national Swedish platform for transport and logistics research
and development. CNG Compressed Natural Gas: A fuel. CO2 Carbon dioxide: A greenhouse gas. CO2e Carbon-dioxide equivalents: A harmonized measure of many types
of GHG-emissions. ERMTS/ETCS European Train Control System. The European standrad for train
control. FAME Fatty Acid Methyl Ester. An ester of fatty acid and methanol.
Usually called ‘biodiesel’. See also Biodiesel. FC Fuel Consumption. FTL Full Truck Loads. A load requiring a whole truck. FVTD Freight Vehicle Tracking Devices: examples are GPS and RFID-
devices. GHG Greenhouse gases: A collective term for COx- and NOx-gases, etc. HCT High Capacity Transport: Transports capable of higher capacities
than current standards. HTK CLOSER Roundtable on Sustainable Transport Corridors HVO Hydrogenated Vegetable Oil: A renewable biomass based fuel. LBG Liquefied Bio Gas: A renewable biomass based fuel. LHT Longer and Heavier Trains: An HCT-concept for rail. LNG Liquefied Natural Gas: A fossil based fuel. LTL Less Than Truck Loads. A load not requiring a whole truck. Measure Any idea or solution that aim to reduce GHG-emissions from
transports. MRL Market Readiness Level: An indicator of the maturity of a measure. NRL Network Readiness Level: An indicator of the maturity of a
measure. PFAD Palm Fatty Acid Distillate. A bi-product from the extraction of palm
oil. Rc4 An older type of locomotive manufactured by ASEA. RFC Rail Freight Corridor. A corrdidor comprising rail infrastructure.

27
RME Ribs Methyl Ester is a type of FAME based on ribs oil and methanol. Usually called ‘biodiesel’. See also Biodiesel.
ScanMed A corridor from Italy in the south to Scandinavia/Finland in the north.
SFL ScandFibre Logistics AB: A 4PL operator in the paper industry. Swiftly Green Sweden-Italy Freight Transport and Logistics Green Corridor: A
project aiming to identify measures for greening the corridor between Sweden and Italy.
TEN Trans-European Network. The Network of transports across Europe.
TEN-T Trans-European Transport Network: The EU Core Transport Corridor Network. A Network of the major freight flows across Europe.
(the) Toolbox The set of measures identified in Swiftly Green. TRAXX A newer stronger type of locomotive manufactured by Siemens. TRL Technology Readiness Level: An indicator of the maturity of a
measure. Trafikverket Swedish Transport Administration TWA Transwaggon: A company offering rail cargo wagons for rent. wtw Well-to-Wheel. A measure of the GHG-emissions from the
production source of the energy to the use in a vehicle.

28
1 Introduction
This report accounts for the methodologies and results of the project called “GET
Greener”. The aim of the project was to identify “low-hanging fruits” among the more
than 130 measures identified in the project Swiftly Green (Sweden-Italy Freight
Transport and Logistics Green Corridor) and GreCOR. These measures are also referred
to as the ‘toolbox’.
Swiftly Green was finished and reported in December 2015 and the toolbox represents
one important output from this project aiming to create greener transports in the
ScanMed corridor from Italy in the south end to Sweden, Norway and Finland in the
north end. GreCOR promoted the development of a co-modal transport corridor in the
North Sea Region and
was finished in December 2014. GET Greener is a Swedish follow-up on these projects
financed by the Swedish Transport Administration (Trafikverket).
The objective of GET Greener is to frame and enhance the results from Swiftly Green
through practical implementation. This can be done by looking at how the toolbox can
contribute to the development of a climate neutral transport system in Sweden.
Developing the Swedish part of the core and comprehensive trans-European transport
network is well in line with current Swedish transport policy.

29
2 Scope
2.1 Aim and purpose of GET Greener The aim of GET Greener is to identify improvement measures in terms of “low-hanging
fruits”, i.e. technical and organizational activities, which individually or in various
combinations can be implemented in the Swedish section of the ScanMed corridor.
The purpose is to identify measures, or ‘packages’ of measures, that contributes to
significant reductions in emissions of greenhouse gases that can be implemented within
a near future.
2.2 Scope An important part of the scope from the commissioner was to discuss effects of
measures at the level of the Swedish part of the ScanMed corridor. This scope was early
on identified as somewhat problematic because it required a scaling of results from a
use-case level to corridor level, which is problematic from a methodological point of
view. Nonetheless, these corridor-level analyses remained required and an important
part of the scope of the project.
The scope is summarized as:
Identification of measures with a minimum TRL/MRL level 7 (pilot test)
thus showing a potential for implementation from a Swedish perspective
Assessment of effects of the implementation of these measures
Assessment of effects of a larger-scale implementation of these measures at
a corridor level
Dissemination of results by CLOSER through dialogue with EU and Swedish
stakeholders
Hence, the project delivers assessments of potential measures at two levels: First, for the
specific cases in question; and second, for the Swedish part of the ScanMed corridor as a
whole as reflected in the scope summary above.
2.3 Environmental considerations All measures that are analysed in the project come from the Swiftly Green toolbox and
have been generated with the aim of reducing transport-related climate impact, that is,
other environmental issues were only partially included, for example noise reductions in
a tunnel. The measures that are identified in this project are considered especially
interesting for the Swedish section of the core ScanMed network and will be further

30
assessed in order to estimate environmental consequences of a potential
implementation in Sweden. This implementation is evaluated at two levels as described
above
2.4 Organization of the project The work was carried out by an operational group with input from workshops,
interviews and dialogue in a collaborative process between academia, industry and
public sector agencies. Table 2.1 show the organisation of the project
Table 2.1 Project organisation
Commissioner
Swedish Transport Administration
Operational
group
The operational group consisted of representatives from the following
organizations:
CLOSER (chair)
The Swedish Transport Administration
NTM/Conlogic
Örebro University School of Business
Additional partners in the CLOSER network was mobilized as necessary
Reference
group
The reference group consisted of representatives from the following
organizations:
The Swedish Transport Administration
Region Örebro County
COOP
Jesjo Konsult AB
Swedish Shipowners’ Association
The Swedish Confederation of Transport Enterprises
Luleå Technical University
Ramböll
The Swedish Association of Road Transport Companies
CLOSER Roundtable on HTK – Sustainable Transport Corridors supported
with in-kind resources.

31
3 Background - Sustainable logistics:
opportunity or threat?
In order to successfully develop greener transport it is necessary to better understand
the business logic and real drivers behind operation of transport logistics. This is of
course valid for all industries that aim towards more sustainable solutions but to some
extent it is even more profound in the market of transport. The ‘bad news’ for this
business is very low margins; hence low willingness to pay for additional attributes that
brings more costs to the operation. The ‘good news’ are the simple fact that many
greening measures often reduces use of resources and in fact increases margins
meanwhile negative environmental impact is lowered. Initiating required sustainability
change therefore needs to focus on activities that increases profit margins and at the
same time reduces emissions.
To arrive at the right focus there is a need to consider the basic conditions for transport.
In general, the market for transport logistics services, to a large extent revolves around
three main pillars of general performance criteria:
Suppliers of transport logistics must provide functionality, reliability and service
degree that in essence comprise a relevant solution of lead times, capacity,
delivery on time, right place and in right condition. Flexibility is a factor of
somewhat less importance but considered more important in some specific
situations, often related to high value cargo or where a delivered item solves
costly standstills.
Suppliers of transport logistics must offer services at competitive cost, which
commonly is ranked highly important by shippers. Another defining cost
parameter would be the alternative cost of non-delivery. A standstill in a large
factory due to lack of inputs of raw material or components may cause huge cost
in a value chain. The non-delivery is crucial also for consumer products. An
empty shelf in a store means short-term loss of sales and long-term a risk of
losing loyal customers.
Suppliers of transport logistics must ensure social responsibility embedded in
the services. Safety and security risks as one example of social responsibility are
prerequisites for transport logistic and a legally mandatory requirement for
dangerous goods transport. There are on the other hand few shippers that
consider the safety risks from social dumping through low wages in order to
reduce labour costs. Environmental care is mostly connected to emissions of

32
greenhouse gases. Other negative environmental effects are at present seldom
included in the supplier evaluation, partly because air pollutants have been
profoundly reduced in road transport. Overall, social and environmental issues
have mostly been driven by legal requirements.
Figure 3.1 illustrates the three basic pillars for sustainable transport.
Figure 3.1 Basic conditions for sustainable transport logistics operations
3.1 Shippers Customers of transport logistics services (shippers2) give different priority to the
various aspects of transport performance. Different ranking of important performance
criteria often relates to type of industry, general market conditions and specific
activities linked to the actual transport logistics services needed. In an attempt to
describe this in general terms, various shippers’ surveys highlight conditions in more
specific and general terms.
According to a shippers3 survey in Sweden carried out every second year, the
environmental aspects are generally ranked of low importance in relation to other
requirements. In the latest survey from 2016, while not yet fully assessed,
environmental aspects in relation to traffic mode choice were considered least
important. This is in line with previous results as described in the survey from 2014.
Table 3.1 Ranking of criteria affecting choice of major traffic mode in 2014.
Rank scale: 1 = not important at all, through 7 = very important.
Reliability 6.3 Geographic coverage 6.2 Flexibility 6.1 Infrastructure 6.0
2 Also named transport procurer or transport purchaser. 3 http://www.chalmers.se/en/centres/lead/TransportPurchasingPanel/Pages/default.aspx. Accessed 2017-03-05.
Transport logistics cost
Sustainabletransport

33
Time limitations 5.9 Cost 5.7 Simple for customer use 5.6 Environmental aspects 4.5
In the survey shippers also make a distribution of relative importance, in total 100 % of
different attributes of transport services when selecting a specific transport solution.
Below is the outcome from previous surveys.
Figure 3.2 Relative importance of different attributes of transport services.
Legend: Blue = Price; Red = Transport time; Grey = Time precision: Green =
Environmental efficiency. Source: Andersson, et al. (2016).
As can be seen in Figure 3.2, the environmental concern has remained much at the same level since 20034. It should be noted that data from 2003 comes from another study by the University of Gothenburg5. Even though environmental aspects in general terms are low ranked there are positive
indications of a small change. There is a trend towards an increasing willingness to pay
for transport services with a lower impact on the environment. Only 3 % claimed they
paid more for transport with less environmental impact in 2012. In 2014 some 9 %
made the same statement. In the latest survey in 2016 some 21 % stated they paid more
for transport services with less environmental impact. This increase could potentially be
related to emission offsetting schemes or simply lip service. On the other hand it shows
a positive increase of shippers’ general ambition.
3.2 Transport costs and productivity
4 Andersson, et al., (2016). 5 Lammgård, C., & Andersson, D. (2014); Lammgård, C. (2007).
51%
18%
23%
8%
2003
54%
16%
22%
8%
2012
50%
18%
22%
10%
2014

34
A key aspect for the transport industry is the need of high productivity driven by a
severe market price pressure. Since much of the service is linked to the ability to deliver
capacity at low costs this puts a continuous pressure on the market price. As is shown in
Figure 3.3 barriers of entry are low in the market (1) and the long-term economic
downturn in the EU since 2008 have decreased or slowed down demand of transport
logistics services (2) in certain markets. The effect of this is a lower market price, which
puts the service providers with higher operational costs under pressure (F-I in Figure
3.3).
Figure 3.3 A Salter diagram illustrating the on-going need for increasing productivity
among the transport service providers A-I.
As a consequence of low margins, a general and necessary way to survive in the market
of transport logistics is a continuous program to increase the operational productivity.
There are many ways to accomplish this but, one key element and recurring theme in
transport operation is use of larger units. Within all modes of traffic there has been a
long term development towards larger vehicles and vessels, all driven by lowering
relative traffic costs meanwhile average revenue increases per unit. In this general
development there is an element of an ironic rebound effect since larger units adds
capacity to the market that puts further pressure on the price. According to interviews
among road hauliers, the higher capacity trucks (HCT) and their productivity gains
expect to be quickly adopted by the market and new lower market price resulting in
consistent economic margins.
Through history, development drives towards larger and larger units for transportation
(Figure 3.3). Within road transport the productivity gains of larger vehicles can be
measured in many different ways. Relevant units may be:
Market
priceCompany
cost
Quantity Service providers
Demand Supply
1
2
A B C D E F G H I

35
Figure 3.3 Examples of HCT-solutions: PostNord’s 32m duo-trailer (bottom) and Hector
Rail’s TRAXX locomotive pulling a long and heavy train (top right). Compared to the first
truck in Sweden (top left), the cargo capacity in a HCT truck is some 80 times higher at a
low increase of fuel consumption per km.
1. Number of drivers per pallet
2. Fuel consumption per pallet
3. CO2e emissions per pallet
Figure 3.4 Performance indicators illustrate the achieved productivity gains with larger
vehicles.
0
0,02
0,04
0,06
0,08
0,1
0,12
0,14
0,16
0,18
12 18 33 51 66
[Dri
ver/
pal
let]
Available number of pallet places
Number of drivers per pallet
Drivers per pallet
0
0,2
0,4
0,6
0,8
1
1,2
12 18 33 51 66
GH
G [
kg/p
alle
t]
Available number of pallet places
CO2e per pallet
CO2e per pallet
0
0,05
0,1
0,15
0,2
0,25
0,3
0,35
0,4
0,45
12 18 33 51 66
Fue
l co
nsu
mp
tio
n [
l/p
alle
t]
Available number of pallet places
Fuel consumtion per pallet
Fuel consumtion perpallet

36
As Figure 3.4 show, larger trucks well used have the ability to reduce relative cost and
emissions substantially. In this assessment the load factor is 50 % for the two smallest
trucks, 60 % for the medium truck and 70 % for the largest trucks.
In order to introduce larger vehicles in transport operation it requires an understanding
of the connection between supply chains and transport production systems. Large units
by itself without sufficient utilization will only increase operational costs and not be able
to gain from the additional capacity. Large units also reduce flexibility to handle smaller
shipments as well as they reduce redundancy ability in the transport system.
An important note is that the utilization degree includes transport flows in both
directions and structural imbalances are a well-known challenge in all countries. This
means that larger vehicles may have difficulties to reach an economic break-even in
circumstances where there are structural imbalances. The most useful application for
large vehicles is line-haul between two terminals or factories where cargo volumes are
fairly even in both directions, predictable and the time span for loading and unloading is
less critical.
3.3 Climate change The understanding and acceptance of the risk of climate change (Figure 3.5) is growing
and the number of people denying the problem is far less today. The urgency for change
is however growing rapidly and every industrial sector need to take their responsibility.
On a global basis, transport in total emits some 15 % of all greenhouse gases. In the EU
the same number is some 20 % and in Sweden this is somewhat more than 30 % due to
previous replacement of fossil energy in heating and industry as well as electricity
production based on hydropower, nuclear power and windmills.
Figure 3.5 Global atmospheric CO2-concentrations now nearing 400 ppm6
6 IPCC Assessment Report 5. SPM 1, Chart c). https://www.ipcc.ch/report/ar5/syr/. Accessed 2017-03-07.

37
According to EU climate and energy targets by 2020 the aim is to:
1. Reduce emissions of greenhouse gases by 20 % compared to 1990-levels
2. Increase the share of energy from renewable sources to 20 %
3. Reduce energy use by 20 %
If other large economies reduce their emissions EU promise to further reduce their
emissions by 30 %. By 2030 the EU aims are:
• 40 % lower greenhouse gas emissions than 1990
• 27 % renewable energy
• 27 % improved energy efficiency
By 2050 the EU aims are to reduce emissions by 80–95 % from 1990 levels if other
countries are doing the same. The European Council reconfirmed this target in February
2011.
The EU Climate Action Plan7 aims to support the EU to become a competitive low carbon
economy by 2050. The approach is based on the view that innovative solutions are
required to mobilize investments in energy, transport, industry and information and
communication technologies. More focus is needed on energy efficiency policies in
general. EU is currently on track to meet two of the 2020-targets, but will not meet its
energy efficiency target unless further efforts are made. Hence, the priority remains to
achieve all the targets already set for 2020.
Together with the White Paper on Transport and the Energy Efficiency Plan8, this
communication is a key deliverable under the Resource Efficiency Flagship. It presents a
Roadmap for possible action up to 2050. The transition towards a competitive low
carbon economy means that the EU should prepare for reductions in its domestic
emissions. The Commission has carried out an extensive modelling analysis with several
possible scenarios showing how this could be done, as explained in Table 3.2 below.
Table 3.2 GHG reductions compared to 1990, sectoral reductions
Sector 2005 2030 2050
Total -7 % -40 to -44 % -79 to -82 %
Power (CO2) -7 % -54 to –68 % -93 to –99 %
Industry (CO2) -20 % -34 to -40 % -83 to -87 %
Transport (incl. CO2 aviation, excl. maritime) +30 % +20 to -9 % -54 to -67 %
Residential and services (CO2) -12 % -37 to -53 % -88 to -91 %
Agriculture (non- CO2) -20 % -36 to -37 % -42 to -49 %
Other non- CO2 emissions -30 % -72 to -73 % -70 to -78 %
7 https://ec.europa.eu/clima/citizens/eu_en. Accessed 2017-03-07. 8 European Commission (2011).

38
The EU Climate Action Plan is criticised, considered to be too low and slow. On the other
hand there are countries within the EU that already are lagging behind.
According to the Swedish Government9 Sweden will:
Be one of the first fossil free countries in the world
Take a leading role in implementing the new UN targets on sustainable
development
Sweden is also challenging EU and the world by ambitious reduction targets of 70 % by
2030 and 85 % by 2045 for the transport sector. This means challenging requirements
described in Figure 3.6 below.
Figure 3.6 Traffic emissions in Sweden and the need for new measures as well as
market and legal based instruments in order to reach the targets.10
9 http://www.sou.gov.se/m-201004-miljomalsberedningen/. Accessed 2017-03-07. 10 http://www.cedr.eu/publication-cedr2016-5-acting-climate-change/. Full report, p.16. Accessed 2017-02-26.
0
10
20
30
40
50
60
70
80
90
100
1990 2000 2010 2020 2030 2040 2050
Foss
il e
ne
rgy
use
(TW
h)
Traffic growth
BAU scenario
Objectives
History
Agreed instruments,
measures and turnover of
vehicle fleet
Need for new instruments and
measures

39
3.4 Concluding remarks on sustainable logistics The viability of transport logistics companies relates very much on decreasing costs
through higher productivity. The measures leading to lower costs are commonly also
related to reducing relative emissions of greenhouse gases, i.e. these actions go hand in
hand.
There is however a risk that higher productivity reduces relative GHG-emission but a re-
bound effect occurs as cheaper transport services increases the transport components
share in the value chain, hence a risk of increased total emissions. A relevant follow up
of performance should therefore include relative and absolute emissions in order to
avoid sub-optimizations.
Another interesting aspect of Sweden being the primary advocate for larger trains and
trucks to compensate for distance disadvantages. In central Europe larger trains and
trucks are also relevant but more common as a measure to compensate for congestion
challenges.
In total, our opinion is that sustainable logistics is more of an opportunity than a threat
but it needs to be considered in every aspect of transport logistics operation and further
development regarding modal choice and efficiency. .

40
4 Methodology
4.1 Some fundamental assumptions Any investigation or analysis rests on some taken for granted or preconceived points of
views. The first section of this methodology section will spell out the fundamental
assumptions of this report. First we provide a definition of how we interpret the task of
identifying “low-hanging fruits” and what the relevant contexts are. This leads us to a
discussion of the importance of maintaining industrial relevance when identifying
measures and of the importance to involve lead user in this process.
After that we discuss the choice of use cases and the characteristics of case methodology
in general. We conclude this section with explaining how we have used the toolbox in
relation to the chosen use cases.
4.2 Definitions and limitations The focus of this project is on “low-hanging fruits” that can be identified among the more
than 130 relevant measures previously identified in Swiftly Green. First, we need to
define what we mean by “low-hanging fruits”.
In order to assess whether a measure is a low-hanging fruit or not, the measure in
question must be related to a specific context. Thus, a measure that is considered a low-
hanging fruit is that in relation to a specific context in which it is fairly easily
implemented or for which it is intended. This means that we need to be able to define
and specify the contexts in some way in order to be able to discern if a measure is a low-
hanging fruit or not. It could mean that in relation to the context, the measure is
relatively easy to implement and that the effect is considerable. In addition a measure
that may be less ready for implementation may still be considered due to its high effect.
The level of readiness of measures is assessed using the technology- and market
readiness level scales from the Swiftly Green toolbox. This will be discussed in detail
later.
In this project, the relevant contexts are defined as the business network structures of
organizations that enable the freight transport in the Swedish part of the ScanMed
corridor (see Figure 4.1). The corridor represents major flows of goods. These flows are
created by the business networks of organizations that organize the logistics systems as
a response to the needs of producers and consumers to move goods11. Without these
11 Dubois, A., Hulthén, K., & Pedersen, A-C. (2004).

41
networks, there are no flows and would be no corridor. Hence, these networks are the
relevant contexts for the measures of the toolbox from Swiftly Green.
Figure 4.1 The Scandinavian section of the ScanMed corridor.
Given this definition of context, we identify three cases, which serve as the context for an
evaluation of measures. The three cases are identified in relation to the Swedish part of
the ScanMed corridor with major flows on road and rail, but less on sea. We therefore
focus on the road and rail cases. In addition, infrastructure was identified as a key
context with relevance to the Swedish section of the corridor.
Hence, we identify the road freight modality as one case, the railway freight modality as
another case and infrastructure as a third case. This helps us specify the significant
domains against which measures can be assessed for relevance and as low-hanging
fruits. It also enables us to keep an analytical focus as it creates a specification and
delineation of empirical data and enables a focused analysis12.
Low-hanging fruits are accordingly identified as measures that possess one or a
combination of the following characteristics in relation to the given context (use case)
for which it claims relevance:
12 Miles & Huberman (1994).

42
1. It is technologically feasible and possible to implement – it has a sufficient
“Technical Readiness Level (TRL)”
2. It is economically feasible and possible to implement – it has a sufficient “Market
Readiness Level (MRL)”
Each measure is evaluated using a scale for assessing the TRL and MRL as shown in
Figure 4.2. This scale is a composite of TRL and MRL as is shown in Figure A1 and it has
been used previously to evaluate measures in the Swiftly Green project. Market
readiness is seen as building on and overlapping with technological readiness. TRL
comprise nine levels (1-9) in three stages defining its technology status, whereas MRL
comprise 15 levels (5-19) in five stages defining its market status.
Figure 4.2 The scale for assessing TRL and MRL.
The European Commission definitions of the different levels of TRL are:
TRL 1.
Basic principles observed
TRL 2.
Technology concept formulated
TRL 3.
Experimental proof of concept
TRL 4.
Technology validated in lab
TRL 5.
Technology validated in relevant environment (industrially relevant environment in the case of key enabling technologies)
TRL 6.
Technology demonstrated in relevant environment (industrially relevant environment in the case of key enabling technologies)
TRL 7.
System prototype demonstration in operational environment
TRL 8.
System complete and qualified
Pre study Pilot test Test Introduction In operation Market penetration
(1-3) (4-6) (7-9) (10-12) (13-15) (16-19)
TRL 1-9 Market status
MRL
43
TRL 9.
Actual system proven in operational environment (competitive manufacturing in the case of key enabling technologies; or in space)
The market readiness level (MRL) is assessed according to the following criteria:
1. Availability and acceptance 2. Functionality and productivity 3. Approvals and legal restrictions 4. Standards 5. Service and after market 6. Residual value
For a measure to be deemed as having a potential to be implemented without too much
investment in resources, it must score at least a level 7 on the TRL/MRL-scale (above
pilot test level). In addition it must not require substantial investments or adaptation in
existing technological and market contexts. This is derived from literatures on the
relationship between science, technology and society (STS) recognizing that
technological contexts are stable and fine-tuned systems that develop over time13.
Introducing new ideas and changes always require relating what is new to the already
existing structure and that which is already in use. The larger the gap, the more costly
the change is – sometimes it is too costly and thus impossible to implement14.
This context-dependence of technological and market measures is crucial to understand
when identifying measures from the toolbox. Measures that can come into question are
those that both score a minimum level 7 on the TRL/MRL-scale and which requires
relatively little change and adaptation to the existing technological context.
The first criteria is assessed based on the measure itself using the TRL/MRL-scale, the
second is derived from the use case from which the measures originates. This is also the
main reason to why this use-case approach was chosen at the outset – it is one of the few
approaches that enables the identification of measures that do not require extensive
adaptation and change to existing technological contexts. In other words, this is how we
define, conceptualize and operationalize measures that could be said to be some kind of
“low-hanging fruits”, or the measures that produces the most “bang for the buck”.
However, even if a measure is identified as implementable, it does not automatically
follow that it is possible to carry through all the way. A measure that is implementable
means that we have identified its potential to be introduced and initiated in the given
context. However, whether it actually yields the expected results is a practical question
that needs to be tested and evaluated by actually testing it in a real life context. Such a test
could then be evaluated against the expected results predicted in this project. An
13 Bijker & Law (1992); Oudshoorn & Pinch (2003). 14 Håkansson (1987); Håkansson & Waluszewski (2007); Håkansson et al., (2009).

44
alternative way to use the results from this project is to use them to evaluate outcomes
from simulation-models.
The scope of this project however is on the potential implementation of potential
measures. Every specific measure must eventually be tested in a real setting. While such
demonstrations are beyond the scope of this project, its results may serve as a
foundation for the formulations of demonstration projects
4.3 The importance of lead-users Having central actors involved is decisive for the success of any innovation- or R&D-
program. Innovation literature informs us that these actors of lead-users that are the
recipients or users of the ideas or measures of a program must be involved early in a
successful implementation process15.
Due to the interactive character of innovation processes, users, developers and
producers of products, solutions, systems and ideas must collaborate16. By this
collaboration, lead-users17 may be identified and used as good examples. Moreover lead-
users can also be used to re-interpret solutions from one context to another – both in an
abstract and a concrete way. In an abstract way, findings from cases with lead-users may
be theoretically and analytically generalized18. In a concrete way, findings from cases
with lead-users may be re-scaled from a micro-level to a macro-level context.
A major issue is that knowledge is usually very context-dependent19. This seems to be
the case also with knowledge and experience in logistics, which carry marks of path-
dependency and situational dependence. This makes it crucial to involve lead-users
early in the process where measures towards more sustainable transport systems are
identified in order to capture the specifics of the context.
In this project, we identify lead-users related to the three cases identified previously in
relation to the ScanMed corridor within the TEN-T core network of freight corridors in
Europe. In this way we funnel down the very general issue of implementing measures
from Swiftly Green in the ScanMed corridor, via the case of road, rail and infrastructure
to specific lead-users within these three cases respectively.
These lead-users represent organizations that participate in the organizing networks
around the corridor in Sweden. Table 4.1 show the three cases and the lead users
identified in relation to them.
15 Ibarra & Hunter (2007); Oudshoorn & Pinch (2003); Prenkert (2012). 16 Håkansson & Waluszewski (2007). 17 von Hippel (1976, 1986). 18 Yin (2009). 19 von Hippel (1994).

45
Table 4.1 The use cases and lead-users of this report
Use case Lead users
HCT Road DB Schenker
PostNord
HCT Railway and
Digitization of Railway
ScandFibre Logistics (SFL)
Green Infrastructure Swedish Transport Administration
The benefits with this lead-user and use-case approach are many. Among others the
benefits are that:
1. It is a systematic way of funnelling down a complex general problem into
concrete context-relevant issues
2. Lead-users are involved early
3. The methodology in itself may be useful in, and transferable to, other problems
with similar complexity
4. It enables knowledge re-interpretation at a macro-level
This project is based on a case-study methodology20 where the focus is on the unique
and to acknowledge the distinctive features of something21. Case studies are used to
generate knowledge in terms of deeper understandings of contexts and complex
relationships.
A case can be many things: a company, an individual, a process, a project, etc. How one
defines a case affects what questions can be addressed and how the results are to be
interpreted22.
This project comprise three cases each one with its individual characteristics, issues and
contexts, but with the common denominator that they all relate to the flows in the
ScanMed corridor in Sweden.
4.4 Case analysis Within the three wider “use cases” we have identified lead-users who represent
organizations involved in the management of the flows in the corridor. Given these
cases, the more than 130 measures from the toolbox are analysed in a step-wise
analysis. The first step constitutes sorting the measures into one or many of the three
case categories23. It should be duly noted that one and the same measure might be found
20 Stake (2003). 21 Morgan & Smircich (1980). 22 Ragin & Becker (1992). 23 Vaughan (1992).

46
in more than one case if it is relevant for more than just one case. Some measures are
not relevant for any of the here identified use cases and are thus excluded from further
analysis. This is discussed in detail below.
In the second step, the measures are analysed in relation to the context and
requirements of the case in question. The feasibility is assessed in this step and it is here
that potentially low-hanging fruits are identified according to the previous discussion.
This second step requires a case description against which the feasibility of the measure
is evaluated. This case description is based on empirical data collected through
interviews and field observations at the lead-user organizations. In this way, the lead-
users are involved early in the process, as this case description must be available in
order to perform the second step of the analysis. The case descriptions also functions as
a description of a current situation and they are found at the introduction of each case
section of this report.
In step three, the effects of implementation of measures are calculated and discussed by
identifying a number of scenarios. The results of those scenarios are discussed in
relation to the specific lead-user use case at a micro-level. Moreover, effects are also
calculated and discussed in relation to the entire Swedish part of the Scand-Med
corridor at a macro-level.
4.5 Assessing potential effects The potential climate effects of the implementation of measures were assessed by
calculating GHG-emissions using the emission factors developed by NTM24. In creating
the scenarios, we made some assumptions concerning, for example, volumes, savings,
increases, etc. These assumptions are explicitly stated and described in relation to each
scenario in the results part of this report.
When possible, we use verified data from the lead-users, and when we do so, we indicate
such data. When that is not possible for whatever reason, we have made an assumption
based on expert verification, if possible and as a last resort based on common sense and
general knowledge of the issue among the project members and its reference group.
Assessments of greening effects were made at two principal levels. First, assessments
were performed at the use case level. At this level the measures that has been identified
and considered relevant are used as a basis for a number of scenario-analysis from
which greening effects are calculated. These GHG-emission savings are based on case
data.
24 www.transportmeasures.org.

47
Second, being an absolute requirement and part of the project scope, assessments were
also performed at the corridor level. This entailed scaling up results from the measures
at the case level. This scaling constitutes a challenge because there are no clear
methodologies or established praxis for how it can be done. One way is of course to rely
on official statistics. However, when it comes to the Swedish part of the ScanMed
corridor, finding relevant and reliable data on volumes and flows is difficult, not to say
impossible. Import/export data are too blunt since that accounts for more flows than the
ones in the corridor (including all import export entry and exit of cargo at many points
that are not in the corridor), and cargo flow data in Sweden is also problematic because
of cargo being diverted from the core corridor into peripheral networks along the
stretch.
Finally we resorted to using the use cases as a basis also for the scaling. Since the cases
are solid and data-driven, this approach was considered the best possible in this
circumstance. However, this also means that one must take great care when interpreting
the results from the assessments of greening effects at the corridor level. This is an
extremely important caveat that cannot be disregarded.
The results from the scaling to macro level must be used cautiously and with care
and should not be considered definitive. Nevertheless, they do provide an
indication of what a scaled implementation of this measure in the Swedish part of
the ScanMed corridor could entail, given that the assumptions made here hold
true.
We strongly recommend readers to evaluate the validity of these results in relation to
their respective setting. One way to do so is to compare the assumptions made here to
those made by the reader or made in the reader’s setting to see whether they hold true
also for this context.
4.6 Working with the toolbox and identifying measures In order to identify low-hanging fruits from the toolbox, we used the use cases as a basis
for evaluating and assessing the measures in the toolbox. First all 130 measures were
identified and extracted in a format enabling the processing and sorting by means of
computer software.
As a first step, the 130 measures were sorted into three rough categories: those
measures related to road, railway and infrastructure, respectively based on the choices
of use cases in this project. However, that action turned out not to yield any precise
categories because many measures link to two or all of these categories as they are not
mutually exclusive. In addition, even if a measure is – in principle – relevant for, for
example a railway solution, it may not be relevant in practice. And since we are much
concerned here with identifying practically relevant measures we had to find another
way to identify them.

48
Therefore we turned to the use cases for guidance in step 2. The use cases provided a
much more focused way of identifying relevant measures in the toolbox. Based on core
issues identified in the three general use cases of PostNord and Schenker together for
road, SFL for railway and Trafikverket for infrastructure we then moved on to identify
relevant measures related to these core issues.
This meant that we started in the use cases and identified relevant issues that were
significant in these cases (these are discussed in detail in relation to each use case
respectively later). Then, based on these issues, we started a matching process with the
measures in the toolbox to match the issues to measures. This matching process was
rather cumbersome and had to be done manually since it was impossible to produce any
search-strings that produced reliable results. Two versions of the database of measures
were used. First, the database in MS excel format was used. It was obtained from the
Swiftly Green-project and is essentially a huge table of data. However, it enabled us to
screen the entire database for potentially relevant measures and also to perform simpler
searches to identify potential measures based on the issues in the use cases. At this stage
it was a process of matching what was identified as important and relevant in the use
cases with measures in the toolbox.
Once these potential measures were matched and identified, we turned to the version of
the database from Swiftly Green available online25. This “replica tool” is a web-based
shell around the database that provides search opportunities with free-text searches as
well as searches based on modalities, etc. Figure 4.3 show the interface of this tool.
25 http://swiftlygreen.interporto.it:90/ReplicaTool/app/#/search Measure. Accessed 2017-02-13.

49
Figure 4.3 The interface of the Swiftly Green Database on the internet
While the excel-database gave us overview, the web-database provided depth. From the
web-database we could obtain in-depth information about each potential measure
which enabled us to single out the final measures which could be considered as having a
potential based on their TRL- and MRL-assessments and anchoring in the use cases. In
this way we reduced the initial set of measures to 17 potential measures, which were
considered as relevant, significant and implementable, based on the three use cases of
this project. Table 4.2 below show the issues identified and the associated measures
from the toolbox as identified by this process.
It should be noted that each issue from the use cases might match with one or more
measures from the toolbox, as shown in Table 4.2. These 15 measures are thus identified
as scoring at least a level 7 on the TRL/MRL-scale and requiring a minimum of changes
and adaptations in the existing technological contexts. However, most of them require
investments to be made and we discuss this issue in our analysis.
Table 4.2 The linking between the use cases and the measures in toolbox
Case Use case Use case illustration
Measure in toolbox
Road HCT Road
DB Schenker
Collaborative business models (FTL and LTL)
Introduction of LNG-based propulsion

50
Amendment of Directive 96/53/EC PostNord
Collaborative business models (FTL and LTL)
Introduction of LNG-based propulsion
Amendment of Directive 96/53/EC Rail HCT Rail Scandfibre Logistics
(SFL)
Marathon - Longer and heavier trains (LHT)
Digitization of Rail Scandfibre Logistics (Transwaggon)
Digital enquiry form for freight wagons (RFID chip)
Arrival estimation for freight vehicles (freight vehicle tracking devices using GPS-trackers)
Infra Green Infrastructure Trafikverket Recycling of tunnel spoil Thermal use of drainage water Unreinforced tunnel inner lining Tunnel lining potential energy
exploitation 3D temperature mountain mapping Tunnel 3D surface mapping

51
5 The Road Use Case
5.1 Business rationales linked to profitability and GHG-emissions The business rationale in road freight transport is linked to short term challenges due to
a general price pressure. Long-term road transport hauliers also need to reduce their
climate impact as transport by road contributes significantly to emissions of greenhouse
gases. Cutting cost and reducing greenhouse gas emission can be achieved through over
lapping measures that is, improving efficiency through better utilization degrees and
larger vehicles.
Figure 5.1 Relative emissions from a trailer in relation to its degree of utilization.
The main success factor for all transport operation is a sufficient utilization degree. This
entails sufficient cargo flows in both directions enabling economic feasibility through
high productivity but also lowering the relative environmental impact. For stretches
with large general cargo volumes this means that longer and heavier trucks (HCT)
increases its efficiency and lowering relative GHG-emissions significantly. The main
trade-off is decreasing ability for redundancy, as access to optional road infrastructure
thereby is limited. Furthermore is higher capacity by road potentially increasing
competition towards rail transport solutions, but could as well also better feed in
modular units to the rail transport system. Based on this background we identify the
following measures from the toolbox as relevant for this case:
Collaborative business models (FTL and LTL)
Introduction of LNG based propulsion
Proposed amendment of Directive 96/53/EC
CO2 performance of a trailer with a Euro 4 tractor
0
50
100
150
200
250
300
350
0 20 40 60 80 100
Utilization [%]
Em
iss
ion
s
[g C
O2
/to
nk
m]

52
Figure 5.2 Assessment of TRL- and MRL-levels of the three actions described in the
case.
5.1.1 Collaborative business models (FTL and LTL)
This is an area of little controversy and since long time well implemented in the
transport market. It is probably the oldest principle of transport operation since its very
beginning. In using present buzzwords, the concept could be described as examples on
“shared economy” and “horizontal collaboration”.
The most efficient transport systems, i.e. most profitable are those that puts utilization
degree as their core activity. By definition utilization degree optimization must include
production and sales criteria´s. It needs continuous short and long-term nursing and will
deteriorate quickly if given insufficient attention.
The new possibilities in this field are access to more data and supporting IT-tools and
more developed models for cooperation. Some argue that big data driven collaboration
will make the transport system comparable to internet26 where cargo flows is delivered
by any truck in a large production system. To understand the system effects of larger
vehicles with regard to their practical utilization is a key evaluation element for further
development of HCT.
5.1.2 Introduction of LNG/LBG based propulsion
Liquefied natural/bio gas (LNG/LBG) predominantly methane, CH4 is liquefied through a
modest pressure and cooling process. LNG achieves a higher reduction in volume than
compressed natural gas (CNG) so that the (volumetric) energy density of LNG is
2.4 times greater than that of CNG but only 60 percent of diesel fuel. LNG/LBG can be
used in diesel engines but requires a certain amount of diesel to start the combustion
process. If the primary energy derives from biogas the emissions of CO2 is close to zero.
Using fossil based LNG gives small climate benefits in comparison to regular diesel,
26 Physical internet compares the transport system with servers and networks for data distribution.
Pre study Pilot test Test Introduction In operation Market penetration
Collaborative business models
Pre study Pilot test Test Introduction In operation Market penetration
Introduction of LNG based propulsion
Pre study Pilot test Test Introduction In operation Market penetration
Amendment of Directive 96/53/EC
TRL 1-9 Market status
MRL

53
especially considering slip of the greenhouse gas methane from the combustion that
may occur.
Our somewhat wider interpretation of this measure within the toolbox is the
introduction of renewable fuels in road transport. In this circumstance, it is worthwhile
mentioning some other solutions:
Future gas driven vehicles may develop towards use of hydrogen where hydrogen is
potentially a fuel that could be provided along the ScanMed corridor.
Electrification of trucks27 for long haul and short distance is presently also developed
and tested in various applications. Promoting charging stations along the ScanMed
corridor could push this development forward.
For the second case the fuel used is HVO28 being easily adopted by hauliers since it is
fully compatible to regular diesel.
5.1.3 Proposed amendment of Directive 96/53/EC
Heavy goods vehicles, buses and coaches must comply with rules on weights and
dimensions for road safety reasons and to avoid damage of roads, bridges and tunnels.
The Directive (EU) 2015/719 sets maximum dimensions and weights for international
traffic, also ensuring that Member States cannot restrict the circulation of vehicles, that
complies with these requirements. The directive also aims to avoid national operators to
benefit from undue advantages over their competitors from other Member States.
Concerning the issue of cross-border traffic of vehicles heavier, longer or higher than the
limits set in the initial Directive (EU) 2015/719 ended with the conclusion that the rules
of Directive 96/53/EC should not be modified.
Even though the debate of larger vehicles in cross-border traffic seem to be difficult it is
relevant to evaluate the effects of larger vehicle dimensions. It should also be noted that
vehicle combinations adding to 32 meters were historically allowed in Sweden until
1968/69 and remained on the roads until 1973.
During 2016 the plan for the Swedish government was to change the traffic ordonnance
regarding the article 4.5 in the 96/53/EG. This would enable vehicles or vehicle trains
with new techniques or design that not fulfills the regulations in the traffic ordonnance
on weight and dimensions whereas they could operate on roads for a limited time
period. However, this is still not introduced (February 2017).
27 Read more on electrified trucks here: http://www.conlogic.se/en/news/trend-outlook-electric-driven-heavy-
duty-trucks/. Accessed 2017-03-27. 28 Hydrogenated Vegetable Oil (HVO).
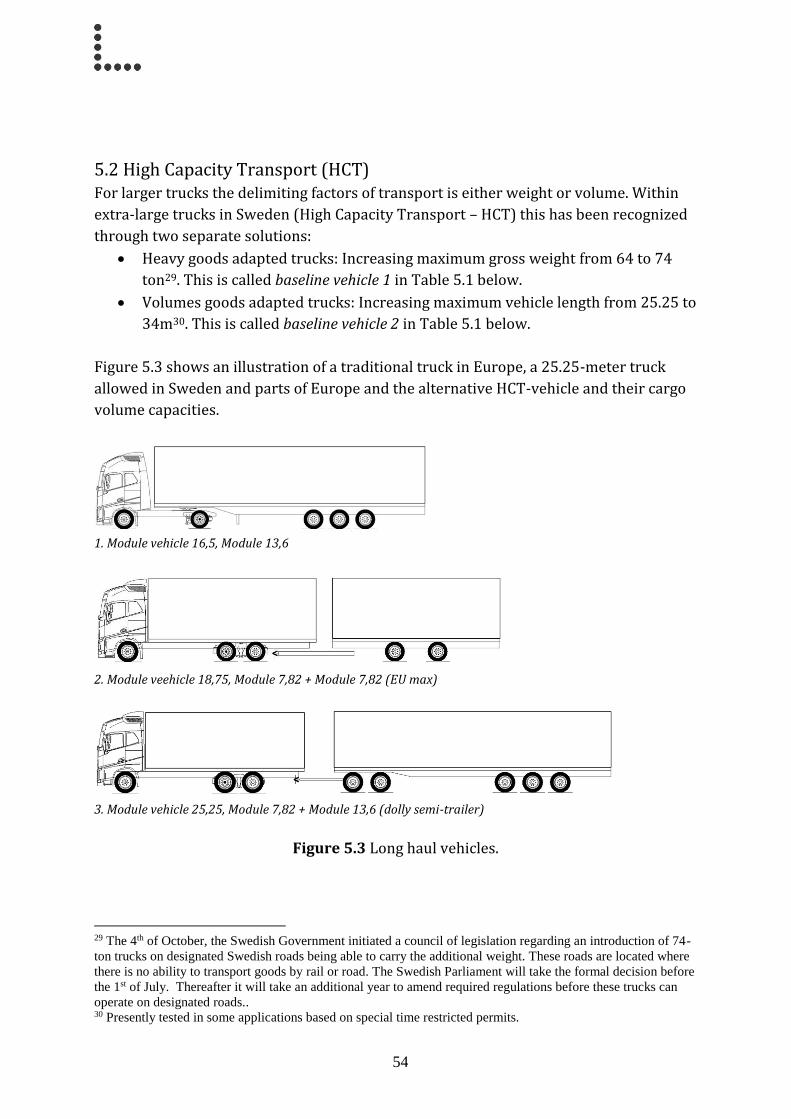
54
5.2 High Capacity Transport (HCT) For larger trucks the delimiting factors of transport is either weight or volume. Within
extra-large trucks in Sweden (High Capacity Transport – HCT) this has been recognized
through two separate solutions:
Heavy goods adapted trucks: Increasing maximum gross weight from 64 to 74
ton29. This is called baseline vehicle 1 in Table 5.1 below.
Volumes goods adapted trucks: Increasing maximum vehicle length from 25.25 to
34m30. This is called baseline vehicle 2 in Table 5.1 below.
Figure 5.3 shows an illustration of a traditional truck in Europe, a 25.25-meter truck
allowed in Sweden and parts of Europe and the alternative HCT-vehicle and their cargo
volume capacities.
1. Module vehicle 16,5, Module 13,6
2. Module veehicle 18,75, Module 7,82 + Module 7,82 (EU max)
3. Module vehicle 25,25, Module 7,82 + Module 13,6 (dolly semi-trailer)
Figure 5.3 Long haul vehicles.
29 The 4th of October, the Swedish Government initiated a council of legislation regarding an introduction of 74-
ton trucks on designated Swedish roads being able to carry the additional weight. These roads are located where
there is no ability to transport goods by rail or road. The Swedish Parliament will take the formal decision before
the 1st of July. Thereafter it will take an additional year to amend required regulations before these trucks can
operate on designated roads.. 30 Presently tested in some applications based on special time restricted permits.

55
4. Module vehicle 25,25, Module 13,6 + Module 7,82
5. Module vehicle 34, Module 13,6 + Module 13,6
Figure 5.3 continued Long haul vehicles.
Hence, HCT based on weight means increasing weight from 64 to 74 ton gross weight
and HCT based on length means increasing the vehicle length from 25.25 to 34m. In
Table 5.1 the increase in cargo capacity compared to a standard vehicle is shown under
baseline vehicle 1 for the weight-based alternative, and shown under baseline vehicle 2
for the length-based volume alternative.
Table 5.1 Cargo capacity comparison among HCT-vehicles used
For general cargo the most common delimiting factor is volume, meaning that if higher
productivity should be obtained benefits are reaped mostly by introducing longer
vehicles. This is also the background for the two cases presented below. The practical
implementation of the measures in the toolbox has been analyzed through two case
studies. One is DB Schenker in their traffic between Göteborg and Malmö presented in
section 5.3. The other case is PostNord in their line haul between Stockholm and Malmö.
This case is presented in section 5.4.
5.3 Lead user: DB Schenker For DB Schenker the general aim of testing HCT in operation is to evaluate if it increases
productivity on a continuous basis meanwhile GHG-emissions are reduced. With regard
to this general aim the HCT is a solution that seems to contribute to these two objectives.
Baseline vehicle 1 Baseline vehicle 3&4
Vehicle Length [m] Width [m] Height [m] Volume [m3] Increase [%] Increase [%]
1. Tractor and semitrailer (16,5 m) 13 2,4 3 93,6 0% n/a
3 & 4. Truck and trailer (25,25 m) 20 2,4 3 144 154% 0%
5. Tractor and duotrailer (34 m) 26 2,4 3 187,2 200% 130%
Cargo carrier capacity

56
It increases cost productivity through more cargo on one transport unit having similar
or lower operational costs as the commonly used 25.25 meter units. The HCT also fulfils
customer demands as well as enable marketing of better environmental performance.
DB Schenker presently operates three different HCT test vehicles:
1. 1 tractor with 2 trailers running a line haul between Göteborg and Malmö.
2. 1 tractor with 2 trailers between Falköping and Skara with containers to and
from the train for the customer Jula.
3. 1 duo wagon operating a line haul between Göteborg and Helsingborg,
This case study concentrates on the duo trailer between Göteborg and Malmö.
The line haul between the terminals in Göteborg and Malmö is operated by the haulier
Kallebäcks Åkeri. The transport starts with cargo pick-up that involves single
semitrailers with a tractor at the shipper’s location. Pick-up also includes terminal
handled cargo through pick-up vehicles delivering cargo to the goods terminal. When
fully loaded the two semitrailers are connected to one tractor at DB Schenker terminal
leaving for the next goods terminal. At the receiving terminal the delivery transport
involves single semitrailers with one tractor each and other distribution vehicles if the
cargo passes the goods terminal.
5.3.1 Challenges for the duo trailer
The temporary permits used for these vehicles only allow traffic at certain stretches.
This limits redundancy, as de-routing is impossible. If there is a need for de-route due to
a traffic accident, or road maintenance this will stop the vehicle. The only way to by-pass
such a hurdle is to call for an additional tractor and decouple the duo trailer vehicle. This
happens a few times per year. Initially there were also time restrictions for these
vehicles on the road. They were not allowed to be out on the road after 6 a.m., which
sometimes stopped the truck and required another tractor. This limit is now eliminated
and the vehicle is operational 24 hours. Overall the vulnerability of these vehicles is
considered the same as for the previous 25.25 vehicles.
The use of larger road vehicles is not in contradiction with internal efforts to increase
rail solutions according to DB Schenker. DB Schenker aims to double their amount of
goods on the rail system and still promote HCT-vehicles. Rail is more cost effective but
timetables are not sufficiently good for some transport relations as there is commonly a
trans-shipment needed. DB Schenker sees these two solutions as complementary: “We
do not see HCT as a competitor to rail”31
Another aspect of HCT vehicles is that shunting increases lead times. When there is a
short distance between terminals the gain is therefore less than for longer distances. At
one terminal the practical space for the shunting is a challenge. If HCT would be allowed
31 Ida Jonsson, Schenker Consulting AB.

57
on a national basis there would be a need for a general overview of all terminals and
their shunting abilities.
Present timetables in the line hauls are tight and there is little room for speed
reductions below allowed speed limits (for example for saving fuels). Between some
terminals this may be an option. However, this specific truck also stops on road based
weight stations in order to calibrate the on-board weight measuring equipment if there
is an indication of a deviation which also means it loses some time.
DB Schenker uses both Scania and Volvo tractors in their operation. The engines for HCT
are Euro VI and one is a Euro V. For line hauls, terminal-to-terminal the average load
factor in Sweden is 80 % by volume. The average gross weight of the vehicle between
Malmö and Göteborg is 59 ton where the maximum allowed weight is 80 ton.
Figure 5.4 The duo trailer vehicle
Since this is a test vehicle its configuration is a bit heavy and has a strong engine effect.
This truck has trailers with a weight of 11 tons each and a heavy tractor. If this type of
vehicles will be legally accepted and thereby commonly adopted there will be further
optimizations on engine effect linked to gross weights in order to save fuel consumption.
An ordinary well-configured tractor and semitrailer with a skilled driver should be able
to reach a fuel consumption of 0.25-0.3 litres per km with this type of light cargo. This
means that the duo trailer need to use less than 0.5-0.6 litres/km of fuel in order to be
environmentally competitive.
5.3.2. Facts on the duo trailer
Figure 5.5 show the stretch of the line haul between Malmö and Göteborg for which the
duo trailer has been tested.

58
Figure 5.5 The line haul route between Malmö and Göteborg used to test the du trailer.
This stretch has a distance of 284 km one way. Below are some additional facts on the
duo trailer test.
1. Cargo weight 25 - 30 ton
2. Cargo volume ~140 m3
3. Staffing One driver
Sincet his is a test of duo trailer vehicle and it is operated in parallel with regular trucks
on this line haul. At present Schenker only have one dolly, that is, only one duo trailer
ability but another dolly was recently approved funding through the HCT research
programme. This should enable one additional duo trailer vehicle.
5.3.3 Conclusions
DB Schenker has during the tests of all HCT vehicle combinations gathered a lot of
practical results and experiences including risks and challenges. If the HCT becomes a
regular vehicle concept DB Schenker will be able to swiftly adapt according to these
experiences. At a given amount of cargo the number of trucks would thereby be reduced
if HCT were implemented at full scale.
From a cost perspective the duo trailers are good solutions. Driver`s salary is a big cost
burden for hauliers. In addition it is very difficult to find qualified drivers. Introduction
of HCT with higher margins will most likely however render a lower market price hence
stabilize the same profit margin as today.

59
The duo-trailer is not more difficult to operate than an ordinary truck and trailer of
25.25 meter. It makes its ways similarly good. Schenker also investigates optional roads
for the future if this concept is approved onwards. Increasing the redundancy ability is
something that requires additional work.
The duo trailer gives significant gains when operating in line hauls between terminals
where there is sufficient amount of goods. By using semitrailers it also enables delivery
and pick-up at customers smoothly.
It should be noted that the HCT concept gives some volume advantages but in
comparison with the 25.25 vehicles the difference is not so profound. A modern 60-ton
truck (25.25m) consumes on average 0.4 liters/km where the presently best vehicle
consumes 0.35 liters/km. From a strict environmental perspective this challenges the
gains from the duo trailer vehicle (see Table 5.2).
Table 5.2 Table of results for Schenker and additional improvement measures
It is obvious that greening long distance road transport consists of three basic elements that must be included in the GHG reduction work:
1. Fuel efficiency of the vehicle 2. Large vehicles being well utilized 3. Low content of fossil coal in fuel
If this can be obtained the GHG-reduction possibilities are significant. In this test the truck is running on diesel, Mk1 B7.
No Type GHG-emissions wtw Unit Savings FC [l/km] FuelLoad factor w
[%]Comments
1 Tractor with a semitrailer 64 g/tonkm 0% 0,3 Mk1 B7 57% Common EU-truck
2 25,25m truck and trailer base 53 " -18% 0,495 Mk1 B7 63% Common Swedish truck
3 25,25m truck and trailer 44 -31% 0,57 Mk1 B7 85% Common Swedish truck, increasing load factor
4 25,25m truck and trailer LBG 13 " -80% 0,57* Biogas 85%Common Swedish truck, increasing load factor
biogas fuelled
5 25,25m truck and trailer LBG + 11 " -83% 0,49* Biogas 85%Common Swedish truck, increasing load factor
biogas fuelled, ecodriving
6 1 duo semitrailer base 42 " -35% 0,39 Mk1 B7 57% Duo trailer base configuration
7 1 duo semitrailer + 33 " -49% 0,42 Mk1 B7 77%Duo trailer base configuration, increasing load
factor, ecodriving
8 1 duo semitrailer LBG + 10 " -85% 0,42* Biogas 77%Duo trailer base configuration, increasing load
factor, ecodriving biogas fuelled
* Dieselequvivalent energy use

60
5.3.4 Sensitivity analysis
Info Box: Sensitivity discussion By operating larger vehicles, well utilized, significant savings can be achieved. If the operator fails to utilize the capacity the gains will turn into increased emissions as larger vehicles consumes more fuel. Regarding the use of LNG the analysis is based on biogas. The LBG (and LNG) configuration requires diesel in combination with gas. In this hypothetical case 25 % diesel fuel. If we had made the calculation based on fossil gas (LNG) there would have been no GHG-emission savings. By using biogas it leads to significant GHG-emission reductions, hence the sensitivity lays in the ability to utilize large vehicles and to swap to fuels with less content of carbon coal. It should be noted that the diesel used contains 7 % of FAME.

61
5.4 Lead user: PostNord
Figure 5.6 The duo trailer operating for PostNord. Note that there are only two axles on
the tractor
This line haul operation between PostNord´s goods terminals in Stockholm and Malmö
is operated by the haulier AlGuns Åkeri, using four duo trailers pulled by four tractors
(Figure 5.6). Previously six 25.25 meters trucks and trailers operated it. The cargo
consists of parcels and some palletized goods that are mainly very light volume goods
but which requires large volume capacity. The gross weight of the duo trailer vehicles is
normally around 40 tonnes per trip.
All tractors are equipped with Euro VI engines and are on the northbound trip running on 100 % HVO32 delivered by Circle K. During 2016 Circle K guaranteed PFAD33 -free HVO, but from 2017 the supplier can no longer assure this.
Southbound the tractors are running on ordinary Mk1 B734. There is no difference on the fuel consumption or other performance deviations for the two types of fuels used in this operation.
The engines in the tractors have a fairly small effect sufficiently adapted to this
application of flat terrain and low cargo weight. The cargo weight is approximately 6
tons per semitrailer. The fuel consumption of this configuration of the duo trailer vehicle
is 0.32 litres per km.
The loading of each semitrailer takes some three hours and is carried out by the
terminals´ staff at PostNord.
32 Hydrogenated Vegetable Oil, HVO. 33 PFAD, Palm Fatty Acid Distillate is a bi-product from the palm oil refinery process. PFAD is used for animal
feed, detergents, and soap and in the cosmetic industry. PFAD can also be used in HVO production. 34 Environmental class 1 diesel with 7 % blend of FAME (Fatty Acid Methyl Ester).

62
5.4.1 Challenges for the duo trailer vehicle
These vehicles must only drive on designated roads where there is no meeting traffic
and are only allowed on three routes in Sweden so far. The hauliers also need a special
speed permit maximized at 80 km/h35.
The vehicles are part of the Swedish HCT research programme and therefore report
experiences to the HCT research programme, for example the total distances, weights
and tonkm achieved for each quarter of a year and each duo trailer vehicle. They should
also be available for potential other studies within the HCT research programme, such
as evaluation of traffic safety effects or other performance studies.
The duo trailer vehicles operate between the Circle K gas station outside Malmö, 2.5 km
away from the PostNord terminal to Södertälje. The four semitrailers are pulled to this
location by four tractors. Thereafter they are connected and pulled to Södertälje by two
tractors. In Södertälje the road trains are disconnected and a tractor each pulls the two
semitrailers to the PostNord goods terminals in Veddesta and Segeltorp in the
Stockholm area. In the simultaneously on-going southbound traffic the operation is
inverted (see Figure 5.7).
Figure 5.7 The route Malmö – Stockholm.
5.4.2. Transport facts
35 Without this special speed permit they are only allowed to operate at maximum 40 km/h.

63
Distance PostNord to Circle K 2.5 km
Distance Malmö to Södertälje: 580 km
Distance Södertälje to Veddesta:
66 km
Distance Södertälje to Segeltorp:
23 km
Transport schedule per day
2 semitrailers northbound from Malmö to Veddesta
2 semitrailers northbound from Malmö to Segeltorp
2 semitrailers southbound from Veddesta to Malmö
2 semitrailers southbound from Segeltorp to Malmö
Cargo weight: 6 – 7 ton/trailer
Load factor: Trailers are full by volume in both directions
Staffing Four long distance drivers and four pilots for local transport
5.4.3 Conclusions
PostNord and the haulier AlGuns Åkeri have been operating this line haul with four duo
trailer vehicles since July 2016 and will continue until the permit expires. In Sweden the
modification of the Directive 96/53/EC for HCT seem to prioritize 74-ton vehicles rather
than 34-meter road trains at present. The existing temporary permit for this operation
is therefore likely to expire after 2017, if nothing changes.
When starting the new solution there were no introduction hurdles. Overall the
introduction was equally easy as starting any other new transport operation. The
operation now runs smoothly and there have not been any specific incidents, major
breakdowns or complaints. The only minor issue is that these trucks arriving in the
night disturb sleeping drivers at the Scania parking lot in Södertälje. Since there are no
time restrictions on transport activities at this space the other drivers have to accept
this small disturbance.
The only technical problem thus far is frozen brakes at one occasion on the last
semitrailer due to very low temperatures, but this could just as well have happened on a
single semitrailer. The duo trailer vehicles work well and the only different operation
compared to previous solutions is the shunting for connecting and disconnecting trailers
in both ends of the transport.
If this solution was commonly accepted on all major roads, it is for similar types of light
and volume cargo a very efficient configuration that is worthwhile scaling up.
Introducing renewable fuels, increasing load factor, and potentially introducing
electrified roads for this type of vehicle could accomplish a quantum jump towards fossil
free road transport. See Table 5.3.

64
Table 5.3 Table of results for PostNord.
Obviously the economic productivity is solid as there is only one driver per duo trailer
vehicle. The number of long distance drivers is today 4 in comparisons to previous six
long distance drivers for the same service. The investment cost for the tractor and
semitrailers is considered to be lower than for a similarly configured 25.25 m vehicle. In
addition, the tractor and duo-trailer adds flexibility since it is a modular set up where
tractors and semitrailers can be used in a range of other applications.
Impact on the traffic safety is the most important performance issue for HCT that has
been much discussed. In this solution there have been no reported traffic safety
incidents and not more than in the previous set up operating with more vehicles in the
traffic i.e. higher likelihood of incidents and accidents.
PostNord have not yet communicated gains from this new and more efficient transport
solution. This is likely a tactical decision as it might disappear after the end of 2017. If it
is prolonged this could be a good marketing activity. According to PostNord this solution
MK1 B7 CO2e wtw [kg/l] 2,648
HVO 100 % CO2e wtw [kg/l] 0,3
Initial baseline solution Journeys [n] Distance [km] FC [l/km] FQ [kg/l] Trucks [n] Working days [n] GHG [ton p.a.] Saving [ton p.a.] Saving [%]
Malmö - Segeltorp 2 605,5 0,4 2,648 3 250 962
Malmö - Veddesta 2 648,5 0,4 2,648 3 250 1030
Total 1992 0 0%
New solution Journeys [n] Distance [km] FC [l/km] FQ [kg/l] Trucks [n] Working days [n] GHG [ton p.a.] Saving [ton p.a.] Saving [%]
Postnord - Shunting 2 2,5 0,32 2,648 8 250 8
Malmö -Södertälje 2 580 0,32 2,648 4 250 983
Södertälje - Segeltorp 2 23 0,32 2,648 4 250 39
Södertälje - Veddesta 2 66 0,32 2,648 4 250 112
Total 1142 850 -43%
Present solution Journeys [n] Distance [km] FC [l/km] FQ [kg/l] Trucks [n] Working days [n] GHG [ton p.a.] Saving [ton p.a.] Saving [%]
Postnord Mö- Shunting yard 1 2,5 0,32 2,648 8 250 4
Malmö -Södertälje 1 580 0,32 0,3 4 250 56
Södertälje - Segeltorp 1 23 0,32 2,648 4 250 19
Södertälje - Veddesta 1 66 0,32 2,648 4 250 56
Veddesta - Södertälje 1 66 0,32 2,648 4 250 56
Segeltorp - Södertälje 1 23 0,32 2,648 4 250 19
Södertälje - Malmö 1 580 0,32 2,648 4 250 491
Shunting yard- Postnord Mö 1 2,5 0,32 2,648 8 250 4
Total 706 1286 -65%
Further development Journeys [n] Distance [km] FC [l/km] FQ [kg/l] Trucks [n] Working days [n] GHG [ton p.a.] Saving [ton p.a.] Saving [%]
Postnord Mö- Shunting yard 1 2,5 0,3 0,3 8 250 0
Malmö -Södertälje 1 580 0,3 0,3 4 250 52
Södertälje - Segeltorp 1 23 0,3 0,3 4 250 2
Södertälje - Veddesta 1 66 0,3 0,3 4 250 6
Veddesta - Södertälje 1 66 0,3 0,3 4 250 6
Segeltorp - Södertälje 1 23 0,3 0,3 4 250 2
Södertälje - Malmö 1 580 0,3 0,3 4 250 52
Shunting yard- Postnord Mö 1 2,5 0,3 0,3 8 250 0
Total 121 1871 -94%
Further baseline development Journeys [n] Distance [km] FC [l/km] FQ [kg/l] Trucks [n] Working days [n] GHG [ton p.a.] Saving [ton p.a.] Saving [%]
Malmö - Segeltorp 2 605,5 0,35 0,3 3 250 95
Malmö - Veddesta 2 648,5 0,35 0,3 3 250 102
Total 198 1795 -90%

65
should reflect the future of how to carry out lightweight long distance goods transport
by road in Sweden. How the EU perceives this is of course another issue.
Overall, environmental gains are substantial as can be seen in Table 5.3 even though a
modern 25.25 m vehicle would reduce emissions to similar levels if using the same type
of fuel. Still there are some additional improvements that can be done in the present
solution. If spoilers would be applied on the last trailer the fuel consumption could go
down by some 6-7 % to 0.336 l/km on a yearly basis. Another politically challenging
improvement would be to add one additional semitrailer to the duo trailer (triple
trailer). The gross weight would in this specific transport solution be 55 tonnes which is
within existing weight regulations. To introduce such a solution is however perceived as
impossible from a political perspective.
From this assessment it is evident that the potential total savings of CO2e of the duo
trailer is considerable (-94 %) (Table 5.3) and would be able to meet present Swedish
reduction targets (-85 %) for 2045 already today.
5.4.4 Sensitivity analysis
Info Box: Sensitivity discussion By operating larger vehicles, well utilized, significant savings can be achieved. If the operator fails to utilize the capacity the gains will turn into increased emissions as larger vehicles consumes more fuel. Regarding HVO, the analysis is based on 100 % HVO when used. In this case data comes from the fuel supplier that have calculated performance in accordance with the Renewable Energy Directive. If the instructions on assessment of fuel GHG-performance would change or if availability of this fuel would go down it would inflict on the performance. Using HVO leads to significant GHG-emission reductions; hence the sensitivity lays in the ability to utilize large vehicles and to swap to fuels with less content of carbon coal. It should be noted that the diesel used contains 7 % of FAME. The main concern for this HVO is availability of sufficient amount of biomass that does not interfere with other needs. If demand increases this would further amplify these challenges.
5.5 Discussion: Core issues from the Road cases The main enabler for using larger road vehicles is sufficient cargo flows in both
directions. Balancing goods flows is a major challenge when organizing transport
logistics. About 50 % of all European northbound railway cargo wagons travel empty37.
Meanwhile significant freight volumes are transported in parallel by road that emit
more CO2 and are less sustainable compared to the railway system38. Thus, we have
36 In good conditions this low fuel consumption is feasible already today without any further technical
requirements. 37 Trafikanalys (2011). 38 McKinnon (2010).

66
more sustainable railway transports travelling empty side-by-side with less sustainable
half-empty road transports. Obviously, more balanced flows from increased fill-rates
and reduced empty transports utilizing more sustainable modes of transportation are
desirable.
The two cases based on a baseline road transport indicates overall GHG potentials as
shown in Table 5.4:
Table 5.4 Potential of GHG savings in the road case
According to a study39 by the Faculty of Engineering LTH at Lund University (Lunds
Tekniska Högskola), more HCT vehicles may risk a shift towards more road transport
solutions from rail and sea. Researchers at LTH therefore argues that there is a need to
introduce market-based mechanisms that in parallel incentivise rail based transport
even though climate performance of road transport improves significantly by HCT. This
must also be viewed in the perspective of growing transport volumes in general
according to the same study. The study by LTH claim that HCT introduction at large
scale is beneficial to society but have a risk of a lock-in situation based on an increasing
share of less sustainable road transport solutions.
Building compatible modular system is one item. If intermodality of all semitrailers
were ensured this would enable highly efficient transport logistics using road and rail in
combination.
According to the European Commission SAIL-report (ICT-System Addressed to
Integrated Logistic management and decision support for intermodal port and dry port
facilities)40, only 3 % of today’s trailers within the European community can be lifted by
a crane on to a railway wagon and thereby utilize combined rail and road services.
Moreover, this means lacking compatibility, which in turn increases transport logistics
planning costs as only few trailers can operate freely in this respect. On the other hand
these semitrailers would become heavier which would increase their fuel consumption
on the roads. One way to overcome the transhipment problem is to implement certain
railway wagon-based equipment, some which is described in the toolbox. The Reach
Stacker and Mega Swing are two such measures shown in Figure 5.8.
39 Adell et al, (2016). 40 http://cordis.europa.eu/result/rcn/164183_en.html. Accessed 2017-03-05.
Solutions CO2e wtw index Savings [%]
Baseline, tractor and trailer conventional fossil fuel based propulsion 100 0
HCT, 25.25 meter or 34 meter vehicle conventional fossil fuel based propulsion ~ 65 35%
HCT, 25.25 meter or 34 meter vehicle conventional bio fuel based propulsion ~ 20 80%
HCT, 25.25 meter or 34 meter vehicle optimized bio fuel based propulsion ~ 10 90%
Semitrailer by electric train running on green electricity ~ 0,8 99,2%

67
Figure 5.8 Transshipment of semi-trailer through cranes (Reach Stacker) or the Mega Swing wagon.
In this section we have explored three activities in the Swiftly Green toolbox:
Larger vehicles through amendment of Directive 96/53/EC, where the potential
cost and emission savings are substantial.
Increasing load factor through a collaborative business models (FTL and LTL),
where our cases involved two large transport operators co-loading the cargo of
several shippers. Cargo volumes in both directions, that is, achieving sufficient
load factors is a pre-requisite for larger vehicles.
Using alternative fuels by introducing LNG-based propulsion indicates neglectable
climate gains as this fuel is based on fossil gas. If the gas is based on biomass it
has a substantial reduction potential. Another drawback is that a compression
engine requires a certain fraction of diesel for ignition. Since gas fuels are
incompatible with fluid fuels the study also looked into HVO as an optional
renewable fuel that is easier to introduce, as it is fully compatible with present
diesel fuel. This fuel indicates very high saving potentials.
General conclusions from the road use case are:
From a cost saving perspective the duo trailer vehicle provides a better solution
as 100 % more volume cargo can be loaded in comparison to the Tractor and
single semitrailer and 30 % more volume cargo can be loaded in comparison to
the 25.25 m vehicle meanwhile it only requires one driver. Equipment also seems
to be less expensive and is useful in other applications.
Coordination of cargo flows is needed for larger HCT-vehicles in order to ensure
a sufficient level of utilization.
Fuel efficiency per cubic metre increases by 10% for a 25,25m vehicle in
comparison to a tractor and single semitrailer. The tractor and duotrailer
increases fuel efficiency by more than 30% with the same baseline.
Smooth introduction of renewable fuels need to fit into the present propulsion
systems
The main concern of this solution would be if it were introduced large-scale. Its
dependence on a huge amount of biomass that does not exist at present becomes
a significant challenge. For smaller markets and in delimited use it can pave the

68
way for a transition towards vehicles that can operate on renewable fuels.
However, large scale transition towards renewable based propulsion requires
many other and parallel solutions.
Traffic safety is not significantly affected by the duo semitrailer.
Functionality of services is fairly similar. One advantage may be that the semi-
trailer can be delivered to the shipper early in the day for loading and picked up
in the afternoon.
Quality is not influenced since this contains the same handling and service.
Minor operational challenges occur when connecting and disconnecting the road
train.
The concluding remark is that we presently seem to have relevant knowledge and tools
to de-carbonize the long-haul transport in a small scale. The question and real challenge
is how to make it happen large-scale in a sustainable way.

69
6 The Railway Use Case
6.1 Current issues for the railway system The current railway system in Sweden is the result of a process of deregulation that has
been on going since the late 1980s. At the turn of the millennium a number of new
operators won contracts for freight and the passenger traffic followed soon after.
An important event was when the Swedish national rail SJ (Statens Järnvägar) was
divided and made into a number of separate companies in 2001. These were all separate
and independent and this was a step in the process of de-regulating the sector in
Sweden. The result of this was that the old national rail was separated into several parts.
SJ AB became a passenger operator; Green Cargo a freight operator/3PL as well as
operator of shunting yards and Jernhusen was given the ownership of railway stations
and some other buildings. The rail infrastructure was made the responsibility of
Trafikverket. Maintenance was separated into SweMaint and EuroMaint and cleaning
services was outsourced to ISS TraffiCare. The operation of the old IT-department was
named Unigrid AB (the company has since been bought by EDB Teamco A/S and divided
by its owners). The de-regulation of the railway system did not only split up the old
national rail monopoly, more importantly it enabled new actors to enter the market for
rail services in general and – of special interest here – to rail freight using the Swedish
railway infrastructure. ScandFibre Logistics AB (hereafter SFL) is one such actor.
One major issue in this de-regulated system has to do with the efficient management
and coordination of the different parts of the railway system. Allocating resources for
maintenance and infrastructure investments, digitization, and management and control
of the trains are perennial issues that are continuously discussed and worked on. This
requires many actors to converge and cooperate, for example Trafikverket
(infrastructure maintenance), Green Cargo (shunting yard management and freight
operations) and SFL (managing and controlling freight flows).
Another major issue concerns improved integration across infrastructure, 4/3PL actors,
operators, freight forwarders, freight owners and terminal operators in order to provide
seamless high quality freight services to customers, nationally as well as internationally.
6.1.1 Lead user: ScandFibre Logistics (SFL)
ScandFibre Logistics AB (hereafter SFL) is a fourth-party logistics (4PL) provider41
offering its customers a product that enables them to ship cargos across Europe in an
economically efficient and sustainable way by utilizing the existing European railway
infrastructure. The product is a dedicated railway-service, which is constantly under
41 Cezanne (2015); Hertz (2003); Jensen (2010).

70
development to become increasingly efficient and sustainable. Deriving its name from
the latest European rail timetable shift the current generation of the service is called
‘Rail 17’. The SFL railway-service comprises a network of terminals, routes, operators,
and wagons organized to become a packaged service offer. These types of dedicated
railway services are not uncommon in the railway sector and other examples exist as
well. It draws on the common infrastructure and knowledge on organizing of efficient
and balanced flows to create effective logistical systems. Balancing flows and managing
constant changes and adapting to varying conditions are recurrent issues in these
systems.
For SFL, the creation and realization of its rail system involves considerable organizing
as well as cooperation with a large set of independent actors, such as infrastructure
owners, train operators, wagon rental companies, shunting companies, terminals,
forwarders and – not least – the shippers.
The main characteristic of the rail system in its current version of Rail 17 is formed by
the requirements of one dominant group of shippers. These are paper mills in Sweden
using the system to transport their products to customers in Europe or via European
deep-sea ports to customers in other parts of the world. SFL is a wholly owned
subsidiary to one of the largest Scandinavian paper producers – BillerudKorsnäs. While
SFL enjoys considerable autonomy and the flows in Rail 17 also comprise products from
two other paper producers, benefits from further integration with the owner is
recognized. In a sense, SFL could be described as the outsourced function of railway
shipping from three main paper producers: BillerudKorsnäs with the majority of the
flow of the system, Mondi, and Smurfit Kappa. The mission of SFL is to offer the three
paper producers competitive and sustainable transport solutions to terminals in Europe.
Table 6.1 offers some characteristics of SFL and its current set-up in Rail 17.
Table 6.1 Characteristics of the railway service of SFL
Annual turnover in 2016 Approx. 1 000M Sw.kr.
Number of employees Approx. 25
Total number of wagons in pool Approx. 1 400 – 1 700
Average load factor Southbound > 95%
Average load factor Northbound 50-60%
Number of weekly departures in system 300
Annual volume of cargo in system 2,5 M ton
Number of mills served 7
While the focus of this report is on the Swedish part of TEN-T GK3 ScanMed corridor the
Rail 17 system aligns well with the ScanMed rail freight corridor (RFC) over the stretch
from Sweden to Northern Italy and the flows in Sweden are of course channelled further
into the Continental European section and vice versa.

71
6.1.2 A dedicated railway system
SFL represents an actor organizing a dedicated railway system using the current rail
infrastructure as a basis. SFL organizes the Rail17-system and have control mechanisms
in place in terms of contracts and deals with the suppliers of infrastructure components
to form a coherent railway-system. Rail 17 comprises around 30 terminals and/or
shunting points and stations across Europe from Northern Sweden to the South of
France/North of Spain (see Figure 6.1). The Rail 17 system is not static, but continuously
adapted to the honed supply strategies of BillerudKorsnäs based on its customer
structure, production streamlining and not least to the ability to attract return cargo.
Figure 6.1 The Rail 17 core network. Source: ScandFibre Logistics AB, internal records.
Rail17 is based on a closed wagon pool, which means that neither northbound nor
southbound wagons ever leave the system. As southbound flows are defined by the
paper producers in Sweden and the whole Rail 17 system is designed based on these
flows, the major issue for SFL is to channel northbound flows to create and manage the
balance in this system to increase overall efficiency.
The railway network ends on the border between France and northern Spain because
the Spanish railway system has a different track width as compared to the rest of Europe
creating a technical interoperability obstacle. The French system stretches to some
border terminals such as Irun. It should be noted that the network charted in Figure 6.1

72
is incomplete and do not show all details and terminals in the system. It is used only as
an illustration.
6.2 Issues for SFL The main issue for SFL is to organize rail wagons with loads in order to enable large-
scale rail transport with high productivity for its customers and owners. To this end SFL
use a combination of whole trains when possible on core relations and wagonloads to
balance flows and cater to customer needs. The aim is to create circular flows in Rail 17
in which economic feasibility and improved productivity are the norms but also where
the environmental effects are the greatest. A major issue in this circumstance is the
ability to find, create and attract return cargo on the existing relations that SFL already
have as a result of serving customers to BillerudKorsnäs across Europe.
Taking the current set-up of the Rail 17 system of SFL as a point of departure with fill
rates of approximately 100 % southbound and around 50-60 % northbound, creating
effective and high capacity solutions on the core stretches becomes crucial. This means
that longer and heavier trains (LHT) is an important issue. Indeed, SFL currently use
730m trains on its core stretch on the relation Hallsberg – Malmö and ponders the
potential of perhaps operating 2x750m trains in the future. These trains are operated in
collaboration with Hector Rail using modern TRAXX locomotives (see Figure 3.3). One
TRAXX locomotive can pull a whole LHT, as opposed to the older Rc4 locomotives that
are not strong enough to pull an LHT alone, but are then used in pairs. For some very
long train combinations multiple locomotives are used (see Figure 6.2.)
For SFL, the longer heavier trains are a complement to the standard 630m whole trains
and wagonloads operated by Green Cargo. For SFL, continuously working with the
whole trains and wagonloads to optimise load factors and train utilization is a recurrent
tactical issue.
Another important issue is the digitization of the railway industry. “We are developing
our business model by focusing on wagon-control and the opportunities that digitization
opens up for.”42 These opportunities represent a major shift in the sector according to
SFL representatives. This shift is driven by digitization paired with other megatrends
such as globalisation and urbanisation.
From this we identify the following measures from the toolbox as relevant for this case:
- Marathon - Longer and heavier trains (LHT)
- Digital enquiry form for freight wagons (RFID chip)
- Corridor section management
42 Interview with SFL logistics developer. Personal Communication.

73
- Arrival estimation for freight vehicles (freight vehicle tracking devices (GPS))
Measure 1 relates to the issue of LHT, and measures 2-4 to the issue of digitization of the
railway. The feasibility of these measures in terms of TRL and MRL are shown below in
Figure 6.2.
Figure 6.2. Assessment of TRL and MRL of the four measures described in the case.
SFL utilize LHT in its Rail 17 system. Longer trains are related to heavier (hence the
expression longer and heavier trains – LHT) as illustrated by Figure 6.3 below.
Figure 6.3 The relationship between train weight, length and rolling stock in LHT.
Source: CER: Business Cases for a Primary European Freight Network43.
43 http://www.cer.be. Accessed 2017-03-07.

74
Figure 6.3 illustrates the interplay between weight and length allowed by EU-
regulations. The x-axis describes the length of the train and the y-axis the maximum
train weight. The solid line marked ‘2’ in the figure illustrates the link between train
weight and train length in terms of the upper boundary of the infrastructure on total
train weight. The dotted horizontal line marked ‘D’ in the figure illustrates the weight
limit to the rolling stock due to traction, breaking and coupling issues of the trains,
hence representing a cut-off delimitation. In Sweden this is a real issue due to the use of
break-rules that are not synchronized with other parts of Europe meaning that even if
trains of a certain length and weight can travel across some routes through Europe
based on European break-rules, they cannot continue in Sweden because Swedish
break-rules are different. This means that even if the infrastructure may clear a LHT,
breaking issues or traction problems (for example on hilly and snowy routes) may cause
restrictions.
Efficiency can principally be increased in three ways: 1) by investing in infrastructure so
as to allow higher axle weight. 2) by investing in increasing the length of the trains, and
3) by investing in upgrades to the rolling stock. Real efficiency improvements would
seem to require concerted investments in all three ways simultaneously. This is a
challenge because different actors in the system are responsible for the investments in
infrastructure, longer trains and on the rolling stock, respectively. Investments in LHT
therefore require considerable collaboration among these actors – in this case between
the Swedish Transportation Administration being responsible for the infrastructure and
break-rules etc.,
In addition, the complexity of the system means that it is never only about longer and
heavier trains – it is also about orchestrating circular flows and efficient utilization of
available infrastructure including increased load factors and larger units.
6.2.1 Longer and Heavier Trains (LHT)
Longer and heavier trains (LHT) can be seen as a type of High Capacity Transport (HCT)
for railway. LHT relates not just to the assembly of wagons and loads – it also affects
infrastructure. For example, routes that longer and heavier trains traffic must have
meeting-points for longer trains, and bridges etc. must be adapted to the increased
exposure to weight, etc. Figure 6.4 shows a principle graphic of train lengths used in the
ScanMed RFC. While current Swedish break-rules enable 880m trains, in practice this is
impossible due to passenger traffic restrictions on the tracks.

75
Figure 6.4. Train lengths used in some parts of the ScanMed RFC.
Adapted from Fröidh (2013: 46)44.
A problem for SFL is the shunting yards in Hallsberg and Malmö. For example, the
shunting yard in Hallsberg was originally designed with wagonloads in mind, which
means that the design and layout of the yard is adapted to sorting single wagonloads
from many incoming trains to build new whole trains. The logic is that of breaking up
trains from multiple origins and re-assign individual wagons to a new train in which all
wagons going to the same destination is collected.
With even longer trains this problem increases and even if longer trains are more
efficient en route, issues at shunting points creates inefficiencies and reduces the utility
of LHT. Yet, SFL currently have two departures daily with longer trains on the route
Malmö – Hallsberg. From the Swiftly Green toolbox, the measure called Marathon is a
measure identified as the most relevant for this issue in this case. In Marathon, tests
were performed in France with trains up to 1 500 meter of length with positive results.
However, both legal and infrastructure issues limits its transferability. The 730-meter
trains of SFL and its ideas on 2x750m trains are interesting local applications of this
measure which we focus on in this project.
6.2.2 The digitization of the railway transportation system
When it comes to the digitization of the railway, this is a concrete issue emphasized in
the SFL case involving GPS and RFID-tagging of freight wagons in the Rail 17 system.
Digitizing means to create a numeric representation of a phenomenon, which facilitates
digital storage, processing and transmission as it “allows information of all kinds in all
formats to be carried with the same efficiency and also intermingled”45. Digitization
represents a great potential for the railway and is something that waits around the
corner according to SFL. Drawing on the benefits of the GS1-standard46 for cargo and
information flows, SFL use this to drive the digitization. The global standardization that
GS1 enable provides increased control of warehousing and transportation for both
buyers and sellers and supports SFL in its endeavour to provide timely cargo
information to its customers.
44 Source: Fröidh (2013). 45 McQuail (2010): p. 39. 46 http://www.gs1.org. Accessed 2017-03-23.

76
For SFL, digitization originates from a need to increase the monitoring capability of the
freight wagons in the system and they use the GS1-standard as a basis for collecting and
managing information. Due to the distribution of ownership and use of the wagons
between Transwaggon (TWA) and SFL they collaborate on this project and shares the
initial investment costs. For tactical reasons, only GPS-trackers are mounted on the
wagons. This is a decision made primarily by TWA. It should be noted that Trafikverket
currently invests in installations of RFID-readers in the Swedish railway system.
Currently 300 readers have been installed (February 2017).
The GPS-trackers mounted on the wagons enables SFL to get more precise up-dated data
on wagon positions in the Rail 17 network. For rolling stock wagons data is sent every
30 minutes as well as at starts and stops. The trackers are equipped with accelerometers
so that they can sense chock as well, thus detecting when collisions occurs and send the
position to SFL. For stationary wagons data is sent every 24 hours. During these
conditions of use the batteries in the trackers are estimated to last for circa 5 years. Data
transmission intervals can be changed remotely and depending on the configuration
profile of the trackers, batteries are estimated to last up to 6 years. It is a trade off
between how often data are sent and how long the battery lasts. Figure 6.5 shows the
SFL GPS project installation dashboard as per March 2017.
Figure 6.5 SFL GPS project installation dashboard. Screenshot as of 2017-03-15.

77
The monitoring capability that this provides is useful for SFL because it means that they
can tell the difference between a wagon waiting to be shunted for example in Modena
and a wagon waiting at a terminal in Modena to be registered as “arrived”. Without this
monitoring capacity, SFL may know that the wagon is “somewhere in Modena” but not
exactly where. This, in turn impacts SFL’s ability to more efficiently estimate and predict
wagon positions and arrivals and plan the routes of northbound freights. Implementing
a digitized track-and-trace system of freight wagons enables SFL to improve its offering
to customers as well as to increase overall efficiency of the system.
From the Swiftly Green toolbox, two measures can be identified as having some
relevance to this issue. First, the measure involving digital enquiry form for freight
wagons (RFID chip) is a relevant measure. Second, the measure involving arrival
estimation for freight vehicles (freight vehicle tracking devices – ‘FVTD’) is also a
relevant measure. Both are evidently relevant in relation to this issue in this case and
will be discussed more in detail below.
6.3 Measures and performance assessments Given the core issue of the use case, which have been broken down into two concrete
issues, we have identified a number of measures from the toolbox that holds promise in
relation to these particular issues. In this section we discuss these measures in relation
to the case and then report on the performance assessments of their implementation.
Adhering to the methodology adopted in this project, we first identify a baseline
scenario. This is a scenario reflecting the current situation or the situation in which no
measures have been taken. This scenario functions as the benchmark comparison to the
performance assessment of a potentially implemented measure. We then evaluate
effects on a micro- as well as macro-level scale of implementation of each measure.
6.3.1 Longer Heavier Trains
The implementation of the Marathon measure in terms of LHT in the use case is
analysed departing from a base-line scenario. The baseline scenario is that of a standard
length train on the relation Hallsberg – Malmö. With this as a baseline, effects of
implementing LHT is evaluated according to the following:
- Current SFL Scenario: The current SFL scenario is drawn from SFL’s Rail 17 set-
up in which LHT serve the relation Hallsberg – Malmö twice a day all week
(Interview SFL Marketing Manager). These trains are 730 m (including
locomotive) as compared to Swedish standard length of 630 m.

78
- Expanded SFL Scenario: This scenario assumes three LHT a day all week, which is
assessed to tangent the maximum volume required for SFL in its current Rail 17
set-up. More departures would probably not yield any more efficiency increases –
there is likely a plateau in demand for three departures a day.
As a complement to this – and for reasons of comparison – the GHG-emissions of the
Current SFL Scenario and the Extended SFL Scenario are compared in relation to the
emissions of equivalent volumes of freight using trucks in a road transport mode.
For both scenarios, consequences for GHG-emissions savings will be calculated using the
base-line scenario as benchmark and in comparison also to road transports. Effects are
evaluated on both a micro-level and macro-level scale of implementation.
6.3.2 Analysis of LHT
Micro-level assessment
Calculations for the micro-level assessment of the SFL use case are based on a number of
assumptions. These assumptions are summarized in Table 6.2.
Table 6.2. Assumptions made in the calculations of the SFL use case
Electric train calculation Unit 630 730 750
Max gross weight [ton] 2058 2418 2688
Cargo capacity [ton] 1320 1560 1740
Gross weight empty [ton] 738 858 948
Load factor South [%] 100% 100% 100%
Load factor North [%] 60% 60% 60%
Total round-trip gross weight [ton] 3588 4212 4680
Net weight per round-trip [ton] 2112 2496 2784
Electric distribution losses [%] 10% 10% 10%
CO2e wtw, ‘Bra miljöval’ [g/kWh] 8 8 8 Electric consumption per vehicle km vkm, including distribution losses [kWh/vkm] 25 28 29 Electric consumption per net-tonne km, including distribution losses [kWh/tkm] 0,024 0,022 0,021
CO2e per vehicle km [g/vkm[ 203 220 232
CO2e per tonkm [g/tkm[ 0,19 0,18 0,17
Based on the preconditions described in 6.3.1 above where trains are traveling on flat
terrain we look at the three scenarios with three train lengths: Baseline Scenario 630 m
with a gross weight of 2 058 ton; Current SFL Scenario 730 m with a gross weight of 2
418 ton; and Expanded SFL Scenario 750 m with a gross weight of 2 688 tons. The gross

79
weight is calculated based on one locomotive (derived from case data) with a gross
weight of 78 ton and the sum of 22, 26 and 29 wagons with a gross weight of 90 ton for
each scenario respectively. Load factors are based on case data informing us that it is
close to 100 % southbound with paper and on average around 55-60 % northbound
with return cargo.
The electricity used in Sweden is green, produced from renewable sources labelled “Bra
Miljöval” emitting 8 g CO2/kWh47. With an electricity consumption of 26, 28 and 30 kWh
per vehicle km for 630-, 730- and 750-meter trains respectively; the electricity
consumption per net-ton/km becomes 0.024, 0.022 and 0.021 kWh respectively. This
yields 0.19, 0.18 and 0.17 CO2/tonkm in GHG-emissions for 630-, 730- and 750-meter
trains respectively. (Table 6.2).
Given these assumptions, the total annual GHG-emissions for the three scenarios are
calculated based on the following input variables. Each year comprise 365 working days
and each working day enables two journeys on the relation Hallsberg – Malmö round-
trip. Table 6.3 shows the results of the calculations.
Table 6.3 Parameters and annual GHG-emissions and volumes for the scenarios for LHT
Scenario Lengt
h [m]
Wagon
s [n]
Journey
s [n/d]
Total GHG
[ton CO2e]
Total
volume
[ton]
Emission/ton
[g CO2e/ton]
Baseline 630 22 2 142 1 542 000 91.83
Current SFL 730 26 “ 153 1 822 000 84.19
Expanded SFL 750 29 “ 162 2 032 000 79.57
These results show that using LHT emits more GHG-emissions in total if we assume that
the capacity is absorbed by customer demand, which our case informs us it would.
However, LHT also increases the total goods capacity and enables more goods to be
transported with comparably small increases in GHG. The annual GHG-emissions per ton
goods transported in the system decreases from 91.83 g/ton to 84.19 g/ton to 79.57
g/ton when going from baseline 630-meter trains to current SFL 730-meter trains to a
future expanded scenario with 750-meter trains. Thus, this is a classic example of scale
effects where an implementation of the expanded scenario would produce an annual
decrease of the GHG-emissions per ton with 12.36 g. This may sound like a small
number but with increasing volumes the scale effect makes it more substantial.
Nevertheless, the net effect of LHT when compared to the baseline is quite small. This is
because we compare an already very sustainable low-emitting rail solution with another
equally sustainable low-emitting solution. Comparing rail with rail necessarily results in
this. The effect one can have is primarily a result of the scale effect. However, as we shall
47 www.transportmeasures.org. Accessed 2017-03-07.

80
see at the macro-level assessment, when comparing this railway solution with
alternative road solutions we get a more nuanced picture.
Macro-level assessment
In the following we present the results of the calculations of effects from the
implementation of LHT on a wider scale among all (or most) operators in the Swedish
part of the corridor on the relation Hallsberg – Malmö.
The assumptions for the railway solution are the same as for the micro-level scenario
with the difference that we here look at only the current SFL scenario with 730-meter
train lengths. We further assume that 730-meter LHT yields the same results for all
operators as for SFL in the micro-level analysis.
The SFL use case informs us that he flows of SFL in the ScanMed RFC constitute 20 % of
the total flow of the corridor. If we assume a linear relationship between SFL as a lead
user of LHT and the corridor as a whole, the total LHT activity in the corridor is that of
five times that of SFL’s current activity. This means that in the Swedish part of the
ScanMed RFC there are 10 daily round trip 730-meter LHT departures on the relation
Hallsberg – Malmö that is 477 km long.
It is worth pointing out with clarity here that this does not, however, mean that this is
the total capacity of the Swedish part of the corridor as a whole. This is an important
caveat. What we estimate here is a potential level of utilization of LHT in the
Swedish part of the ScanMed RFC that can be considered reasonable and realistic
based on the rail use case using the lead-user SFL as a benchmark. The results
from this scaling to macro level must be used cautiously and with care and should
not be considered definitive. Nevertheless, they do provide an indication of what a
scaled implementation of this measure in the Swedish part of the corridor could
entail, given that the assumptions made here holds true. We strongly recommend
readers to evaluate the validity of these results in relation to their respective setting.
One way to do so is to compare the assumptions made here to those made by the reader
or made in the reader’s setting to see whether they hold true also for this context.
Importantly, we disregard from technical infrastructure obstacles such as limitations in
break-tables, scheduling, meeting points, shunting yards, etc. but merely consider this to
be the total potential volume of the corridor.
According to our calculations, this would correspond to a total annual volume of goods
transported by LHT in the corridor amounting to 9 110 400 tons and a total annual GHG-
emission of 767 ton CO2e.
As we have seen in the analysis of the effects of using longer and heavier trains above,
the effect of this increase is relatively small if the increase in volumes transported by

81
LHT comes from other train-solutions (e.g., wagonloads or whole 630m trains). But if
these flows are attracted from road alternatives, then the effects are significant. In a
scenario with an estimated additional 7 288 320 ton annually being transported on LHT
in the Swedish part of the ScanMed RFC it is difficult to estimate where these flows
would come from: if they are shifted from road or from other forms of rail. We have
therefore made calculations on various levels of shifts as is shown in Table 6.4.
Table 6.4 shows the distribution of transport activity and GHG-emissions from five
levels of shifts from road to rail utilizing LHT. For this calculation we have assumed the
road-alternative being of the same length as for rail (477 km), and that road vehicles
being used emits 65 g CO2e/tonkm which is a standard Euro VI engine emission figure
moderated by average green driving techniques. The corresponding emission figure for
rail is 0.18 g CO2e/tonkm. Obviously the difference between rail and road is huge –
especially in Sweden with access to sustainable electricity from renewable sources.
However, this is neither surprising nor anything new and it seems as if comparing rail to
road is unrealistic for a number of reasons. First, the reasons to transport cargo by road
are motivated because of the requirements and the service levels required are
impossible for the railway to cater to. Second, rail is always complemented by other
transports the first/last mile. However, if the rail system can expand its current capacity
and provide quality services, then some of the road-volumes can be shifted from road to
rail in the core stretch of the corridor.
Given the parameters discussed above in terms of the corridor length (477 km) and
CO2e-emmissions from road and rail (65 and 0.18 g/CO2e/tonkm, respectively) Table
6.4 shows the distribution of CO2-emissions among the road and rail options in six
scenarios and a baseline scenario.
Table 6.4 The distribution of annual cargo volumes and GHG-emissions between road
and rail in the varying scenario options
Scenario Option
Total estimated volume in corridor
Rail Road
Share of added
volume Rail cargo [ton p.a.]
CO2e [ton p.a.]
Share of added
volume Road cargo
[ton p.a.] CO2e
[ton p.a.]
Scenario 1 9 110 400 100% 9 110 400 782 0% 0 0
Scenario 2 “ 90% 8 199 360 704 10% 911 040 28 247
Scenario 3 “ 70% 6 377 280 548 30% 2 733 120 84 740
Scenario 4 “ 50% 4 555 200 391 50% 4 555 200 141 234
Scenario 5 “ 30% 2 733 120 235 70% 6 377 280 197 728
Scenario 6 “ 10% 911 040 78 90% 8 199 360 254 221
Baseline “ 0% 0 0 100% 9 110 400 282 468

82
The baseline scenario represents a scenario where all the added volume in the RFC
come from road and constitutes a complete shift from road to rail. However, this
scenario might seem unlikely, and we have complemented the analysis with some more
scenarios some of which might be more realistic:
Scenario 1 represents a shift where all of the added volume in the RFC comes
from road
Scenario 2 represents a shift where 90 % of the added volume in the RFC comes
from road
Scenario 3 represents a shift where 70 % of the added volume in the RFC comes
from road
Scenario 4 represents a shift where 50 % of the added volume in the RFC comes
from road
Scenario 5 represents a shift where 30 % of the added volume in the RFC comes
from road
Scenario 6 represents a shift where 10 % of the added volume in the RFC comes
from road
The Baseline Scenario represents no shift of the added volume in the RFC to come
from road. This means that these volumes are not generating any savings in GHG-
emissions from road transports.
These scenarios assume that the corridor can absorb the additional activity and that the
supply of cargo is greater than the capacity of the RFC provided by the scenarios above,
that is, there is never a problem of filling the LHT with cargo. This is of course a
simplification. The use case informs us that it is a continuous work to ensure that
wagons are loaded and trains are fully utilized – working with the load factors is a
continuous process. Nevertheless, for our purpose being to assess the macro-level
effects of the LHT-measure in the toolbox, these are reasonable simplifications.
For the discussion of the greening results of these scenarios, we have chosen Scenario 4,
5 and 6 for further discussion in a later section. This is because we estimate these to be
among the more realistic scenarios discussed above.
6.3.3 Digitized railway
The digitization of the railway system in itself renders next to zero effects on current
emission levels. However, digitization is to be considered a hygiene factor for the
railway as a mode of transport. Without this, railway transports risks losing volumes to
other modes of transports, primarily road, which in turn constitutes an increase in GHG
emissions. On the other hand, with investments in digitization, the potential and utility
of the railway as a transport mode increases. We therefore assess the performance of
these measures in terms of the savings of GHG emissions that the digitization enables in
terms of the shifting of volumes from road to rail. Such a modal shift is a common goal for
both national and EU-level initiatives.

83
The implementation of a digitized railway in terms of GPS-tracking of wagons is
analysed departing from a base-line scenario. The baseline scenario is that of no trace-
and-track system implemented in Rail 17. With this as a baseline, effects of
implementing GPS-trackers on wagons is evaluated according to the following:
• Current SFL Scenario: 3 000 wagons equipped with GPS-trackers.
• Expanded SFL Scenario: All of the SFL rolling stock wagons (approximately 6 000
wagons) equipped with GPS-trackers.
Thus, for both scenarios, consequences for GHG-emissions savings are calculated
assuming shifting volumes from road to rail as described below.
6.3.4 Analysis of digitized railway
Micro-level assessment
In the following we present the results of the calculations of effects from the
implementation of a digitized railway on SFL’s volumes in the Swedish part of the RFC
on the relation Hallsberg – Malmö.
In the first scenario Current SFL we assume that the digitization attracts 2 % of the
corridor volume as an increase in volumes for SFL. In the second scenario Expanded SFL,
we assume digitization to attract 10 % of the corridor volume as an increase. In both
cases we assume these increases to come from road transports, meaning that it entails a
shift from road to rail. See Table 6.5. These increases are reasonable considering that
BillerudKorsnäs, being the owner of SFL, strives to increase the total volumes of railway
transports from its current level of circa 50 % of total volumes to 55-60 % if possible.
Table 6.5 The volumes shifting from road to rail due to digitization in the two scenarios
Scenario Option
SFL volume in corridor
Rail increase Road decrease
Share
Cargo volume
[ton p.a.]
CO2e [ton p.a.]
Share
Cargo volume
[ton p.a.]
CO2 e [ton p.a.]
Scenario 1: Current SFL
1 822 080 +2% +36 442 +3 -2% -36 442 -1 130
Scenario 2: Expanded SFL
“ +10% +182 208 +16 -10% -182 208 -5 649
As with the LHT-measure, calculations here assume a corridor length of 477 km and the
GHG-emissions from road and rail to be 65 g CO2e/tonkm and 0.18 g CO2e/tonkm,
respectively. What is an important difference is the total volume in the corridor. Here we

84
use SFL’s current volume on LHT (1 822 080 ton p.a.) as a point of departure for
estimating the increases in volumes from the digitization. The logic behind this is that
the digitization of the railway likely attracts volumes in relation to its current volumes
rather that the total in the RFC. We posit that the increase in volumes due to digitization
of the railway should be assessed in relation to the scale of the current utilization of LHT
in the railway-system. Thus we argue for what could be called lead-user scale symmetry.
Taking SFL being a lead-user as a point of departure is a way to ensure realistic
assessments. At any rate, using the current SFL LHT volumes in the ScanMed RFC can be
considered a conservative assessment and mitigates any positive biases of the effects of
the measure.
Macro-level assessment
This analysis is the same as for the LHT measure above. Assuming that a digitized
railway enables the shift from road to rail we can calculate the effects for shifts at a 10,
30 and 50 % level, respectively. Thus, the results become identical to those in section
6.3.2 Table 6.4 and are not duplicated here.
The main difference is that here we assume the digitization as a prerequisite for the shift
to happen. In section 6.3.2 no such assumption was made. Instead we assumed the
railway system being able to absorb the volume increases without any measures such as
digitization or any other infrastructure investments. This is of course unrealistic, but
gives a proxy to what effects that could be expected.
6.3.5 Sensitivity analysis
Info Box: Sensitivity discussion Operating electric driven trains inevitably leads to the discussion of electricity origin and its related emissions somewhere else. This specific solution using well utilized long trains leads to a very energy efficient transport solution that in its design is difficult to match with other transport solutions. On this specific rail stretch it operates on green electricity procured by the Swedish Transport Administration. Transforming this specific transport solution into a general performance indicator as CO2e wtw [g/tonkm] would lead to the results showed below: Green electricity (Bra Miljöval): 0.18 g/tonkm Nordic electricity mix: 2.21 g/tonkm Average European mix: 9.50 g/tonkm Coal based electricity mix: 20.00 g/tonkm Even when operating the train on coal based electricity, the emissions are fairly low per tonkm. For sure this would lower the gains significantly in the case but still be good. We have chosen the alternative Green electricity since that is what SFL buys, but we are well aware of other views on this topic and therefore we leave that to the reader to interpret and evaluate.

85
6.4 Discussion: Core issues from the Railway case
6.4.1 HCT Rail
Our scenario-analysis for the ScanMed RFC based on the rail use case shows a potential
for GHG-emissions savings, especially when cargo is shifted from road to rail. However,
as was stated earlier, any conclusions from this analysis must be made with utmost care.
In the following we shall discuss some of the indications that can be identified.
While LHT alone creates no aggregated savings, this measure does create a more
environmentally efficient solution as the GHG-emissions per ton cargo transported
decreases. This means that the total CO2-emissions increase but the CO2-emissions per
ton goods transported decreases (see Table 6.3). However, these decreases are quite
small as compared to the effects from this in combination wit a shift from road to rail.
In our analysis we analysed many levels of shifts in six scenarios (section 6.3.2 and Table
6.4). Here we shall focus on the effect in terms of the GHG-savings that a shift from road
to rail in three scenarios creates: in Scenario 6 with a 10 % shift in volume from road to
rail; in Scenario 5 with a 30 % shift and in Scenario 4 with a 50 % shift. See Table 6.6.
Again, for now, we disregard any infrastructure issues that this may entail and also from
any investments that may be necessary.
Table 6.6 Annual CO2-emission savings with shifts from road to rail in three scenarios
Unit Scenario 6: 10 %
shift
Scenario 5: 30 %
shift
Scenario 4: 50 %
shift
Rail Volume 911 040 2 733 120 4 555 200
GHG 78 235 391
Road Volume 8 199 360 6 377 280 34455 200
GHG 254 221 197 728 141 234
Sum total Volume 9 110 400 9 110 400 9 110 400
GHG 254 299 197 963 141 625
Baseline GHG 282 468 282 468 282 468
Result GHG-saving -28 169 -84 505 -140 843 Note: GHG units: ton CO2e p.a. Volume units: ton p.a.
The baseline constitutes Scenario 6 in Table 6.4 in which all the added cargo volumes
would have been transported by road resulting in a total of GHG-emissions amounting to
282 468 ton annually. This is as a mean of comparison. If this measure has the effects
shown in Scenarios 3, 4 and 5 above – the result as compared to the baseline alternative
of transporting all the cargo by road is shown at the bottom of table 6.6.

86
Reading the table from left to right means that one goes from a relatively small shift to a
larger with increasing volumes of cargo going from road to rail. As can be seen from
Table 6.6 the expected savings are following the amounts of cargo volumes transferred.
This is because the relative share of GHG-emissions from rail compared to road is so
small, and because the length of the stretch is assumed equal for both road and rail. In
this particular case, variation in transport activity becomes dependent on the cargo
volumes only since the distance is equal and fixed.
It is worth noting though, that as cargo shifts from road to rail, the savings from
decreased emissions from road transports are so significant and the increase in
emissions from rail so insignificant so that the total GHG-emissions savings equals that
of the magnitude of the shift itself. Our results show that a 10 % shift from road to rail
renders approximately a 10 % decrease in GHG-emissions, a 30 % shift renders a 30 %
decrease, and a 50 % shift renders a 50 % decrease (See Table 6.6).
Although, the distance of 477 km of this part of the corridor is fixed and equal for both
road and rail, given the emission data on rail and road transports, using LHT to
accelerate a shift creates a potentially substantial CO2 saving as more and more cargo
shifts to rail as is shown in Table 6.6.
6.4.2 Digitization of Rail
The digitization of the railway in itself create little or immeasurable direct effects on
GHG-emissions. However, the indirect effects are measureable. Table 6.7 shows the total
CO2e -savings from the Current SFL and Expanded SFL scenario respectively.
Table 6.7 GHG-emission savings from the scenarios of a digitized railway
Scenario Option Rail increase CO2e
[ton p.a.]
Road decrease CO2 e
[ton p.a.]
Total saving CO2 e
[ton p.a.]
Scenario 1: Current SFL +3 -1 130 -1 127
Scenario 2: Expanded SFL +16 -5 649 -5 633
Table 6.7 show that in the current SFL scenario derived from an estimated modest 2 %
shift from road to rail, 1 127 tons GHG-emissions would be saved every year. If the shift
is 10 % the saving is 5 633 tons annually.
Yet, the main argument for investing in the digitization of the railway is not primarily
because its greening effects, neither indirect nor direct, rather it s due to a perceived
need to constantly increase the service level of the transport offering to customers. This
can be related to the data on transport purchasing behaviour reported on in chapter 3

87
earlier. Environmental effects are seen as positive, but not prioritized (see Figure 3.2). If
a greening effect is created it is to be considered a secondary effect – almost unintended.
Still, such measures hold some promise as a way to both prevent volumes from leaving
rail as well as attracting new volumes, primarily from road transports, as we have
shown in the scenarios used here.
If larger shift occurs as a result from the digitization of the railway, the effects are
identical to those reported and discussed in section 6.4.1 above. We shall not replicate
them here, but only point out that the consequences are the same as in the previous
analysis: if and when cargo shifts from road to rail, the savings from decreased
emissions from road transports are so significant and the increase in emissions from rail
so insignificant so that the total GHG-emissions savings equals that of the size of the shift
itself. These two analyses thus complement each other.

88
7 The Infrastructure Use Case
7.1 Lead user: Swedish Transport Administration The Swedish Transport Administration (Trafikverket) is the agency responsible for the
overall long-term infrastructure planning of road, rail, sea and air transport in Sweden.
Trafikverket also manage and control the construction, operation and maintenance of
state roads and railways.
The long-term objective of Trafikverket is to develop an efficient and sustainable
transport system through sufficient access of intermodal traffic solutions, hence
fulfilling the vision of a transport system in which “everybody arrives smoothly the
green and safe way”. (Trafikverket website). Table 7.1 shows some characteristics of
Trafikverket.
Table 7.1 Characteristics of Trafikverket
Total budget in 2014 Approx. 52 600M Sw. kr.
Number of employees 2014 Approx. 6 500
Location of headquarter Borlänge
Number of offices across Sweden 6
7.1.1 General aspects of traffic tunnels
Tunnels for road and rail are an increasingly essential part of the traffic infrastructure
since available land is scarce. Traffic access needs can often only be met by tunnels due
to difficult legal processes and criteria’s for building surface based infrastructure. Hence
tunnels solve environmental aspects of land intrusion, barrier effects and disturbing
traffic noise. Tunnels can also solve traffic related topographical challenges as well as
ensuring a smooth throughput. Meanwhile tunnels have their advantages their
construction and operation has its specific challenges and risks of severe environmental
impact. It is therefore an ambition from Trafikverket to carry out a solid preventive
environmental work in relation to construction of tunnel infrastructure.
The environmental impact from tunnels can be divided into the following phases:
Design and Construction
Operation
End of life (more on a principle basis as few tunnels cease to be used)
The aim is to design, build and operate tunnels at minimum environmental impact
meanwhile its use reduces negative traffic related environmental impact.

89
According to the Swiftly Green project, a general recommendation is to systematically
develop traffic tunnels through the phases of pre-study/design, construction and
operation. The activities in each of these phases are shown below:
Pre-studies and design:
Systematic assessment and analysis of other best practices
Mapping and design for an efficient pathway
Analysis of geothermal possibilities and challenges48
Design of tunnel for an efficient maintenance
Analysis of most environmental and climate efficient material
Analysis of most environmental and climate efficient building process
Analysis of most environmental and climate efficient building logistics
Analysis of most environmental and climate efficient handling of residues
Construction:
Consideration of environmental and climate impact from machinery during
construction
Environmental and climate considerations when selecting material integrated in
the procurement process
Environmental and climate considerations in material deliveries and residues
transport
Reuse and recycling of material
Closed loops for use and scrapping of toxic and environmentally damaging
material and products.
Operation:
Efficient energy use (illumination and ventilation)
Cleaning (dust and particulates)
Maintenance
7.2 The Varberg tunnel project One of the major railway infrastructure projects in Sweden focuses on increasing the
capacity and reliability of the Swedish west coast line from Lund to Gothenburg. The aim
of the upgrading of the whole west coast line is to create a quick, efficient and
environmentally friendly mean of transportation for both people and freight. The west
coast line is an important line in the Swedish railway infrastructure as it connects
Malmö/Lund with Gothenburg and the ports in these cities. Currently approximately 85
% of the line is double track.
48 A nice example of how thermal energy out of the tunnel can be used is the Tropenhaus Frutigen tropical
greenhouse in Switzerland: https://www.tropenhaus-frutigen.ch/en/. Accessed on 2017-02-26.

90
This stretch includes many separately extensive projects of which the tunnel project
through the Hallandsås was the most complicated. This tunnel was opened and
inaugurated in December 2015 started its planning process in 1975 and construction
1993. The Varberg tunnel project that is planned for construction in 2019 – 2024 is
another big tunnel.
The Varberg tunnel project includes replacement of old single-track railroad through the
city of Varberg in Halland to a double track railroad in a tunnel with a slightly different
stretch underneath the city. It also includes a new station underneath the central city
and a new freight yard. (See Figure 7.1 and Table 7.2).
Figure 7.1 The Varberg tunnel project.
(Source: Trafikverket, Expansion of the West Coast Line to double tracks through
Varberg)49
Thus the project includes both the construction of the double track and tunnel, as well as
a new station and a freight yard. The project is co-financed with Trafikverket as the
main financier supported with additional funding from Jernhusen (for the station) and
Varberg Municipality and the Region of Halland.
49 Downloaded 2016-11-28 from:
http://www.trafikverket.se/contentassets/6af3089d6a754fdca375e5c32d34b4ae/
expansion_of_the_west-coast-line_eng_150924.pdf.

91
Table 7.2 Short facts of the Varberg tunnel project (Source: Trafikverket).
Location West coast line through Varberg, Halland
Length of double tracks 7,5 km
Rock tunnel 2,8 km
Concrete tunnel 300 m
Open concrete trough 900 m
Planning period 2015 – 2018
Construction period 2019 – 2024 (approx.).
Estimated cost (2009 price level) 3 990M Sw. kr.
One of the benefits of the Varberg tunnel is that the current barriers posed by tracks and
yard will be eliminated. The inhabitants will thereby have better access to the shoreline
and lowering the tracks into a tunnel releases space for housing and other activities. In
addition, the noise emissions from the passing trains will be significantly reduced. While
noise emission reduction measures are a specific issue for the railway in general, these
reduced noise emissions will be a second order effect of the tunnel project. Where ever
railway lines cut through densely populated areas noise pollution and noise emissions
are always an annoyance. Hence the elimination of noise adds to the societal net benefit
of the project.
7.3 Identification of measures from the Trafikverket case One of the main issues for Trafikverket infrastructure projects is to ensure efficiency
and sustainability gains in creative and smart ways where the four-step principle is to be
used as a guide (see Info Box below). The Varberg tunnel project is an example of a
project at step 4.
7.3.1 A four-step guide for infrastructure projects
All activities within the Swedish Transport Administration must follow a four-step
principle guide for infrastructure projects. Each step covers different aspects and phases
in the development of traffic infrastructure.
Sustainable transports focus on the first two steps through attitudes on using more
sustainable transport solutions.

92
Info Box: The four-step principle
1 Re-think
The first step revolves around measures of transport-demand as well as modal choice.
2 Optimize
The second step focus on measures that make use of existing infrastructure more
efficient.
3 Re-build
If needed the third step means limited reconstruction of existing infrastructure.
4 Build new
The fourth step is carried out if transport demand cannot be met through the three
previous steps. This means new investments and larger upgrading projects.
7.3.2 Identifying measures
The whole infrastructure project embraces the upgrading of the west coast line to
double tracks for reliable, faster and more efficient passenger and freight transport.
There will also be gains to be made locally. In the Varberg tunnel case the magnitude of
these gains are dependent on management of the project, technical issues and issues of
creating circular flows of resources in the construction process, etc.
Another effect of the Varberg tunnel project relates to noise emissions from the railway.
Noise emissions are legally the responsibility of Trafikverket being the infrastructure
holder, but noise generation is much related to technicalities of the freight waggons
owned by various operators. Of course building tunnels reduces noise emissions, but
such measures are in general too expensive to be relevant if the sole purpose is to lower
noise emissions. Another alternative is to reduce the highest allowed speed limits at
certain lines in order to lower the noise emissions, but such measures also have other
drawbacks making it less attractive as a measure.
From this rationale we identify the following measures from the Swiftly Green toolbox
as relevant or partly relevant for this case:
1. Recycling of tunnel spoil
2. Thermal use of drainage water
3. Unreinforced tunnel inner lining
4. Tunnel lining potential energy exploitation
5. 3D temperature mountain mapping

93
6. Tunnel 3D surface mapping
Measure 1-6 all relates to the issue of infrastructure construction management. These
measures have been identified as potentially implementable based on the case. Figure
7.3 shows our assessment of the TRL and MRL of these measures.
Figure 7.3 Assessment of TRL and MRL of the six measures described in the tunnel
infrastructure case.
7.4 Analysis and performance assessments In order to verify the relevance of the toolbox measures related to tunnel based traffic
infrastructure, in depth interviews with the Varberg project manager was carried out. In
the interviews it became obvious that specific measures, being relevant at some places
may not be equally relevant for other tunnels. Hence this section presents the approach
from the Varberg tunnel project and thereafter we comment on these solutions and
processes in relation to the suggested toolbox measures. It should be emphasized that
our empirical data is based on limited empirical data, hence concluding remarks and
analysis should therefore be considered as fairly shallow.
Major traffic infrastructure projects are in general initiated by political decisions being
the pre requisite for building new traffic infrastructure. Thereafter various alternative
routes are investigated in relation to the overall aim and other considerations. For rail
traffic infrastructure this phase means development of the railway investigation
(järnvägsutredningen) that in its next phase becomes the railway plan
(implementation). Prior to starting building a rail tunnel many diverse and additional
interests also arises locally. In Varberg one such example was a political condition that
the railway station must be placed underneath the central part of the city. This is not the
best location from a pure rail optimum perspective but considered crucial by the city of
Varberg.

94
During the process of planning tunnel projects tend to become more expensive, partly
based on an incentive to keep costs low in order to motivate a tunnel project. Costs are
kept low during planning in order to arrive at a calculated profitable project on a 120
year writing off period (for tunnels). In Varberg this meant no lining and the
construction of one main tunnel and one service tunnel. The solution with two railway
tunnels and one service tunnel would have been better for future maintenance, but as it
was more expensive and added complexity to the railway switches in both ends of the
tunnel it was not selected as the final solution.
Systematic feedback of experiences from previous tunnel projects is not fully in place.
There is however a requirement on a final environmental report. At the moment there
are no stringent format requirements on this report that would make feedback more
accessible. There are in other words still risks that previously made mistakes could be
repeated. Another issue is that local conditions are hugely different. In one region or
municipality there may be requirements that are not valid in the neighboring
municipality and so on. There are also differences among the individual staff within
municipalities where their opinions differ on various matters.
Based on the railway investigation and the railway plan the environmental
consequences of the new tunnel have been assessed influencing the conditions that need
to be fulfilled by the construction. On top of local and regional requirements the national
railway requirements is another major constraint that must be fulfilled. There is also a
requirement to carry out a climate analysis of rail tunnel projects. The climate analysis is
however evaluated after the project is finalized, assessing deviations from initial
estimated gains and is therefore hard to use as a control and management tool.
Consequently the role of the climate analysis seems to be downplayed at times. In
addition, technical issues such as functional requirements related to speed requires a
specific minimum track radius that cannot be deviated from.
A major driver for environmental concern regarding all new Swedish rail tunnels is the
previously built tunnel through the Hallandsås. This project had huge environmental
problems related to lowering ground water levels and use of toxic chemicals (Rhoca Gil).
The project became an environmental scandal and took some 23 years to finalize. The
effect of the construction failures of the tunnel through the Hallandsås is a range of
improvements in the construction process such as requirements on handling of
chemicals, list of approved chemicals and a chemical advisory board. Environmental
requirements are continuously increasing linked to new legal requirements as well as
based on the ambition to be on the forefront. This is materialized through:
Checklists
Environmental enhancement plans
Processes for permits
Site requirements
Protective measures related to environmental consequences assessment

95
Environmental construction enhancement
Regular environmental controls
The selection of material is in the end a trade-off between cost and environmental
impact. The supplier will chose the cheapest alternative if there are no specific
requirements.
Still, construction of tunnels does not always include specifications on all materials used.
Previously it was possible to build tunnels that severely influenced some species living
conditions negatively but today´s regulation on protecting species such activities need to
be compensated elsewhere. Environmental regulations are in general fulfilled without
margins but for some larger projects more resources are spent on developing proactive
measures, exceeding legal demands. There are extensive supporting guidelines on
supplier evaluation at Trafikverket, but the magnitude of the project often determines
the level of ambition with regard to supplier evaluation. At Trafikverket an exogenous
factor for successful environmental construction is the commitment from suppliers. If
they are environmentally committed the outcome is in general much better. Regarding
construction for a more efficient operation of the tunnel this is an area than can be
improved, although there are improvements done already today.
Later maintenance aspects are part of the process through the:
Planning
Investments in large projects
Operation and maintenance affects the planning process
In the process of procurement of material and construction processes there is a general
concern to not exceed regulations linked to public procurement regulations. There is an
anxiety to establish conditions that may cause competitive distortion that can be
appealed. In general this seems to be an area that can be improved.
The tunnel in Varberg is the second large tunnel project (after the tunnel of the
Hallandsås) on the west coast railway line which will be followed by one additional
tunnel before this stretch is updated as a whole according to the plan.
A summarizing reflection is that the process is good but construction seems to be
traditional and highly dependent on individuals and their skills and experiences. To
accomplish world-class performance does not seem to be the vision. There are
international benchmarking on how comparable traffic infrastructure projects are
carried out and how specific requirements have been solved. Still it seems that this is
not done fully systematically.
7.5 Discussion: Core issues from the Infrastructure case The main general difference between the toolbox measures and the actual process of the
Varberg tunnel is its practical implementation. In reality the process is much impacted

96
from economical and technical realities that in practice lead to the final solution.
Another factor that deviates is the high dependence on practical experiences in reality.
It seems to be a large number of control mechanisms and procedures in order to avoid a
similar environmental disaster as for the tunnel through the Hallandsås. Maybe less
would be more in these processes with more stringent guidelines. Something that was
obvious is that measures in the toolbox were never considered in this process.

97
8 Discussion
Implementing improvement measures always entail costs in order to accomplish service
improvements or savings with regard to emissions or operational costs. In transport
logistics they often, but not always come together. One issue to manage in these
circumstances is who will bear the cost for a given measure. This is a generic issue and is
valid regardless of modality, measure or context.
At a general level, it is a question of how costs, benefits, responsibilities, ownership,
maintenance and investments are distributed among a set of heterogeneous actors in a
complex socio-technical-economic matrix. In this context it is linked do the traffic and
transport systems where initiatives, measures and attempts aim to make these systems
more sustainable. If we can overcome economical and regulatory barriers our results
indicate considerable emission savings potential.
Our results indicate that by systematically and persistently implementing two or three
measures from the toolbox it is possible to reach the ambitious transport related GHG
targets prior to 2045 set by the Swedish government.
Combining HCT-road measures such as longer trucks to allow for 32m vehicles fuelled
by HVO with long and heavy 730m-trains (LHT) on the core relation Malmö – Hallsberg
of the ScanMed corridor creates reductions in GHG-emissions on a scale that fully
implemented would enable the transport sector to reach its emission targets.
This leads us to conclude that there are relatively few technical obstacles to reach the
targets if we assume that there are sufficient amounts of biomass available. However,
scaling up the use of biofuels to meet current and future growing needs in the global
traffic system is impossible. We therefore need to also implement measures on demand
management, energy efficiency and introduce a massive electrification effort. Still we
would need to add enormous biofuels production capacity that at a very large scale may
conflict with food production. What we refer to in this study is the transport industry’s
ability to adopt these solutions.
Apart from resource limitations, obstacles that exist are of legal, regulative,
organisational and economic character. To fully harness the potential identified in this
report, issues such as EU-regulation concerning HCT-road, the development of open
business models, neglected infrastructure maintenance and investments, and the
harmonizing of railway regulations and control must be dealt with.

98
Another important reflection that we make concerning the toolbox and the corridor is
that the latter could be utilized as a test bed for measures in the former. For example, for
road transports, we suggest utilizing the corridor as a platform/infrastructure to test
and develop solutions for the implementation of renewable fuels. Development and
design of new infrastructures to produce and distribute novel fuels are required for such
measures to be successful on a larger scale, and the ScanMed corridor should be the
natural location for such development projects and tests. It could similarly be used in
this way for railway transports where, for example, the utilization of renewable
electricity could be evaluated along longer sections of the corridor to assess its potential.
Our sensitivity analyses suggest that there is room for improvement in this area.
In order to avoid sub optimization, a general conclusion in the sustainability
transformation of the traffic and transport system is to always consider scarcity of
resources. The SFL railway case indicates that if there is scarcity of, for example, train
slots, they should primarily be used for inland heavy goods as the alternative by road is
significantly worse. Light and volume goods on medium distances should not compete
for these train slots (if there is a scarcity). They can advantageously use the HCT
alternative.
As infrastructure cost in general is high and there is long term needs to improve the
railway system, sea transport along the coast should be developed as an alternative
since over use of the railway track will decrease its reliability. The sea modality can
complement road and rail in this way.
Renewable fuels should primarily be used for heavy vehicles at medium distance, as
electrification of these vehicles is significantly more difficult than of cars that in general
operate locally.
These few examples aims to describe a need to enhance a credible and solid road map
towards a climate neutral traffic and transport system where each measure should be
supported by a performance indicator on their cost per kg CO2e saved. This would give a
good priority list starting off with activities that give the most “bang for the buck”.
8.1 Implications for the road use case Making road transport more efficient through larger capacity means larger vehicles that
may conflict with traffic infrastructure capability, modal competition and in total a less
energy and climate efficient transport system. On the other hand the road case through
the duo-trailer shows significant potential of GHG-emission savings. The rope trick is
therefore to promote long distance transport by rail whereby very efficient road
transport is carried out for pick-up and delivery by duo-trailers if possible. If rail service
offers insufficient long distance service, the duo-trailer-based road transport using
renewable fuel is a very good alternative. In combination this would take us far in our
ambitions to reduce GHG-emissions. Based on our examples it is obvious that we need

99
intelligent policies that ensure significant reductions of transport related GHG-emissions
in total (effect) and in relative terms (efficiency). If it is possible to overcome pre-
assumptions on right and wrong with regard to modal choice and instead focus on
results it is very likely that we can reduce transport related emissions by 85 % before
the present target year 2045.
8.2 Implications for the rail use case Our results show that as cargo shifts from road to rail in the Swedish part of the
ScanMed corridor, the savings from decreased emissions from road transports are very
large in relation to the increase in emissions from rail, which are very small. As a result,
the total GHG-emissions savings nearly equals that of the size of the shift itself. This
speaks for an acceleration of the implementation of LHT in the ScanMed RFC. However,
there are obstacles to be overcome in order to do so.
Since the railway transportation system is a highly complex socio-technical system
comprised of a network of many different actors – the question of investments and cost
absorption for implementation of measures is one obstacle. For example, when it comes
to LHT investments on rolling stock a question for the owners and users of the wagons is
that the investments in infrastructure is the responsibility of Trafikverket (and
equivalent bodies in other countries) and the investments in using longer trains is a
question for 4PL-actors such as SFL and/or operators such as Hector Rail and/or wagon
owners such as TWA.
Organizationally the freight wagons are usually owned by one actor who rent them to
other actors who uses them on infrastructure in many countries, pulled by many actors
over various stretches, and loaded with freight from actors in many completely different
industry sectors. Who bears the costs for investments in GHG-reduction measures of the
rolling stock in this situation? This issue is emphasized in the digitization issue in which
wagons must be equipped with technology that requires investments and where
detection equipment must be installed along the railway tracks, etc. Both measures
require investments and emphasizes the issue concerning who will bear the costs for
these investments.
Another critical issue has to do with the coordination and synchronization of
infrastructure across nation states. The ScanMed corridor is seen and managed as a
unity from the EU-perspective, however in practice this is not quite the case. The
ScanMed RFC Corridor-One Stop Shop cannot be utilized to its full extent due to physical
infrastructure restrictions at the marshalling yard in Malmö, similar to the ones at the
marshalling yard in Hallsberg. Here the development and investments in physical
infrastructure and the organizational development are decoupled and non-coordinated.
Nevertheless, the 6 billion Sw. kr. investment that Trafikverket have announced50 in
50 March 2017.

100
infrastructure facilities in Malmö, Hallsberg and Sävenäs in order to upgrade them
would, in the light of the results from this project, seem like a good step in the right
direction. These ambitions could also be used to create so-called “Flagship” cases in the
ScanMed-corridor in order to develop them further and take them to implementation
within a near future.
8.3 Implications for Trafikverket For an actor such as Trafikverket, finding mechanisms to distribute costs and rewards in
such a complex system as the Swedish traffic infrastructure is one important task that
needs to be resolved in order to be able to really take a step ahead in greening the
transport system in Sweden. For Trafikverket, this is particularly emphasized as they
have the role as both a controlling agent but also as the agent responsible for
maintaining and building the Swedish traffic infrastructure. Understanding the network
of actors and roles and how costs and revenues are distributed among them is a key
issue. Simply put, understanding the business cases is crucial in order to be able to
mobilize support and commitment enough to implement measures to green the
transportation system, whether these measures comes from the Swiftly Green toolbox
or not.
The traditional solution has been to regulate through the infrastructure administrator
and through market-based measures and tax reductions. Hence Trafikverket can impose
regulation – for example, based on a measure from the toolbox. This means that the
network of actors utilizing the infrastructure in question is forced to absorb the cost for
investing in GHG-reductions, and that the distribution of costs and benefits from that is
managed by the networks.
Usually, this means that the weaker actors carry the most of the investment burdens
which is not always to the benefit of the network in total because it tend to weaken the
already weak and channel wealth and resources to the already strong51. It means that
the network is being tightened and successively denser so as to eventually comprise
only a smaller number of consolidated and powerful actors. These actors usually aim to
conserve status quo and resist change and innovation. This is usually what happens in
these types of complex network structures – it produces Fat Cats. We conclude that the
Fat Cat-problem is a trait of the Swedish transportation system in general.
Unfortunately, there are no readily available antidotes in research yet, but learning to
manage and understand the dynamics of complex socio-technical industrial networks is
crucial for any involved actor, and especially for those set to regulate such industries52.
51 Olsen, Prenkert, Hoholm, & Harrison (2014). 52 Håkansson (2006).

101
If no regulation is imposed on the network, the minimum amount of resources required
will be spent on investments in infrastructure, commons and collective utility53. This is
known as the ‘tragedy of the commons’ in the research literature. Some regulation is
therefore necessary, but how and of what type is a difficult and pertinent question.
Drawing on the rail use case in this report, it is important to understand the function
and behaviour of the industrial networks around, for example, a railway infrastructure –
otherwise this infrastructure – this common resource – will eventually erode as a result
of the tragedy of the commons. Unfortunately, the lack of maintenance and current
problems of technical quality is a manifestation of this begun erosion of the Swedish
railway infrastructure.
A systematic and coherent strategy for investments and maintenance of railway
infrastructure is a core issue for Trafikverket in this circumstance. This report shows
that investments that enable a shift from road to rail and the acceleration of LHT are
measures that provide substantial greening effects.
8.4 Implications for the Swedish part of the ScanMed corridor Drawing on the methodology used in this report, assessing the necessary level of
adaptation and change to an already existing socio-economic-technological context for
any given measure seem to be of crucial importance for any success in its
implementation. These assessments include assessments of the network readiness to
adapt to newly introduced measures. Such network accommodation is resource
demanding and requires substantial amounts of effort in mobilizing support from other
actors.
One implication from this is that the TRL and MRL might benefit from being
complemented with a Network Readiness Level (NRL) assessment. This would entail
adopting an interactive view on the relationship between science-technology and
business and developing some measures of the readiness level of a measure in relation
to some important network dimensions. While such a development task is beyond the
scope of this report, relating the measures in question to a specific user context
functioned as a proxy to this. Adopting this methodology and complementing the TRL
and MRL assessments with an NRL assessment (if done properly) would likely yield
significantly more potent selections of measures that have more realistic potentials to be
successfully implemented. Such measures would also, by definition be industry relevant
and have significant consequences for actors involved in the user contexts from which
they originate.
53 Ostrom (2002).

102
In addition, extending the Swiftly Green toolbox with new measures identified by a
systematic application of this methodology on a wide range of use cases would benefit
the greening ambitions of the transportation sector.
8.5 Recommendations Based on our analysis of the three use cases and calculations of effects on select
measures from the Swiftly Green toolbox, we can identify a number of general
recommendations.
We recommend that Trafikverket take a leading role in ensuring maintenance
and infrastructure investments to enable more HCT-road as well as LHT. Road
and rail are not opposing parties in a zero-sum game in this, but complementary
towards a greener transport system.
We recommend business actors in the sector to work on developing more open
business models that enables cooperation and more systematic synchronization
and coordination of cargo flows.
We recommend policy institutions and regulators to create long-term
systematic regulations that ensures that he rules of the game are coherent, stable
and geared towards creating a fossil free transportation system in 2045. This also
requires international alignment.
For the more specific recommendations, we first list those for Trafikverket as the
infrastructure holder. Then we list those for other actors in the sector.
8.5.1 Recommendations for Trafikverket as the infrastructure owner
Prioritize maintenance and investments in infrastructure to enable and
accelerate the expansion of HCT-road as well as longer-heavier-trains (LHT)
Expanded collaboration and co-loading can contribute to more systematically
coordinated cargo flows with the opportunity to utilize larger vehicles. We
recommend Trafikverket to continue to actively partake in creating opportunities
to elicit more developed collaborations among business actors in the sector. This
can be done by stimulating cooperation, enhancing positive effects and initiating
demonstration-projects in which new tools for continued horizontal
collaboration are identified and old ones further developed. The current project
on horizontal collaboration by CLOSER is a promising initiative in this direction
that can be enhanced further
Prioritize investments in rail infrastructure that enables an accelerated and
smooth shift from road to rail transports – for example through the following:

103
o Make the shunting yard in Hallsberg a state-of-the-art node in Scandinavia
concerning efficiency, capacity and quality which together contributes to
the productivity of the whole railway system
o Make the shunting yard in Sävenas an ocean gate
o Make the shunting yard in Malmö equipped to receive long heavy trains
from the continent
Use the measures above in combination with HCT road as ”Flagship” cases to
develop them towards implementation
Use the methodology from this in your own operations to identify potential
measures and assess their Technology Readiness Level (TRL) and Market
Readiness Level (MRL) in line with the assessments made in the toolbox
Introduce routines to harness results from climate analyses in prior
infrastructure projects when planning for new projects to avoid repeating
previous mistakes
Establish routines for systematic knowledge transfer across various
infrastructure projects
Initiate a road map with requirements on transports in terms of Key Performance
Indices (KPIs) to be improved over time so as to achieve an efficient and fossil
free transport system. Such a system would enable early adopters to go forward
while putting laggards in the spotlight. Measures such as renewable fuels, vehicle
technology and (more) effective logistics are all measures that can be used to
improve performance. Its respective use is, however, determined among the
actors in the system based on what is suitable in specific situations and in certain
circumstances
Stimulate projects in which solutions with inland and coastal sea freight
transports complements road and rail transports
Recommendations to shippers and service providers in the sector:
8.5.2 Recommendation to shippers and service providers in the sector
Increase the engagement in networks and the collaboration with other actors in
the Swedish transport sector to realize potentials and revenues that are
otherwise inaccessible and to strengthen your business model
Open up your business model to other actors in the sector without creating
unacceptable increases of business risk
Ensure that your business model is aligned with the development towards
greener transport systems
Use you role to create leverage in the transport system to create sustainable
systems
8.6 Post Script

104
Reflecting on the measures of the Swiftly Green toolbox, one problem in is that they are
of a kind that places them in a no man’s land. Either they are extremely specific
concerning a detailed issue on – for example – tunnel lining techniques. Or they are way
too general, almost generic so as to lose any relevance in practical application, such as –
for example – the idea of mega-hubs for multimodal solutions. This makes the measures
hard to use and implement.
One way to deal with this is to continue working with the toolbox and add specificity to
measures that are too generic as well as context to those that are too specific, so as to
make the toolbox more balanced in the future.
Another problem with the toolbox is that it is unbalanced in relation to the transport
modalities. Rail is overrepresented among measures when compared to road, and
especially to sea. There are no sea-related measures at all in the toolbox if one
disregards the ones relating to ports. This is a problem, as the ScanMed corridor
arguably also comprises stretches across sea. It would thus be reasonable to include also
seaway transports in the toolbox.
In addition, domestic sea freight is an alternative that might provide opportunities for
additional greening of the transportation system, showing a growing interest and
potential. Inland and coastal sea freight complement road and rail transports as we
progress towards a sustainable transport system.
Overall there is also the problem of updating a database of this kind. Much effort were
put into the toolbox during the project Swiftly Green but no examples have been put in
the toolbox since the project ended. Most likely, for a toolbox like Swiftly Green to be
used and to be more useful for many, it would require additional work as well as
continuous updates and maintenance.

105
References
Adell, E., Khan, J., Hiselius, L., Lund, E., Nelldal, B-L., Pettersson, F., Pålsson, H., Smidfelt
Rosqvist, L., & Wandel, S. (2016). Systemanalys av införande av HCT på väg i
Sverige. Environmental and Energy Systms Studies: Miljö- och energisystem,
Lunds Tekniska Högskola. Lund: Lunds universitet.
Andersson, D., Dubois, A., Halldorsson, A., Hedvall, K., Hulthén, K., Johansson, M.,
Rogerson, S., Sundquist, V. and Styhre, L. (2016). Transport service procurement –
initial findings and a research agenda. Proceedings of the IPSERA Conference, 20-
23 March, Dortmund, Germany.
Bijker, W. E, & Law, J. (Eds.). (1992). Shaping Technology/Building Society. Studies in
Sociotechnical Change. Cambridge, Ma.: MIT Press.
Cezanne, C., & Saglietto, L. (2015). Redefining the boundaries of the firm: The role of
4PLs. International Journal of Logistics Management, 26(1), 30-41.
Dubois, A., Hulthén, K., & Pedersen, A-C. (2004). Supply chains and interdependence: A
theoretical analysis. Journal of Purchasing & Supply Management, 10(1), 3-9.
European Commission (2011). White Paper on transport — Roadmap to a single
European transport area — Towards a competitive and resource-efficient
transport system. Luxembourg: Publications Office of the European Union.
Fröidh, O. (2013). Godstrafik på järnväg – åtgärder för ökad kapacitet på lång sikt.
Rapport TRITA-TSC-RR 13-003. Stockholm: KTH.
Hertz, S., & Alfredsson, M. (2003). Strategic Development of Third Party Logistics
Providers. Industrial Marketing Management, 32(2), 139-149.
Håkansson, H. (Ed.). (1987). Industrial Technological Development. A Network Approach.
London: Croom Helm.
Håkansson, H. (2006). Business Relationships and Networks: Consequences for
Economic Policy. Antitrust Bulletin, 51(1), 143-163.
Håkansson, H., & Waluszewski, A. (2007). Interaction: the only means to create use. In H.
Håkansson & A. Waluszewski (Eds.), Knowledge and Innovation in Business and
Industry: The importance of using others (pp. 147-167). London: Routledge.
Håkansson, H., Waluszewski, A., Prenkert, F., & Baraldi, E. (Eds.). (2009). Use of Science
and Technology in Business: Exploring the Impact of Using Activity for Systems,
Organizations, and People. Bingley: Emerald.
Ibarra, H., & Hunter, M. (2007). How Leaders Create and Use Networks. Harvard Business
Review, 85(1), 40-47.
Jensen, L-M. (2010). Opportunities and constraints for intermediaries in distribution:
The challenge of variety. The IMP Journal, 4(3), 194-219.
Lammgård, C., Andersson, D. (2014). Environmental considerations and trade-offs in
purchasing of transportation services. Research in Transportation Business and
Management. 10, 45-52.

106
Lammgård, C. (2007), Environmental Perspectives on Marketing of Freight Transports -
The Intermodal Road-Rail Case. PhD Thesis, Göteborg: BAS Publishing.
Miles, M. B., & Huberman, A. M. (1994). Qualitative Data Analysis. An Expanded
Sourcebook (2nd ed.). Thousand Oaks, Cal.: Sage Publications.
Morgan, G., & Smircich, L. (1980). The Case for Qualitative Research. Academy of
Management Review, 5(4), 491-500.
Ostrom, E. (2002). Managing Resources in the Global Commons. Journal of Business
Administration & Policy Analysis, 30/31, 401-413.
Olsen, P. I., Prenkert, F., Hoholm, T., & Harrison, D. (2014). The dynamics of networked
power in a concentrated business network. Journal of Business Research, 67(12),
2579-2589.
Oudshoorn, N., & Pinch, T. J. (2003). Introduction: How Users and Non-Users Matter. In
N. Oudshoorn & T. J. Pinch (Eds.), How Users Matter: The Co-Construction of Users
and Technologies (pp. 1-25). Cambridge, Ma: The MIT Press.
Prenkert, F. (2012). Commentary to “From new-product development to
commercialization through networks”. Journal of Business Research, 65(2), 207-
209.
McQuail, D. (2010). McQuail’s Mass Communication Theory (6th ed.). London: Sage.
Ragin, C. C., & Becker, H. S. (1992). What Is a Case?: Exploring the Foundations of Social
Inquiry. Cambridge, Ma: Cambridge University Press.
Stake, R. E. (2003). Case Studies. In N. K. Denzin & Y. S. Lincoln (Eds.), Strategies of
Qualitative Inquiry (2 ed., pp. 134-164). Thousand Oaks, Ca: Sage.
Vaughan, D. (1992). Theory elaboration: The heuristics of case analysis. In C. C. Ragin &
S. Becker (Eds.), What is a case? Exploring the foundations of social inquiry.
Cambridge, UK: Cambridge University Press.
von Hippel, E. (1976). The Dominant Role of Users in the Scientific Instrument
Innovation Process. Research Policy(5), 212-239.
von Hippel, E. (1986). Lead Users: A Source of Novel Product Concepts. Management
Science, 32(7), 791-805.
von Hippel, E. (1994). “Sticky Information” and the Locus of Problem Solving:
Implications for Innovation. Management Science, 40(4), 429-439.
Yin, R. K. (2009). Case Study Research: Design and Methods (4th ed.). Thousand Oaks, Ca:
Sage.

107
Appendix A: Summary of the Swiftly
Green project
SWIFTLY Green (Sweden-Italy Freight Transport and Logistics Green Corridor) is a
European Commission (TEN-T) funded project with a mission to support “greening”,
development of green logistics and transport, in the entire TEN-T network. The
SWIFTLY Green project has 13 partners from six countries). The project started 1
October and ended in December 2015 and was coordinated by CLOSER, Lindholmen
Science Park.
The overall question to be answered is:
“How can we foster a greening of transport – and can we turn policy aims into practice?”
Source: Report, Final Conference Report, Webinar 2015-11-26.
http://www.swiftlygreen.eu/sites/default/files/content/final_conference_report_26_no
v_2015_2.pdf. Accessed 2017-03-24.
How does Swiftly Green meet the political priorities?
By developing:
A set of measures for greening the transport corridor based on solutions
implemented both at Member States and European Level.
A delivery of a methodology to assess the performance of the implemented
measures.
A tool-box consisting of a set of guidelines and recommendations for actions to be
implemented in order to enhance TEN-T corridors
An establishment of greening corridor development plan.
Source:
http://www.swiftlygreen.eu/sites/default/files/content/1_sofia.papantoniadou_swiftly
_green.pdf. Accessed 2017-03-24.
For more information, turn to the Swiftly Green website:
http://www.swiftlygreen.eu/en/reports-material