Assessment of the Status of Dairying and Potential to ...
166
document subtitle] Study Number – 187 Assessment of the Status of Dairying and Potential to Improve Socio- Economic Status of the Milk Producers in West Bengal Debanshu Majumder Ranjan K. Biswas Bitan Mondal Ashok Sinha Study sponsored by Ministry of Agriculture and Farmers Welfare Government of India, New Delhi Agro-Economic Research Centre (For the States of West Bengal, Sikkim and Andaman & Nicobar Islands) Visva-Bharati, Santiniketan West Bengal October 2017
Transcript of Assessment of the Status of Dairying and Potential to ...

document subtitle]
Study Number – 187
Assessment of the Status of Dairying and Potential to Improve Socio-Economic Status of the Milk Producers in West Bengal
Debanshu Majumder
Ranjan K. Biswas Bitan Mondal Ashok Sinha
Study sponsored by Ministry of Agriculture and Farmers Welfare
Government of India, New Delhi
Agro-Economic Research Centre (For the States of West Bengal, Sikkim and Andaman & Nicobar Islands)
Visva-Bharati, Santiniketan West Bengal
October 2017

Study No –187
Assessment of the Status of Dairying and Potential to Improve
Socio-Economic Status of the Milk Producers in West Bengal
Debanshu Majumder
Ranjan K. Biswas
Bitan Mondal
Ashok Sinha
Study sponsored by Ministry of Agriculture and Farmers Welfare
Government of India, New Delhi
Agro-Economic Research Centre
(For the States of West Bengal, Sikkim and Andaman & Nicobar Islands)
Visva-Bharati, Santiniketan
West Bengal
October – 2017

Citation:
AERC (2017). Assessment of the Status of Dairying and Potential to Improve Socio-Economic
Status of the Milk Producers in West Bengal; Study No. - 187, Agro-Economic Research Centre
(For the States of West Bengal, Sikkim and Andaman & Nicobar Islands), Visva-Bharati,
Santiniketan, West Bengal, pp.- xxiv+139
Project Team:
Team Leader
Debanshu Majumder
Drafting and Report Writing
Debanshu Majumder
Ranjan K. Biswas
Bitan Mondal
Field Survey and Tabulation
Ashok Sinha
Vivekananda Datta
Debajit Roy
Nityananda Maji
Munsi Abdul Khaleque
Ranjan K. Biswas
Debanshu Majumder
Secretarial Assistance
Dibyendu Mondal
Parag Mitra
Debsankar Das
Amulya Ratan Patra
Coordinator
Agro-Economic Research Centre, Sardar Patel University, Vallabh Vidyanagar,
Anand, Gujarat.
Disclaimer: AERC Report No. 187© Agro-Economic Research Centre, Visva-Bharati, Santiniketan,
West Bengal.

Preface
The study on “Assessment of the Status of Dairying and Potential to Improve Socio-Economic
Status of the Milk Producers in West Bengal” is an All India Coordinated Study and was carried
out at the Agro-Economic Research Centre, Visva-Bharati, Santiniketan, West Bengal at the
instance of Ministry of Agriculture and Farmers Welfare, Government of India, New Delhi. The
task of coordination has been entrusted with Agro-Economic Research Centre, Sardar Patel
University, Vallabh Vidyanagar, Anand, Gujarat.
Dairying is an important and integral part of the rural economy of West Bengal, which is
perceived to be an effective instrument for bringing socio-economic transformation in the
state. It contributes nearly one-fifth to the agricultural value of output and provides
employment to about 2 million people, the majority of whom are resource-poor. Production of
total milk in the state has increased from a mere 35 lakh metric tones in 2000-01 to over 50
lakh metric tones in 2015-16. However, organized dairying is yet to achieve its full potential in
the state. Despite of impressive growth in milk production, productivity of dairy animals
continues to remain very low and milk marketing system is mostly dominated by unorganized
sector. The major share of milk production of the state is used for the manufacture of
traditional dairy products (channa) by unorganized sector. Further, not only the state has
predominantly indigenous cows, mostly non-descript, the infrastructure for milk procurement
and milk processing in the state is also very poor. Therefore, the state needs special attention
as it seems to be lagging behind in dairying as compared to several states in India. The present
study provides a detailed documentation of the dairy landscape in West Bengal.
The task of completion of this study was assigned to Debanshu Majumder, as Team Leader. He
was assisted by Ranjan Kumar Biswas, Ashok Sinha, Dabajit Roy, Vivekananda Datta, Munshi
Abdul Khaleque and Nityananda Maji in field survey, data entry and tabulation. Secretarial
assistance was provided by D. Mondal, D. Das, P. Mitra and A.R. Patra. B. Singh and S. Hansda
helped in the office maintenance. Dr. Bitan Mondal, Institute of Agriculture also helped in
compiling secondary information as well as in drafting the report.
We acknowledge the generosity of Prof. Swapan Kumar Dutta, Vice Chancellor (Officiating)
Visva-Bharati, and Madam Ms. Sangeeta Verma (Economic and Statistical Adviser) and Shri P. C.
Bodh (Adviser-AER Division) of Directorate of Economics and Statistics, Ministry of Agriculture
and Farmers Welfare, Government of India, New Delhi for their guidance and necessary support
in completion of the study. We also thank Prof. Bidhan C. Roy, Hony. Deputy Director, AER
Centre, Visva-Bharati, for his support and comments on the draft of the present study.
We are extremely indebted to Ms. Dora Saha, Manager, SAS, National Dairy Development
Board (NDDB), Kolkata, for her guidance and active support in course of the study without
which the present project would not have been completed.

ii
We are equally indebted to Dr. Amrita Patel, Former Chairman, NDDB, Anand and for her
guidance and useful suggestions/comments during the National Workshop cum Seminar held in
AER Centre, VVN, Anand. We thank our respected colleagues from the participating AER
Centres for their comments during the workshop. A word of appreciation is also to Mr. Biswajit
Bhattacharya, NDDB, Anand for his valued opinion and supplying secondary information
regarding dairying in the state.
We are deeply grateful to the Managing Directors, District Milk Unions of Bankura, Nadia, North
and South Twenty Four Parganas for providing the necessary data and support in course of
primary data collection.
We are particularly thankful to Prof. S. S. Kalamkar, Hon’ble Director, AERC, Vallabh Vidyanagar,
Anand, Gujarat for his effective coordination of the study and for his valuable suggestions and
comments which he rendered from time to time in course of the study.
Last but not the least; thanks are due to innumerable respondents in the villages who
ungrudgingly took the pain of answering to our questions for hours at end. We thank each one
of them for their invaluable support.
Prof. Amit Kumar Hazra
Registrar (Acting)
&
Hony. Director
Agro-Economic Research Centre
Visva –Bharati, Santiniketan

iii
Contents
Preface i-ii
List of Tables v-vii
List of Figures viii
List of Maps viii
Executive Summary ix-xxiv
Chapter I Dairy Development in West Bengal
1.1 Prelude
1.2 Role of Dairy Sector in State Economy of West Bengal
1.3 Trend in Contribution of Dairy in GSDP
1.4 Composition of Livestock & details on Cow and Buffalo Breeds
in West Bengal State
1.5 Planwise Outlay and Expenditure under Dairy Development
1.6 Growth in Milk Production and Productivity (Regional trend)
1.7 Milk Consumption and Marketable Surplus
1.8 Status of Availability of Feed and Fodder
1.9 Infrastructure Development
1.10 Need of the study
1.11Objectives of the study
1.12 Data and Methodology
1.13 Limitation of the Study
1.14 Organization of Report
1-39 1
4
6
7
15
16
23
25
27
29
31
32
38
39
Chapter II Status of Dairy Development Institutions in West Bengal 2.1 Introduction
2.2 Dairy Development Institutions
40-61 40
40
Chapter III Policies and Programmes/ Schemes for Dairy
Development 3.1 Introduction
3.2 Animal Husbandry and Dairy Development
62-67
62
63
Chapter IV Socio-Economic Profile of Selected Milk Unions,
PDCS/Private Units and Milk Producers 4.1 About Selected Study Area and Milk Unions
4.2 About the Study Villages
4.3 About Sample PDCS & Private Dairy Units
4.4 About the Sample Households
4.5 Chapter Summary
68-83
68
72
76
78
82

iv
Chapter V Cost of Milk Production & Awareness about the Schemes 5.1 Introduction
5.2 Breedable Animals
5.3 Labour Use Pattern
5.4 Details on Feed/Fodder and Water
5.5 Details on Veterinary and Breeding Services and Expenditures
5.6 Awareness about the Schemes
5.7 Cost of Milk Production
5.8 Chapter Summary
84-101 84
84
88
89
93
94
96
99
Chapter VI Milk Consumption and Marketable Surplus 6.1 Introduction
6.2 Use of Milk at Home and Processing
6.3 Sale of Milk and Cost of Milk Marketing
6.4 Handling of Income from Dairying
6.5 Problems in Milk Marketing
6.6 Chapter Summary
102-110 102
102
104
107
108
109
Chapter VII Constrains faced in Production and Marketing of Milk
and Suggestions 7.1 Introduction
7.2 Service Delivery System
7.3 Infrastructural Constraints
7.4 Economic Constraints
7.5 Marketing Constraints
7.6 Technical Constraints
7.7 Socio-Psychological Constraints
7.8 Other Constraints
7.9 Suggestions
7.10 Constraints faced by PDCS /Private Dairy Units
7.11 Constraints faced by Milk Unions
7.12 Chapter Summary
111-130
111
111
115
117
118
119
119
120
122
123
126
128
Chapter VIII Conclusions and Recommendations 8.1 Conclusions
8.2 Suggestions
131-134 131
133
References 135-137
Annexures 138-139

v
List of Tables
Table
No. Title of the Table Page
1.1 Contribution of Gross Value of Output and Gross Value Added from
Agriculture and Livestock Sector to Total GSDP at Current Prices of West
Bengal State
7
1.2 Value of Output: Agriculture and Livestock 8
1.3 Growth of the Livestock in West Bengal and India 9
1.4 Species-wise Livestock Population & its Share in Total Livestock 9
1.5 Growth in Livestock Population in West Bengal - 1951 to 2012 10
1.6 District wise Percentage share of Animals in Total Livestock Population 12
1.7 District-wise Livestock and Bovine Density (1992-2012) 13
1.8 Distribution of West Bengal’s Cattle Breeds 13
1.9 Performance of Cattle and Buffalo Breeds 14
1.10 Livestock per 100 Households across Landholding Size: West Bengal 14
1.11 No of Major Livestock Species per 100 Households across Landholding
Size in West Bengal (1982 & 1992)
15
1.12 Number per 1000 of Households Reporting Owning Livestock of Different
Types for Each Size Class of Households Operational Holdings in West
Bengal (Rural) 2002-03
16
1.13 Plan-wise Outlay and Expenditure on Animal Husbandry and Dairy
Development in West Bengal
18
1.14 Milk Production in West Bengal: 2000-01 to 2015-16 19
1.15 District-wise & Category-wise Percentage Share of Milk Production in
West Bengal
22
1.16 Milk Utilisation Pattern in Households in West Bengal (1997-98 to 2015-
16)
25
1.17 Dry matter Availability, Requirement and Surplus/Deficit in West Bengal 26
1.18 Veterinary Infrastructure and Manpower in West Bengal State 28
1.19 Growth in Infrastructure Facilities for Animal Husbandry in West Bengal 28
1.20 District wise Number of Veterinary Institutions in West Bengal (2012 –
2013)
29
1.21 Details about Bulk Cooler, Automatic Milk Collection Systems and Chilling
Centres facility with Dairy Cooperative Societies in West Bengal
30
1.22 Selected Three Agro-Climatic Regions in West Bengal 33
1.23 Sampling Frameworks 34
1.24 Total numbers of selected DCS and NDCS Milk Producers in West Bengal
state
34
1.25 Selected villages/talukas/districts/Milk unions in West Bengal 35
2.1 Institutions Responsible for Dairy Development and their responsibilities 40
2.2 Physical Capacities and Capacity Utilization in different dairies 42
2.3 Status of Chilling Plants of Directorate of Dairy Development 43

vi
2.4 Dairy-wise Utilization of Raw Materials and Production of Milk & Milk
Products
44
2.5 Production of Milk and Milk Products 44
2.6 Schemes of the Directorate of Dairy Development (2012 - 2013) 44
2.7 Procurement Price of Raw Milk per kg (4.5% Fat / 8.5% SNF) 49
2.8 Daily average Milk Procurement from DCS / WDCS of the Milk Unions
during the year 2013 - 14
50
2.9 A Brief Account of Different Projects during 2013 -14 (in Rs. Lakh) 52
2.10 Details of National Dairy Plan-I (NDP-I) (2013-14) in Different Milk
Unions (in Rs. Lakh)
54
2.11 Profit & Loss Status of Milk Unions (in Rs. Lakh) 55
2.12 Physical Achievements of WBCMPF 56
2.13 Infrastructure as on 31st March 2014 in Co-op Sector 57
2.14 Performance of Milk Union during 2013-14 58
2.15 Performance at Glance 60
2.16 District-wise Outlets of Mother Dairy Calcutta 61
3.1 Central schemes for Animal Husbandry Development 63
3.2 State Schemes 66
3.3 Central Schemes for Dairy development in the State 66
3.4 State Schemes for Dairy Development 67
4.1 Selected Milk Producers’ Cooperative Unions inWest Bengal 69
4.2 Details of Selected Milk Producers’ Cooperative Unions in West Bengal
2015-16
69
4.3 Milk Unions in the Selected Districts 71
4.4 Number of Milk Cooperative Societies in West Bengal 72
4.5 Milk Processing Plants in the Sample District 72
4.6 Details of Production and Marketing of Processed Products by Selected
Milk Producers’ Cooperative Unions in West Bengal 2015-16
73
4.8 Basic details of Selected DCS Villages (2011 Census) 74
4.9 Basic details of Selected NDCS Villages (2011 Census) 75
4.10 Profile of Selected PDCS & Private Dairy Units in West Bengal 2015-16 77
4.11 Family Profile of Selected Households 78
4.12 Socio-Economic Characteristics of Selected Households 80
4.13 Cropping Pattern of Sample Households (2015-16) 81
5.1 Details on Herd Strength & Cattle Shed – DCS Households 85
5.2 Details on Herd Strength & Cattle Shed – NDCS Households 85
5.3 Details of Animals Breeds for DCS & NDCS 86
5.4 Details of Breedable Animals with DCS Households on Survey Date 86
5.5 Details of Breedable Animals with NDCS Households on Survey Date 87
5.6 Season-wise Milk Yield (Per day) of Selected HH 2015-16 87
5.7 Labour Use Pattern -DCS Households 88
5.8 Labour Use Pattern -NDCS Households 89
5.9 Details of Feed and Fodder (at the Time of Survey) 90

vii
5.10 Availability of Water for Dairy activities- DCS households 91
5.11 Availability of Water for Dairy activities- NDCS households 92
5.12 Details of Veterinary and Breeding Expenditure During Last One Year DCS
Households
93
5.13 Details of Veterinary and Breeding Expenditure During Last One Year
NDCS Households
94
5.14 Details on Awareness About Various Schemes 95
5.15 Cost of Cow Milk Production and Net Returns- DCS households 97
5.16 Cost of Cow Milk Production and Net Returns- NDCS households 98
6.1 Production and Use of Milk by selected DCS Households (day of visit) 103
6.2 Production and Use of Milk by selected NDCS Households (day of visit) 103
6.3 Sale of Milk and Cost of Milk Marketing- DCS Households 105
6.4 Sale of Milk and Cost of Milk Marketing- NDCS Households 106
6.5 Details about Income received from Dairying and its use 107
7.1 Details of Input and Output Service Delivery Experienced by DCS
households
112
7.2 Details of Input and Output Service Delivery Experienced by NDCS
households
114
7.3 Details on Infrastructural Constraints faced by Selected Households 116
7.4 Details on Economic Constraints faced by Selected Households 117
7.5 Details on Marketing Constraints faced by Selected Households 118
7.6 Details on Technical Constraints faced by Selected Households 119
7.7 Details on Socio-Psychological Constraints faced by Selected Households 120
7.8 Details on Other Constraints faced by Selected Households 121
7.9 Suggestions for improvement in adoption of dairy schemes 123
7.10 Milk Supply related Constraints faced by the PDCS & Private Dairy Units 124
7.11 Infrastructure related Constraints faced by the PDCS & Private Dairy
Units
125
7.12 Market related Constraints faced by the PDCS & Private Dairy Units 125
7.13 Constraints faced by Milk Unions-West Bengal 127

viii
List of Figures
Figure No. Title of the Figure Page
1.1 Contribution of Gross Value of Output from Livestock sector to
Agriculture (At current price) in West Bengal: 2004-05 to 2013-14
6
1.2 Species-wise Share in Total livestock Population in West Bengal (1961-
2012)
10
1.3 District wise Share in Total Livestock Population in West Bengal 2012
(%)
11
1.4 Plan wise Outlay & Expenditure on Animal Husbandry & Dairy
Development in West Bengal State
17
1.5 Trends in Total Milk production in West Bengal state (2000-01 to 2015-
16)
19
1.6 Species wise Trends in Total Milk Productivity in West Bengal state 20
1.7 Year wise In milk Bovine Population, Milk Yield and Bovine Milk
Production
21
1.8 District wise Milk Production in West Bengal (2015-16) 21
1.9 Species wise District wise Milk Yield (kg/day) 2014-15 23
1.10 District wise Milk Production Density and Per Capita Availability of Milk
(2012-13)
25
1.11 District wise Area under Fodder Crops in West Bengal 2007-08 27
2.1 Daily Average Milk Procurement and Percent procured by different
Milk Unions
50
List of Maps
Map No. Title of the Maps Page
1.1 District wise Yield of Species 24
1.2 Six Agro-Climatic Regions of West Bengal 36
1.3 Selected Agro-Climatic Regions of West Bengal 37

ix
Executive Summary
E1.1 Introduction
Dairying plays a vital role in rural economy by providing employment and income generating
opportunities particularly for small, marginal and women farmers and landless labourers.
Bullocks and milch animal are the main support of agricultural operations and also a major
source of supplementary income to the marginal and small farmer and landless agricultural
labourers. On the other hand, the by-products of agricultural produce happen to be the chief
ingredients of food for cattle and milch animals. The requisite labour for keeping dairy animals
is also available from within the farmer’s family. A very large portion of female labour force of
cultivator households gets self-employment in several occupations allied to cattle and buffalo
rearing.
E1.2 Need of the study
Over the periods since independence shift from cultivators to agriculture labourers has been
significant in West Bengal. There is a critical need for generating adequate employment
opportunities for these groups of population. Dairy farming may become an alternative way of
livelihood. However, the productivity levels of milch animals are quite low and that the genetic
pool of the milch animal population is of low quality, despite the fact that this region has
relatively superior resource endowment.
The dairy cooperative structure has been rather weak in these parts of the country in terms of
coverage of dairy cooperatives in villages, milk producers and share of milk procurement in
surplus milk. But there is immense potentiality for using agricultural wastes as cheap and
economical cattle ration. Moreover, preponderance of indigenous animals in the study area
could minimise the impact of climatic variability as they are more resilient to such changes.
It is in this light we had taken up the study with following objectives.
E1.3 Objectives of the study
a) To assess the present status of dairying with reference to animal distribution, milk
production, consumption and marketable surplus.

x
b) To identify the constraints in dairy development from supply side, institutional deficiency
and processing infrastructure.
c) To identify different central and state government schemes related to dairy development
at district level and document technical as well as operational details of the schemes and
understand how convergence is ensured.
d) To highlight the facilitating factors that could help promoting dairy development to
improve socio economic status of the milk producers.
e) To suggest broad areas for focussed interventions for promoting dairy development in the
selected state and the way forward.
f) To suggest suitable policy measures to ensure compliance of effective convergence of
various schemes for the benefits of dairy farmers.
E1.4 Data and Methodology
The study is based on both, the secondary and primary level data. The secondary data pertain
to dairy development efforts and information as regards to various schemes implemented by
the government while primary data from villages were collected using a multistage sampling
procedure.
Four districts (viz. Bankura, Nadia, North 24 Parganas and South 24 Parganas) were selected
from 3 respective agro-climatic regions of the state in consultation with National Dairy
Development Board (NDDB), Kolkata. In each district two CD blocks (one having close proximity
with District HQ and the other one a far-away) were chosen at the second stage. In the next
stage, two villages were so selected that one having Dairy Cooperative Society and the other
did not come under such coverage (henceforth DCS & NDCS villages). Thus, total numbers of
selected villages in the State were 16. From each selected village, 15 milk producers (5 from
each category of small, medium and large milk producers) were selected randomly adding to a
total sample of 240 milk producers in the State. All milk producers were interviewed with a
structured questionnaire. In addition, data on parameters related cost of milk production were
collected from 03 milk producers from each village (one each from three categories), thus total
48 milk producers.

xi
Officials of every District Milk Union (DMU) and Primary Dairy Cooperative Society (PDCS) were
interviewed and data were collected with a structured schedule.
E1.5 Limitation of the Study
The most important limitation of this study is that published information for Animal Husbandry
and Dairying in West Bengal state is too scanty than the requirement of the study. This
restricted us to analyse few important dimension of the study, as compared to other states,
which requires comparable and continuous time-series data on several variables related to
dairying and animal husbandry in West Bengal.
E1.6 Findings from Secondary Data
E1.6.1 Trend in Contribution of Dairy in GSDP in West Bengal
Animal husbandry plays an important role in rural economy of West Bengal state. The
contribution of Livestock was 4.30 per cent to the state GSDP in 2013-14. On the other hand,
the contribution of agriculture to total GSDP was 12.35 per cent. The contribution of agriculture
and livestock to total GSDP was estimated to be 16.64 per cent, while contribution of livestock
to agriculture and livestock together was nearly 26 per cent. Thus, more than one fourth of the
agriculture sector output comes from livestock sector. The share of GVO from livestock to
agriculture sector has remained between 20.57 - 25.81 per cent with some little fluctuation
during the last one and half decade.
Livestock contributes more than 20 per cent to the agricultural GDP of West Bengal and is one
of the biggest sectors for supporting livelihood in the state. Livestock output at constant prices
was reported at Rs. 288.75 billion in 2011-12 (at constant prices), of which milk contributes
about 47.15 per cent or Rs. 136.16 billion.
E1.6.2 Composition of Livestock & details on Cow and Buffalo Breeds in West
Bengal
However, over the period, share of cattle population in total livestock population has declined
from 65.45 per cent in 1961 to 54.42 per cent in 2012. The share of buffalo population has also
decreased considerably (5.62% to 1.97%) during the corresponding period. In absolute term,
the rate of cattle population increases by 43.90%, while the rate of buffalo population

xii
decreases by 39.45 %. In case of small ruminants, sheep population has increased by 101 per
cent and goat population increased by 154.95 per cent in 2012 over 1961. Total livestock
population in West Bengal has increased by 73.07 per cent during last five decades period.
The State has some high-quality and high-yielding breeds of cattle and buffaloes. Sahiwal, Gir,
Jersey and Holstein Friesian breeds in cows, and Murrah breed in buffaloes were known for
their high milk yielding capacity. The Jersey breed is found in all over the state of West Bengal.
But till today, indigenous breeds are predominant in the state.
E1.6.3 Plan wise Outlay and Expenditure under Dairy Development
The State Government policy has been providing necessary support for dairy development in
the state through cooperative sector. However, percentage share of expenditure on dairy
development to total expenditure has declined considerably. As compared to around 41.29 per
cent share of total expenditure on dairy development during 1974-1978, it has declined to
10.69 per cent during the period of 2002-03 to 2011-12.
E1.6.4 Growth in Milk Production and Productivity in West Bengal
Most of the animals in West Bengal are Zebu cattle i.e. non descriptive cow whose productivity
is very low. In order to improve the productivity of Bengal desi cow, Artificial Insemination (AI)
with frozen semen of quality breeds is being extensively carried out. The entire breedable cow
population in the state is being tried to be brought under the coverage of AI at the Gram
Panchayat (GP) level. Moreover co-operative unions are also responsible for performing AI
under their care. They also supply feed, fodder seeds etc. to the beneficiary farmers which in
turn help to improve the milk production of the state.
The milk production has increased from 35 lakh tonnes in 2000-2001 to 49.6 lakh tonnes in
2014-15 registering a growth of 41.71 per cent over base year. As a result, the per capita
availability of milk in the state increased from 116 gms/day in 2000-01 to 145 gms/day in 2014-
15.

xiii
Out of total bovine milk production in 2015-16, 62.32 per cent share accounts for Indigenous
cattle, 32.79 per cent share accounts for Crossbred cows and remaining 4.89 per cent was of
Buffalo breed.
E1.6.5 Milk Consumption and Marketable Surplus
On the basis of availability of data on milk utilisation pattern in West Bengal, it has been found
that out of total production of milk at home, about 65 per cent was sold, while 22 per cent milk
was consumed at the home and remaining 13 per cent milk was converted into milk products in
2014-15.
E1.6.6 Status of Availability of Feed and Fodder
As against the estimated animals’ requirements of dry matter, feed resources available in West
Bengal are lower. In the last almost one and half decade (1997 to 2011), shortage of dry matter
in the State reduced from 57.86 per cent of the requirement to 46.91 per cent.
Green fodder is a comparatively economical source of nutrients. However, the availability of
green fodder is also lower than estimated requirement in West Bengal. The estimation in 2007-
08 regarding area under fodder crops indicated that only 0.04 per cent area to the gross sown
area of 9752 thousand hectare was under fodder cultivation in West Bengal.
In West Bengal, there is absence of regulated and organized fodder market. Small scale
marketing of fodder exists in all rural areas where fodder is sold by producers to traders or
directly to the consumers.
E1.6.7 Infrastructure Development
For veterinary Services, 110 State Animal Health Centre (SAHC) & District Veterinary Hospital
(DVH), 341 Block Animal Health Centre (BAHC), 273 Additional Block Animal Health Centre
(ABAHC), 3248 Animal Development Aid Centre (ADAC) and 5744 Artificial Insemination Centre
(AIC) are working at present. Still these facilities are not available in the interior villages. The
state has no any facility for Mobile Animal Health Centre. In case of Cattle Breeding Farm, the
West Bengal state has 7 Breeding Farms in Haringhata, Kurseong, Salboni, Suri, Kharagpur,
xiv
Kalyani, and Beldanga. These Breeding Farms are operating since 1990-91. There are seventeen
Co-operative Milk Unions as well as Co-operative Dairy Unions in West Bengal.
E1.6.8 Dairy Development Institutions in West Bengal
A. Directorate of Dairy Development:
Directorate of Dairy Development, Government of West Bengal is engaged in the processing
of raw milk to produce pasteurised and homogenised market milk and various milk products,
and sells them through its own network of Milk booths, Suravis, Agents and Distributors in
safe and wholesome condition. With the implementation of Operation Flood Programme in
the mid-1970s, the extension, procurement and other farmer related activities on Dairy
Development have been handed over to the Co-operative sector, i.e.; West Bengal Co-
operative Milk Producers’ Federation Limited.
B. West Bengal Co-Operative Milk Producers’ Federation Ltd.
West Bengal Co-operative Milk Producers’ Federation Ltd. (Federation) was formed as an
apex body of milk cooperatives in West Bengal for developing the dairy industry.
The Federation has implemented the Women Dairy Co-operative Project (WDCP) funded by
the Ministry of HRD, Govt., of India and thereby empowering the Women economically and
socially.
Funded by the Ministry of Agriculture, Govt. of India the Federation is also
implementing Integrated Dairy Development Project (IDDP) in the hilly, Non-OF and
backward areas of West Bengal.
C. Mother Dairy Calcutta (MDC)
Apart from Directorate of Dairy Development and West Bengal Co-operative Milk Producers
Federation, Mother Dairy Calcutta is also providing necessary support towards dairy
development in the state through its own infrastructural and managerial capabilities. Today
Mother Dairy has become a household name in case dairy products to the urban consumers of
the state especially greater Kolkata and neighbouring towns.

xv
E1.6.9 Policies and Programmes / Schemes for Dairy Development
In West Bengal, the Animal Resources Development Department is responsible for the formulation
and implementation of Livestock and Poultry policies and programmes of the state. The
following participatory branches including a university under this department are looking after
the successful implementation of all the projects and schemes of the Department (NDDB, 2017):
1. Directorate of Animal Resources & Animal Health (DAR&AH)
2. Directorate of Dairy Development
3. Paschim Banga Go-Sampad Bikash Sanstha (PBGSBS)
4. West Bengal University of Animal and Fishery Sciences (WBUAFS)
5. West Bengal Cooperative Milk Producers’ Federation Ltd. (WBCMPF)
6. West Bengal Dairy & Poultry Development Corporation Limited (DAIRPOUL)
7. West Bengal Livestock Development Board
8. Mother Dairy
9. West Bengal Veterinary Council
10. The Calcutta Society for the Prevention of Cruelty to Animals (CSPCA)
E1.7 Findings from Primary Survey
E1.7.1 About Selected Study Area, Sample Households and Milk Unions
In all districts barring South Twenty Four Parganas, the milk unions cover over five hundred
villages in respective districts. Activities of Sundarban MU have been rejuvenated in 2015 and
were found to grow in a steady pace during the time of survey.
The number of cooperative societies under the jurisdiction of the milk unions was highest in
Bankura (350) while it was lowest in South Twenty Four Parganas (44). However, the milk
procurement/collection figures reveal that Nadia topping the list with 143.3 lakh kilograms of
liquid milk from the cooperative societies per annum.
As far as milk processing plants are concerned, all the districts of the present study did not have
such plants. Of the four, Bankura, Nadia and North Twenty Four Parganas had milk processing

xvi
plants situated in the district. South Twenty Four Parganas did not have such facility. Even in
the former three districts the plants generally processed liquid milk of various standards.
On the whole the villages (both DCS and NDCS) in four districts were placed more or less at par
in respect of the basic socio-economic parameters with a little difference among them.
In terms of average family size the households of four districts (both DCS and NDCS villages)
reveal similar pattern. The average family size in aggregate was around 4.3-4.4 in DCS and NDCS
villages. Average age of respondents varied between 46.7 to 50 years while average age of the
family was around 37 years. It was also interesting to find that average age of female
respondents was significantly lower than that of male respondents in all four district
irrespective of DCS or not. In the households under present enquiry the education scenario was
found quite dismal.
Population composition in respect of religious groups revealed that in all villages, people from
Hindu religious belief dominate the social scenario of whom people from the Scheduled and
other backward communities are of sizeable proportion in the respective size-classes.
Scheduled Tribes were few in number.
Families in both DCS and NDCS villages were mostly farming families pursuing cultivation as
their principal occupation. Most of the households took up dairy enterprise as their subsidiary
source of income even in the DCS villages. In the DCS villages the size of average operated land
had been 0.28 hectares in contrast to 0.40 hectares of average operational land in the NDCS
villages. In a sense the farmers of the villages without dairy cooperatives are marginally better off than
their DCS counterparts.
The general crop rotation practice throughout the year could be described by Rice followed by
Potato and Mustard followed by Rice once again in Kharif, Rabi and Summer seasons
respectively.
E1.7.2 Cost of Milk Production and Awareness about Schemes
Breedable Animals
In DCS villages herd strength of local milch animals were higher than that in the NDCS villages

xvii
across all size-classes. But when it came to rearing of cross bred animals, NDCS farmers owned
more cross bred cow than the former ones. So far as the cattle sheds are concerned NDCS
farmers were found to own more sheds on an average for their cattle than DCS farmers.
Average age of the breedable local cows in the DCS villages was 6 years in aggregate of all size-
classes while for cross bred cow average age had been 5 years. Average age at first calving for
local cows was higher than the cross bred cows in both the areas. Lactation order was found
more or less same for all types of farmers with marginal variation among the village clusters
and size-classes.
A dismal scenario was observed as regards to insurance coverage for the cattle.
Labour Use Pattern
In both DCS and NDCS villages no hired labour had been employed for dairy operations. It is
noteworthy to mention that in DCS villages across all size-class participation of women family
members had been higher both in terms of number per day as well as hours of involvement in
such activities. Moreover they had been members of DCS too.
Details on Feed/Fodder and Water
NDCS households across all size-classes were feeding their cattle with more of dry and green
fodder and supplements as compared to the DCS farmers. In case for concentrates DCS and
NDCS farmers were applying prepared cattle feed in more or less equal quantity. In case of
cross bred cow, however, feeding was higher among the DCS households than their NDCS
counterparts. Average grazing hours for local cattle was 3.4-3.8 hours while it was 2.5 for cross
bred cattle.
In the villages of the present study (both DCS & NDCS) normal water of adequate quantity was
reported by the respondents. The main source of water for dairy had been tube wells
supplemented by farm ponds and open wells.
Details on Veterinary and Breeding Services and Expenditures
Most of the animals in DCS and NDCS villages across size-classes received vaccines like HS, BQ
and FMD. Vaccination among the small size-class had been a little lower as compared with the

xviii
other two size-classes. Use of vaccines for cross bred cows was marginally higher than the local
cows. Artificial insemination (AI) had been the main method of conception for the cattle.
Awareness about the Schemes
Knowledge and awareness regarding vaccination and AI schemes had been to the fullest extent.
But when the question boiled down to awareness about other schemes there was sharp
contrast between the farmers of DCS and NDCS villages. For the DCS farmers knowledge had
been imparted by the milk cooperatives and milk unions functioning in the area. For the NDCS
farmers, however, source of their awareness had been fellow farmers and neighbours.
Most of the benefitted DCS farmers seemed to be satisfied with the assistance they received
through the several schemes and reported quality of the material had been up to their
expectation.
Cost of Milk Production
For calculating cost and returns we had imputed the value of family labour with ruling wages
rates for male and female. It is observed that labour cost has been the main component of total
cost in all cases. The proportion of labour component, however, was found decreasing with
increase in the size-class of both DCS and NDCS villages. The prices offered by the private
agents were lower than the prices paid by the local dairy cooperatives.
Coming to the question of net returns per day per animal, we are faced with a situation where
farmers were incurring heavy losses. Barring only two categories of middle and large farmers
rearing cross bred cows in both types of villages all other farmers were suffering sizeable
amount of net losses per day. But if the imputed value of labour gets deducted from total cost
the households across each and every size-class and for all types of cows earned substantial
positive profit per day per animal. It might have been due to over-optimal usage of family
labour in dairy activities.

xix
E1.7.3 Milk Consumption and Marketable Surplus
Use of Milk at Home and Processing
In the DCS households data for milk drawn per animal per day revealed that the quantity of
milk drawn per local cow was 2.64 litres for the DCS village while it had been 5.65 litres for
cross bred cow. For NDCS households, however, quantities were to the tune of 2.93 litres and
5.45 litres respectively.
General practice among the farmers of all categories was to sell out bulk of the liquid milk. It
was interesting to note that in both cases milk of cross bred cow was sold directly in greater
proportion than the milk of local cow. This in a way points towards household’s preference for
milk of the local cow for their own consumption.
Sale of Milk and Cost of Milk Marketing
In all size-class categories the percentage of sale by the DCS farmers to milk cooperatives
accounted for over 85 per cent. For NDCS farmers, however, proportion of total sales, being
around 85 per cent, had been given to the private vendors and middlemen.
The price offered by cooperatives had always been higher than the price offered by the private
ones. Payments by DCS were generally transferred to suppliers’ bank accounts on weekly basis
whereas payments from local vendors were received after a month including delayed
payments.
Handling of Income from Dairying
Involvement of women members in receiving income from sale of milk was found in both DCS
and NDCS families. As far as income from sale of cow dung, cow dung cakes and farm yard
manure, women had almost unquestionable authority of receiving the income in both types of
villages. Share of expenses for family maintenance had been higher in comparison with the
share of expenses for dairy activities from sales proceeds of milk. However, income from dung
sale was switched towards upkeep of the cattle herd in greater proportion with some inter size-
class variations.

xx
Problems in Milk Marketing
The milk cooperatives, though operating in every district, were too small in number to rope in
the large number of small milk producers in respective areas under their coverage. Moreover,
their procurement capacity had been rather small as compared to the supply of liquid milk. And
these cooperatives were faced with competition from the enumerable private intermediaries
who collected the milk from producer’s door steps. Moreover, there existed problems of milk
adulteration and malpractice by the small private players as complained by some of the DCS
members.
E1.7.4 Constraints
Constrains faced by Milk Producers
Delivery of cattle feed from the DCS and private agents were found inadequate. Most of the
households could purchase cattle feed on credit from private agents only. There was no
provision of credit from the dairy cooperatives. Cattle feed and mineral mixtures, when
purchased from open market or private agents had been much costlier than that been supplied
by the cooperatives.
Emergency veterinary service in general was made available by the private agents in all the
villages though charges for such had been high. Vaccines too, been supplied by the private
agents, were inadequate in supply and poor in quality. Semen had also been insufficient in
supply.
All the milk producers found the milk procurement price to be low whether being disposed with
cooperatives or private vendors. However, the regularity of payment differed between the
societies and vendors. There had been no incentive bonus and advance payment to the
producers either by cooperative societies or the private agents for supplying milk.
As of infrastructure, it was found that the households mainly suffered from lack of improved
equipment and training facilities, irregularity of supply of cattle feed, vaccines, semen at AI
centre and infrequent visit of veterinary staff. Both DCS and NDCS households were

xxi
complaining against poor conception rate through AI, poor knowledge about proper feeding
and health care and cheap and scientific housing for animals.
High cost of feed and mineral mixture, veterinary medicines emergency veterinary services
added with low price of milk are major economic hurdles. Main constraints for DCS and NDCS
farmers turned out to be lack of purchasing power resulting out of lower socio-economic
conditions.
Constraints faced by PDCS
All the DCS were of the opinion that the average milk yield in the respective areas was
sometimes low. Unavailability of emergency veterinary services and infrequent visit by
veterinary staff had been a serious obstacle in Nadia, North and South Twenty Four Parganas.
Large number of small producers in Nadia and South Twenty Four Parganas posed serious
problem of monitoring and follow-up activities by the DCSs.
Market related constraints included DCS’s inability to market value added milk products in all
districts. In fact there was no provision at the DCS level to process milk and produce value
added products.
Constraints faced by Milk Unions
There was deficiency in skilled manpower of which all the milk unions were suffering.
Technical constraints included unavailability of required inputs, technical knowhow and
instruments to detect adulterants in milk, state of the art technology for quick fat detection.
As far as the governance issues were concerned, it was observed that some of the milk unions
were looking for autonomy and staff recruitment for smooth functioning and monitoring of the
MU and the DCSs. Formation of new Board of Directors and reduction in political intervention
was also necessary.
Gradual increase in overhead expenditure coupled with decreasing quantum of milk
procurement had resulted in a severe financial crisis in the districts of Nadia and North Twenty
Four Parganas.

xxii
E1.8 Conclusions
• The State and Central Government policy has been providing some support for dairy
development in the state of West Bengal through co-operative sector. However, as
against the estimated animals’ requirements, feed resources available in West Bengal
are lower. In West Bengal, however, there exists high incidence of non-descript cows in
comparison with the crossbred varieties.
• In terms of socio-economic parameters villages of four districts (both DCS and NDCS
villages) reveal more or less similar pattern. Families were mostly farming families
pursuing cultivation as their principal occupation. Most of the households took up dairy
enterprise as their subsidiary source of income. In the villages dairy enterprise was
being run solely by family labour. It is noteworthy to mention participation of women
family members remained crucial for such operation.
• Poor state of awareness about various dairy developments schemes were observed
among the NDCS households. A dismal scenario was observed as regards to insurance
coverage for the cattle in all the villages regardless of DCS or NDCS.
• It is observed that labour cost has been the main component of total cost in all cases.
There might be over optimal use of family labour.
• The milk cooperatives, though operating in every district, were too small in number to
wrap the large number of small milk producers in respective areas. Moreover, their
procurement capacity had been rather small as compared to the supply of liquid milk.
• Service delivery of cattle feed and fodder was found inadequate. Cattle feed and
mineral mixtures, when purchased from open market or private agents had been much
costlier.
• Procurement price of milk had been non-remunerative for the farmers whether
purchased by cooperatives or private vendors.
• As of infrastructure, the households suffered from lack of improved equipment, training
facilities, irregularity of supply of cattle feed, vaccines, semen at AI centre and
infrequent visit of veterinary staff. Charges for emergency veterinary service provided
by private agents had been high.

xxiii
• All the DCS were of the opinion that the average milk yield in the respective areas was
sometimes low. Unavailability of emergency veterinary services and infrequent visit by
veterinary staff had been a serious obstacle. Large number of small producers also
posed serious problem of monitoring and follow-up activities by the DCSs.
• There was severe deficiency in skilled manpower of which all the milk unions were
suffering. Technical constraints included unavailability of required inputs, technical
knowhow and instruments to detect adulterants in milk, state of the art technology for
quick fat detection. As far as the governance issues were concerned, it was observed
that some of the milk unions were looking for autonomy and staff recruitment for
smooth functioning and monitoring of the MU and the DCSs. Gradual decrease in
quantum of milk procurement has posed serious threat.
E1.9 Recommendations
• Innumerable small dairy farms are to be fastened in some sort of milk chain by the
cooperative societies. So, there is urgent need to enhance the number of PDCS in each
district to reduce the exploitation by private vendors.
• The infrastructure for milk procurement and transportation should be improved at the
DCS level.
• Enhanced operation of DCS offering remunerative price to farmers can motivate them in
joining the society and at the same time this partnership would be able to make a dent
in farmers’ economic hardship.
• Service delivery of feed and fodder to be enhanced. Provision for vaccinations and
emergency veterinary services including AI needed to be boosted. In this aspect DCSs
working at the village level could play an important role.
• Re-orientation and proper implementation of government policies for dairy
development at the grassroots must be taken care of. And in view of such re-orientation
more autonomy and funds are to be provided to DCS.
• For increasing awareness regarding scientific dairy farming new training programmes
need to be arranged especially for the women. These might be able serve twin purposes

xxiv
of imparting improved consciousness among women regarding dairy farming and might
as well be supportive for women empowerment in the village society.
• It remained essential that the farmers be motivated to insure their cattle for it
minimized the risk. Procedural changes, if necessary, can be thought of so that the
farmers can avail these benefits. Outreach of the facility needs to be provided at the
village level. For DCS membership insuring cattle might be made a mandatory criterion.
• The DCSs were of opinion that there had been fluctuations in milk yield across seasons.
Proper and scientific dairy practices backed by better awareness supported by
government veterinary and DCS staff might be able to bring about a change in such
paucity.
• The milk unions might be provided with skilled manpower for proper implementation
and monitoring of the operations of DCS. More autonomy in MUs’ functioning might be
necessary and political intervention must be restricted.
• Establishing milk processing plants in the districts are of urgent importance for
production of value added milk products that would ensure higher return.
• Offering remunerative price for milk is a decision that depends on the policy of the
government. In face of rising cost a hike in procurement price may be thought of which
in turn would motivate and improve economic conditions of the farmers.
• As such there are ample central and state sector schemes for development of animal
husbandry in general and dairy expansion in particular. Convergences of many of such
schemes were found in the survey area of this present study. But the scope and
coverage seemed somewhat restrictive. Policy re-orientation might be sought for
rejuvenating the dairy sector in the villages of West Bengal.
1
Chapter I
Introduction
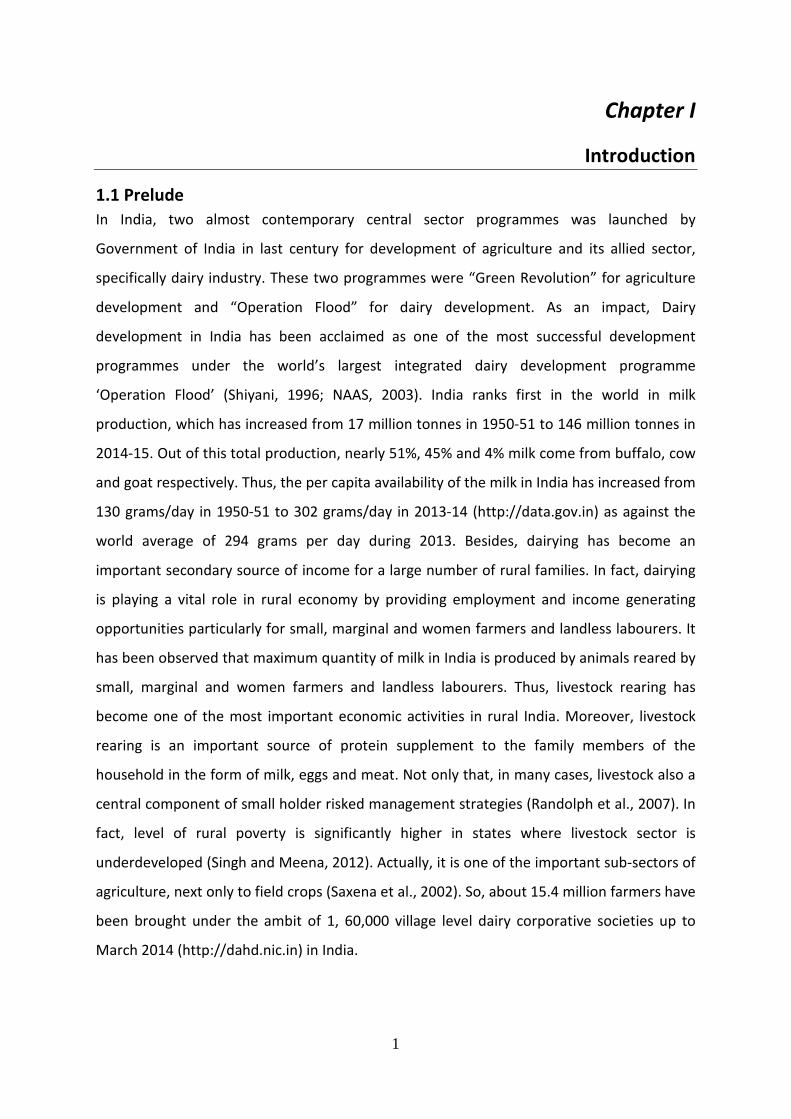
1.1 Prelude
In India, two almost contemporary central sector programmes was launched by
Government of India in last century for development of agriculture and its allied sector,
specifically dairy industry. These two programmes were “Green Revolution” for agriculture
development and “Operation Flood” for dairy development. As an impact, Dairy
development in India has been acclaimed as one of the most successful development
programmes under the world’s largest integrated dairy development programme
‘Operation Flood’ (Shiyani, 1996; NAAS, 2003). India ranks first in the world in milk
production, which has increased from 17 million tonnes in 1950-51 to 146 million tonnes in
2014-15. Out of this total production, nearly 51%, 45% and 4% milk come from buffalo, cow
and goat respectively. Thus, the per capita availability of the milk in India has increased from
130 grams/day in 1950-51 to 302 grams/day in 2013-14 (http://data.gov.in) as against the
world average of 294 grams per day during 2013. Besides, dairying has become an
important secondary source of income for a large number of rural families. In fact, dairying
is playing a vital role in rural economy by providing employment and income generating
opportunities particularly for small, marginal and women farmers and landless labourers. It
has been observed that maximum quantity of milk in India is produced by animals reared by
small, marginal and women farmers and landless labourers. Thus, livestock rearing has
become one of the most important economic activities in rural India. Moreover, livestock
rearing is an important source of protein supplement to the family members of the
household in the form of milk, eggs and meat. Not only that, in many cases, livestock also a
central component of small holder risked management strategies (Randolph et al., 2007). In
fact, level of rural poverty is significantly higher in states where livestock sector is
underdeveloped (Singh and Meena, 2012). Actually, it is one of the important sub-sectors of
agriculture, next only to field crops (Saxena et al., 2002). So, about 15.4 million farmers have
been brought under the ambit of 1, 60,000 village level dairy corporative societies up to
March 2014 (http://dahd.nic.in) in India.

2
Considering the importance of dairy sector in India, a number of schemes and programmes
of both central and state government are being implemented for dairy development since
long back. The department of Animal Husbandry and Dairying of government is the
implementing authority of these schemes and programmes. The required financial support
for implementing these schemes and programmes are provided through state budgets and
central grants. Besides, a number of government welfare schemes are also implemented for
dairy development which is funded through budgetary previsions of various departments.
Some of such departments are Rural Development and Panchayat Raj, Agriculture and
Cooperation, Scheduled Caste and Scheduled Tribe Finance Corporation, Tribal Welfare,
Women and Child Welfare, etc.
The state milk federations and the milk unions of each state are also playing significant role
for development of dairy sector through evolving a variety of schemes that provide
incentives to the milk producers. Besides, district level milk unions of every state have also
drawn up some schemes to promote dairy development. Required fund for these schemes
come through various ingenious ways, e.g. partly through profits generated in milk business,
partly through token cess or through charity/welfare.
Animal husbandry in India is closely interwoven with agriculture and obviously plays an
important role in the national economy and also in the socio-economic development of
millions rural households (Vaidyanathan, 1989; Mishra, 1995; Chawla, et al, 2004; Sharma,
2004; Birthal, 2016). Livestock rearing is one of the most important economic activities in
the rural areas of the country providing supplementary income for most of the families
dependent on agriculture. This picture of the country has also been reflected in the state of
West Bengal. As per area and population, the ranks of West Bengal state in India are 13th
and 4th
(Census of India, 2011) respectively. The economy of West Bengal primarily depends
on agriculture. More than 70% of the state-population depends either directly or indirectly
on agriculture for their earnings. But the fact is, above 90% farmers of the state belongs to
small and marginal categories. Due to lack of required area of land, this big proportion of
population has to choose some another occupation for sustenance. In this circumstance,
cattle rearing have become the first choice as secondary/another occupation to small and
marginal farmers and landless labourers of West Bengal due to favourable agro-climatic
condition for animal husbandry in the state.

3
During 2015-16, the annual bovine milk production of West Bengal was 4.9 million tonnes.
Among twenty one revenue districts of the state, North 24 Parganas, Nadia, Burdwan and
Hooghly are the major milk producing districts. Anand pattern cooperatives are the major
organized player in the dairy industry of West Bengal. However, after the liberalization, the
dairy sectoris facing stiff competition from various private players. In West Bengal, the dairy
cooperatives have been able to procure only around 5.4 per cent of the marketable surplus
milk of the state, whereas at national level, dairy cooperatives procure around 16 per cent
of the marketable surplus. Most of the procurement of surplus milk is done mainly by the
unorganized sector and that too for making various traditional products, predominantly
chhana. This indicates that organized dairying is yet to achieve its full potential in West
Bengal.
WB State Profile:
Geographic profile of West Bengal
The State of West Bengal is one of the Eastern States of India extending between 21°31′ and
27°14′ North latitudes and 86°35′ and 89°53′ East longitudes. The land frontier of the State
touches Bangladesh in the east, and is separated from Nepal in the west. Bhutan lies in the
north-east, while Sikkim is on the north. On the west there are the states of Bihar,
Jharkhand, while in the south lies Orissa, and the Bay of Bengal washing its southern
frontiers. The tropic of cancer passes through the state. The state extends from the snow
clad Himalayas in the north to the Bay of Bengal in the South. The Ganges and its numerous
tributaries have created fertile regions in the State. West Bengal is rich in natural resources
and it has an advantage of six agro-climatic regions, fertile soil of vast bio-diversity and
consistent irrigation facilities. West Bengal has been divided into 6 agro-climatic zones on
the basis of landform hydrology – soil combinations as well as climate variations. These are
– (1) Northern Hill Zone (NHZ), (2) Terai – Tista Alluvial Zone (TTAZ), (3) Gangetic / New
Alluvial Zone (GAZ), (4) Vindhya / Old Alluvial Zone (VAZ), (5) Coastal Saline Zone (CSZ), and
(6) Undulating Red and Laterite Zone (URLZ).
Demographic profile of West Bengal
As per Census 2011, West Bengal has a population of 9, 12, 76,115 consisting 4.68 crore
males and 4.44 crore females. West Bengal has a population density of 1028 inhabitants per
square km. making it the most densely populated state in India. The population of the state

4
has increased from 4.43 crore in 1971 to 9.12 crore in 2011. The state has a gender ratio of
950 females per 1000 males. The census report (2011) has also exhibited literacy rate of the
state by 76.26 per cent.
Agricultural profile of West Bengal
Agriculture plays such a pivotal role in the state's economy that nearly three out of every
four persons is directly or indirectly involved in agriculture. As such agriculture is the
primary occupation of the state and the main source of income for the people of West
Bengal. Above 70 percent of the total population depends on farming for their livelihood.
Though the state has only 3 percent of cultivable land of India, it accounts for 8 percent of
the total food grains produced in the nation. The net area under cultivation in West Bengal
is about 57, 27,007 ha (65.95 %) with cropping intensity of 184 percent. There are 20.54 %
and 13.51 % of the reported area remain under non-cultivable and forest area, respectively.
The cropping pattern of the state is dominated by food crops, which account for about 87
percent of the area under principal food crops in the state. The major crops grown in the
state include rice, wheat, pulses, jute, oilseeds, vegetables, etc. The state is the highest
producer of rice in the nation. There is remarkable progress in the production of jute and
oilseeds also. About 60 percent of the raw jute is produced in the state. In case of main
working force, West Bengal has faced 2, 30, 23,583 persons of total worker, out of which
19.79 percent and 19.64 percent are accounted for cultivators and agricultural labours,
respectively.
Animal Husbandry & Dairy Profile of West Bengal
As per Livestock Census-2012, the West Bengal state has 16, 514 thousand cattle
population. Out of this total cattle population, the state has 83.7% indigenous species and
16.3% crossbred species. As a result, per capita milk availability per day is 145 gms in the
state. However, as agri-allied sector, dairying is now playing an important role for upliftment
of the rural economy in West Bengal.
1.2 Role of Dairy Sector in State Economy of West Bengal
Dairying is an important and integral part of the rural economy of West Bengal. It has been
playing a significant role in boosting the agrarian economy of the state. It is one of the main
subsidiary sources of livelihood in rural area of the state. Thus, this sector plays a vital role

5
in the livelihood of the rural people as well as rural economy of the state. It has significant
impact on employment as well as income generation for marginal and sub-marginal farmers
and landless labourers in West Bengal. However, organized dairying is yet to achieve its full
potential in the state.
Cattle and especially bullocks are the primary source of draught power required for the
agricultural operations as well as rural transportation. Milch animals are the main origin of
the milk requirements of the human beings. Thus, cattle and milch animals provide essential
foods like milk and meat. Large quantities of animal by-products are also generated by these
animals. Bullocks and milch animal are the main support of agricultural operations and also
a major source of supplementary income to the marginal and small farmer and landless
agricultural labourers. On the other hand, the by-products of agricultural produce happen to
be the chief ingredients of food for cattle and milch animals. Farmers are in a position to
follow animal husbandry and dairying as an adjunct to cultivation. The requisite labour for
keeping dairy animals is also available from within the farmer’s family. A very large portion
of female labour force of cultivator households which otherwise have suffered from
disguised unemployment, gets self-employment in several occupations allied to cattle and
buffalo rearing.
Milch animal-holders feed and nourish dairy animals with crop residuals and agriculture by-
products available with them. But the dairy cooperatives have been able to procure only
around 5.4 per cent of the marketable surplus milk of the state against around 16 per cent
procurement of the marketable surplus milk by dairy cooperatives in India. This indicates
the utilization of a large amount of marketable surplus milk by the unorganized sector for
conversion into traditional products, predominantly chhana. The chhana industry of West
Bengal is as old as Bengali food culture. Nineteenth century renaissance of Bengal played a
major role in the growth of chhana based sweet industry. Enterprising skills combined with
business acumen provided impetus for a century old industry. However, till date the
industry is purely in the hands of unorganized sector. In the present globalized economy
which is hindering the growth of the sector.
The capital city of Kolkata is the major market of chhana. The chhana consumed by the
sweetshops of the city is either manufactured in-house or obtained from the local chhana
markets or supplied by vendors from adjoining districts. Two adjoining districts namely,

6
Hooghly and North 24 Parganas are the major suppliers of chhana. The sweet industry of
the state is directly providing employment to about 7 lakh people and the downstream
chhana industry providing about 4 lakh employments. There are about 15,000 sweetshops
and five wholesale chhana markets in Kolkata.
1.3 Trend in Contribution of Dairy in GSDP
Animal husbandry plays an important role in rural economy of West Bengal state. The
contribution of Livestock was 4.30 per cent to the state GSDP in 2013-14. On the other
hand, the contribution of agriculture to total GSDP was 12.35 per cent. The contribution of
agriculture and livestock to total GSDP was estimated to be 16.64 per cent, while
contribution of livestock to agriculture and livestock together was nearly 26 per cent. Thus,
more than one fourth of the agriculture sector output comes from livestock sector (Table
1.1 & Fig. 1.1). The share of GVO from livestock to agriculture sector has remained between
20.57 - 25.81 per cent with some little fluctuation during the last one and half decade.
Livestock contributes more than 20 per cent to the agricultural GDP of West Bengal and is
one of the biggest sectors for supporting livelihood in the state. Livestock output at constant
16.50
17.00
17.50
18.00
18.50
19.00
19.50
20.00
20.50
21.00
21.50
0
500000
1000000
1500000
2000000
2500000
3000000
3500000
GVO from LS (Rs. In lakh)
Share(%) of GVO from LS to Agri.
GV
O f
rom
LS
(R
s. i
n L
ak
h)
Sh
are
(%
) o
f G
VO
fro
m L
S t
o A
gri
.
Fig 1.1: Contribution of GVO from LS sector to Agri.
(At current price) in West Bengal:2004-05 to 2013-14

7
prices was reported at Rs. 288.75 billion in 2011-12 (at constant prices), of which milk
contributes about 47.15 per cent or Rs. 136.16 billion (Table 1.2).
Table 1.1: Contribution of Gross Value of Output and Gross Value Added from Agriculture
and Livestock Sector to Total GSDP at Current Prices of West Bengal State
Sr.
No.
Year Total GSDP
(Rs In
Crores)
Contribution
of GVO from
Agriculture to
Total GSDP
(%)
Contribution
of GVO from
Livestock to
Total GSDP
(%)
of GVO from
Agriculture &
Livestock to
Total GSDP
(%)
Contribution
of GVA from
Agriculture
& Livestock
to Total GSDP
(%)
Contribution of
GVO from
Livestock to
Agriculture &
Livestock
sector %)
1 1999-00 135376 25.30 6.55 31.86 GVA
Data
Not
Available
In
West
Bengal
20.57
2 2000-01 143724 22.55 6.42 28.96 22.16
3 2001-02 157144 23.03 6.19 29.22 21.17
4 2002-03 168000 20.83 6.14 26.98 22.77
5 2003-04 189258 20.55 5.80 26.35 21.99
6 2004-05 208656 18.57 5.75 24.31 23.64
7 2005-06 230245 18.65 5.28 23.93 22.05
8 2006-07 261682 17.69 5.12 22.81 22.45
9 2007-08 299483 17.87 5.32 23.18 22.93
10 2008-09 341942 16.43 5.12 21.55 23.75
11 2009-10 398880 17.25 5.44 22.69 23.98
12 2010-11 460959 16.45 5.12 21.56 23.74
13 2011-12 528316 16.00 5.47 21.47 25.46
14 2012-13 603311 14.51 4.99 19.50 25.60
15 2013-14 706561 12.35 4.30 16.64 25.81
1.4 Composition of Livestock & details on Cow and Buffalo Breeds in West
Bengal State
The West Bengal state possesses a remarkable position in the country so far as livestock
wealth and development are concerned. The Nineteenth Livestock Census (2012) of India
has placed total livestock population at 512.06 million, out of which, 30.35 million livestock
(5.93 %) population was in the state of West Bengal. There is a decrease in livestock
population over 2007 to 2012 from 36.60 million to 30.35 million registering a negative
growth of 17.09 per cent in the total number of animals of various species (Table 1.3).
The state accounts for 8.65 per cent share in cattle population, 0.55 per cent of buffalo
population, 1.65 per cent sheep population and 8.51 per cent goat population of the
country. The negligible share of mules & donkeys (0.1 %) and yaks (1.30 %) in national stock
has also been recorded in 2012. As per Livestock Census 2012, among the species, Cattle
contributes highest share (54.42 per cent) in total livestock population followed by Goat
(37.91%), Sheep (3.54 %), Pigs (2.13%) and Buffaloes (1.97 %), besides marginal contribution

8
Table 1.2: Value of Output: Agriculture and Livestock
Item
Value of Output: Agriculture and Livestock in West Bengal
2004-05 2005-06 2006-07 2007-08 2008-09 2009-10 2010-11 2011-12
Value of Output at Current Prices (Rs. billion)
Agriculture & Allied* 621.81 668.82 731.20 846.16 911.45 1113.24 1218.31 1392.82
Agriculture 387.41 429.50 462.83 535.12 561.96 688.05 758.05 845.43
Livestock 119.91 121.52 133.96 159.18 175.02 217.01 236.00 288.75
Share of Value of Output to Agriculture and Allied* (%)
Agriculture 62.30 64.22 63.30 63.24 61.66 61.81 62.22 60.70
Livestock 19.28 18.17 18.32 18.81 19.20 19.49 19.37 20.73
2004-05 2005-06 2006-07 2007-08 2008-09 2009-10 2010-11 2011-12*
Value of Output at Constant Prices (Rs. billion) (2004-05 & 2011-12)
Agriculture & Allied* 621.81 627.89 646.38 690.16 669.25 722.15 713.68 1392.82
Agriculture 387.41 384.89 390.58 415.23 410.04 441.46 431.23 845.43
Livestock 119.91 122.42 125.57 136.70 132.65 137.65 143.15 288.75
Share of Value of Output to Agriculture and Allied* (%)
Agriculture 62.30 61.30 60.43 60.16 61.27 61.13 60.42 60.70
Livestock 19.28 19.50 19.43 19.81 19.82 19.06 20.06 20.73
2004-05 2005-06 2006-07 2007-08 2008-09 2009-10 2010-11 2011-12
Value of Livestock Output at Current Prices (Rs. billion)
Milk 56.98 58.50 62.70 71.36 82.24 100.37 105.03 136.16
Meat 44.75 47.42 50.34 65.05 66.91 80.70 88.19 111.15
Egg 4.51 4.73 4.98 5.49 6.51 10.09 11.96 14.03
Dung 10.03 10.77 11.37 12.08 12.52 16.87 19.96 21.14
Others^ 3.61 4.08 4.56 5.18 6.82 8.96 10.84 6.26
Share of Livestock Output at Current Prices (%)
Milk 47.52 48.14 46.81 44.83 46.99 46.25 44.50 47.15
Meat 37.32 39.02 37.58 40.87 38.23 37.19 37.37 38.49
Egg 3.76 3.89 3.72 3.45 3.72 4.65 5.07 4.86
Dung 8.36 8.86 8.49 7.59 7.15 7.77 8.46 7.32
Others^ 3.01 3.36 3.40 3.25 3.90 4.13 4.59 2.17
2004-05 2005-06 2006-07 2007-08 2008-09 2009-10 2010-11 2011-12*
Value of Livestock Output at Constant Prices (Rs. billion) (2004-05 & 2011-12)
Milk 56.98 58.08 59.42 60.90 62.24 64.08 66.62 136.16
Meat 44.75 45.63 46.78 55.76 50.03 51.94 53.70 111.15
Egg 4.51 4.63 4.75 4.78 4.79 5.36 5.79 14.03
Dung 10.03 10.17 10.32 10.48 10.64 10.81 10.99 21.14
Others^ 3.61 3.88 4.27 4.76 4.94 5.45 6.03 6.26
Share of Livestock Output at Constant Prices (%)
Milk 47.52 47.44 47.32 44.55 46.92 46.55 46.54 47.15
Meat 37.32 37.27 37.25 40.79 37.72 37.73 37.51 38.49
Egg 3.76 3.78 3.78 3.50 3.61 3.89 4.04 4.86
Dung 8.36 8.31 8.22 7.67 8.02 7.85 7.68 7.32
Others^ 3.01 3.17 3.40 3.48 3.72 3.96 4.21 2.17
*at 2011-12 price
Notes: P:Provisional Estimates, Q:Quick Estimates ,*Includes Livestock, Forestry & Fisheries, ^Includes Wool and Hair,
Silk worm Cocoons & Honey ,Increment in Stock
Source: State wise estimate of Value of Output (Ag & Allied) with base year 2004-05 & 2011-12, MoSPI, GoI.
9
Table 1.3: Growth of the Livestock in West Bengal and India
Sr.
No
Livestock
Census Year
Total Livestock (000) % Share of WB
to All India
% Growth of WB State
between two Census All India West Bengal
1 1951 292784 - - -
2 1956 306615 - - -
3 1961 336432 17535 5.21 -
4 1966 344111 19410 5.64 10.69
5 1972 353338 18721 5.30 - 3.55
6 1977 369525 24134 6.53 28.91
7 1983 419588 28948 6.90 19.95
8 1987 445285 30842 6.93 6.54
9 1993 470830 33786 7.17 9.54
10 1997 485385 35958 7.41 6.43
11 2003 485002 32039 6.60 - 10.90
12 2007 529698 36604 6.91 14.25
13 2012 512057 30348 5.93 - 17.09
Note: Figures without Dog & Rabbit.
Source: Directorate of Animal Resource & Animal Health, GoWB
is attributed by other livestock species such as Horses and Ponies, Mules, Donkeys, Yaks,
etc. (Table 1.4).
Table 1.4: Species-wise Livestock population & its Share in total livestock (Number in thousand)
Sr.
No. Particulars
West Bengal -2012 India 2012
Livestock-
2012
% share
in India
% share in
total
Livestock
Rank in
All India
Livestock-
2012
% share in
Total
Livestock
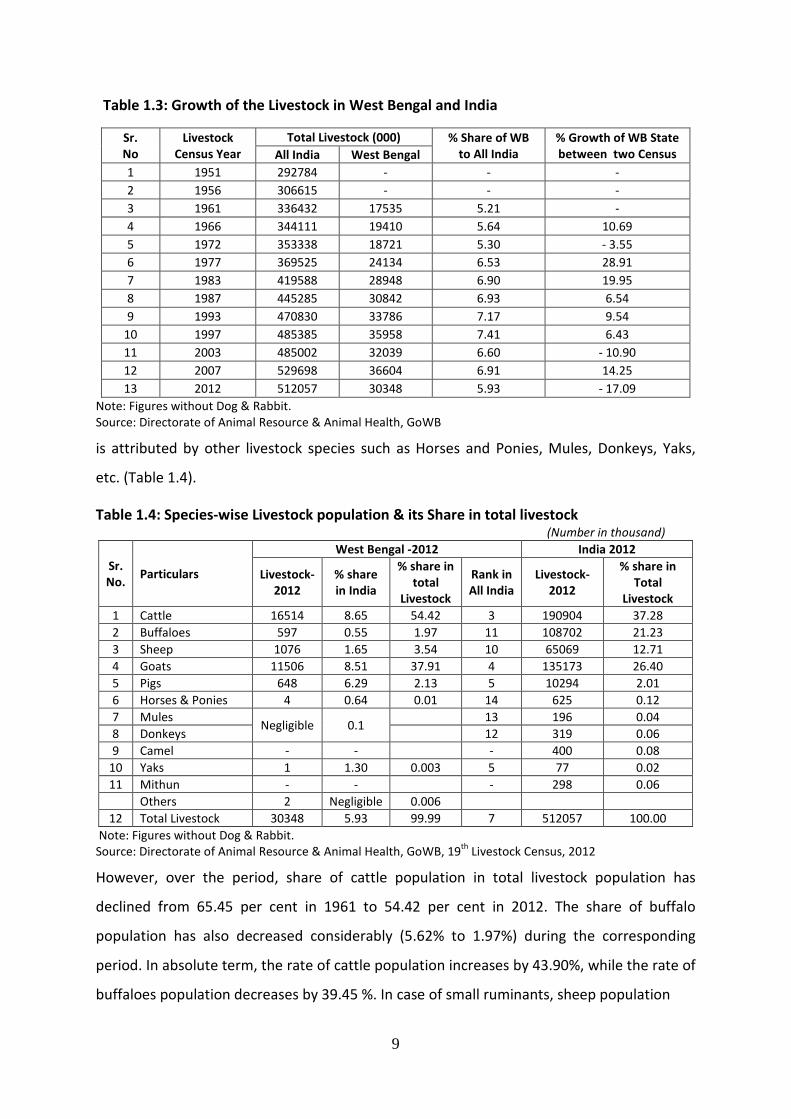
1 Cattle 16514 8.65 54.42 3 190904 37.28
2 Buffaloes 597 0.55 1.97 11 108702 21.23
3 Sheep 1076 1.65 3.54 10 65069 12.71
4 Goats 11506 8.51 37.91 4 135173 26.40
5 Pigs 648 6.29 2.13 5 10294 2.01
6 Horses & Ponies 4 0.64 0.01 14 625 0.12
7 Mules Negligible 0.1
13 196 0.04
8 Donkeys
12 319 0.06
9 Camel - -
- 400 0.08
10 Yaks 1 1.30 0.003 5 77 0.02
11 Mithun - -
- 298 0.06
Others 2 Negligible 0.006
12 Total Livestock 30348 5.93 99.99 7 512057 100.00
Note: Figures without Dog & Rabbit.
Source: Directorate of Animal Resource & Animal Health, GoWB, 19th
Livestock Census, 2012
However, over the period, share of cattle population in total livestock population has
declined from 65.45 per cent in 1961 to 54.42 per cent in 2012. The share of buffalo
population has also decreased considerably (5.62% to 1.97%) during the corresponding
period. In absolute term, the rate of cattle population increases by 43.90%, while the rate of
buffaloes population decreases by 39.45 %. In case of small ruminants, sheep population

10
Table 1.5: Growth in Livestock Population in West Bengal- 1951 to 2012
(No. in thousand)
Sr.
No. Year
Cattle Buffalo Sheep Goat Total Livestock
Nos. GR (%) Nos. GR (%) Nos. GR (%) Nos. GR (%) Nos. GR (%)
1 1951 - - - - - - - - - -
2 1956 - - - - - - - - - -
3 1961 11476 - 986 - 535 - 4513 - 17535 -
4 1966 12845 11.93 1048 6.29 638 19.25 4852 7.51 19410 10.69
5 1972 11878 - 7.45 824 - 21.37 793 24.29 5211 7.40 18721 - 3.55
6 1977 14435 21.53 1268 53.88 1079 36.06 7335 40.76 24134 28.91
7 1982 15658 8.47 987 - 22.16 1365 26.51 10916 48.82 28948 19.95
8 1988 16510 5.44 965 - 2.23 1460 6.96 11890 8.92 30842 6.54
9 1992 17206 4.21 980 1.55 1415 - 3.08 14167 19.15 33786 9.54
10 1997 17832 3.64 998 1.84 1462 3.32 15648 10.45 35958 6.43
11 2003 17984 0.85 876 - 12.22 1411 - 3.49 11757 - 24.86 32039 - 10.90
12 2007 19188 6.69 764 - 12.78 1577 11.76 15069 28.17 36604 14.25
13 2012 16514 - 13.93 597 - 21.86 1076 - 31.77 11506 - 23.64 30348 - 17.09
Note: GR- Growth rate over previous census year.
Source: Directorate of Animal Resource & Animal Health, GoWB
0.00
10.00
20.00
30.00
40.00
50.00
60.00
70.00
19
61
19
66
19
72
19
77
19
82
19
88
19
92
19
97
20
03
20
07
20
12
Cattle Buffalo
Sheep Goat
Others
Fig 1.2: Species-wise Share in Total livestock Population in West Bengal (1961-2012
P
op
ula
tio
n i
n %
to
to
tal
LS p
op
ula
tio
n

11
has increased by 101 per cent and goat population increased by 154.95 per cent in 2012
over 1961 (Fig. 1.2). Total livestock population in West Bengal has increased by 73.07 per
cent during last five decades period (Table 1.5).
The district-wise share in total state livestock population figures (Fig. 1.3 & Table 1.6)
indicate that Medinipur (East + West) district has the highest number of livestock
population (16.98 %) followed by Burdwan (East + West) district (9.07%), Bankura district
(7.65%), Murshidabad district (7.13%), Birbhum district (6.43%), Maldah district (5.89%),
Jalpaiguri + Alipur district (5.40%), Hooghly district (5.13%) and South 24 Parganas district
(5.00%).
These eleven districts together accounted for 68.68 percent of total livestock population in
the state in 2012 (Fig. 1.3). Medinipur East and West district jointly has the highest
percentage share of cows (64.62%) followed by Cooch Behar (63.73%) and Hooghly district
(61.44%). Though, highest percentage share of indigenous cattle and crossbred cattle was
found separately in Howrah (67.81%) and Darjeeling district (23.21%) respectively. On the
other hand, the existences of maximum percentage share of buffalo was observed in
Kolkata district (9.57%) followed by Purulia (4.02%) and Burdwan East and West district
jointly (3.57%) (Table 1.6).
As per measurement of livestock population density per square kilometre in 2012, the
overall highest livestock and bovine animal density was recorded in Hooghly district
followed by Howrah district (Table 1.7).
7.65 9.07
6.43
3.26 4.49
1.53 1.95
5.13 5.40 4.53
0.05
5.89 7.13
4.86 5.00 4.48
16.98
6.16
0.00
2.00
4.00
6.00
8.00
10.00
12.00
14.00
16.00
18.00
% s
hare
Fig. 1.3: Districtwise share in total Livestock Population in West Bengal 2012 (%)

12
Table 1.6: District wise Percentage share of Animals in Total Livestock Population in WB
District
District wise Percentage share of animals in Total livestock population in WB State-2012
Cro
ssb
red
Ind
ige
no
us
To
tal
Co
w
Bu
ffa
lo
To
tal
Sh
ee
p
Go
at
Oth
ers
To
tal
Pig
s
Ho
rse
s &
Po
nie
s
Mu
les
Do
nk
ey
Ca
me
l
Bankura 6.34 52.46 58.80 2.87 3.44 32.59 2.30 0.17 - - - -
Burdwan (E&W) 9.89 42.18 52.07 3.57 4.43 37.19 2.75 0.25 - - - -
Birbhum 4.29 44.63 48.92 2.98 8.40 38.12 1.59 0.10 - - - -
South Dinajpur 2.03 48.72 50.75 0.71 0.77 44.45 3.32 0.10 - - - -
North Dinajpur 4.37 50.33 54.70 1.24 0.19 42.07 1.80 0.08 - - - -
Darjeeling 23.21 25.47 48.68 0.63 0.49 39.40 10.80 0.16 - - - -
Howrah 6.63 67.81 74.44 0.71 0.05 24.68 0.13 0.002 - - - -
Hooghly 14.25 47.19 61.44 1.54 0.04 35.59 1.39 0.07 - - - -
Jalpaiguri
+Alipurduar 6.32 51.69 58.01 0.54 1.58 34.26 5.62 0.30 - - - -
Cooch Behar 4.81 58.92 63.73 0.27 6.35 28.35 1.30 0.06 - - - -
Kolkata 17.59 13.89 31.48 9.57 0.21 46.40 12.35 0.004 0.002 - - -
Maldah 5.58 36.63 42.21 2.18 2.18 50.41 3.01 0.18
- - -
Murshidabad 18.43 25.51 43.94 2.54 2.83 50.12 0.58 0.05 0.002 - - -
Nadia 22.04 28.74 50.78 1.20 0.76 46.41 0.84 0.04 0.005 - - -
South 24 Pgs 17.17 30.64 47.81 2.44 3.65 44.49 1.61 0.05 - - - -
North 24 Pgs 4.06 47.80 51.86 0.38 6.33 40.33 1.10 0.07 - - - -
Medinipur
(E&W) 10.49 54.13 64.62 1.55 2.07 30.27 1.50 0.25 - - - -
Purulia 0.72 44.02 44.74 4.02 11.77 36.37 3.10 0.19 - - - -
WB State 9.21 45.21 54.42 1.97 3.54 37.91 0.006 2.13 0.01 negligible
Source: Directorate of Animal Resource & Animal Health, GoWB; Statistical Abstract 2014
India has a total 137 breeds of domesticated animals, of which only a few breeds, including
some internationally recognised ones, are available in West Bengal. The State has some
high-quality and high-yielding breeds of cattle and buffaloes (Table 1.8). Sahiwal, Gir, Jersey
and Holstein Friesian breeds in cows, and Murrah breed in buffaloes were known for their
high milk yielding capacity. The Jersey breed is found in all over the state of West Bengal.
But till today, indigenous breeds are predominant in the state. However, the performances
of some breeds that are commonly found in this state are presented in Table 1.9.
It has been observed that, between 1982 and 1992, livestock population per hundred
households, has declined by about 15.02 per cent with highest decline among large and
medium landholding size categories (Table 1.10). This is perhaps because of the facts that
medium and large farmers are increasingly relying on machine powers rather draft power

13
for farming activities. Small and marginal farmers are maintaining livestock both for draft
power as well as for alternative source of livelihood.
Table 1.7: District-wise Livestock and Bovine Density (1992-2012) in WB
Districts
Livestock (No. per sq km) Bovine (No. per sq km)
1994* 1997 2003 2007 2012 1994 1997 2003 2007 2012
Bankura 331 353 389 384 330 210 219 215 240 208
Burdwan (E&W) 407 435 511 489 381 247 259 265 264 218
Birbhum 436 462 533 519 422 232 240 243 264 223
South Dinajpur 362 385 418 466 432 217 225 220 268 230
North Dinajpur 380 406 484 495 426 212 219 261 266 243
Darjeeling 164 176 223 173 131 77 80 71 94 73
Howrah 495 530 592 367 404 315 331 328 239 304
Hooghly 581 622 716 576 487 334 349 351 333 311
Jalpaiguri
+Alipurduar 211 224 294 265 248 128 132 152 165 154
Cooch Behar 517 553 630 502 401 292 303 278 312 260
Kolkata 323 359 394 243 69 103 117 91 39 32
Maldah 727 793 381 486 465 182 191 193 210 213
Murshidabad 466 502 580 661 404 204 215 258 264 189
Nadia 573 616 687 478 372 266 277 282 228 195
South 24 Pgs 241 256 318 225 151 118 122 135 112 80
North 24 Pgs 538 576 686 454 327 304 319 341 241 167
Medinipur (E&W) 316 340 404 418 360 223 231 251 274 242
Purulia 326 334 387 342 289 175 166 168 167 146
WB State 381 408 454 413 335 207 215 225 225 193
*Note: Data for 1992 is not available in WB
Source: NDDB: Statistical Abstract 2014: Directorate of Animal Resource & Animal Health, GoWB
Table 1.8: Distribution of West Bengal’s Cattle Breeds in WB
Breeds Breeding Tract Utility Distribution
A) Cattle
Sahiwal Breeding Tract is Montgomery region/ district
of undivided India (present Pakistan)
Milch Uttar Pradesh, Punjab, Rajasthan,
West Bengal
Gir Originated in Gir forests of South Kathiawar in
Gujarat. Also found in Amreli, Bhavnagar,
Junagadh and Rajkot districts of
Gujarat,Maharashtra and adjacent Rajasthan.
Milch Rajasthan, Madhya Pradesh,
Maharashtra, West Bengal. Exported
to Brazil, Mexico, USA and
Venezuela.
Jersey Island of Jersey, U.K Milch West Bengal and some other states
of India.
Holstein
Friesian
Northern parts of Netherlands, especially in
the province of Friesland.
Milch West Bengal and some other states
of India.
B) Buffalo
Murrah Rohtak, Hisar and Jind of Haryana, Nabha and
Patiala districts of Punjab and southern parts
of Delhi state
Milch Delhi, Haryana, Punjab, Western U.P,
West Bengal, etc.
Source: AE Nivsarkar et al., (2000), Animal Genetics Resources of India, Cattle and Buffalo, ICAR publication.
Website: vikaspedia.in/agriculture/livestock/cattle-buffalo/breeds-of-cattle-buffalo

14
Table 1.9: Performance of Cattle and Buffalo Breeds
Parameter
Cattle Buffalo
Sahiwal Gir Jersey Holstein Murrah
Breed Population
(‘000)
Lactation
Yield(kg)
Field 2325
(1600 - 2750)
2790
(2732 - 3312)
3476
(1722 – 4500)
4300
(3926 - 4568)
1752
(1003-2057)
Farm 1900 2125
(1835 - 2950)
4000 6000 1500 - 2500
Lactation
Length(days)
318
(285 - 375)
305
(302 - 329)
325 - 357 312 - 349 299
(269 - 337)
Calving Interval
(days)
450
(390 - 550)
435
(420 - 480)
465
(450 - 490)
453
(430 - 604)
Dry Period (days) 165
(158 - 172)
115
(75 - 155)
Age at First
calving (months)
1183
(940 - 1520) 46
(44 - 53)
900 - 1260 1320 - 1680 1319
(1214 - 1647)
Source: NDDB, Kolkata; Animal Genetics Resources of India, Cattle and Buffalo, ICAR publication.
Table 1.10: Livestock per 100 Households across Landholding Size: West Bengal
Landholding Size
(Ha)
Livestock per 100 Households across Landholding Size in
West Bengal
1982 1992 % Change
I. Landless 43 21 -51.16
II. Up to 0.2 77 247 220.78
III. 0.21 – 1.0 614 509 -17.10
IV. 1.01 – 4.0 1707 723 -57.64
V. 4.01 – 10 3527 538 -84.75
VI. > 10.0 1937 0 -100.00
All 233 198 -15.02 Source: NSSO 37
th, 48
th & 59
th Rounds, Reports on Land and Livestock Holding Survey, GOI.
The decline however, is significantly higher i.e. 100 per cent among the households of
largest landholding size class (with >10 hectares of land). What is however important is that
the livestock population in the first group of landholding size (i.e. up to 0.2 hectare) has
increased at a significant rate by 220.78%, though it has decreased again in the next size
class (i.e. 0.21–1.0 hectare). The point should be underlined here that the percentage of
declination in livestock population starts rising from this category of households and
reaching a peak at 100 per cent among the largest landholding size class, i.e. with >10
hectares of land. The evidence suggests sustained importance of livestock among marginal
farmers only as compared to landless and medium to large farmers.

15
Among different species of livestock, the steepest decline is observed in the case of buffalo
(90.9%), followed by bullocks (34.7%) and then by cow (14.5%). The average size of sheep
and goat possessed by all rural households has increased by 23.5 per cent. It may be noted
that the increase in the average size of sheep and goat has been observed among the
marginal and small landholding size classes. The landless and the medium and large
landholding size classes once again, have lost out thus, registering a negative growth (Table
1.11).
Table 1.11: No of Major Livestock Species per 100 Households across Landholding Size in
West Bengal (1982 & 1992)
Landholding
Size (Ha) No.
Bullock Cow Buffalo Sheep and Goat
19
82
19
92
% C
ha
ng
e
19
82
19
92
% C
ha
ng
e
19
82
19
92
% C
ha
ng
e
19
82
19
92
% C
ha
ng
e
I. Landless 6 1 -83.3 13 6 -53.8 0 0 0 24 14 -41.6
II. Up to 0.2 15 25 66.6 30 68 126.6 1 2 100.0 31 152 390.3
III. 0.2 – 1.0 256 182 -28.9 169 134 -20.7 15 1 -93.3 174 192 10.3
IV 1.01 – 4.0 689 254 -63.1 451 173 -61.6 115 4 -96.5 452 292 -35.4
V 4.01 – 10 1164 184 -84.1 1245 159 -87.2 595 16 -97.3 523 179 -65.8
VI > 10.0 547 0 -100.0 347 0 -100.0 200 0 -100.0 843 0 -100.0
All 92 60 -34.7 62 53 -14.5 11 1 -90.9 68 84 23.5
Source: NSSO 37th
, 48th
& 59th
Rounds, Reports on Land and Livestock Holding Survey, GOI.
The following Table 1.12 presents the number per 1000 of households reporting owing
livestock of different types for each size class of households operational holdings in West
Bengal (Rural) as per NSSO -59th round conducted in 2003.
1.5 Plan wise Outlay and Expenditure under Dairy Development
Livestock sector has been making rapid strides and spectacular growth in recent time, with
positive impact on the lives of rural people mainly small farmers, marginal farmers and
agricultural landless labours by raising their living standards considerably.
The State Government policy has been providing necessary support for dairy development
in the state through cooperative sector. Table 1.13 gives details regarding plan-wise outlay
and expenditure on animal husbandry and dairy development by the Government of West
Bengal (excluding central assistance and fund). This table shows that there has been
consistent increase in the plan provision for animal husbandry and dairy development. The

16
proportion of plan expenditure in the plan provision has also been increasing with up and
down pattern. This has led to increase in number of milch animals, milk production and
qualitative improvement in milch animals.
Table 1.12: Number per 1000 of households reporting owing livestock of different types
for each size class of household’s operational holdings in West Bengal (Rural)
2002-03
size class of
operational
holding (ha)
West Bengal (Rural)- No. of households per 1000 households reporting owning of
cattle buffalo other
large
heads
sheep,
goats
fowl*,
duck
other
birds
pigs
and
rabbits
cross
breed
non-
descript
all
nil 0 0 0 0 1 45 111 1 1
≤ 0.002 17 239 256 0 0 932 727 0 442
0.002 - 0.005 54 519 573 1 0 439 427 8 50
0.005 - 0.040 85 85 632 8 0 347 499 12 57
0.040 - 0.5 65 458 517 20 0 257 353 8 10
0.5 - 1.0 99 672 749 51 0 316 491 14 20
1.0 - 2.0 60 720 761 89 0 307 500 16 38
2.0 - 3.0 152 771 877 139 0 374 570 48 0
3.0 - 4.0 103 793 896 153 0 504 511 48 0
4.0 - 5.0 212 788 1000 0 0 46 253 0 0
5.0 - 7.5 404 443 791 404 0 133 281 0 0
7.5 - 10.0 0 1000 1000 0 0 0 556 0 0
10.0 - 20.0 0 0 0 0 0 0 0 0 0
> 20.0 0 0 0 0 0 0 0 0 0
all sizes 52 378 423 23 0 219 326 8 17
Note: *includes hens, cocks and chickens.
Source: Livestock Ownership Across Operational Holding Classes in India, NSS Report No. 493(59/18.1/1).
The outlay and expenditure on dairy development has also increased over the period of
time. However, percentage share of expenditure on dairy development to total expenditure
has declined considerably (Fig. 1.4 & Table 1.13). As compared to around 41.29 per cent
share of total expenditure on dairy development during 1974-1978, it has declined to 10.69
per cent during the period of 2002-03 to 2011-12. The proportion of expenditure to outlay
on dairy development was much better during the corresponding period, which was
recorded for the period from 2012-13 to 2014-15, to be around 4 times than the allotment
of Rs. 78.60 lakh for the period of 12th
FYP.
1.6 Growth in Milk Production and Productivity (Regional trend)
West Bengal is a state in the eastern India. Milk production in this state has been improving
considerably due to the efforts of the Operation Flood Projects. But the per capita
availability is far below from the other improved states like Haryana, Punjab, etc. The main

17
reason behind this is lack of high milk producing milch animals. Most of the animals in West
Bengal are Zebu cattle i.e. non descriptive cow whose productivity is very low. In order to
improve the productivity of Bengal desi cow, Artificial Insemination (AI) with frozen semen
of quality breeds is being extensively carried out. The entire breedable cow population in
the state is being tried to be brought under the coverage of AI at the Gram Panchyat (GP)
level. Moreover co-operative unions are also responsible for performing AI under their care.
They also supply feed, fodder seeds etc. to the beneficiary farmers which in turn help to
improve the milk production of the state. In fact, the numbers of initiatives were taken by
the government which could help in improving the milk productivity over the period.
A trend showing the increase in milk production over the past one and half decades is
depicted in Fig 1.5. The graph shows there is a consistent increase in the production of milk
over the years. The milk production has increased from 35 lakh tonnes in 2000-2001 to 49.6
lakh tonnes in 2014-15 registering a growth of 41.71 per cent over base year. The milk
production in the state has been increasing continuously. As a result, the per capita
0.00
20.00
40.00
60.00
80.00
100.00
120.00
140.00
160.00
0
20000
40000
60000
80000
100000
120000
140000
IV F
YP
(1
96
9 t
o 1
97
4)
V F
YP
(1
97
4 t
o 1
97
8)
AP
(7
8-7
9 t
o 7
9-8
0)
VI
FY
P (
19
80
-19
85
)
VII
FY
P (
19
85
-19
90
)
AP
(1
99
0-9
1)
AP
(1
99
1-9
2)
VII
I F
YP
(1
99
2-9
7)
IX F
YP
(9
7-9
8 t
o 0
1-0
2)
X F
YP
(0
2-0
3 t
o 0
6-0
7)
XI
FY
P (
07
-08
to
11
-12
)
AP
(2
01
2-1
3)
AP
(2
01
3-1
4)
AP
(2
01
4-1
5)
AP
(2
01
5-1
6)
Total Outlay (Rs. Lakh)
Total Expenditure (Rs. Lakh)
Dairy share (%) in expenditure
Dairy share(%) in outlay
Fig. 1.4: Plan wise Outlay & Expenditure on Animal Husbandry & Dairy Development in WB State
Rs.
in
la
kh
% t
o t
ota
l

18
availability of milk in the state increased from 116 gms/day in 2000-01 to 145 gms/day in
2014-15 (Table 1.14).
Table 1.13: Plan-wise Outlay and Expenditure on Animal Husbandry and Dairy
Development in WB
Sr.
No.
Plan Period Outlay (Rs. In Lakh) Expenditure (Rs. In Lakh)
Animal
Husbandry
(Revised)
Dairy
Development
(Revised)
Total Animal
Husbandry
Dairy
Development
Total
1 IV FYP (1969 to1974) 457.49 390.13 847.61 451.67 327.25 778.92
2 V FYP (1974 to 1978) - 1368.00 1368.00 475.00 334.00 809.00
3 AP (1978-79 to 1979-80) Sector wise figure not available
4 VI FYP (1980-1985) 4400.00 (AH+Dairy)
4400.00 2148.42 (AH+Dairy) 2148.42
5 VII FYP (1985- 1990) 3630.00 1845.00 5475.00 2439.00 798.00 3237.00
6 AP(1990-91)
- - - 467.94 172.95 640.89
7 AP (1991-92)
- - - 246.89 76.83 323.72
8 VIII FYP (1992-97)
5325.79 1874.21 7200.00 1218.32 335.36 1553.68
9 IX FYP (1997-98 to
2001 -02)
6190.00 2449.00 8639.00 6518.42 2053.69 8572.11
10 X FYP (2002-03 to
2006-07)
11033.27 3214.85 14248.12 3704.43 1387.37 5091.80
11 XI FYP (2007-08 to 2011-
12)
27828.00 1051.00 28879.00 26079.13 2179.41 28258.54
12 AP (20I2-201 3) 1221.50
(5 yrs outlay)
78.60
(5 yrs outlay)
1300.10
(5 yrs outlay)
299.44 94.94 394.38
13 AP (2013-2014) - - 298.67 95.74 394.41
14 AP (20 l4-20I 5) - - 335.69 117.31 453.00
15 AP (2015-201 6) - -
Source: Statistical Abstract 2014, Govt. Of West Bengal
Out of total milk production, about 47.98 per cent of the milk production is contributed by
Indigenous cow followed by 44.35 per cent by Crossbred cow. The buffalo contribute 4.64
per cent of the total milk production in the state whereas Goat contributes 3.02 per cent to
total milk production (Table 1.14). The productivity of cows and buffalo in term of daily milk
yield is increasing continuously (Fig 1.6). Despite of increase in milk yield, there is still a wide
scope for improving milk yield of milch animals.

19
Table 1.14: Milk Production in West Bengal: 2000-01 to 2015-16
Sr.
No Year
Milk Production in million tones Growth of
Milk
Production
(%) over
base year
Per Capita
availability
(gms/
day)
In milk Cow
In Milk
Buffalo
In milk
Bovine
In Milk
Goat
Total
Indigenous
C.B.
1 2000-01 3.10
0.30
0.10 3.50 - 116
2 2001-02
3.51 0.29 120
3 2002-03 2.22 0.96 0.30 3.48 0.12 3.60 2.86 121
4 2003-04 2.26 1.01 0.30 3.57 0.12 3.69 5.31 122
5 2004-05 2.32 1.06 0.29 3.67 0.12 3.79 8.29 124
6 2005-06 2.38 1.09 0.30 3.77 0.12 3.89 11.17 125
7 2006-07 2.19 1.44 0.25 3.88 0.11 3.98 13.77 126
8 2007-08 2.24 1.49 0.24 3.97 0.11 4.08 16.49 128
9 2008-09 2.28 1.54 0.25 4.07 0.11 4.18 19.31 129
10 2009-10 2.12 1.83 0.22 4.17 0.13 4.30 22.83 131
11 2010-11 2.19 1.92 0.22 4.33 0.14 4.47 27.74 135
12 2011-12 2.28 2.02 0.22 4.51 0.15 4.66 33.11 139
13 2012-13 2.36 2.12 0.23 4.71 0.15 4.86 38.80 144
14 2013-14 2.36 2.16 0.24 4.75 0.15 4.91 40.14 144
15 2014-15 2.38 2.20 0.23 4.81 0.15 4.96 41.69 145
16 2015-16 3.06 1.61 0.24 4.91 - - - -
Source: Dept. of Animal Husbandry, Dairying & Fisheries, GoI; Annual Administrative Report, ARD Dept.
0.00
10.00
20.00
30.00
40.00
50.00
60.00
20
00
-01
20
01
-02
20
02
-03
20
03
-04
20
04
-05
20
05
-06
20
06
-07
20
07
-08
20
08
-09
20
09
-10
20
10
-11
20
11
-12
20
12
-13
20
13
-14
20
14
-15
20
15
-16
To
tal
mil
k p
rod
uct
ion
(la
kh
mt)
Fig. 1.5: Trends in Total Milk production in West Bengal state (2000-01 to 2015-16)

20
Fig. 1.6: Species wise Trends in Total Milk Productivity in West Bengal state
Out of total bovine milk production in 2015-16, 62.32 per cent share accounts for
Indigenous cattle, 32.79 per cent share accounts for Crossbred cows and remaining 4.89 per
cent was of Buffalo breed (Table 1.14). The significant growth in population of in milk bovine
animals supported by increase in milk yield of bovine animals which has increased (bovine
milk production) by 21.23 per cent in 2015-16 over 2002-03 (Fig. 1.7). The share of cross
bread cows in total milk production has increased while share of indigenous cows and
buffalo has declined during last one and half decade. The corresponding share was 66.75
per cent, 28.19 per cent and 5.06 per cent respectively in 2000-01.
District-wise milk production in West Bengal state for the year 2015-16 is presented in Fig
2.8. It can be seen that Medinipur East and West district jointly is the highest milk producing
district in the state with an estimated milk production of about 903 thousand tonnes during
2015-16 accounting 18.40 per cent of total milk production in the state.
0.00
1.00
2.00
3.00
4.00
5.00
6.00
7.00
20
02
-03
20
03
-04
20
04
-05
20
05
-06
20
06
-07
20
07
-08
20
08
-09
20
09
-10
20
10
-11
20
11
-12
20
12
-13
20
13
-14
20
14
-15
20
15
-16
Indegenous cattle milk yield (kg/day) Crossbreed cattle milk yield (kg/day)
Buffalo milk yield (kg/day)
kg
/da
y

21
0.00
0.50
1.00
1.50
2.00
2.50
3.00
3.50
4.00
0
1,000
2,000
3,000
4,000
5,000
6,000
7,000
8,000
9,000
10,000
20
02
-03
20
03
-04
20
04
-05
20
05
-06
20
06
-07
20
07
-08
20
08
-09
20
09
-10
20
10
-11
20
11
-12
20
12
-13
20
13
-14
20
14
-15
20
15
-16
Bovine Milk production ('000MT)
Bovine population('000)
Milk yield (kg/day)
Fig. 1.7: Yearwise In milk Bovine Population, Milk Yield and Bovine Milk Production
Mil
k y
ield
(k
g)
Bo
vin
e p
op
ula
tio
n (
00
0)/
Bo
vin
e m
ilk
pro
du
ctio
n (
00
0 m
t)
0.00
2.00
4.00
6.00
8.00
10.00
12.00
14.00
16.00
18.00
20.00
0
100
200
300
400
500
600
700
800
900
1000
Ba
nk
ura
Bu
rdw
an
(E
&W
)
Bir
bh
um
So
uth
Din
ajp
ur
No
rth
Din
ajp
ur
Da
rje
eli
ng
Ho
wra
h
Ho
og
hly
Jalp
aig
uri
+A
lip
urd
ua
r
Co
och
Be
ha
r
Ko
lka
ta
Ma
lda
h
Mu
rsh
ida
ba
d
Na
dia
So
uth
24
Pg
s
No
rth
24
Pg
s
Me
din
ipu
r (E
&W
)
Pu
ruli
a
Milk Production (000 MT)
% share to state total
Fig. 1.8: Districtwise Milk Production in West Bengal (2015-16)
Mil
k p
rod
uct
ion
in 0
00
mt

22
Burdwan East and West district jointly is the second largest producer of milk with an
estimated share of about 11.15 per cent, followed by Murshidabad (7.76 %), Bankura
(7.17%) and Nadia (6.48%). The top thirteen districts together contributes about 77.22 per
cent of milk production of the state, those are Bankura, Burdwan (E & W), Birbhum,
Howrah, Hooghly, Jalpaiguri + Alipurduar, Murshidabad, Nadia, North 24 Parganas and
Medinipur (E & W). Category-wise share of milk production in West Bengal clearly indicate
that top ranked milk producer nine districts in West Bengal are dominated by the
production of milk by Indigenous cows, followed by Crossbred, Buffalo and Goat (Table
1.15).
The species-wise district wise milk yield data presented in Fig 1.9 & Map 1.1 indicate that
among the species, the highest milk yield was recorded in buffalo followed by cross breed
cows. The highest bovine milk yield is recorded in Darjeeling district (5.9 kg/day) and the
lowest was in Purulia district (1.1 kg/day). In case of indigenous cows, highest milk yield was
recorded in Kolkata district (5.0 kg/day) and the lowest was in Purulia (0.9 kg/day).
Table 1.15: District wise & category wise Percentage share of Milk Production in WB
Name of the
District
District wise & category wise Percentage share of Milk Production in WB (2014-15)
% share of
Crossbred
Cow
% share of
Indigenous
Cow
% share of
Total Cattle
% share of
Buffalo
% share of
Goat
% share of
Total Milk
Production
Medinipur (E&W) 15.75 18.09 16.97 5.53 13.29 16.32
Burdwan (E&W) 10.10 13.16 11.69 23.71 11.62 12.25
Murshidabad 14.94 5.31 9.94 8.47 9.01 9.84
Nadia 12.72 4.78 8.60 2.11 3.80 8.15
Hooghly 9.58 6.23 7.84 9.46 5.22 7.84
North 24 Pgs 8.85 4.64 6.67 25.41 4.08 7.47
Bankura 4.06 6.68 5.42 4.53 8.29 5.47
Maldah 3.79 5.96 4.92 4.34 7.03 4.95
Howrah 1.61 7.61 4.72 2.80 1.41 4.53
Jalpaiguri +Alipurduar 3.58 4.42 4.02 1.22 3.36 3.86
Birbhum 2.71 4.15 3.46 3.23 9.86 3.64
South 24 Pgs 1.72 4.84 3.34 2.26 3.23 3.29
Darjeeling 5.07 1.82 3.38 1.01 1.49 3.21
North Dinajpur 2.12 3.76 2.97 2.46 5.68 3.03
Cooch Behar 2.11 4.02 3.10 0.31 2.39 2.95
South Dinajpur 0.70 2.95 1.87 0.07 2.77 1.81
Purulia 0.40 1.52 0.98 2.13 7.43 1.23
Kolkata 0.18 0.06 0.12 0.96 0.05 0.16
WB State 100.00 100.00 100.00 100.00 100.00 100.00
Source: NDDB, Kolkata

23
Among the species, the highest milk yield was recorded in cross breed cows in Darjeeling
district (6.5 kg/day) and the lowest was in Purulia district (4.3 kg/day). Kolkata district was
the top rank district in case of buffalo yield (6.7 kg/day) while same was recorded lowest in
Purulia district (2.4 kg/day). The highest milk density is recorded in Hooghly (437
kg/day/sqkm) and at the same time highest per capita milk availability is also recorded in
Hooghly district (248 gm/day) (Fig. 1.10).
1.7 Milk Consumption and Marketable Surplus
On the basis of availability of data on milk utilisation pattern in West Bengal, it has been
found that out of total production of milk at home, about 57 per cent was sold, while 39 per
cent milk was consumed at the home and remaining 4 per cent milk was converted into milk
products in 2009-10. The share of quantity of milk sold has been increased to 65 per cent in
2014-15, while consumption of milk share declined to 22 per cent and share of converted
into milk products increased to 13 per cent during the same period (Table 1.16).
0
5
10
15
20
25
Ba
nk
ura
Bu
rdw
an
(E
&W
)
Bir
bh
um
So
uth
Din
ajp
ur
No
rth
Din
ajp
ur
Da
rje
eli
ng
Ho
wra
h
Ho
og
hly
Jalp
aig
uri
+A
lip
urd
ua
r
Co
och
Be
ha
r
Ko
lka
ta
Ma
lda
h
Mu
rsh
ida
ba
d
Na
dia
So
uth
24
Pg
s
No
rth
24
Pg
s
Me
din
ipu
r (E
&W
)
Pu
ruli
a
We
st B
en
ga
l
Buffalo Crossbred Indigenous Bovine
Mil
k y
ield
(k
g/d
ay)
Fig. 1.9: Specieswise Districtwise Milk Yield (kg/day) 2014-15

24
Map 1.1: District wise Yield of Species

25
Table 1.16: Milk Utilisation Pattern in Households in West Bengal (1997-98 to 2015-16)
Item Milk Utilisation Pattern in Households in West Bengal (1997-98 to 2015-16)
1997-
98
2000-
01
2003-
04
2006-
07
2007-
08
2008-
09
2009-
10
2011-
12
2012-
13
2013-
14
2014-
15
2015-
16
Quantity
sold (%) - - - - - - 57 56 57 57 65 -
Converted
into milk
products
(%)
- - - - - - 4 5 4 5 13 -
Consumed
at home - - - - - - 39 38 39 38 22 -
Source : NDDB (Kolkata); Directorate of Animal Husbandry, Govt. of West Bengal.
1.8 Status of Availability of Feed and Fodder
As against the estimated animals’ requirements of dry matter, feed resources available in
West Bengal are lower. In the last almost one and half decade (1997 to 2011), shortage of
dry matter in the State reduced from 57.86 per cent of the requirement to 46.91 per cent
(Table 1.17).
0
100
200
300
400
500
600
700
800
Ba
nk
ura
Bu
rdw
an
(E
&W
)
Bir
bh
um
So
uth
Din
ajp
ur
No
rth
Din
ajp
ur
Da
rje
eli
ng
Ho
wra
h
Ho
og
hly
Jalp
aig
uri
+A
lip
urd
ua
r
Co
och
Be
ha
r
Ko
lka
ta
Ma
lda
h
Mu
rsh
ida
ba
d
Na
dia
So
uth
24
Pg
s
No
rth
24
Pg
s
Me
din
ipu
r (E
&W
)
Pu
ruli
a
We
st B
en
ga
l
Per capita milk availability (gm/day) Milk Production density (kg/day/sq.km)
Mil
k p
rod
uct
ion
/ A
va
ila
bil
ity
Fig. 1.10: Districtwise Milk Production Density and Per Capita Availability of Milk (2012-13)

26
Green fodder is a comparatively economical source of nutrients. However, the availability of
green fodder is too lower than estimated requirement in West Bengal. The estimation in
2007-08 regarding area under fodder crops indicated that only 0.04 per cent area (3600
hectare) to the gross sown area of 9752 thousand hectare was under fodder cultivation in
West Bengal. Murshidabad district had the largest area under fodder crops (0.15%) followed
by Nadia (0.14%), Hooghly (0.13%), Birbhum (0.05%) and Cooch Behar (0.02%) district (Fig.
1.11). In West Bengal, there is absence of regulated and organized fodder market. Small
scale marketing of fodder exists in all rural areas of the state where fodder are sold by
producers to traders or directly to the consumers. In rural areas, farmers having surplus
fodder sell some quantity to needy cattle owners. Generally, demand for green and dry
fodders in a village is met from within village. While green fodder is available from crops like
lucerne, bajra, maize and sorghum, the sources of dry fodder are crop-residues and by-
product of cereals and pulses crops. Farmers bring head loads or cartloads of fodder from
their fields to the village. Normally, surplus green fodder is sold as standing crop on area
basis. Surplus dry straw is sold either in bundles or weight basis in the village to needy cattle
owners. Natural grass is abundantly available from during the month of September to
October when grass is harvested. Generally, grass producers sell their grass soon after the
harvest to needy farmers. Grass being a bulky and less remunerative product, producers sell
it just after harvest.
Table 1.17: Dry matter Availability, Requirement & Surplus/Deficit in West Bengal
Year Dry matter Availability, Requirement & Surplus/Deficit in WB (000MT)
Availability Requirement Deficit/Surplus
1992 - - -
1997 17,049 40,462 -23,413
2003 27,519 46,308 -18,789
2007 29,344 45,855 -16,511
2008 30,025 46,437 -16,412
2009 30,025 47,347 -17,322
2010 28,165 48,627 -20,462
2011 26,719 50,327 -23,608
Source: NDDB, Kolkata
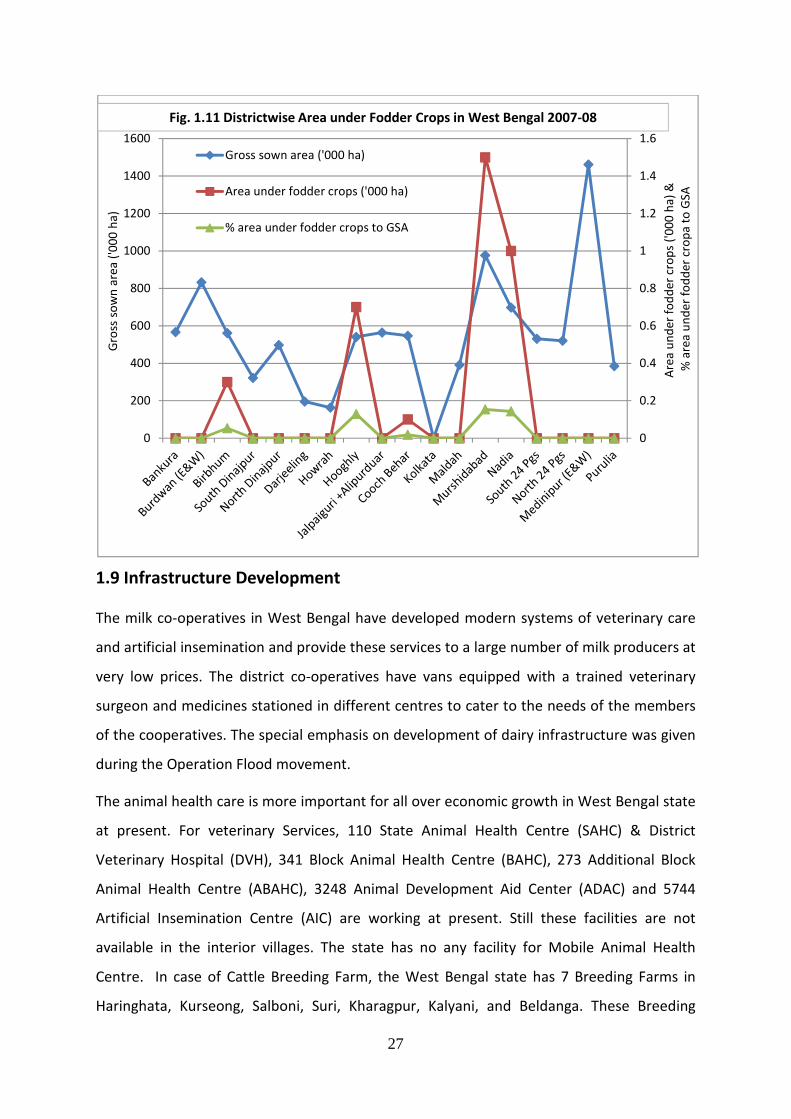
27
1.9 Infrastructure Development
The milk co-operatives in West Bengal have developed modern systems of veterinary care
and artificial insemination and provide these services to a large number of milk producers at
very low prices. The district co-operatives have vans equipped with a trained veterinary
surgeon and medicines stationed in different centres to cater to the needs of the members
of the cooperatives. The special emphasis on development of dairy infrastructure was given
during the Operation Flood movement.
The animal health care is more important for all over economic growth in West Bengal state
at present. For veterinary Services, 110 State Animal Health Centre (SAHC) & District
Veterinary Hospital (DVH), 341 Block Animal Health Centre (BAHC), 273 Additional Block
Animal Health Centre (ABAHC), 3248 Animal Development Aid Center (ADAC) and 5744
Artificial Insemination Centre (AIC) are working at present. Still these facilities are not
available in the interior villages. The state has no any facility for Mobile Animal Health
Centre. In case of Cattle Breeding Farm, the West Bengal state has 7 Breeding Farms in
Haringhata, Kurseong, Salboni, Suri, Kharagpur, Kalyani, and Beldanga. These Breeding
0
0.2
0.4
0.6
0.8
1
1.2
1.4
1.6
0
200
400
600
800
1000
1200
1400
1600
Gross sown area ('000 ha)
Area under fodder crops ('000 ha)
% area under fodder crops to GSA
Gro
ss s
ow
n a
rea
('0
00
ha
)
Are
a u
nd
er
fod
de
r cr
op
s ('
00
0 h
a)
&
% a
rea
un
de
r fo
dd
er
cro
pa
to
GS
A
Fig. 1.11 Districtwise Area under Fodder Crops in West Bengal 2007-08

28
Farms are operating since 1990-91. Besides cattle Breeding Farm, the state has 27 Poultry
Breeding Farms also. The location of these Poultry Breeding Farms is as follows: (i) State
Poultry Farm, Tollygunge, Kolkata, (ii) State Poultry Farm, Nimpith, South 24-Parganas, (iii)
State Poultry Farm, Kakdwip, South 24-Parganas, (iv) State Poultry Farm, Gobardanga, North
24-Parganas, (v) State Poultry Farm, Ranaghat, Nadia, (vi) State Poultry Farm, Krishnagar,
Nadia, (vii) State Poultry Farm, Haringhata, Nadia, (viii) State Livestock Farm, Kalyani, Nadia,
(ix) DCF, Domkol, Murshidabad, (x) State Poultry Farm, Berhampore, Murshidabad, (xi) State
Poultry Farm, Malda, (xii) SDBF, Raigunj, Uttar Dinajpur, (xiii) SDPF, Cooch Behar, (xiv) State
Poultry Farm, Balurghat, Dakshin Dinajpur, (xv) State Poultry Farm, Mohitnagar, Jalpaiguri,
(xvi) PMC, Kurseong, Darjeeling, (xvii) DCF, Purulia, (xviii) SDBF, Medinipur, (xix) SPF,
Medinipur (xx) DCF, Contai, Purba Medinipur, (xxi) SDPF, Bankura, (xxii) DCF, Suri, Birbhum,
(xxiii) State Poultry Farm, Durgapur, Burdwan, (xxiv) State Poultry Farm, Golapbag, Rajbati,
Burdwan, (xxv) DCF, Burdwan, (xxvi) DCF, Baligori, Hooghly, (xxvii) DCF, Kantapukur,
Howrah.
Table 1.18: Veterinary Infrastructure and Manpower in West Bengal state
Year No. of Veterinary
Institutions
No. of
Veterinarians
Cattle Equivalent Units
Per Veterinary
Institution
Cattle Equivalent Per
Veterinarian
2010-11 8440 6538 - -
2011-12 9716 7168 - -
2012-13 9716 6770 - -
2013-14 9102 - - -
2014-15 9014 - - -
Note: Data of “No. of Veterinarians” for the year 2013-14 & 2014-15 is not available.
Source: State Statistical Hand Book 2015 (Vet. Instn) & District Statistical Hand Book 2013 (Vetn), GoWB
Table 1.19: Growth in Infrastructure facilities for Animal Husbandry in West Bengal
Year
Growth in Infrastructure facilities for Animal Husbandry in West Bengal (Nos)
SAHC +
DVH
BAHC ABAHC ADAC MAHC AIC
(including
PB+Coop)
Breeding Farms
Cattle Poultry
1960-61 - - - - - - - -
1970-71 - - - - - - - -
1980-81 - - - - - - - -
1990-91 110 341 270 620 82 114 7 -
2000-01 110 341 271 2147 - 3512 7 -
2010-11 110 341 271 3248 5 4465 7 26
2011-12 110 341 273 3248 - 5744 7 26
2012-13 110 341 273 3248 - 5744 7 27
Source: Statistical Abstract 2014 & District Statistical Hand Book 2013, Govt. of West Bengal; Animal
Resource Development Department, Govt. of West Bengal

29
The details about the veterinary infrastructure and Manpower available in West Bengal
state is presented in Table 1.18, growth in infrastructure facilities for animal Husbandry in
West Bengal is presented in Table 1.19 and district wise number of veterinary institutions in
West Bengal during 2012 – 2013 is presented in Table 1.20.
Table 1.20: District wise Number of Veterinary Institutions in West Bengal (2012–2013)
Sr.
No.
District SAHC +
DVH
BAHC ABAHC ADAC MAHC AIC (including
PB+Coop)
Total
Vet. Insti.
1 Bankura 5 22 22 190 - 343 582
2 Burdwan (E&W) 11 31 20 277 - 473 812
3 Birbhum 7 19 17 167 - 276 486
4 South Dinajpur 2 8 8 65 - 133 216
5 North Dinajpur 3 9 9 99 - 187 307
6 Darjeeling 6 10 7 22 - 69 114
7 Howrah 3 14 11 157 - 254 439
8 Hoogly 5 18 17 210 - 386 636
9 Jalpaiguri 6 13 13 148 - 240 420
10 Cooch Behar 6 14 10 128 - 220 378
11 Kolkata 1 1
12 Maldah 4 15 15 147 - 252 433
13 Murshidabad 8 26 17 255 - 545 851
14 Nadia 9 17 16 187 - 404 633
15 South 24 Pgs 6 29 20 312 - 410 777
16 North 24 Pgs 6 22 16 200 - 397 641
17 Medinipur (E&W) 14 54 36 514 - 864 1482
18 Purulia 8 20 19 170 - 290 507
WB State 110 341 273 3248 - 5744 9716
Source: District Statistical Hand Book 2013, GoWB
There are seventeen Co-operative Milk Unions as well as Co-operative Dairy Unions in West
Bengal. But, there is no authentic and published information regarding Milk processing
capacity in West Bengal state. However, the details on number of societies with bulk milk
cooler (BMC), automatic milk collection System (AMCS) and number of chilling centre with
installed capacity (1000 litres/day) is presented in Table 1.21. Medinipur, North 24
Parganas, Nadia, Darjeeling, South 24 Parganas and Bankura district have these
infrastructure available on larger number than other districts in the state.
1.10 Need of the study
West Bengal, an eastern state of India have moderate to low development status. According
to Census of India 2011, the population density in West Bengal was 1028 persons/ square
kilometre as compared to national average of 368 persons/ square kilometre. Urbanisation
is relatively low (19%) compared to the national average of 31%. The shift from cultivators
to agriculture labourers is significant in West Bengal as compared to national shift. There is

30
a critical need for generating adequate employment opportunities for these groups of
population. But there is a crisis of gainful employment round the year. Dairy farming may
become the alternative way of livelihood for this unemployed population.
Table 1.21: Details about Bulk Cooler, Automatic Milk Collection Systems and Chilling
Centres facility with Dairy Cooperative Societies in West Bengal
Sr.
No.
Name of Milk Producers’
Co- op. Union Ltd.
No. of Societies with No. of Chilling Centre-
Installed Capacity
(1000 litres/day) Bulk Milk
Cooler (BMC)
Automatic Milk Collection
System (AMCS)
1 Midnapore MU 15 80 38.0
2 Damodar MU 7 23 18.0
3 Ichhamati MU 14 52 56.0
4 Bardhaman MU 8 25 23.5
5 Kishan Mu 20 47 43.0
6 Himul MU 21 40 33.0
7 Fedn MU (Murshidabad) 3 0 25.0
8 Bhagirathi MU 1 172 5.0
9 Sundarban MU 14 4 15.5
10 Mayurakshi MU 6 8 6.5
11 Kulick MU (N. Dinajpur) 7 17 7.0
12 Kangshabati MU 18 34 21.0
13 Manbhum MU 2 4 5.0
14 Fedn MU (Malda) 4 8 3.0
15 Howrah MU 8 3 4.0
16 Kulick MU (S. Dinajpur) 3 5 2.0
17 Jalpaiguri 2 0 8.0
Total 153 522 313.5
Source: NDDB, Kolkata
The West Bengal state has predominantly indigenous cows, mostly non-descript. Share of
non-descript indigenous cows in this state is about two-thirds of total cow population. The
productivity levels of milch animals are quite low. This shows that the genetic pool of the
milch animal population is of low quality.
This observation indicate that the status of dairy development in West Bengal is low in
comparison to elsewhere in the country, despite the fact that this region has relatively
superior resource endowment. The dairy cooperative structure in the area has been weak in
comparison to elsewhere in the country. The coverage of dairy cooperatives in terms of
villages, milk producers and share of milk procurement in surplus milk is low. There is
immense potentiality for using agricultural wastes e.g. paddy straw, jute wastes and
vegetable wastes as cheap and economical cattle ration. Preponderance of indigenous

31
animals in the study area would minimise the impact of climate change as they are more
resilient to temperature change. The increased volume of milk through these animals would
also help in reducing pressure from the states where crossbred cows are in majority and
may face an adverse impact of climate change.
To achieve the above growth, it is believed that the quantum jump in milk production is
possible through increase in productivity, and linking small holders to dairy
cooperatives/producer groups/SHGs with forward linkages with milk processing. This means
that the areas which have low levels of productivity, preponderance of low yielding non-
descript animals, but rich in resource endowment and presence of good markets would
require attention of the policy makers for initiating a focussed programme for West Bengal
state. A comprehensive assessment of the present status of dairy development in this state
and potential for growth from the perspective of regional and national consideration needs
to be drawn up for dairy development.
Therefore, the present study was undertaken with the following objectives in the state of
West Bengal. It is an important milk producing state in eastern part of India. The state has a
very few well established cooperative dairy sector, but the growth in dairy is not uniform in
all regions of the state.
1.11 Objectives of the study
a) To assess the present status of dairying with reference to animal distribution, milk
production, consumption and marketable surplus.
b) To identify the constraints in dairy development from supply side, institutional
deficiency and processing infrastructure.
c) To identify different central and state government schemes related to dairy
development at district level and document technical as well as operational details of
the schemes and understand how convergence is ensured.
d) To highlight the facilitating factors that could help promoting dairy development to
improve socio economic status of the milk producers.
e) To suggest broad areas for focussed interventions for promoting dairy development in
the selected state and the way forward.
f) To suggest suitable policy measures to ensure compliance of effective convergence of
various schemes for the benefits of dairy farmers.

32
1.12 Data and Methodology
The study is based on both, the secondary and primary level data. The secondary data
pertain to dairy development efforts, various schemes implemented and in force, changes in
size and composition of livestock population and milch animals as well as milk production
across regions, per capita milk availability, infrastructure available, related data were
compiled from the offices of the NDDB and State Department of Animal Husbandry &
Dairying as well as from the government publications such as Livestock Census (Department
of Animal Husbandry), Statistical Abstract of the State, Economic Surveys and related web
sites. Besides tabular analysis, annual compound growth rates were calculated to indicate
an increase or decrease in livestock populations and other related parameters during inter
census periods / years. For the study, primary data were collected from the selected Milk
producers, Primary Dairy Cooperative Societies and Milk Unions through structured and pre-
tested schedules / questionnaires.
Sampling Framework
The primary data were collected from the sample farmers selected on the basis of the
sampling design described below and as presented in Tables 1.22 to 1.24.
I) Selection of Milk Union/District Milk Union/District (MU/DU/D):
• Four districts, where district milk union is in operation, have been selected for this
study from three agro-climatic regions of West Bengal as per advice from the officials of
NDDB, Kolkata. The districts have been selected because dairy development schemes
are functional in these districts which will help in obtaining data from the study area.
The districts were selected primarily on the basis of quantity of cattle milk production,
performance of district milk union and other development aspects (Map 1.2, Tables
1.22 &1.25).
• It was attempted that the four milk unions / district milk unions / districts were selected
from different regions / zones in order to capture holistic macro picture at the state
level.
• Accordingly, selected 4 districts / milk unions from 3 respective agro-climatic regions
are as follows:
i) North 24 Parganas district from New Alluvial Region,

33
ii) Nadia district from New Alluvial Region,
iii) Bankura district from Red & Laterite Region, and
iv) South 24 Parganas district from Coastal & Saline Region.
For an optimum assessment of the status of dairying in West Bengal, these regions as well as
districts have been selected on the basis of performance of District Milk Union (DMU) ranging
from highly developed to poorly develop. (Table 1.22)
II) Selection of Villages:
• From each milk union / district milk union / district, four villages were selected.
i) Two villages nearer to the MU/DU/District place: One village having dairy
cooperative and one village without dairy cooperative- both located nearby.
ii) Two villages about 25-50 kms away from the MU/DU/District place: One village
having dairy cooperative and one village without dairy cooperative- both located
nearby.
• Thus, total numbers of selected villages in the State were 16 villages.
III) Selection of Milk Producers:
• From each selected village, 15 milk producers (5 from each category) were selected
randomly. Thus, total sample size of milk producers in the State was 240 (15x16).
Table 1.22: Selected Three Agro-Climatic Regions of West Bengal
Regions Districts Features
New Alluvial
Region
North 24 Parganas,
Nadia, Malda,
Murshidabad,
Burdwan
Mostly progressive farmers; deep, alluvial soils are
overexploited due to suitableness of crop
enterprise; ground water, river and canal water
are the main source of irrigation; besides farming,
highly developed dairying and strong dairy
cooperatives exist in this region.
Red &
Laterite
Region
Bankura, Paschim
Medinipur, Purulia,
Birbhum
Mostly arid to semi-arid climate; hard lateritic soil
have poor storability; rain water is the main
source of irrigation; agriculture dependent
mostly on monsoon; moderate dairying and dairy
cooperatives exist in this region.
Coastal &
SalineRegion
South 24 Parganas,
Purba Medinipur,
Howrah, kolkata
Low level of economic enterprise; semi-arid to
humid climate; mostly saline soil; large areas
under rainfed farming systems; poor dairying and
dairy cooperatives exist in this region. Source: District Statistical Hand Book, GoWB, 2014.

34
Table 1.23 Sampling Frameworks
DMU/DU DMU1/DU1 DMU2/DU2 DMU3/DU3 DMU4/DU4
Rank High High Moderate Poor/Low
Taluka/
Block T1 / B1 T2 / B2 T1 / B1 T2 / B2 T1 / B1 T2 / B2 T1 / B1 T2 / B2
Villages V1 V2 V3 V4 V5 V6 V7 V8 V9 V10 V11 V12 V13 V14 V15 V16
Location
clo
se
clo
se
aw
ay
aw
ay
clo
se
clo
se
aw
ay
aw
ay
clo
se
clo
se
aw
ay
aw
ay
clo
se
clo
se
aw
ay
aw
ay
DC/NDC DC NDC DC NDC DC NDC DC NDC DC NDC DC NDC DC NDC DC NDC
Small 5 5 5 5 5 5 5 5 5 5 5 5 5 5 5 5
Medium 5 5 5 5 5 5 5 5 5 5 5 5 5 5 5 5
Large 5 5 5 5 5 5 5 5 5 5 5 5 5 5 5 5
Total
sample
15 15 15 15 15 15 15 15 15 15 15 15 15 15 15 15
30 30 30 30 30 30 30 30
60 60 60 60
PDCS 1 1 1 1 1 1 1 1
TOTAL DMU-04; Village-16; Milk Producers-240; PDCS-08
Note: DMU- District Milk Union; DU- District Union; DC- Dairy Cooperative Village; NDC- Non-Dairy Cooperative
Village; PDCS- Primary Dairy Cooperative Society;
Table 1.24: Total numbers of selected DCS and NDCS Milk Producers in West Bengal state
Districts/
Milk Unions
DCS NDCS
Small Medium Large Total Small Medium Large Total
Ichhamati MU 10 10 10 30 10 10 10 30
Kishan MU 10 10 10 30 10 10 10 30
Kangsabati MU 10 10 10 30 10 10 10 30
Sundarban MU 10 10 10 30 10 10 10 30
West Bengal 40 40 40 120 40 40 40 120
Note: DCS- District Cooperative Society; NDCS- Non-District Cooperative Society
• The milk producers were categorized as follows as per holding of number of cattle
population and random selection method for selecting milk producers was followed from
total milk producers list (without village census):
i) Small Milk Producers (1-2 Milch animal),
ii) Medium Milk Producers (3-5 Milch animal) and
iii) Large Milk Producers (above 5 Milch animal)

35
Table 1.25: Selected villages / talukas / districts / Milk unions in West Bengal state
Sr.
No.
Region/
Region
Name
District Milk
Union
Selected
district
Selected
Taluka
Selected
villages
(DCS)
Selected
villages
(NDCS)
1. South Sundarban District
Cooperative Milk
Producers' Union
Ltd., Alipur*
South 24
Parganas
Basanti Nafarganj
Ranigarh
Basanti Garanbose
Bharatgarh
2. East Ichhamati District
Cooperative Milk
Producers' Union
Ltd., Barasat
North 24
Parganas
Bongaon Nutangram
Ambarpur
Bagdah Malipota
Srinathpur
3. West Kangsabati
District
Cooperative Milk
Producers' Union
Limited, Bankura
Bankura Taldangra Banshkopa
Masatkhal
Simlapal Kushtora
Bankata
4. North-
East
Kishan District
Cooperative Milk
Producers' Union
Ltd, Krishnagar
Nadia Nakashipara Bholadanga
Dahakula
Karimpur Gouas Baliakandi
*Sundarban MU has been functioning for last one year in the district. But selection of South Twenty four
Parganas was strongly suggested by NDDB, Kolkata. Basanti is the nearest block (which is more than 60
kms. away from DHQ) where Milk co-operatives are functioning in some of the villages. Hence, we had to
stick to selection of one CD Block in this district (two villages in close proximity and two far away).
• Data on parameters related cost of milk production were collected from 03 milk
producers from each village (one each from three categories), thus total 48 (3x16) milk
producers.
Data collection from District Milk Union & PDCS:
• Officials of every District Milk Union (DMU) and Primary Dairy Cooperative Society (PDCS)
were interviewed and data were collected with a structured schedule.
Survey Schedules:
The different survey schedules for the collection of data have been developed. Four types of
survey schedules were canvassed in the study area.
• Household Survey Schedule 1.0: To collect the information from the selected milk
producers (covering both those are members of PDCS and non members of such any
cooperative society) on structured interview schedules on some selected parameters
such as: socio-economic characteristics, cropping pattern of sample household, herd
strength & cattle shed, details of breed-able animals on survey date, milk
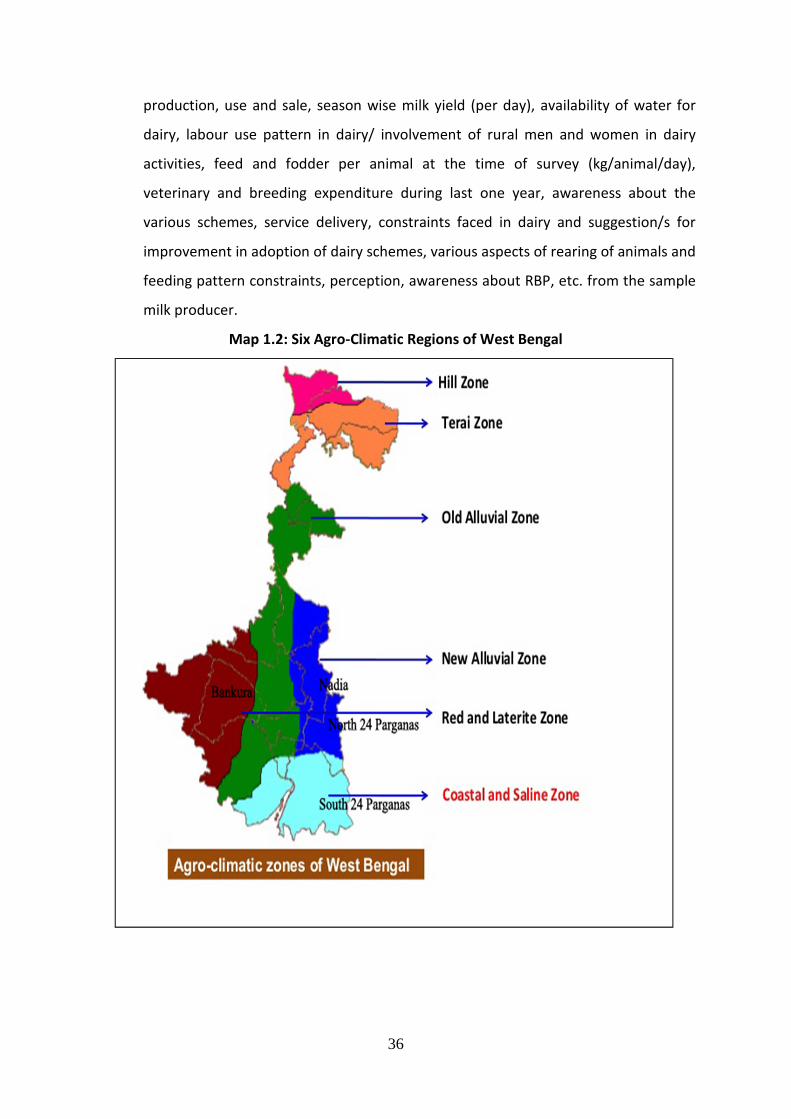
36
production, use and sale, season wise milk yield (per day), availability of water for
dairy, labour use pattern in dairy/ involvement of rural men and women in dairy
activities, feed and fodder per animal at the time of survey (kg/animal/day),
veterinary and breeding expenditure during last one year, awareness about the
various schemes, service delivery, constraints faced in dairy and suggestion/s for
improvement in adoption of dairy schemes, various aspects of rearing of animals and
feeding pattern constraints, perception, awareness about RBP, etc. from the sample
milk producer.
Map 1.2: Six Agro-Climatic Regions of West Bengal

37
Map 1.3: Selected Agro-Climatic Regions of West Bengal
• Household Schedule-Cost of Milk Production 2.0: In order to estimate the cost of
milk production, this schedule was canvassed among the few selected milk producer
households in addition to the information collected in Schedule 1.0.

38
• Primary Dairy Cooperative Society (PDCS) Schedule 3.0: The desired information
from the respondent society/unit/agent was collected in this schedule on selected
aspects such as : total number of members enrolled, availability of some facilities,
month-wise milk collection and rate paid, concentrates supplied by the society/firm
during last one year, veterinary and breeding services provided by society/firm
during last one year, any outbreak of disease of livestock during the past one year,
training arranged/provided by society during last one year, details of development
programmes/support, effect of programmes on key variables, general opinion,
perception, constraints and suggestions regarding particular program, constraints
faced by PDCS/ private firm.
• Milk Union Schedule 4.0: This schedule was designed to collected the information
from milk unions on related parameters such as: districts, villages and PDCS covered,
details on milk collection/procurement, different programs/ schemes, year wise
average cost of processing of milk (Rs/litre) dairy plant, production and marketing of
different product, constraints faced, potential for future and suggestions.
1.13 Limitation of the Study
Though considerable precautions and thoughts have been exercised to make the study
precise, objective and reliable, yet because of limited resources at the disposal, the study
has been restricted to specific areas and could not be extended to larger areas and more
respondents. Individual’s biases and prejudices on the part of the respondents might have
influenced the findings of the study because the field level investigation was based on
individual’s perception and expressed opinion. However, due care was taken to check such
biases, which was not apparent, through inter-checks of different elements of the data.
However, due to its demonstration of the various issues and aspects of the problem, the
study might have much wider application and this could be extended to other similar areas.
Besides, period of survey was also a limitation of this study. The previous years’ data about
dairy farming had been collected in maximum cases. So, collected data about dairy farming
is supposed to reflect the assumption in reply to some questions. In fact, previous years’
information about dairy farming had been collected from the respondents within few hours
of a day. However, the most important limitation of this study is that published information
for Animal Husbandry and Dairying in West Bengal state is too scanty than the requirement

39
of the study. This restricted us to analyse few important dimension of the study, as
compared to other states, which requires comparable and continuous time-series data on
several variables related to dairying and animal husbandry in West Bengal.
1.14 Organization of Report
The entire study report has been organized into eight chapters including Introduction as
Chapter 1. The Status of Dairy Development Institutions in West Bengal based on available
literature published by Government sector has been included in Chapter 2. Policies and
Programmes / Schemes for Dairy Development & Convergence of Schemes have been
described in Chapter 3. Chapter 4 has been furnished with Socio-Economic Profile of
Selected Milk Unions, PDCS / Private Units and Milk Producers. The identity of the 5th
Chapter is presentation of the Cost of Milk Production and Awareness about the Schemes.
The 6th
Chapter has been highlighted the Milk Consumption and Marketable Surplus. The
Constraints faced in Production and Marketing of Milk and Suggestions are the feature of 7th
Chapter. The last and 8th
Chapter has been characterized by Summary and
Recommendations based on findings of this study.
The next chapter presents the “Status of Dairy Development Institutions in West Bengal”.

40
Chapter II
Status of Dairy Development Institutions in West Bengal
2.1 Introduction
Dairying is an important and integral part of the rural economy of West Bengal. Milk
production in the state was estimated at 13,804 tonne kg per day (TKgpd) (5.04 Million MT)
in 2015-16 which is about 3.2 per cent of total milk production of the country (NDDB, 2017).
Milk production in the state has grown at a CAGR of 2.42 per cent during the last 5 years
(NDDB, 2017). Paschim Medinipur is the highest milk producing district in the state followed
by Bardhaman. It is evident that almost half of the total milk production of West Bengal is
concentrated in six districts, namely, Paschim Medinipur, Bardhaman, Murshidabad,
Bankura, Nadia and Hooghly. Out of the total annual milk production of about 5.04 million
tonnes in West Bengal during 2015-16, bulk of the production is destined for home
consumption only (35%) (NDDB, 2017). The organised sector for milk production in West
Bengal is still in the nascent stage and major portion of the marketed surplus is consumed
by the unorganised sector consisting mainly of numerous sweets and sweetmeat shops
situated all around Bengal. However constant efforts were initiated both from central and
state governments since independence to channelize the flow of milk to organized sector
through establishments of milk co-operatives, milk unions and institutional efforts to ensure
remunerative dairy business to the producers.
2.2 Dairy Development Institutions
Table 2.1: Institutions Responsible for Dairy Development and their responsibilities
Name of the Institutions Responsibility
Directorate of Dairy Development Milk Processing & Supply at Greater
Kolkata & other areas
West Bengal Cooperative Milk
Producers’ Federation Ltd. (WBCMPF) Milk Marketing
Mother Dairy, Calcutta Milk Processing & Supply at Greater
Kolkata & other areas

41
2.2.1 Dairy Development Boards/ Corporations/Cooperative Federations:
A. Directorate of Dairy Development:
Directorate of Dairy Development, Government of West Bengal is engaged in the
processing of raw milk to produce pasteurised and homogenised market milk and various
milk products, and sells them through its own network of Milk booths, Suravis, Agents and
Distributors in safe and wholesome condition. With the implementation of Operation
Flood Programme in the mid-1970s, the extension, procurement and other farmer
related activities on Dairy Development have been handed over to the Co-operative
sector, i,e; West Bengal Co-operative Milk Producers’ Federation Limited.
Under this Directorate, the oldest dairy at Haringhata was established in June, 1950
primarily to cater to the demands of local hospitals, government institutions and
common people of Kanchrapara and Kalyani cities. Subsequently four more dairies were
established viz.,
(1) Central Dairy, Belgachia, Kolkata in 1962 - for supply of milk in Greater Kolkata
region,
(2) State Dairy, Durgapur in 1972 - for supply of milk in Durgapur and Asansol areas.
(3) State Dairy, Burdwan in 1982 - for supply of milk in Burdwan
(4) State Dairy, Krishnagar in 1987 - for supply of milk in Krishnagar region.
To feed raw chilled milk to these dairy plants, different chilling plants were established.
However, subsequently considering the reduced demand of raw milk by the government
dairies, it was felt necessary to hand over the chilling plants to the West Bengal Co-
operative Milk Producers’ Federation Limited for their effective use. Accordingly, except
three chilling plants, all ten chilling plants have been handed over to the Milk
Federation/Milk Unions on management and utilisation of assets basis. The State Dairy
at Burdwan was non-operational since 20th May, 2004. Now, it has been handed over to
Mother Dairy, Calcutta on “Management of asset basis” for its utilisation for processing
and packaging of market milk. The production and distribution of milk at the State Dairy,
Durgapur is kept suspended since May 2012 due to administrative unavoidable reasons
(ARD, Govt. of WB, 2014).

42
Different varieties of milk and milk products manufactured and marketed by the
Directorate of Dairy Development, Govt. of West Bengal are being sold under the brand
name “HARINGHATA”.
The central dairy is having the grater installed capacity as compared to other dairies of
the state (Table 2.2). However it is of a major concern that the effective capacity
utilization in all the dairies are much lower than the installed capacity (Table 2.2) which
depicts the decreasing demand of the organized sector in the state.
Table 2.2: Physical Capacities and Capacity Utilization in different dairies
Name of the Dairy Year of
Establishment
Installed
Capacity
(TL
PD)
Capacity Utilized (TLPD)
Central Dairy 09/1962 200 37.90 (18.95%)
Haringhata Dairy 06/1950 50 1.70 (3.4%)
Krishnagar Dairy 01/1987 20 Handed over to Milk Fedn. /
Kishan Milk Union on 05/06/06
Durgapur Dairy 10/1972 50 Non-operational since May 2012
Burdwan Dairy 11/1982 20 Handed over to Mother Dairy,
Calcutta on “Management of
Asset basis” on May 2013.
Source: Animal resource development department, Government of West Bengal
Several bulk chilling plants were established all across the states for immediate
processing of the raw milk and increase its self-life. Most of the chilling plants has been
handed over to the milk federations for operational purposes (Table 2.3).
Bulk of the raw milk procurement is still undertaken mainly through central dairy
situated in Kolkata to cater the entire urban population of the city. However the
proportion of utilisation of value added dairy products like butter is in negligible amount
(Table 2.4).

43
Table 2.3: Status of Chilling Plants of Directorate of Dairy Development
Name of the
Dairy
Chilling Plant Capacity
(TLPD)
Year of
Establishment
Remarks
Central Dairy 1. Champadanga 4 1965 Handed over to Milk
Fedn. (14.02.06)
Haringhata
Dairy
2. Dhaniakhali 5 1965 Handed over to Milk
Fedn.
3. Mogra 4 1965 Closed
4. Habra 4 1960 Handed over to Milk
Fedn.
Krishnagar
Dairy (Handed
over to Milk
Fedn.)
5. Bethuadahri 10 1964 Handed over to Milk
Fedn. (05.10.05)
6. Plassey 4 1965 Handed over to Milk
Fedn. (05.10.05)
7. Fulia 10 1954 Handed over to Milk
Fedn. (05.10.05)
Durgapur Dairy 8. Sonamukhi 4 1973 Handed over to Milk
Fedn. (03.11.06)
9. Bishnupur 4 1972 Handed over to Milk
Fedn. (22.04.08)
10. Baramullah 2 1993 Yet to be handed over
Burdwan Dairy
(Non-functional
since 20.05.04)
11. Shaktigarh 2 1967 Yet to be handed over
12. Katwa 4 1972 Handed over to Milk
Fedn. (21.02.06)
13. Kusumgram 4 1987 Handed over to Milk
Fedn. (06.10.05)
Source: Animal resource development department, Government of West Bengal
In tune with the milk procurement, it is evident that the central dairy is mainly
responsible for milk production only and the other (i.e. Haringhata Dairy) is attempting
to produce value added dairy products (Table 2.5). However considering the changing
demand pattern of the urban consumers to the value added and functional dairy
products, attempts may be initiated to divert the production more towards value added
products rather traditional and bulky milk products.

44
Table 2.4: Dairy-wise Utilization of Raw Materials and Production of Milk & Milk
Products
Sl.
No.
Name of the
Dairy
Raw Milk
Procurement and
Consumption
(TKPD)
Skimmed
MilkPowderConsumption
(MT/ day)
White Butter
Consumption
(MT/day)
1 Central Dairy 11.37 2.01 0.24
2 Haringhata Dairy 1.50 0.03 0.00
Total 12.87 2.04 0.24
Source: Animal resource development department, Government of West Bengal
Table 2.5: Production of Milk and Milk Products Sl.
No.
Name of the Dairy Milk
Production
(TLPD)
Ghee
(MT/Y)
Chocolate
(MT/Y)
Lassi
(MT/Y)
1 Central Dairy 28.71 Nil Nil Nil
2 Haringhata Dairy 1.56 13.07 0.40 Nil
Total 30.27 13.07 0.40 Nil
Source: Animal resource development department, Government of West Bengal
The fund utilization pattern of the different milk supplying institutions depicts
that major portion of the allotment was not utilized (Table 2.6). Further only non-plan
budget was utilised and plan budget was completely un-utilized in all the milk supply
except greater Kolkata (Table 3.6). Planned expenditure will be essential for long run
sustainability of the supplies with greater efficiency and reasons of only non-planned
expenditure may be critically looked into for possible modification in the future budget
allocations.
Table 2.6: Schemes of the Directorate of Dairy Development (2012 - 2013) Scheme Source Allotment
(Rs.)
Fund Utilized
(Rs.) (Total
Expenditure)
Percentage
Utilization
Of Funds
Sales
Proceeds of
Milk & Milk
Products (Rs.)
Greater
Kolkata Milk
Supply
State Plan 21,46,194 8,32,678 38.80 -
Non-Plan 119,52,18,500 69,90,06,028 58.48 24,43,91,259
Durgapur Milk
Supply
State Plan Nil Nil Nil
Nil
Non-Plan 7,99,76,500 3,25,95,410 40.76
Burdwan Milk
Supply
State Plan NIL Nil Nil
Non-Plan 2,51,14,000 1,70,06,734 67.72
Krishnagar
Milk supply
State Plan NIL Nil Nil
Non-Plan 47,33,250 31,81,900 67.22
Source: Animal resource development department, Government of West Bengal

45
Major Activities Undertaken
• Revision of Procurement Price of Raw Milk: The procurement price of raw milk in
flush (3 months) and lean season (9 months) with effect from 1st
April 2014 are
Rs.22.60 and Rs.23.60 respectively per Kg of milk containing 4.5% Fat and 8.5%
Solids-not-Fat. Farmer-Producers, however, get Rs.20.00 and Rs.21.00 respectively
as their share of price.
• State Dairy, Burdwan, which was closed since May, 2004 was handed over to
Mother Dairy, Calcutta in compliance with the Cabinet decision for its operation
on “Management of Assets” basis. The renovation works with a project cost of Rs.
5.74 crores, out of RKVY Fund, has been completed and its operation resumed
since February 2014. At present 2000 litres of processed and packaged milk are
being supplied from the dairy under “Mother Dairy” brand.
• The State-of-the-art newly built Quality Control Laboratory at Central Dairy was
inaugurated by the Hon’ble Chief Minister of West Bengal on 18th Nov. 2013.
• Notifications appointing the officers from this Directorate as Designated Officer and
Food Safety Officers under Food Safety and Standards Act, 2006 and Rules and
Regulations framed thereunder has been withdrawn by the Deptt. of Health and
Family Welfare, Govt. of West Bengal.
Thrust Areas:
(a) Renovation and Modernization of Haringhata Dairy at Mohanpur, Nadia under
RIDF - XVIII is going on in full swing. Approx. 10% of the work has been completed
till March 2014.
(b) Renovation and Modernization of milk processing and packaging facilities at
central dairy aligning well with the requirements of FSSAI requirements.
(c) Renovation and Modernization of Govt. Milk Depots by Franchisee in a P-P-P
model by dovetailing the sales of Directorate of Dairy
Development, WB Livestock Development Corporation Ltd. and Mother
Dairy, Calcutta through modern day kiosks by modernising the Govt.
Milk depots through franchisee has been initiated and 7 (seven) such

46
depots, located at prime areas in Kolkata, have already been converted
and are in operation. Several other depots will be modernized in the same
manner.
(d) ‘Khatal’ Removal and beautification of Kolkata: A total of 40 cattle, stray and from
Khatals, have been seized and removed from Kolkata Municipal Corporation area.
(e) Develop alternative sources of raw milk from private producer-suppliers of our
state to meet up the raw milk demand of the Govt. Dairies.
(f) Disposal of Condemned vehicles and unserviceable Plant machineries: Steps have
been initiated to dispose of the condemned vehicles (especially milk vans) of
this Directorate and also the unserviceable and obsolete plant and machineries
(Animal resource development department, Government of West Bengal, 2014).
B. West Bengal Co-Operative Milk Producers’ Federation Ltd.
West Bengal Co-operative Milk Producers’ Federation Ltd. (Federation) was
formed as an apex body of milk cooperatives in West Bengal for developing the dairy
industry. It was registered in 1983.
The mandate of the Federation is to achieve the following objectives:
Objectives:
• To provide assured and remunerative market for the milk produced by the
farmer members.
• To provide quality milk to urban consumers.
• To build village level institutions in cooperative sector to manage the dairy
activities.
• To ensure provision of milk production inputs, processing facilities and
dissemination of know how.
• To facilitate rural development by providing for self-employment at village
level thereby, preventing migration to urban areas and opportunity for steady
income.

47
The philosophy of the Federation is to organize institutions to be owned and managed
by the milk producers themselves to achieve economies of scale to ensure maximum
returns and at the same time to provide quality milk at reasonable price to urban
consumers (Animal resource development department, Government of West Bengal,
2014).
Ultimately, the network of cooperative organizations should build a bridge between
masses of rural producers and millions of urban consumers and achieve a socio-
economic transformation in the state.
Present Status
Presently, 4120 primary milk producers’ cooperative societies in the village level collect
milk from its producer members and make regular payment. In addition, the district Milk
Unions, provide various services, like veterinary cover, artificial insemination, fodder etc.
to its producer members. These societies within a milk shed, normally co-terminus with
the districts, affiliate themselves into District Milk Unions, which collect the milk
procured by the Primary Milk Producer’s Cooperative Societies from their doorstep,
processes and markets the milk in the district or outside. The Milk Unions facilitate
various inputs to the primary societies for onward transmission to producer members.
The District Milk unions, in turn, affiliate themselves into the West Bengal Milk
Federation, whose role is to guide and monitor the Milk Unions in all its activities and for
development and implementation of the various Government schemes.
The Federation has 93% of its share held by the State Government, providing share
contribution of Rs.383.49 lakh and Rs.29.38 lakh from Milk Unions totalling Rs.412.87
lakh. It has a Board of Directors with Chairpersons of the Milk Unions and Govt.
nominee. Presently post of the Chairman is held by the State Govt. nominee.
Present infrastructure of the federation:
i. 6.00 lakhs LPD Mother Dairy Plant (of the State Government) managed by the
Federation at Dankuni, Hooghly.
ii. 1.00 lakh LPD Dairy Plant of Himul Milk Union at Matigara, Darjeeling.
iii. 1.50 lakh LPD Dairy Plant of Bhagirathi Milk Union at Berhampore,
48
Murshidabad.
iv. 4.00 lakh LPD Metro Dairy (Joint Venture in which the Federation holds
47% equity) at Barasat, North 24 - Parganas.
v. Two 100 MT / Day Cattle Feed Plants of Himul (at Matigara) and of Bhagirathi
(at Berhampore).
vi. 146 Chilling Units having Chilling Capacity of 2.49 lakh litres per day.
vii. Four Dairy Plants having capacity of 4000 LPD (expandable to 10000 LPD)
each at (i) Bolpur, Dist. Birbhum (ii) Raigunj, Dist. Uttar Dinajpur (iii) Belguma,
Dist. Purulia & (iv) Raipur, Dist. Bankura.
viii. 10000 LPD Dairy at Cooch Behar handed over to Cooch Behar Zilla
Parishad.
ix. 20000 LPD State Dairy Krishnagar handed over by the State Govt. to the
Federation and run by the Kishan Milk Union.
x. Benmilk Training Centre (BTC) at Berhampore, Murshidabad.
xi. Kishan Bhaban (Farmer’s Hostel) at Belgachia, Kolkata.
During the year 2013 - 2014 on average 285.40 TKgPD milk was procured from various
District Milk Unions covering 1637 functional societies and 2.75 lakh farmer members.
Major portion of the procured milk was supplied to different urban dairies namely
Mother, Metro and Central Dairies, which marketed in and around Kolkata both
processed milk and milk products.
The federation is continuously procuring raw milk from the dairy producers both in flush
as well as lean seasons. The minimum price for farmers increased marginally since 2012
in tune with the increasing market price of raw milk but the producer’s share have
decreased from 2012. But overall the producers’ share was sufficiently high as compared
to other mode of disposal (Table 2.7).

49
Table 2.7: Procurement Price of Raw Milk per kg (4.5% Fat / 8.5% SNF)
With effect from 01.12.2012 Producers’ share
Flush season 19.80 Minimum Farmer’s Price 18.00 91.00%
Lean season 20.85 Minimum Farmer’s Price 19.00 91.00%
With effect from 01.04.2014 Producers’ share
Flush season 22.60 Minimum Farmer’s Price 20.00 88.50%
Lean season 23.60 Minimum Farmer’s Price 21.00 89.00%
Source: Animal resource development department, Government of West Bengal
The state is having around fifteen milk unions from the districts from which two unions is
currently not functioning (Table 2.8). The highest milk is procured from Bhagirathi milk
union in Murshidabad (146 lakh Kgs per annum) followed by Kisan milk union in Nadia
district (144 lakh Kgs. Per annum). However in respect of percentage of total milk
procured the non-MPCS tops the chart as almost 26% of the total milk procured is
destined to the non-MPCS (Fig 2.1). The procurement in few unions is miserably low (e.g.,
Burdwan, Bankura, North Dinajpur, Howrah etc.) comparing to the other performing
unions (Table 2.8). Efforts should be initiated to improve the supply of milk to organised
sectors through these milk unions for better price realisation as well as overall wellbeing
of the milk producers in those areas.

50
Table 2.8: Daily average Milk Procurement from DCS / WDCS of the Milk Unions during
the year 2013 - 14 (Fig. in TKgPD)
NAME OF THE MILK UNION/ UNIT Daily Average Milk
Procurement (TKgPD)
Annual Milk
Procurement (Lakh Kg)
HIMUL (Darjeeling)
BHAGIRATHI (Murshidabad)
KISHAN (Nadia)
MIDNAPORE (Medinipur)
BARDHAMAN (Burdwan)
DAMODAR (Hooghly)
ICHHAMATI (North 24-Parganas)
HOWRAH (Howrah)
JALPAIGURI (Jalpaiguri)
COOCHBEHAR (Coochbehar)
KULICK (Uttar Dinajpur)
MAYURAKSHI (Birbhum)
SUNDARBAN (South 24-Parganas)
KANGSABATI (Bankura)
MANBHUM (Purulia)
FEDERATION
DAIRPOUL
NON MPCS
T O T A L
10.50
40.10
39.52
30.10
3.15
16.98
14.51
3.97
Presently Defunct
Presently Defunct
2.12
2.30
0.78
8.83
0.45
33.00
5.00
74.10
285.40
38.325
146.365
144.248
109.865
11.498
61.977
52.961
14.490
Presently Defunct
Presently Defunct
7.738
8.395
2.487
32.230
1.642
120.450
18.250
270.465
1041.710
Source: Animal resource development department, Government of West Bengal
Fig 2.1: Daily Average Milk Procurement and Percent procured by different Milk Unions
Source: Animal resource development department, Government of West Bengal
10.5
40.1 39.52
30.1
3.15
16.98 14.51
3.97 0 0 2.12 2.3 0.78
8.83 0.45
33
5
74.1
3.68
14.05 13.85
10.55
1.10
5.95 5.08
1.39 0.00 0.00 0.74 0.81 0.27
3.09 0.16
11.56
1.75
25.96
0.00
5.00
10.00
15.00
20.00
25.00
30.00
0
10
20
30
40
50
60
70
80
Pe
rce
nt
Pro
cure
d
Da
ily
mil
k P
rocu
rem
en
t
Name of the Milk unions
Daily Avg Milk Procurement Percentage Procured

51
Other initiatives towards Dairy Development
The Federation has implemented the Women Dairy Co-operative Project (WDCP) funded
by the Ministry of HRD, Govt., of India and thereby empowering the Women
economically and socially.
599 Women Dairy Co-operative Societies have been organized with 57837 women
members pouring on an average 37856 kgs. of milk per day. The WDCP was put into
operation in April, 1993 and Rs.13.40 crores was received from Govt. of India for
implementing the project in the districts;-
Phase - I 24 Parganas (North), Murshidabad, Darjeeling, Jalpaiguri & Bardhaman
Phase - II Bankura, Coochbehar, Midnapore, & Hooghly
Phase - III 24 Parganas (North), Bardhaman & Murshidabad
Phase - IV Midnapore, Coochbrhar, Darjeeling & Murshidabad
Phase - V 24 Parganas (North), Dakshin Dinajpur, Murshidabad & Hooghly
Phase - VI Midnapore, Darjeeling, Malda & Bardhaman
Funded by the Ministry of Agriculture, Govt. of India the Federation is also
implementing Integrated Dairy Development Project (IDDP) in the hilly, Non-OF and
backward areas of West Bengal.
650 Primary Societies have been organized with 36564 members procuring 11493 kgs. of
milk per day. The IDDP has been operating from April 1995 and Rs.12.77 crores
received from Govt. of India, Rs.10.96 crores has been utilized for implementing the
project in the following districts:-
Phase - I Birbhum, Jalpaiguri, 24 Parganas (South) & Uttar Dinajpur
Phase - II Purulia
Phase - III Howrah
Phase - IV 24 Parganas (North), Purulia, Birbhum, Bankura & Dakshin Dinajpur
Bhagirathi and Ichhamati Milk Union are included under Clean Milk Production (CMP)
Project of TIFAC. The total project cost is Rs.224 Lakh, out of which TIFAC authority
will provide Rs.100 lakh and the balance by State Govt. Expenditure to the extent of

52
Rs.186.99 lakh has so far been made.
Since 2008-09 CMP under Phase - I with the assistance from Govt. of India is being
implemented in the milk unions viz. Himul, Midnapore, Bardhaman, Kulick, Kangsabati
and Mayurakshi. Fund to the tune of Rs. 281.68 lakh having been received from the
Govt. of India was fully utilized for setting-up of Bulk Milk Coolers, MilkTesting
Equipments, and Training etc. Since 2011-12 CMP under Phase - II is being implemented
in the Milk Unions viz. Ichhamati, Howrah and Kishan at a cost of Rs. 172.48 lakh. Rs.
100.44 lakh was received by the Federation out of which Rs.100.61 lakh has been
utilised.
Projects Undertaken by the Federation
Table 2.9:A brief account of different projects during 2013 -14 (in Rs. Lakh)
Name of
Scheme
Financial
Achievement in
2013-14
Physical Performance in 2013-14
Clean Milk
Production
(CMP-II)
Centrally
Sponsored
Scheme
Fund Received
Rs. 49.22 lakh
(14.01.13)
Spent Rs.37.68 Lakh
during the year 13-
14& during the year
12-13 Rs. 11.54 Lakh
1. Installation of BMCU (500 LPD): 7 nos. in three
Districts [Howrah (Udaynarayanpur)-1 no./North
24 Pgns (Bagdah & Gaighata)-4 nos./
Nadia((Karimpur)-2 nos.]
Beneficiaries- 7 Milk Coop Societies under 3
District Milk Unions.
2. Distribution of 2000 SS Milk pails (5 Ltr.) to milk
farmers under 3 Dist Milk Unions
(Howrah/Kishan/Ichamati).
Beneficiaries- 2000 milk Coop Farmers.
3. Distribution of 3850 sets Hygiene & Detergent Kit to
milk farmers under 3 District Milk Unions.
Beneficiaries- 3850 milk farmers.
4. Training of milk farmers on Clean Milk
Production- 3000 nos. (Howrah (Howrah)-500/
Ichamati (N.24Pgns)-1500/ Kishan (Nadia)- 1000
Beneficiaries- 3000 milk Coop Farmers.
Intensive
Dairy
Development
Project-IV
(IDDP-
IV)Fund Recd.
Rs. 365.86
Lakh
(Oct’12)
Centrally
Sponsored
Scheme
Spent Rs. 93.26
Lakh during the
year 13-14
& during the year
12-13
Rs.111.034 Lakh
1. Installation of IBT (1 no.), Milk Condensing Unit
(1 no.), Boiler (1 no.), Walk-in-Cold Store (1 no.)
and ETP(1 no.) at Berachampa CP in North 24
Pgns Distt under Ichamati Milk Union.
Beneficiaries- Ichamati Milk Union (1600 farmers)
2. Supply of Milk can, Fodder seed, Cattle Feed,milk
testing equipment, vaccine & dewormer, milk
testing equipment, with training of farmers tothemilk
farmers under IDDP-IV in 2 Distt MilkUnion.
Beneficiaries-1600 farmers of 2 Milk Unions
(Ichamati/ Manbhum).

53
National
Mission for
Protein
Suppliment
(Under
RKVY)
Fund Recd
Rs. 277.0
Lakh
(Apr’13)
Centrally
Sponsored
Scheme
Spent Rs. 277.00
Lakh during the
year 13-14
1. Distribution of 17,000 SS milk pails (5 Ltr) to the
milk farmers in the Districts (Bardhaman/
Bankura/Purulia/Paschim Midnapore/ Howrah/
Nadia/N.24 Pgns./Murshidabad/U.Dinajpur/
Darjeeling)
Beneficiaries- 10 District Milk Union (17,000 milk
Farmers)
2. Distribution of 180 nos. AMCU (Automatic Milk
Collection Unit) in 7 Distt. Milk Unions (Nadia/
D.Dinajpur/Murshidabad/Bankura/ Birbhum/
Howrah/Paschim Midnapore)
Beneficiaries- 180 Milk Coop Societies under 7
Distt. Milk Union.
3. Installation of BMCUs (2000 LPD): 3 nos. in 2
Districts [Howrah (Shyampur)-1 no/ Bankura
(Kotulpur & Khatra)-2 nos.]
Beneficiaries- 2 Distt. Milk Union (Howrah &
Kangsabati).
State Plan
(13-14)
(Development
of Milk
Cooperatives
& Transport
subsidy on
Cattle Feed)
Fund Recd
Rs. 900.00
lakh in the
month (Sept’
13, Jan’ 14 &
Mar ’14)
Spent Rs. 546.73
Lakh during the
year 13-14
1. Reimbursement of Fund in terms of special
financial Assistance to meet up milk productioncost to
the milk producers under 10 Distt. MilkUnions
(Bhagirathi/Kishan/Midnapore
West/Damodar/Bardhaman/Ichamati/
Kangsabati/Kulick/Sundarban/Howrah).
Beneficiaries- 10 Distt. Milk Unions (70,000 milk
farmers).
2. Transport subsidy on cattle feed distribution to theCoop
farmers under14 Distt. Milk Union
(Bhagirathi/ Kishan/ Midnapore West/Damodar/
Bardhaman/Ichamati/Kangsabati/Kulick/
Sundarban/Howrah/Manbhum/Tamralipta/May
urakshi/himul). Beneficiaries- 14 Distt. Milk Union
(80,000 milk farmers)
State Plan
(12-13)
(Dairy
Infrastructure
Development)
Fund Recd.
Rs. 300.00
Lakh
(Apr’ 13)
Spent Rs. 265.92
Lakh during the
year 13-14
1. Established & Started activity of Tamralipta Milk
Union, in Purba Midnapore.
2. Establishment of one new 2000 LPD BMCU centre
at Ramnagar, Purba Midnapore.
Beneficiaries- Tamralipta Milk Union(500 milk
farmers)
3. Construction of boundary wall at Belguma Dairy,
under Manbhum Milk Union.
Beneficiaries- Manbhum Milk Union (Purulia).
4. Establishment of 2 KL BMCU (2 nos.) at Indus &
Patrasayer under Kangsabati Milk Union.
Beneficiaries- Kangsabati Milk Union (2500 Milk
farmers under NDP-I)
State Plan
(13-14)
Fodder
Development
Spent Rs. 18.74
Lakh during the
year 13-14
Released the fund among eight potential Milk
Unions (Midnapore/Brahman/Damodar/ Ichamati/
Kishan/Howrah/Bhagirathi/Tamralipta) for
distribution of seeds, preparation of fodder plot,

54
Program)
Fund Recd
Rs. 18.74
Lakh(Mar’ 14
straw/cellulosic waste enrichment.
Beneficiaries- 8 Milk Union (3050 Milk Farmers)
National
Dairy Plan-I
(NDP
Spent Rs. 113.60
Lakh During the
year 13-14
1. Village based milk procurement system (VBMPS)
organized: 209 nos. in 4 Districts (Bankura/Nadia/
Murshidabad/North 24 Pgns.) under Kangsabati,
Kishan, Bhagirathi and Ichamati Milk Union
Beneficiaries- 4 Distt. Milk Unions (8360 milk
farmers)
2. Fodder Development in Murshidabad District
under Bhagirathi Milk Union within 62 nos. of
Societies organized under NDP-I.
Beneficiaries- Bhagirathi Milk Union(2480 milk
farmers)
Source: Animal resource development department, Government of West Bengal
The milk unions have received funds from NDDB under National dairy Plan-I starting from
2013 and within one year three milk unions were able to utilise most of the fund under
village based milk procurement scheme (utilization is more than 70% and highest of 92% in
Ichhamati milk union in North 24 Pargana) (Table 2.10). However there is still larger scope
of fund utilization from the scheme in the rest unions. The NDP from NDDB may act as a
true catalyst in reviving the milk unions in the state and increase the flow of raw milk to the
organized sectors in tune of the other dairy developed state like Gujrat.
Table 2.10: Details of National Dairy Plan-I (NDP-I) (2013-14) in different Milk Unions
(inRs. Lakh) Sr.
No
.
Name of EIA Sub
Project
PSC
approval
date
Total
Outlay
Fund
released
till
31.03.2014
Fund
Utilized
Percentage
Utilization
of released
fund
1 Bhagirathi Milk
Union
(Murshidabad)
FD 11.2.13 45.46 23.35 12.65 54.16
2 Bhagirathi Milk
Union
(Murshidabad)
VBMPS 11.2.13 196.02 16.43 11.57 70.41
3 Ichamati Milk
Union
(North 24-
Parganas)
VBMPS 24.5.13 106.74 25 23.05 92.19
4 Kangsabati Milk
Union
(Bankura)
VBMPS 24.5.13 273.03 49.6 41.34 83.33
5 Kishan Milk Union
(Nadia)
VBMPS 24.5.13 223.48 48 25 52.08
Total 844.73 162.38 113.60
FD- Fodder Development, VBMPS- Village Based Milk Procurement System
Source: Animal resource development department, Government of West Bengal

55
An insight into the profit and loss statement of different milk unions from 2007-08 to
2012-13 reveals that out of total 15 milk unions established in the state, 13.33% (2 in
nos.) were defunct and almost 60% of the total milk unions were more or less in
profitable situation during the period (Table 2.11). However 20% of the total established
unions, namely himul, kisan and manbhum were continuously running in loss during the
period (Table 2.11). Moreover, it is matter of concern that more unions were prone to
loss during the later period as compared to the earlier period. It may also be enunciated
from the figures that farmer producers are losing interest in supplying raw milk to the
unions and more milk is diverting to unorganised sectors (Table 2.11). A further study
into the mode of operations of these unions may help to get better insight of the
situation and improve the situation thereof.
Table 2.11: Profit & Loss Status of Milk Unions (in Rs. Lakh)
NAME OF M.U. 2007-08 2008-09 2009-10 2010-11 2011-12 2012-13
HIMUL (2.04) (5.76) (101.87) (244.60) (239.38)
BHAGIRATHI (117.11) (42.14) (4.57) 3.00 13.75 95.06
KISHAN (40.37) (3.57) (41.13) (29.67) (25.73) (25.63)
MIDNAPORE 1.30 0.47 7.85 3.04 1.78 1.24
BARDHAMAN 1.43 8.34 9.06 4.01 3.91 (6.64)
DAMODAR 18.23 38.99 23.35 16.81 (14.77) (70.81)
ICHHAMATI 17.08 17.99 18.62 20.00 7.34 (39.54)
HOWRAH 0.16 0.94 1.29 2.24 2.54 1.94
JALPAIGURI Presently Defunct
COOCHBEHAR Presently Defunct
KULICK 1.57 1.87 2.62 2.05 2.75
MAYURAKSHI 4.41 6.99 1.34 2.25 4.11
SUNDARBAN 3.93 0.74 0.82 0.58 3.89 0.33
KANGSABATI (9.41) (12.07) 0.08 54.49 40.00
MANBHUM 0.18 (17.57) (36.13) (14.09) (9.82) (2.98)
* Figures in the parenthesis denotes loss
Source: Animal resource development department, Government of West Bengal

56
Apart from managing the unions, the federation is also engaged in organizing ‘Dairy Co-
operative Societies’, ‘Women Dairy Co-operative societies’, establishment of artificial
insemination centre to uplift the genetic potential of the cattle in the state. A glimpse of
the physical achievements of the federation is enlisted in the following (Table 2.12).
Table 2.12: Physical Achievements of WBCMPF
PARTICULARS 2010-11 2011-12 2012-13 2013-14
DCS/WDCS organized (cum) 3862 3899 3998 3086
DCS/WDCS registered (cum) 2050 2058 2138 1034
Farmer members (cum) 257652 259334 267124 274530
Avg. milk procurement (Kg. PD) 330500 307330 334080 285400
AI Sub Centres (cum) 669 663 610 612
AI done 367869 346563 330230 302318
Avg milk procured per farmer 1.28 1.18 1.25 1.04
W D C P :
WDCS organised (cum) 599 599 599 599
WDCS registered (cum) 426 426 426 426
Farmer Members (cum) 57591 57709 57709 57837
Avg. Milk procurement 39361 39100 33100 37856
I D D P :
DCS organised (cum) 441 551 650 650
DCS registered (cum) 295 297 305 331
Farmer Members (cum) 26287 31724 36564 36564
Avg. Milk procurement 9894 15204 19160 11493
Source: Animal resource development department, Government of West Bengal

57
Table 2.13 Infrastructure as on 31st March 2014 in Co-op Sector
District /
Milk
Union
Chilling Infrastructure Total
Chilling
Infrastructu
re
Dairy
Plant
Cattle
Feed
Plant
No.
of
AMC
U
Chilling
Plant
BMCU
Qty
(No)
Capac
ity
(TLP
D)
Qt
y
(N
o)
Capacit
y
(TLPD)
Qt
y
(No
)
Capacity
(TLPD)
Qt
y
(N
o)
Capacit
y
(TLPD)
Qt
y
(N
o)
Capacity
(MT/Day
)
Darjeeling /
HIMUL - - 21 21 21 21 1 100 1 100 40
Murshidabad
/ Fedn. 1 10 3 12 4 22 - - - - 15
Nadia /
Kishan - - 14 30 14 30 1 20 - - 47
Midnapore/
Midnapore - - 15 35 15 35 - - - - 80
Hooghly /
Damodar - - 7 14 7 14 - - - - 23
Burdwan /
Bardhaman 2 6 8 7.5 10 13.5 - - - - 25
24 Pags (N) /
Ichhamati 2 8 12 29 14 37 - - - - 52
24 Pags (S) /
Sundarbon - - 14 15.5 14 15.5 - - - - 4
Birbhum /
Mayurakshi - - 6 6.5 6 6.5 1 4 - - 8
Uttar
Dinajpur /
Kulick
- -
7
7
7
7
1
4
-
-
17
Dakshin
Dinajpur
/Kulick
- -
3
1.5
3
1.5
-
-
-
5
Malda /
Kulick - - 4 3 4 3 - - - - 8
Bankura /
Kangsabati - - 17 31 17 31 1 4 - - 34
Purulia /
Manbhum - - 2 1 2 1 1 4 - - 4
Howrah /
Howrah - - 7 9 7 9 - - - - 3
Murshidabad
/ Bhagirathi - - - - - - 1 150 1 100 172
Purba
Medinipur /
Tamralipta
- -
1
2
1
2
-
-
-
-
-
T O T A L 5 24 141 225 146 249 7 286 2 200 537
Source: Animal resource development department, Government of West Bengal
A critical look into the performance of the milk unions during 2013-14 reveals that all the
milk unions were engaged in organising primary milk co-operatives and till the reported
period, Murshidabad milk union had the highest no of functional cooperatives (396)
followed by Nadia (266) and Ichhamati (241). The performances of Purba Medinipur, South

58
24 Pargana and Purulia were poor as they failed to have any functional milk co-operatives
(nil in case of Purba Medinipur) or very less in number (13 each for South 24 Pargana and
purulia) (table 2.14). Bhagirathi milk union in Murshidabad has the highest farmer member
(68130, 24.82%) followed by Ichhamati milk union in North 24 Pargana (36225, 13.20%), and
Kisan milk union in Nadia (33481, 12.20%). Besides organising the milk co-operatives, the
unions also provides AI service to their farmer members and each unions have their own AI
sub centres. In this case also, Murshidabad union is having the largest number of AI sub
centres (191) among all the unions followed by Midnapur union (111) and Ichhamati Union
in North 24 Pargana (80). Poor performance of the few milk unions is also evident from their
poor organisation of milk co-operatives and insufficient AI facilities to the members
resulting into poor financial performances as evident from the earlier discussion.
Table 2.14: Performance of Milk Union during 2013-14 District / Milk
Union
Primary Milk Co-operatives Farmer
Member
s(cum)
AI. Sub-
centres
(cum)
A.I.
Done
Female
Calves
Born
Organised
(cum)
Registered
(cum)
Functional
(cum)
Darjeeling/HIMUL 526 348 138 23089 20 982 275
Murshidabad /
Bhagirathi
760 460 396 68130 191 64166 19377
Nadia / Kishan 472 283 266 33481 52 48146 7279
Midnapore/
Midnapore
477 290 214 27583 111 69177 15998
Bardhaman/
Bardhaman
193 101 37 10783 38 31623 4022
Hooghly/Damodar 292 131 35 26975 30 7955 1579
North 24-
Pgs/Ichhamati
582 163 241 36225 80 37660 4332
Howrah/Howrah 96 46 60 4394 Done by ARDD
Dinajpur (N&S),
Malda/Kulick
178 99 26 13337 6 9259 1420
Birbhum/
Mayurakshi
149 43 42 6765 26 12361 1826
South 24-
Pgs/Sundarban
121 92 13 9220 16 3701 445
Bankura/
Kangsabaty
175 56 156 10725 25 14457 1577
Purulia/Manbhum 74 44 13 3823 17 2831 431
Purba Medinipur/
Tamralipta (de-
affiliated from
Paschim Medinipur)
25
Total 4120 2156 1637 274530 612 302318 58561
Source: Animal resource development department, Government of West Bengal

59
C. Mother Dairy Calcutta (MDC)
Apart from Directorate of Dairy Development and West Bengal Co-operative Milk Producers
Federation, Mother Dairy Calcutta is also providing necessary support towards dairy
development in the state through its own infrastructural and managerial capabilities. Today
Mother Dairy has become a household name in case dairy products to the urban consumers
of the state especially greater Kolkata and neighbouring towns. A glimpse of the main
activities of Mother dairy is enlisted below.
• Fresh milk collected from village level dairy cooperative societies (through
Milkfed) &self-help group in Non-MPCS areas.
• This has resulted in increase of collection capacity of Mother Dairy from 80,000
litres to1.60 lakh litres per day (avg).
• From loss it has come to profit of Rs. 11.00 crore during the year 2012-13, Rs.
5.38 crore during the year 2013-14.
• It has launched various products like Flavoured Yoghurt, Probiotic Doi,
Paneer, Mango Pudding, Vanilla & Chocolate Flavoured Ice Cream Cones, Choco &
Orange Candy.
• It has set up 18 modernized Milk Depots in collaboration with WB Livestock
Dev. Corporation and Directorate of Dairy Development to sell their products
jointly all over Kolkata.
• MDC has taken over Burdwan State Dairy which was closed for more than 9
years. The renovation works with a project cost of Rs. 5.70 crore has been
completed that start functioning from February 2014.
• It has launched 100 ice cream push carts to expand its sale of ice cream
products in Kolkata.

60
Table 2.15: Performance at glance
SL.
NO
ACTIVITY UNITS As On
16.09.2014
1 Raw Milk Procurement Ton KG / Day 161.3
2 Total Nos. of Milk Booths/Outlet Nos. 1943
3 Total Nos. of Delivery Boys (door to door
service)
Nos. 13500
4 Total No of self-employment generation
(including Delivery Boys)
Nos 19430
5 Average Daily Sale of Liquid Milk Ltrs/day 305967
6 Sale of Mishti Doi/Yoghurt Kg/day 1356
7 Sale of Probiotic Doi Kg/day 785
8 Sale of Paneer Kg/day 825
9 Sale of Ice Cream Kg/day 451
10 Peda Kg/day 30
11 Mango Pudding Kg/day 30
12 Cow Ghee Kg/day 100
Source: Animal resource development department, Government of West Bengal

61
Table 2.16: District-wise Outlets of Mother Dairy Calcutta
District Kiosks/
Outlets for
self-
employment
as on
31.03.2013
Targeted No
of Kiosks/
Outlets for
self-
employment
(2013-14)
Actual No
of Kiosks/
Outlets
achieved for
self
employment
(2013-14)
Kiosks/
Outlets for
self-
employment
as on
31.03.2014
Reamrks
Kolkata 899 175 180 1079 1) No of
persons
engaged
in each outlet -
10
2) Total no of
self-
employment
-25270
Bankura 18 8 6 24
Birbhum 25 12 10 35
Burdwan 120 25 18 138
Coochbehar 5 0
D Dinajpur 5 0
U Dinajpur 5 0
Darjeeling 28 20 16 44
Howrah 272 35 28 300
Hooghly 239 25 22 261
Jalpaiguri 5 5
Malda 31 20 15 46
Murshidabad 5 0
Nadia 26 15 12 38
North 24 Pgs 149 30 22 171
South 24 Pgs 118 50 42 160 Paschim
Medinipur
Medinipur
77 40 32 109
Purba
Medinipur
Medinipur
48 30 27 75
Purulia 27 20 15 42
Total 2077 525 450 2527
Source: Animal resource development department, Government of West Bengal

62
Chapter III
Policies and Programmes / Schemes for Dairy Development
3.1 Introduction
In West Bengal, the Animal Resources Development Department is responsible for the
formulation and implementation of Livestock and Poultry policies and programmes of the
state. The following participatory branches including a university under this department are
looking after the successful implementation of all the projects and schemes of the Department
(NDDB, 2017):
1. Directorate of Animal Resources & Animal Health (DAR&AH):
It is playing pivotal role for the control of animal diseases, scientific management and
upgradation of genetic resources of livestock and poultry birds, increase in availability
of nutritious feed and fodder, extension of activities on animal husbandry practices and
also enhancement of production and profitability of livestock enterprises.
2. Directorate of Dairy Development:
It is engaged in the processing of raw milk to produce pasteurised and homogenised
market milk and various milk products, which in turn, are sold through its own network.
3. Paschim Banga Go-Sampad Bikash Sanstha (PBGSBS):
It is registered society created to act as catalyst for qualitative, quantitative and genetic
improvement of bovine population in this State.
4. West Bengal University of Animal and Fishery Sciences (WBUAFS):
It imparts quality education, undertakes basic and need-based research and disseminates
proven technologies to the rural masses.
5. West Bengal Cooperative Milk Producers’ Federation Ltd. (WBCMPF):
The WBCMPFL was registered in the year 1983 in order to eliminate middlemen and
organise institutions to be owned and managed by the milk producers themselves.
The basic objective was to provide assured and remunerative market for the milk
produced by the farmer members.
6. West Bengal Dairy & Poultry Development Corporation Limited (DAIRPOUL):
It is a government enterprise created in 1969 to supply high quality compounded feed
for livestock under “Epic” brand name.

63
7. West Bengal Livestock Development Board:
It focuses on meat and meat product marketing.
8. Mother Dairy:
It oversees milk processing and supply to Greater Kolkata and other areas.
9. West Bengal Veterinary Council:
The council is sincerely discharging the statutory functions like regulation of veterinary
practice, Registration & Renewal of Veterinary Practitioners, monitoring the
professional conduct, etiquette and code of ethics of registered veterinarians and
organization of workshops and seminars to promote professional knowledge.
10. The Calcutta Society for the Prevention of Cruelty to Animals (CSPCA):
The CSPCA, a charitable organization formed in the year 1861 with an objective to give
relief to the helpless animals, especially the stray dogs. The society provides treatment
and health care to the animals free of cost. It is a non-profitable organization surviving
purely on Government aid and donations.
The main programmes and schemes for dairy development in West Bengal can be classified into
two categories viz.
I. Central Schemes;
II. State Schemes;
3.2 Animal Husbandry and Dairy Development
Table 3.1 Central schemes for Animal Husbandry Development
1. National
Programme for
Bovine Breeding
(NPBB)
NPBB sponsored by Government of India is implemented in West Bengal
though BGSBSP. The Sanstha has more than 3,000 Pranibandhu working at
Gram Panchayat level for delivery of breeding inputs at the farmer’s doorstep.
These workers perform Artificial Insemination (AI), vaccination of animals and
provide primary health care. Funds are also used for improvement in quality
of bulls used for natural service and artificial insemination, imposing strict
quality control of services and inputs, consolidation and initiation of
programme for development and conservation of recognized indigenous
breed so as to improve the genetic makeup as well as their availability.
The chief objective of the Program is to arrange quality AI services at Farmers’
door step and to bring all breedable females under organized breeding
through AI or Natural service using germplasm of High Genetic Merit. It also
aims to conserve, develop and proliferate selected Indigenous Bovine breed
of High Socio economic importance.
2. Rashtriya Krishi
Vikas Yojana
During the year 2016-17, the total outlay under RKVY for the state was to the
tune of Rs. 62.24 crore to ensure a comprehensive development in agriculture

64
(RKVY) and allied sectors. The ARD Department has implemented the following
projects/ schemes under RKVY during the year 2016-17.
i. Extension of Animal Health Care Services in remote areas of West Bengal
through the Mobile Veterinary Clinic (MVC);
ii. Livelihood improvement of poor and tribal people through livestock
based enterprises in selected villages of Jhargram Block ;
iii. Prani-Shakti - Tablet PC & Web-enabled Animal Resources Extension &
Information Management System;
iv. Purchase of new Freeze Drier Machine at IAH&VB, Belgachia;
v. Setting up of the Mineral Mixture Plant by WBCMPFL;
vi. Optimization of productive efficiency through organization of Animal
Health Camps (Parasitic Control & Fertility Improvement)
vii. Modernization and Strengthening of Bull Mother Farm, Haringhata;
vii. Certificate Course on Artificial Insemination (Pranisebee);
viii. Establishment of FSBS at Pedong, Darjeeling.
3. Rural
Infrastructure
Development
Fund (RIDF)
Under RIDF, the following activities were undertaken by the State during
2016-17:
i) Strengthening and modernising treatment & diagnostic facilities at Block
Level
ii) Modernization of Haringhata Dairy
iii) Upgradation of Infrastructure Facilities of Sperm Station at Beldanga,
Murshidabad
iv) Establishment of Murrah Buffalo Bull Mother Farm at Turkidanga,
Bishnupur, Bankura
4. Professional
Efficiency
Development
Through this Programme, the West Bengal Veterinary Council has trained 320
(three hundred twenty) nos. of Veterinarians and provided advance
knowledge in the field of Veterinary & Animal Sciences during 2016-17. The
Central Government provides 50 per cent assistance for setting up and
functioning of Veterinary Council.
5. National Dairy
Plan-I
Under NDP-I, the mandate is to strengthen the Frozen Semen Stations located
at Haringhata & Salboni and increase its production by two fold. Moreover,
under Bull Production Programme through imported Embryo the Project,
production of pure Jersey & Holstein bulls were aimed through advanced
Embryo Transfer technology.
6. Assistance to
States for Control
of Animal Diseases
(ASCAD)
This scheme aims to control livestock diseases through conducting mass
vaccination and diagnosis of diseases in the newly established DDLs to reduce
the morbidity & mortality of animals. It is implemented in the state from the
year 2004-05 with 75 per cent central share and 25 per cent state share
7. Establishment and
Strengthening of
Veterinary
Hospital and Dis-
pensaries(ESVHD)”
The West Bengal, DAIRPOUL is entrusted the responsibility of implementing of
Centrally Sponsored ESVHD scheme. The corporation has renovated as well as
constructed Veterinary Hospitals and Dispensaries.

65
8. National Animal
Disease Reporting
System
(NADRS)
DAR&AH is implementing NADRS in West Bengal. NADRS involves
computerized linking 333 block, District and the State headquarters in the
State with the central project monitoring unit New Delhi to record and
monitor livestock disease situation.
9. National Livestock
Mission (NLM)
Under NLM, four different components were covered during 2016- 17 with a
total outlay of ` 11 85.84 lakh
a. Risk
management and
Insurance of Milch
Animals
The scheme, being implemented by PGSBS, aims towards risk Management
and Insurance of 143,000 nos. of Milch Animals. With 16 per cent of premium
payment, the beneficiary can insure his dairy animal and Centre & State
Governments bear 40 per cent and 44 per cent of premium cost respectively.
. b. Modernization
and Development
of Breeding
Infrastructure
It proposes development of Kotulpur Fodder Farm into a Model State- of- the-
Art Farm. This is being implemented by the Directorate of AR&AH, GoWB on
funding pattern of 60 per cent Central & 40 per cent State share.
c. Fodder Seed
Production,
Procurement &
Distribution
The objective is Fodder Seed Production, Procurement & Distribution. Target
is to supply of 14,000 Minikit. This is being implemented by the Directorate of
AR&AH, GoWB (Funding pattern of 60:40 as CS:SS)
10. Integrated Sample
Survey (ISS)
As per the guidelines of GoI, the Department of ARD regularly conduct field
survey work to generate season-wise and annual estimates (district-wise &
for the state) of production of milk and other other livestock products and by-
products. For this purpose, 50 per cent central assistance is provided to the
State.
11. Livestock Census In addition to ISS, the Department of ARD conducts Quinquennial Livestock
Census every five years to capture total livestock population, male & female
bovines, milch & in-milk population.
Source: NDDB, 2017

66
Table 3.2: State Schemes
1. Cattle & Buffalo
Development
The Scheme aims to augment milk production in the State through the
following:
i. Breed up-gradation / crossbreeding of low milk producing local
Cattle & Buffalo through artificial insemination
ii. Frozen Semen Straws production of elite bulls of Gir, Sahiwal,
Jersey & Murrah (buffalo) breed
iii. Infrastructure development, which are not included under NDP &
NPBB
iv. Maintenance and updation of e-PBGSBS Management System, a
bovine Breeding management System.
2. Establishment of
Fodder
Development
Plot
This program aims to develop Fodder Demonstration Plot in 10 (ten)
cottahs of land in farmers’ field to encourage livestock farmers in
production of Green Fodder
3. Enrichment of
dry fodder
It aims to enrich the straw/ cellulosic waste by addition of urea for
enhancing the nutritional value
4. Fodder Seed
production
through JV
initiative
It aims to enhance the production of Certified Fodders Seeds in
Government Fodder Farms, Kishan Vikas Kendra & Agriculture
Universities
Source: NDDB, 2017
Table 3.3: Central Schemes for Dairy development in the State
1. National Dairy
Plan-I
In order to increase productivity of milch animals and to provide a
greater access to the organised milk-processing sector to rural milk
producers, NDP-I is being implement in West Bengal. The scheme
provides 100 per cent grant-in-aid for animal nutrition & breeding
activities, 25 per cent grant-in-aid for capital expenditure on new semen
station and 50 per cent grant on cost of capital items for village milk
procurement system.
Source: NDDB, 2017

67
Table 3.4: State Schemes for Dairy Development
1. Development of
Milk Co-
operatives
A) Developments of Milk Co-operative Societies by extending
special financial assistance to meet up milk production cost to the
dairy cooperative farmers through the Dist. Milk Unions.
B) Improvement of the quality of milk and enhancement of milk
yield, providing of Milk Scanner and Special Feed Additives to the
members of the Milk Coop Societies to maintain quality milk supply
chain and to save the milk farmers from the clutches of
unscrupulous traders and to deliver good quality processed milk to
the urban consumers.
2. Creation of
Capital Assets
(Infrastructure
Development)
Setting up of infrastructure for Value Added Products, expansion of
basic Civil Infrastructure for installing Dairy Machineries. Keeping
these factors in view, extension of Civil Infrastructure in the Dairy
Plants of the Milk Unions and installation of Dairy Equipment.
3. Women
Empowerment
in Milk
Cooperatives
Assistance towards construction of Society Building, Furniture,
AMCU(s), Milk Cans for Women Dairy Cooperative Societies and
Milk Pails, Cattle Insurance, Chaff Cutter, Cattle Shed for Individual
Women Farmers. Involvement of rural women in restructuring of
their socio-economic status and promoting of rural women
empowerment as a Govt. policy.
4. Incentive for
Cattle Feed
Subsidy to the
Milk
Cooperative
Farmers
Incentive for providing balanced Cattle Feed to the Milk
Cooperative farmers for their cattle to maintain the health and
enhancement of milk yield.
5. Fodder
Development
Programme
A) Azolla Cultivation among the Marginal Farmers having almost
no land for Fodder cultivation opted for Production Unit as an
alternative source of Green Fodder. Production of raw milk after
Azolla feeding increases and more milk price earned which can be
considered to be profitable to the farmers as Low Cost Technology
with trouble free cultivation.
B) Fodder Seed - Due to high price rise of concentrates, farmers
are now finding difficulty in maintaining cattle. Encouraging farmers
in taking Green Fodder for better nutrition of cattle and thus
enhancement of milk yield, steady conception and good growth by
providing Green Fodder as Feed would help to minimize the cost of
Milk production and execution of the same among the Dairy
Cooperative Farmers through the Dist. Milk Union
Source: NDDB, 2017

68
Chapter IV
Socio-Economic Profile of Selected Milk Unions, PDCS/Private Units
and Milk Producers West Bengal, with an area of 88,752 square kilometres and twenty-three districts, has been
classified into six major agro-climatic regions (viz. Hill, Terai, Old Alluvial, New Alluvial, Red
& Laterite and Coastal & Saline Zones) depending on the locational geo-morphology and
climatic conditions. For the purpose of the present study, as discussed earlier, we have
chosen four districts from three different agro-climatic zones.
4.1 About Selected Study Area and Milk Unions
The district of Bankura (geographical area 6882 square kilometres) is situated in the Red &
Laterite Zone in the western part of the state. Nadia having geographical area of 3927
square kilometres is situated in the eastern part of the state and have been classified under
New Alluvial Zone. The two districts of Twenty Four Parganas i.e. North and South have
geographical areas 9960 square kilometres and 4094 square kilometres respectively. South
Twenty Four Parganas is located in the southernmost part of the state and classified under
Coastal & Saline Zone while major portion of its Northern counterpart (situated in south-
eastern part) comes under New Alluvial region. A small chunk of North Twenty Four
Parganas faces coastal and saline geo-morphological scenario.
In course of the present study it was found that each of the selected districts is having a milk
union that is taking care of the functioning of the Dairy Cooperative Societies (DCS) within
the district. Very fascinatingly two of the milk unions of Bankura and North Twenty Four
Parganas were named after the major river flowing through the district. In Bankura it is
Kangsaboti (Kangsaboti Co-op Milk Producers’ Union Ltd) while in the other it is Ichamati
(Ichamati Milk Producers’ Union Ltd). The milk union in Nadia is known as The Kishan Co-op.
Milk Producers’ Union Ltd (Table 4.1). In South Twenty Four Parganas, however, the milk
union is named after the great mangrove forest (Sundarban) of the Bengal delta (Sundarban
Co-operative Milk & Livestock Producers’ Union Ltd.).

69
Table 4.1: Selected Milk Producers’ Cooperative Unions in West Bengal
Sr.
No.
Name of Milk Producers’
Cooperative Union
District Agro-Climatic
Zone
Region
1 Kangsaboti Co-op Milk Producers’
Union Ltd.
Bankura Red & Laterite West
2 The Kishan Co-op. Milk Producers’
Union Ltd.
Nadia New Alluvial East
3 Sundarban Co-operative Milk &
Livestock Producers’ Union Ltd.
South 24
Parganas
New Alluvial South-East
4 Ichamati Milk Producers’ Union Ltd. North 24
Parganas
Coastal & Saline South
Source: National Dairy Development Board, Kolkata
Table 4.2: Details of Selected Milk Producers’ Cooperative Unions in West Bengal 2015-16
Sr.
No
Item No Selected Co-operative Milk Producers’ Union
Kangsaboti
MU
Kishan MU Sundarban
MU
Ichamati
MU
1 No. of Districts covered 1 1 1 1
2 Name of Districts Covered Bankura Nadia South 24
Parganas
North 24
Parganas
3 Villages Covered 765 734 84 579
4 Milk Co-op.Soc.
(i) Registered NA NA NA NA
(ii)Proposed NA NA NA NA
(iii)Total 350 242 44 205
(iv) Functioning NA NA NA NA
5 Members of Milk Co-op. Soc. (000) 19.8 32.1 1.9 37.1
6 (i) Milk collected from Soc. (lakh Lit.) 2.0 143.3 3.1 47.9
(ii) Milk collected from Other. (lakh lit.) 0 0 0 0
Total Milk collected (lakh lit.) 2.0 143.3 3.1 47.9
7 Sale of Rajka Seed (kgs) NA* NA NA NA
8 Sale of other Seeds (kgs) NA NA NA NA
9 Roots/ Slips distributed(Nos) NA NA NA NA
10 Production of Cattle feed(M.T.) NA NA NA NA
11 Sale of Balance Feed(M.T.) 437 353.0 NA 409.4
12 No of Female Co- Society NA NA NA NA
13 No of Members of Female Co Societies NA NA NA NA
14 Installed Capacity (LLPD) NA NA NA NA
15 Milk Procure (LKPD) NA NA NA NA
(i) Collected from Soc. NA NA NA NA
(ii) Collected from Others NA NA NA 0
16 Milk Processing Cap.(LLPD) NA NA NA NA
17 Procurement price Rs/lit Fat NA NA NA NA
18 Supply of Chaff Cutter NA NA NA NA
19 Av. Veterinary visits 0 8.2 NA 20.9
Source: As reported by the Managing Directors of respective milk unions.
*NA= Not Applicable, as some of the parameters were not included in the questionnaire.

70
In all four districts barring South Twenty Four Parganas, the milk unions cover over five
hundred villages in respective districts (Table 4.2). In South Twenty Four Parganas, however,
the milk union had been suffering from disorderly functioning lately. Activities of
Sundarban MU have been rejuvenated in 2015 and were found to grow in a steady pace
during the time of survey. But the locational specificity of the district, been situated in the
delta region with numerous rivers and rivulets crisscrossing through the land terrain, poses
hindrance to easy communication from one area to another.
The number of cooperative societies under the jurisdiction of the milk unions was highest in
Bankura (350), while it was lowest in South Twenty Four Parganas (44). However, the milk
procurement/collection figures reveal that Nadia topping the list with 143.3 lakh kilograms
of liquid milk from the cooperative societies per annum. Sale of balanced feed was highest
in the district of North Twenty four Parganas (registering sale quantum of 409.4 M.T.). The
average veterinary visit had been maximum in North Twenty Four Parganas.
The Kishan milk union has been the oldest milk union among the four under consideration
(Table 4.31). It was registered on the 25
th day of May 1980 while the other three were
established in the late 90’s. Over the years from 2009-10 to 2012-13 the cumulative number
of functional cooperative societies were highest that are operating within the jurisdiction of
Kishan milk union. However, despite being a late beginner the Ichamati MU has more
farmer members than the other three MUs. Milk procurement figures over the years are
matter of great concern. In all the milk unions barring Sundarban MU, the milk procurement
per day (KPD) has decreased during 2012-13 in comparison with previous year’s figures. The
reduction appears to be very sharp in case of Ichamati MU. Sundarban MU, though starting
at a low base has developed marginally in 2012-13. But overall the scenario seems to be
very bleak.
This gets corroborated from the overall data of cooperative societies that have been
organized and the cumulative numbers of farmer members in West Bengal. In a span of four
years from 2009-10 to 2012-13 it increased at a slow pace (Table 4.4). The increase in the
number of societies had been to the tune of a meagre 4.7 per cent from 2009-10 to 2012-
1 Tables 4.3, 4.4, 4.5, 4.6 and 4.7 had to be restructured in accordance with the availability of data for West
Bengal from secondary sources. Data available from secondary sources have been presented in Tables 4.3, 4.4,
4.5 and 4.6. Table 4.7 has been dropped. But to keep parity with the subsequent table numbers we stuck to
the design given by the coordinating centre. And hence, tables in the subsequent section begin with Table 4.8.

71
13. Corresponding figure as regards to membership of farmers was 8.1 per cent.
Development of the dairy sector in the second decade of this new millennium, as revealed
from the official information, does not seem to be encouraging.
As far as milk processing plants are concerned, all the districts of the present study do not
have such plants. Of the four, Bankura, Nadia and North Twenty Four Parganas have milk
processing plants situated in the district. South Twenty Four Parganas does not have such
facility. Even in the former three districts the plants generally process liquid milk of various
standards. Only in Nadia and North Twenty Four Parganas processing of Ghee and Ice Cream
is done. The 4000 LPD plant in Bankura has been processing liquid milk only (Table 4.5).
Table 4.3: Milk Unions in the Selected Districts. 2009-10 2010-11 2011-12 2012-13
Kangsaboti Co-op. Milk Producers’ Union Ltd. [DoR 18.06.1999]
Primary Co-operatives
(Cumulative)
Organized 97 118 150 175
Registered 26 28 29 61
Functional 97 110 137 164
Farmer Members 7823 9935 10205 10725
AI Sub Centre (Cumulative) 25 25 25 25
Milk Procurement (KPD) 7800 12000 14130 10000
The Kishan Co-op. Milk Producers’ Union Ltd. [DoR 25.09.1980]
Primary Co-operatives
(Cumulative)
Organized 408 416 428 427
Registered 273 276 283 283
Functional 199 204 212 225
Farmer Members 29016 29557 30525 30525
AI Sub Centre (Cumulative) 83 84 87 52
Milk Procurement (KPD) 45350 45390 42920 39500
Sundarban Co-op. Milk & Livestock Producers’ Union Ltd. [DoR 10.02.1997]
Primary Co-operatives
(Cumulative)
Organized 121 121 120 121
Registered 91 91 92 92
Functional 17 15 20 18
Farmer Members 9200 9200 9200 9220
AI Sub Centre (Cumulative) 16 16 16 16
Milk Procurement (KPD) 1000 3200 870 1560
Ichamati Milk Producers’ Union Ltd. [DoR 31.07.1997]
Primary Co-operatives
(Cumulative)
Organized 515 517 517 535
Registered 152 152 152 152
Functional 243 249 182 141
Farmer Members 32051 32981 32981 32981
AI Sub Centre (Cumulative) 80 80 80 80
Milk Procurement (KPD) 46890 48400 30640 18010
Source: http://www.benmilk.com/pr/kangsaboti.html; kishan.html; ichamati.html; sundarban.html.
DoR- Date of Registration

72
The situation must have improved a little in 2015-16 which gets reflected in the data
provided by the milk unions of the four districts (Table 4.6). The Kangsaboti MU of Bankura
and the Sundarban MU of South Twenty Four Parganas are producing Ghee, though in a
small quantity, nonetheless have initiated production of value added products from milk.
The Ichamati MU, however, have diversified its products in a number of items like Paneer,
Lassi etc. On the contrary the Kishan MU of Nadia is found to produce none of the value
added products. Value addition and manufacturing the milk products have ample market
opportunities particularly in the urban areas and are the main source of profit for the
unions. Establishment of processing plants backed by a regular and continuous inflow of
liquid mild from the grass root producers make a dent in the prevailing impasse of the dairy
industry. We shall take up the subject in later chapter.
Table 4.4: Number of Milk Cooperative Societies in West Bengal
Year 2009 - 10 2010 - 11 2011 - 12 2012 - 13
Society Organized (Cumulative) 3,819 3,862 3,899 3,998
Farmer Members (Cumulative) 2,47,148 2,57,652 2,59,334 2,67,124
Source: http://www.benmilk.com/soc.html
Table 4.5: Milk Processing Plants in the Sample District
Plants Capacity Products Manufactured
Raipur Dairy, Raipur, Bankura. 4,000 LPD Liquid Milk
State Dairy, Krishnagar, Nadia 20,000 LPD Milk of Various Standards, Ghee
Metro Dairy Ltd., Barasat, 24 Parganas
(N) 4.0 LLPD Milk of Various Standards, Ice Creams
Source: http://www.benmilk.com/plants.html
4.2 About the Study Villages
It has already been stated in methodology that from each of the four districts, four villages
were chosen for the purpose of the survey. Of the four, two villages enjoyed the coverage of
dairy cooperative society (we call them DCS villages) while the other two had no benefit of
dairy cooperative society within the village (the NDCS villages). Hence, eight villages in total
were DCS villages and the other eight were NDCS villages.

73
Table 4.6: Details of Production and Marketing of Processed Products by Selected Milk Producers’
Cooperative Unions in West Bengal 2015-16
Sr.
No
Name of Districts Covered Selected Co-operative Milk Producers’ Union
Bankura Nadia South 24
Parganas*
North 24
Parganas
1 Production of Ghee (‘000 Kg.) 3.5 - 6.05 11.57
Total Production Cost of Ghee/Kg. (Rs.) 312.00 - 376.25 373.50
Total Margins Received from Ghee/Kg. (Rs.) 68.00 - 50.00 55.07
2 Production of Paneer (‘000 Kg.) - - - 2.74
Total Production Cost of Paneer/Kg. (Rs.) - - - 230.00
Total Margins Received from Paneer/Kg. (Rs.) - - - 27.20
3 Production of Lassi (‘000 Kg.) - - - 126.39
Total Production Cost of Lassi/Kg. (Rs.) - - - 53.10
Total Margins Received from Lassi/Kg. (Rs.) - - - 21.90
4 Production of Peda (‘000 Kg.) - - - 25.53
Total Production Cost of Peda/Kg. (Rs.) - - - 284.00
Total Margins Received from Peda/Kg. (Rs.) - - - 49.00
Source: As reported by the Managing Directors of respective milk unions.
*Data relates to 2016-17.
At this juncture, a few words regarding Mouza (defined in terms of Judicial List of land
revenue system) and village (cluster of households residing in neighbourhood) need
mentioning. As a general rule Mouza and village are co-terminous in West Bengal. But at
the same time there are few exceptions to this general rule. In course of our village survey
in South Twenty Four Parganas we came across two villages (viz. Ranigarh1 and Ranigarh 2)
that come under the jurisdiction of Ranigarh Mouza. Ranigarh 1 is a DCS village while
Ranigarh 2 is a NDCS one. Nutangram( NDCS villages in North Twenty Four Parganas) is a
part of jurisdictional area of Satbaria Mouza. And Malipota (another NDCS village in North
Twenty Four Parganas) refers to Paschim Malipota Mouza.
Population composition of the DCS villages in four districts reveals that proportion of
Scheduled Caste population is highest in Nafarganj in South Twenty Four Parganas (64.3% of
total population) followed by Ambarpur in North Twenty Four Parganas (56.6%) and
Banskopa in Bankura (41.9%)(Table 4.8). Proportion of Scheduled Tribes, however, is higher
in both the villages of Bankura (18.2% & 22.7% in Banskopa and Bankata respectively) and
Bholadanga in Nadia (18.4% of total population). All the villages barring two (Banskopa &
Ranigarh 1) have the facility of safe drinking water as per 2011 census. But in a span of five
years (from 2011 to 2016) the situation must have changed for the fact that during primary
survey we found use of tube wells in these two villages. Electricity is available for domestic
purposes in almost all the villages. Irrigation facilities in the villages seem abundant. In

74
South Twenty Four Parganas proportion of irrigated area to net sown area was around 50
per cent, which had been in the lower side among all the DCS villages. Geographical
specificity of being situated in the delta might have been a cause for poor irrigation. In other
districts proportion of irrigation to net sown area ranged between 66.9 per cent in Bankura
to 100.0 per cent in North Twenty Four Parganas.
Table 4.8: Basic details of Selected DCS Villages (2011 Census)
Area details
Basic details of Selected DCS Villages
Bankura Nadia South 24 Parganas North 24 Parganas
Banskop
a Bankata Bholadanga Goash Nafarganj
Ranigarh
1*
Ambarpu
r
Nutangram*
*
Area of village
(in hectares) 304.22 100.55 312.42 1099.35 868.05 253.9 358.52 235.88
No. of
households 467 113 844 2618 849 575 691 578
Population 2160 576 3534 9609 3744 2973 2734 2496
SC population 904 13 802 3524 2408 818 1547 399
ST population 394 131 650 256 148 83 19 9
Drinking water
facilities A NA A A A NA A A
Approach
paved roads NA A NA A A NA A A
Approach mud
roads A A A A NA A A A
Distance
(kms)-nearest
town
33 36 23 77 37 25 19 10
Electricity for
domestic use A NA A A A A A A
Electricity of
agricultural
use
A NA A A NA NA NA A
Net Sown
Area (Ha.) 206.39 95.5 306.42 919.25 811.15 164.76 287 164.38
Irrigated
area(Ha.) 202.34 64.89 237 735.4 394.63 84.97 287 147.48
Un-irrigated
area (Ha.) 4.05 30.61 69.42 183.85 416.52 79.79 0 16.9
% Irrigated
Area 98.0 67.9 77.3 80.0 48.7 51.6 100.0 89.7
Culturable
waste (Ha.) 0 0 0 27 0 0 2 52.5
Area not
available for
cultivation
(Ha.)
97.83 5.05 6 153.1 56.9 89.14 69.52 19
Source: Field Survey Data A=Available/Yes, NA=Not Available/No
*Ranigarh 1 &Ranigarh 2 both come under Ranigarh Mouza.
**Nutangram comes under Satbaria Mouza

75
Table 4.9: Basic details of Selected NDCS Villages (2011 Census)
Details
Basic details of Selected NDCS Villages
Bankura Nadia South 24 Parganas North 24 Parganas Kustara Masatkhal Dahakula Baniakandi Goran
Bose
Ranigarh
2*
Srinathpur Malipota**
Area of
village (in
hectares)
131.4 128.5 359.36 249.56 1018.6 253.9 74.46 211.65
No. of
households 142 86 574 256 2754 575 183 432
Population 729 479 2478 994 12642 2973 751 1785
SC
population 76 0 143 42 4632 818 75 739
ST
population 94 0 603 0 126 83 9 526
Tube wells
for domestic
use
A NA A A NA NA A A
Pucca Road NA NA A A NA NA A A
Gravel Roads A A A A A A A A
Distance
(kms)-
nearest town
30 36 27 85 26 25 16 69
Electricity for
domestic use A A A A A A A A
Electricity of
agricultural
use
A NA A A NA NA A NA
Net Sown
Area (Ha.) 130.4 52.16 159.72 190.4 548.5 164.76 74.46 186.6
Irrigated
area (Ha.) 116.15 22.4 159.72 139.18 40.5 84.97 59.46 11.4
Un-irrigated
area (Ha.) 14.25 29.76 0 51.22 508 79.79 15 175.2
% Irrigated
Area 89.1 42.9 100.0 73.1 7.4 51.6 79.9 6.1
Culturable
waste (Ha.) 0 0 54.36 7.94 0 0 0 2.75
Area not
available for
cultivation
(Ha.)
1 76.34 145.28 51.22 470.1 89.14 0 22.3
Source: Field Survey Data; A=Available/Yes, NA=Not Available/No
*Ranigarh 1 &Ranigarh 2 both come under Ranigarh Mouza.
**Malipota refers to Paschim Malipota in Census 2011.
As far as the NDCS villages are concerned, we came across sizeable incidence of Scheduled
Caste communities in the districts of both North and South Twenty Four Parganas. Malipota
in North and Goran Bose in South recorded incidence of Scheduled Caste population to the
tune of 41.4 per cent and 36.6 per cent respectively (Table 4.9). On the contrary people
belonging to Scheduled Tribe communities were found in significant proportion in Kushtora

76
(Bankura) and Dhakula (Nadia). All the villages were having roadway connectivity of gravel
road and were enjoying facilities of domestic electrification. The villages in general were
having irrigation facilities for cultivation of crops barring Goran Bose in South Twenty Four
Parganas and Malipota in the north. These two villages were primarily monocropped.
On the whole the villages (both DCS and NDCS) in four districts were placed more or less at
par in respect of the basic socio-economic parameters with a little difference among them.
Important was to find two monocropped villages having very poor facilities of irrigation for
agricultural purposes.
4.3 About Sample PDCS & Private Dairy Units
It was interesting to find that dairy farming as an occupation was quite common in the
villages having dairy cooperatives. Particularly in the villages of Nadia, South Twenty Four
Parganas and Bankura households pursuing dairy enterprise seemed to be common (Table
4.10). The presence and establishment of dairy cooperatives in the villages might have had a
positive impact on motivating the people in indulging into this agriculture allied activity.
Total milk produced in the villages was procured by the society. No private dairy unit (PDU)
was found in the study villages. Quantum of milk being collected had been maximum in the
villages of Bankura. It is also worth mentioning that the entire milk procured by the milk
cooperatives was sent to respective milk unions. Average fat content of procured milk
ranged from 4.0 to 4.9, which seemed to be a little low.

77
Table 4.10: Profile of Selected PDCS & Private Dairy Units in West Bengal 2015-16
District Profile of Selected PDCS & Private Dairy Units in Gujarat
Bankura Nadia South 24 Parganas* North 24 Parganas
Selected PDCS
Village Bankata Banskopa Goash Bholadanga Nafarganj Ranigarh 1 Nutangram Ambarpur
Total No. of HHs
in Village
300 150 786 389 200 200 250 210
Total No. of Dairy
Farmer
households
(approx.)
115 120 642 367 120 150 100 56
Total milk
collection (liters)
108859.6 112532.5 23166.0 520.5 10910.0 11800.0 NA 19091.0
Av. Fat (%) 4.4 4.3 4.0 4.3 4.6 4.9 NA 4.2
Total No. of milk
producers
110 100 65 36 75 50 79 56
Milk sent to Milk
Union (liters)
108859.6 112532.5 23166.0 520.5 10910.0 11800.0 NA 19091.0
Milk sold @
dairy- Quantity
(lit)
0 0 0 0 0 0 NA 0
Milk sold @
dairy- Rate/lit
(Rs.)
0 0 0 0 0 0 NA 0
Selected Private
Dairy Units- PDU
Tehsil/
Taluka
- - - - - - - -
Village - - - - - - - -
Agent - - - - - - - -
Total No. of HHs
in Village
- - - - - - - -
Total No. of Dairy
Farmers hh
(approx.)
- - - - - - - -
Total milk
collection (liters)
- - - - - - - -
Av. Fat (%) - - - - - - - -
Total No. of milk
producers
- - - - - - - -
Milk sent to Milk
Union (liters)
- - - - - - - -
Milk sold @
dairy- Quantity
(lit)
- - - - - - - -
Milk sold @
dairy- Rate/lit
(Rs.)
- - - - - - - -
Any Other - - - - - - - -
Source: Field Survey Data
*Data relate to March 2016 to January 2017

78
4.4 About the Sample Households
4.4.1 Socio-Economic Characteristics
Dairy as an economic enterprise of a family depends on various socio-economic parameters
that indicates the household’s resource position. Apart from possession of investible capital
for the enterprise it is access to the quality of human capital that may turn out to be a
significant determinant of success of the business. Dairy activity in West Bengal is carried
out mostly by participation of family labour in the villages, of which we shall be discussing
later on. But in view of such involvement of family members age and gender composition
within the family, educational background, participatory motivation of family members etc.
are important factors that have direct influence on betterment and expansion of the
enterprise.
Table 4.11: Family Profile of Selected Households
Sl. No. Particulars DCS (n=120) NDCS (n=120)
SM MM LM TM SM MM LM TM
1. Average Household Size
(Nos.)
Male 2.0 2.1 2.3 2.1 1.9 2.2 2.8 2.3
Female 1.5 1.7 1.7 1.6 1.4 1.7 1.7 1.6
Children (<15) 0.7 1.0 1.1 0.9 0.8 0.7 0.8 0.8
Total 4.0 4.3 4.5 4.3 4.0 4.3 5.0 4.4
2. Gender of Respondent / HH
(%)
Male 40.0 40.0 37.5 39.2 40.0 42.5 42.5 41.7
Female 60.0 60.0 62.5 60.8 60.0 57.5 57.5 58.3
3. Average Age of Respondent
(years)
Male 52.6 53.4 53.4 53.1 49.1 52.7 54.7 52.1
Female 43.5 44.9 41.1 43.2 43.1 43.8 39.3 42.0
Total 49.0 50.0 48.8 49.2 46.7 48.9 48.2 47.9
4. Average Age of Family (years) 37.1 37.4 37.0 37.2 37.1 37.1 35.4 36.5
5. Average Education of
Respondent / HH (Years) 5.9 6.6 7.3 6.6 4.8 5.6 4.3 4.9
6. % of Family Members Works
in Dairy 70.9 65.9 68.9 68.5 61.6 67.1 64.0 64.3
Note: SM-Small, MM-Medium, LM-Large, TM-Total
Source: Field survey data
In terms of average family size the households the villages of four districts (both DCS and
NDCS villages) reveal similar pattern. The average family size in aggregate was around 4.3-
4.4 in DCS and NDCS villages (Table 4.11). Average family size had been smallest (4.0) among
small milk producers and highest (5.0) among large milk producers in NDCS villages. Average

79
age of respondents varied between 46.7 to 50 years while average age of the family was
around 37 years. This signified presence of relatively younger members in the family. It was
also interesting to find that average age of female respondents was significantly lower than
that of male respondents in all four district irrespective of DCS or not. As dairy is an
enterprise that requires day to day nurturing of the cattle and taking care through scientific
veterinary practices, education of respondents might have a crucial impact on cattle rearing.
In the households under present enquiry the education scenario was found quite dismal.
Average years of formal education among the DCS households was 6.6 while it had been 4.9
among NDCS ones. The numbers of years signify that the respondents in general have
formal education not higher than middle school standards. In respect of development of
human capital and initiating entrepreneurship among them education in general plays an
important role. And village of this present concern suffered from such expansion.
Population composition in respect of religious groups revealed that in all villages, people
from Hindu religious belief dominate the social scenario of whom people from the
Scheduled and other backward communities are of sizeable proportion in the respective
size-classes. Scheduled Tribes were few in number (Table 4.12). However, all the size-class
categories with exception of middle farmers in DCS villages seemed to be predominantly
from Hindu upper and middle caste families along with few Muslim families.
It was remarkable to observe that in the DCS villages decision makers in the dairy activity
across all size-classes were mostly female members of the family. On the contrary, in the
NDCS villages male members dominate decision making as regard to dairy enterprise. In
face of the patriarchal social structure in villages of West Bengal the DCS must have had
some impact through its operation to tilt the power balance towards women. In each village
at least 2.5 members are involved in dairy activities.
Families in both DCS and NDCS villages were mostly farming families pursuing cultivation as
their principal occupation. Across all size-classes in DCS villages 76.7 per cent in aggregate
were cultivators while for NDCS the corresponding percentage was 74.2. There were few
wage earning households, the proportion of which ranged between 7.5-17.5 per cent
irrespective of having a milk cooperative or not. Involvement of families in Dairy and Animal
Husbandry as their principal occupation was also not encouraging. Most of the households
took up dairy enterprise as their subsidiary source of income even in the DCS villages.

80
Table 4.12: Socio-Economic Characteristics of Selected Households
Sl. No. Particulars DCS (n=120) NDCS (n=120)
SM MM LM TM SM MM LM TM
1. Gender of Decision Maker (%)
Male 45.0 45.0 47.5 45.8 80.0 80.0 82.5 80.8
Female 55.0 55.0 52.5 54.2 20.0 20.0 17.5 19.2
2. Religion (% to total)
Hindu 100.0 100.0 95.0 98.3 95.0 97.5 95.0 95.8
Muslim 0.0 0.0 5.0 1.7 5.0 2.5 5.0 4.2
Christian 0.0 0.0 0.0 0.0 0.0 0.0 0.0 0.0
Sikh 0.0 0.0 0.0 0.0 0.0 0.0 0.0 0.0
3. Social Group (% to total)
Scheduled Tribe 0.0 10.0 7.5 5.8 2.5 2.5 0.0 1.7
Scheduled Caste 25.0 27.5 25.0 25.8 17.5 20.0 12.5 16.7
Other Backward Class 17.5 15.0 12.5 15.0 17.5 15.0 10.0 14.2
General/Open 55.0 47.5 55.0 52.5 62.5 62.5 77.5 67.5
4. Occupation (%)
Principal
Cultivator 77.5 85.0 67.5 76.7 65.0 77.5 80.0 74.2
AH & Dairying 10.0 7.5 15.0 10.8 17.5 15.0 12.5 15.0
Agri. Labour 12.5 7.5 15.0 11.7 17.5 5.0 7.5 10.0
Nonfarm Labour 0.0 0.0 0.0 0.0 0.0 0.0 0.0 0.0
Own Non-Farm Establishment 0.0 0.0 0.0 0.0 0.0 0.0 0.0 0.0
Trade 0.0 0.0 0.0 0.0 0.0 0.0 0.0 0.0
Employee in Service 0.0 0.0 2.5 0.8 0.0 2.5 0.0 0.8
Other (Specify) 0.0 0.0 0.0 0.0 0.0 0.0 0.0 0.0
Subsidiary
Cultivator 10.0 7.5 12.5 10.0 17.5 15.0 12.5 15.0
AH & Dairying 90.0 92.5 85.0 89.2 82.5 85.0 87.5 85.0
Agri. Labour 0.0 0.0 2.5 0.8 0.0 0.0 0.0 0.0
Nonfarm Labour 0.0 0.0 0.0 0.0 0.0 0.0 0.0 0.0
Own Non-Farm Establishment 0.0 0.0 0.0 0.0 0.0 0.0 0.0 0.0
Trade 0.0 0.0 0.0 0.0 0.0 0.0 0.0 0.0
Employee in Service 0.0 0.0 0.0 0.0 0.0 0.0 0.0 0.0
Other (Specify) 0.0 0.0 0.0 0.0 0.0 0.0 0.0 0.0
5. Average Oper.Land Holding (ha.)
Irrigated 0.22 .27 .28 .26 .34 .38 .45 .39
Un-irrigated 0.02 .03 .02 .02 .01 .01 .02 .01
Total .24 .30 .30 .28 .35 .39 .47 .40
6. Average Experience in Dairy
(years) 14.7 14.2 14.1 14.3 13.8 15.7 16.1 15.2
7. Income Group (%)
BPL 60.0 52.5 47.5 53.3 37.5 37.5 40.0 38.3
APL 40.0 47.5 52.5 46.7 62.5 62.5 60.0 61.7
8. House Structure (%)
Pucca 22.5 25.0 40.0 29.2 22.5 37.5 37.5 32.5
Semi-pucca 22.5 22.5 20.0 21.7 22.5 25.0 25.0 24.2
Kuccha 55.0 52.5 40.0 49.2 55.0 37.5 37.5 43.3
Note: SM-Small, MM-Medium, LM-Large, TM-Total.
Source: Field survey data
Hence, agriculture is still the principal source of livelihood in the selected villages of West
Bengal dominated by the tiny land operators. In the DCS villages the size of average
operated land had been 0.28 hectares in contrast to 0.40 hectares of average operational
land in the NDCS villages. In a sense the farmers of the villages without dairy cooperatives
are marginally better off than their DCS counterparts.

81
Table 4.13: Cropping Pattern of Sample Households (2015-16) (Total Area in ha.)
Seasons/Crops/Categories DCS (n=120) NDCS (n=120)
SM MM LM TM SM MM LM TM
A. Kharif
Paddy 7.54 9.07 9.91 26.52 10.27 12.88 14.08 37.23
Moong 0.06 0.01 0.03 0.10 0.06 0.01 0.03 0.10
Cotton 0.00 0.00 0.00 0.00 0.28 0.28 1.03 1.59
Sugarcane 0.00 0.00 0.00 0.00 0.03 0.03 0.23 0.29
Jute 0.88 1.41 3.56 5.85 0.75 1.18 1.62 3.55
Vegetables 0.28 0.89 0.73 1.90 0.10 0.00 0.00 0.10
Fodder Crop 1 (Goma) 0.59 0.60 0.34 1.53 0.28 0.66 0.54 1.48
Fodder Crop 2 (Maize) 0.03 0.08 0.03 0.14 0.03 0.00 0.12 0.15
Fodder Crop 3 (Coarse
Cereals) 0.00 0.00 0.65 0.65 0.00 0.00 0.00 0.00
Total Kharif 9.38 12.06 15.25 36.69 11.80 15.04 17.65 44.49
B. Rabi
Paddy 1.20 0.72 1.59 3.51 1.53 1.22 1.13 3.88
Wheat 0.53 0.56 1.43 2.52 0.20 0.27 1.13 1.60
Barley 0.16 0.13 0.09 0.38 0.16 0.13 0.09 0.38
Gram 0.88 1.23 2.25 4.36 1.29 1.31 0.91 3.51
Mustard 0.85 1.10 2.01 3.96 1.76 1.90 2.32 5.98
Lentil 0.00 0.00 0.00 0.00 0.16 0.05 0.07 0.28
Potato 1.67 1.84 2.03 5.54 1.93 2.42 2.89 7.24
Vegetables 0.51 1.05 0.92 2.48 0.31 0.32 0.69 1.32
Fodder crops 1 (Grass) 0.18 0.20 0.28 0.66 0.24 0.30 0.79 1.33
Fodder crops 2 (Oat) 0.47 0.47 0.74 1.68 0.30 0.42 0.65 1.37
Total Rabi 6.45 7.30 11.34 25.09 7.88 8.34 10.67 26.89
C. Summer
Paddy 2.11 2.35 3.07 7.53 2.21 2.87 3.81 8.89
Sesame 0.12 0.26 0.35 0.73 0.13 0.00 0.00 0.13
Jute 0.00 0.00 0.00 0.00 0.35 0.17 0.18 0.70
Vegetables 0.50 0.40 1.13 2.03 0.21 0.63 0.15 0.99
Fodder Crops 1 (Goma) 0.00 0.32 0.76 1.08 0.07 0.17 0.10 0.34
Fodder Crops 2 (Maize) 0.44 0.32 0.03 0.79 0.21 0.46 0.52 1.19
Fodder Crops 3 (Coarse
Pulses) 0.00 0.00 0.00 0.00 0.00 0.06 0.06 0.12
Total Summer 3.17 3.65 5.34 12.16 3.18 4.36 4.82 12.36
4. Net Cropped Area 9.38 12.06 15.25 36.69 11.80 15.04 17.65 44.49
5. Gross Cropped Area 19.00 23.01 31.93 73.94 22.86 27.74 33.14 83.74
6. Cropping Intensity 202.56 190.80 209.38 201.53 193.73 184.44 187.76 188.22
Note: SM-Small, MM-Medium, LM-Large, TM-Total.
Source: Field survey data
This gets reflected in the household’s position in economic hierarchy of the villages where
household living under the official poverty line (BPL) was more in number in the DCS villages while
61.7 per cent of total household in NDCS villages lived in income group of above the poverty line
(APL).Despite these differences in land holding and income pattern we observed a mixed pattern in
respect of housing structure among the rural households. To mention only that trivial incidence of
Kuccha structure for living is common among families of small and middle size-classes. We may add
that housing pattern does not depend only on one’s economic position but also has an influence of

82
the cultural practice prevailing in the neighbourhood. In villages of West Bengal Kuccha (mud walls
with thatched roof) or Semi-pucca structure (mud walls with tile/tin roof) are very common till date.
4.4.2 Cropping Pattern
Cropping pattern in the DCS and NDCS villages suggested that in Kharif season Paddy is the
main crop being cultivated by the farming families. Small portion of land was devoted to
crops like Jute, Cotton and Fodder crops (Table 4.13) in this season. In Rabi, however,
Potato and Mustard dominated the crop combination. There had been land allotted to
vegetables like cauliflower, cabbage etc. by the households irrespective of presence of dairy
cooperative in the villages. Hence, farming families, however their economic position might
be, tried to grow some vegetables in their land mostly for the market and as well as for
home consumption too. We did find a part of land being allotted to cultivation of fodder
crops like Oats, Course Pulses, and Maize for fodder and cultivation of some varies of grass.
Summer season was once again revealed predominance of Paddy cultivation. So, the general
crop rotation practice throughout the year can be described by Rice followed by Potato and
Mustard followed by Rice once again. As the villages received irrigation for crop cultivation
the cropping intensity was high with 201.53 in the DCS villages that were marginally higher
than that in the NDCS villages (188.22).
4.5 Chapter Summary
In all districts barring South Twenty Four Parganas, the milk unions cover over five hundred
villages in respective districts. Activities of Sundarban MU have been rejuvenated in 2015
and were found to grow in a steady pace during the time of survey.
The number of cooperative societies under the jurisdiction of the milk unions was highest in
Bankura (350) while it was lowest in South Twenty Four Parganas (44). However, the milk
procurement/collection figures reveal that Nadia topping the list with 143.3 lakh kilograms
of liquid milk from the cooperative societies per annum.
As far as milk processing plants are concerned, all the districts of the present study do not
have such plants. Of the four, Bankura, Nadia and North Twenty Four Parganas have milk
processing plants situated in the district. South Twenty Four Parganas does not have such

83
facility. Even in the former three districts the plants generally process liquid milk of various
standards.
On the whole the villages (both DCS and NDCS) in four districts were placed more or less at
par in respect of the basic socio-economic parameters with a little difference among them.
Important was to find two monocropped villages having very poor facilities of irrigation for
agricultural purposes.
In terms of average family size the households the villages of four districts (both DCS and
NDCS villages) reveal similar pattern. The average family size in aggregate was around 4.3-
4.4 in DCS and NDCS villages. Average age of respondents varied between 46.7 to 50 years
while average age of the family was around 37 years.
It was also interesting to find that average age of female respondents was significantly
lower than that of male respondents in all four district irrespective of DCS or not. In the
households under present enquiry the education scenario was found quite dismal.
Population composition in respect of religious groups revealed that in all villages, people
from Hindu religious belief dominate the social scenario of whom people from the
Scheduled and other backward communities are of sizeable proportion in the respective
size-classes. Scheduled Tribes were few in number.
Families in both DCS and NDCS villages were mostly farming families pursuing cultivation as
their principal occupation. Most of the households took up dairy enterprise as their
subsidiary source of income even in the DCS villages.
In the DCS villages the size of average operated land had been 0.28 hectares in contrast to
0.40 hectares of average operational land in the NDCS villages. In a sense the farmers of the
villages without dairy cooperatives are marginally better off than their DCS counterparts.
This gets reflected in the household’s position in economic hierarchy of the villages where
household living under the official poverty line (BPL) was more in number in the DCS villages than
their NDCS counterpart.
The general crop rotation practice throughout the year can be described by Rice followed by
Potato and Mustard followed by Rice once again in Kharif, Rabi and Summer seasons
respectively. As most of the villages received irrigation for crop cultivation, the cropping
intensity was high in the DCS villages as compared to the NDCS villages.

84
Chapter V
Cost of Milk Production & Awareness about the Schemes
5.1 Introduction
In this chapter we shall take up the details of cattle that are being reared by the families of
both DCS and NDCS villages. In the preceding chapter we had discussed about the socio-
economic position of the households in the villages of the four districts and also analysed
their capabilities in association with their size-class identities.
5.2 Breedable Animals
In the study villages, which is also a common feature in the state of West Bengal too, there
still exist a combination of both local, nondescript and cross bred cows as milch animals. In
the study area the cross bred cows were mostly Jersey and Gir. In the DCS villages herd
strength on an average was observed as 8.08 which in case of milch cows had been 3.77
(Table 5.1). Corresponding figures for NDCS villages were 7.68 and 3.63 respectively (Table
5.2). The DCS households seemed to have a marginal edge as compared to their NDCS
counterparts. But when one looks into the details of breeds reared an interesting feature
gets reflected. In DCS villages herd strength of local milch animals are higher than that in the
NDCS villages across all size-classes. But when it comes to rearing of cross bred animals,
NDCS farmers owned more cross bred cow than the former ones. In previous chapter we
had discussed at length about the resource position of the farmer in both DCS and NDCS
villages. There we had observed that the NDCS farmers had a marginal advantage in terms
of their income and resource position in comparison with DCS farmers. Endowment
differential might have had an impact on ownership pattern of types of cattle in the survey
villages. Cross bred cows are costlier than the available local breeds. Hence, farmers
enjoying a relatively better financial position (farmers of NDCS villages) would prefer to
have highly productive cross bred cows to carry out their dairy enterprise. The particular
feature gets reflected in all size-classes. So far as the cattle sheds are concerned NDCS
farmers were found to own more sheds on an average for their cattle than DCS farmers. In
small farm category total shed ownership was same in both types of villages. But as we

85
went along the ownership ladder the NDCS farmers (in both categories of medium and
large) were found to own more of cattle shed than their DCS brothers.
Table 5.1: Details on Herd Strength & Cattle Shed – DCS Households
Particulars Details on Herd Strength & Cattle Shed- West Bengal -DCS (n=120)
Total Animal (No.) Milch Animal (No)
SM MM LM TM SM MM LM TM
Local Cattle 1.61 2.91 5.46 3.40 0.70 1.29 2.54 1.55
Cross Bread 2.91 5.46 8.72 5.75 1.29 2.57 4.22 2.72
Buffalo 0.00 0.00 0.00 0.00 0.00 0.00 0.00 0.00
Other 0.00 0.00 0.00 0.00 0.00 0.00 0.00 0.00
Total 3.80 7.53 12.90 8.08 1.68 3.48 6.15 3.77
Av. No. of Cattle Shed Present Average value in Rs./shed
Pucca 0.00 0.06 0.00 0.02 NA 3125.00 NA 1063.83
Semi-Pucca 0.46 0.50 0.60 0.52 19615.38 17916.67 20750.00 19432.43
Kuccha 1.06 1.07 1.03 1.05 9629.03 9550.00 11661.29 10288.04
Total 1.00 1.07 1.07 1.04 15218.75 12766.67 21766.67 16554.35
Source: Field Survey Data; NA=Not Applicable
Table 5.2: Details on Herd Strength & Cattle Shed – NDCS Households
Particulars Details on Herd Strength & Cattle Shed- West Bengal -NDCS (n=120)
Total Animal (No) Milch Animal (No)
SM MM LM TM SM MM LM TM
Local Cattle 1.23 2.76 4.44 2.81 .49 1.24 2.15 1.30
Cross Bread 3.07 5.36 10.25 6.28 1.40 2.58 4.97 3.01
Buffalo 0.00 0.00 0.00 0.00 0.00 0.00 0.00 0.00
Other 0.00 0.07 0.00 0.02 0.00 0.00 0.00 0.00
Total 3.50 7.03 12.53 7.68 1.53 3.28 6.08 3.63
Cattle Shed Present Average value in Rs./shed
Pucca 0.00 0.05 0.14 0.07 NA 380.95 9545.45 3573.77
Semi-Pucca 0.21 0.36 0.43 0.34 8913.04 14071.43 17321.43 13721.52
Kuccha 1.17 1.03 1.13 1.11 8494.29 8548.39 9709.68 8900.00
Total 1.00 1.15 1.45 1.21 11235.29 12850.00 18500.00 14350.88
Source: Field Survey Data; NA=Not Applicable
In the survey area we had found only cows that were being reared by the households.
Buffalo milk in general has low acceptability in this part of the country. As is evident from
Table 5.3 that average yield of cross bred cows were substantially higher than the local
cows. However, in the DCS the average yield of milk seemed to be higher than NDCS ones.

86
Table 5.3: Details of Animals Breeds for DCS & NDCS
No. Particulars Name of breeds
Av. Yield
(Kg/day)/ Range
DCS NDCS
1 Local Cow Local Non-descript Breeds 1.00 to 6.00 0.00 to 6.50
2 Crossbred Cow Jersey, Gir Cross Breed 1.20 to 14.00 0.70 to 10.00
3 Buffalo NA NA NA
4 Others NA NA NA
Source: Field Survey Data; NA= Not Applicable
Average age of the breedable local cows in the DCS villages was 6 years in aggregate of all
size-classes while for cross bred cow average age had been 5 years. For the NDCS
households, however, average age was found same (6 years for both local cow &cross bred
cow) (Table 5.4 & Table 5.5). Average age at first calving for local cows was higher than the
cross bred cows in both the areas. Lactation order was found more or less same for all
types of farmers with marginal variation among the village clusters and size-classes. Yield
figures revealed that in villages with cooperatives average yield of present lactation had
been marginally higher to that of last lactation in case of local cow as well as for the cross
bred cow. Among NDCS, however, the yield figures did not show much of a change over two
lactations.
Table 5.4: Details of Breedable Animals with DCS Households on Survey Date
No Particulars Animal (DCS)
Local Cow Crossbred Cow
SM MM LM TM SM MM LM TM
1 Av. Age (year) 6 6 6 6 6 5 6 5
2 Av. Age at I st
(Calving Month) 38 38 41 39 31 30 30 30
3 Lactation Order@ 3 3 3 3 3 3 3 3
4 Lactation Period (Days) 228 219 209 218 226 225 230 227
5 Peak Yield-
Last Lactation 2.50 2.42 2.46 2.46 5.45 4.83 5.34 5.19
Present Lactation 2.83 2.99 2.47 2.74 6.27 5.80 5.56 5.86
6 Total Animals Covered under
Insurance (n=120) 0.00 0.00 0.00 0.00 0.00 0.00 0.00 0.00
Premium paid (Rs./animal) NA NA NA NA NA NA NA NA
Government NA NA NA NA NA NA NA NA
Self NA NA NA NA NA NA NA NA
Source: Field survey data. NA=Not Applicable

87
Table 5.5: Details of Breedable Animals with NDCS Households on Survey Date
No Particulars Animal (NDCS)
Local Cow Crossbred Cow
SM MM LM TM SM MM LM TM
1 Av. Age (year) 7 6 6 6 6 5 6 6
2 Av. Age at I st
(Calving Month) 40 38 41 40 29 32 32 31
3 Lactation Order@ 4 2 3 3 3 3 3 3
4 Lactation Period (Days) 246 208 229 228 197 211 215 208
5 Peak Yield-
Last Lactation 2.73 3.09 3.13 2.98 5.05 5.61 5.52 5.41
Present Lactation 2.88 3.16 2.60 2.86 5.12 5.69 5.50 5.45
6 Total Animals Covered under
Insurance (n=120) 0.00 0.00 0.00 0.00 0.00 0.00 0.00 0.00
Premium paid (Rs./animal) NA NA NA NA NA NA NA NA
Government NA NA NA NA NA NA NA NA
Self NA NA NA NA NA NA NA NA
Source: Field survey data; NA=Not Applicable
In course of our field visits we observed a dismal scenario as regards to insurance coverage
for the cattle. In none of the villages, be it with dairy cooperative or not, we could locate a
household under the coverage of cattle insurance. Our discussion with administrative
personnel of the dairy cooperatives in this regard pointed towards lack of motivation among
the dairy farmers to avail the benefits of cattle insurance. Under institutional assistance for
purchase of cattle insurance stands mandatory. But the farmers of the present concern
were mostly the small ones with little credibility of institutional finance for purchasing
cattle.
Table 5.6: Season-wise Milk Yield (Per day) of Selected HH 2015-16
No
Season
Season wise Milk Yield (Per day) of Selected HH 2015-16 (Av. Yield (Lit/animal)
Local Cow Crossbred Cow
SM MM LM TM SM MM LM TM
A DCS HH n=120
1 Rainy 3.0 3.2 2.9 3.0 6.1 5.8 5.4 5.7
2 Winter 1.8 2.0 2.0 1.9 3.9 3.8 3.6 3.8
3 Summer 2.5 2.6 2.5 2.5 5.1 4.8 4.5 4.8
B NDCS HH n=120
1 Rainy 3.0 3.4 3.1 3.1 5.6 5.9 4.9 5.5
2 Winter 1.7 1.9 2.0 1.9 3.5 3.7 3.4 3.5
3 Summer 2.6 2.7 2.7 2.6 4.6 4.8 4.2 4.5
Source: Field survey data.

88
As regards to mild yield per day across seasons we found that milk output of cross bred
cows had always been higher than the local cow irrespective of seasons, locational
specificity (i.e. DCS/NDCS) and size-class categories (Table 5.6). This observation was
obvious. Had it been otherwise all the dairy farmers would have opted for local cattle.
5.3 Labour Use Pattern
In the area of the present study the dairy activity is being run by family labour of the
farming families. This is somewhat a general phenomenon in West Bengal too. In view of
the small scale of operation the households do not employ hired labour for dairy activities.
Hence, in DCS as well as in NDCS villages we did not find employment of any hired labour for
dairy operations (Table 5.7 & Table 5.8). It is noteworthy to mention that in DCS villages
across all size-class participation of women family members had been higher both in terms
of number per day as well as hours of involvement in such activities.
Table 5.7: Labour Use Pattern -DCS Households
DCS Involvement of Rural Men and Women in Dairy activities
Sr.
No. No. of Workers / Day Total Hours Worked / Person / Day
Male Female Male Female
SM MM LM TM SM MM LM TM SM MM LM TM SM MM LM TM
A Family
Labours
1 Fodder
Management
1.2 1.3 1.5 1.3 1.6 1.7 1.9 1.7 1.6 2.9 3.6 2.7 2.7 3.1 4.1 3.3
2 Shed
Management
1.3 2.0 1.7 1.6 2.1 2.2 2.3 2.2 1.5 2.2 2.2 1.9 1.7 2.3 3.0 2.3
3 Milking 0.4 0.6 0.6 0.5 1.5 1.3 1.6 1.5 0.2 0.4 0.5 0.4 1.1 1.1 1.4 1.2
4 Animal Health 0.7 0.9 1.0 0.8 1.0 1.0 1.0 1.0 0.7 0.7 1.2 0.9 0.8 0.9 1.1 0.9
B Hired Labours
1 Fodder
Management -- - - - - - - - - - -- - - - - -- - - - - - - - - - -- - - - -
2 Shed
Management -- - - - - - - - - - -- - - - - -- - - - - - - - - - -- - - - -
3 Milking -- - - - - - - - - - -- - - - - -- - - - - - - - - - -- - - - -
4 Animal Health -- - - - - - - - - - -- - - - - -- - - - - - - - - - -- - - - -
C Labour Rate
(Rs./Day)
Male/Female
195.0 195.0 195.0 195.0 182.5 182.5 182.5 182.5 -- - - - - - - - - - -- - - - -
Source: Field Survey Data.
The scenario remained more or less same in the context of NDCS villages too. Here animal
health is taken care of by male members of the households. But in general from animal
feeding to shed cleaning and management and even milking the animals, female members

89
of the family play most important role in process of cattle nurturing. Any enterprise of
animal husbandry particularly cattle rearing necessitates day to day love and care. In West
Bengal the rearers are generally small farming families who depend on participation of
family labour. Moreover, as we have discussed in the previous chapter that households of
both DCS and NDCS villages in general were pursuing dairy activities as an additional source
of income, they would rather involve family members rather than employing hired labour.
In such a situation participation of women members becomes one of utmost importance.
Average market wage rate for male and female labour were observed as Rs. 195.00 and Rs.
182.50 respectively.
Table 5.8: Labour Use Pattern -NDCS Households
NDCS Involvement of Rural Men and Women in Dairy activities-NDCS
Sr.
No. No. of Workers / Day Total Hours Worked / Person / Day
Male Female Male Female
SM MM LM TM SM MM LM TM SM MM LM TM SM MM LM TM
A Family
Labours
1 Fodder
Management 1.0 1.4 1.4 1.3 1.8 1.7 2.1 1.9 2.0 3.3 3.6 3.0 2.6 2.6 3.2 2.8
2 Shed
Management 1.4 1.7 1.8 1.6 2.3 2.2 2.3 2.2 1.3 1.9 2.5 1.9 1.7 2.1 2.7 2.2
3 Milking 0.3 0.3 0.5 0.3 1.5 1.5 1.5 1.5 0.3 0.3 0.4 0.3 1.2 1.2 1.4 1.3
4 Animal Health 1.0 1.0 1.0 1.0 0.7 0.9 1.0 0.9 1.0 1.0 1.5 1.2 0.5 0.8 1.2 0.8
B Hired Labours 1 Fodder
Management -- - - - - - - - - - -- - - - - -- - - - - - - - - - -- - - - -
2 Shed
Management -- - - - - - - - - - -- - - - - -- - - - - - - - - - -- - - - -
3 Milking -- - - - - - - - - - -- - - - - -- - - - - - - - - - -- - - - -
4 Animal Health -- - - - - - - - - - -- - - - - -- - - - - - - - - - -- - - - -
C Labour Rate
(Rs./Day)
Male/Female
195.0 195.0 195.0 195.0 182.5 182.5 182.5 182.5 -- - - - - - - - - - -- - - - -
Source: Field Survey Data.
5.4 Details on Feed/Fodder and Water
Feed and fodder are very important determinants of the quality and quantity of output from
the cattle. For development of the enterprise optimized use of required feed and fodder are
essential. In face of resource crunch of the respondents economization is also very
important. We had classified fodder into four main categories viz. dry fodder, green fodder,

90
concentrates and supplements. Dry fodder used by the farmers were mainly paddy and
wheat straw and roughages, green fodder comprised of mainly cut grass either from
common land or cultivated grass, maize, coarse pulses etc., concentrates were prepared
cattle feed either supplied by the DCS or purchased from the market while supplements in
most cases were molasses, mustard oil and oil cakes, salt etc.
Table 5.9: Details of Feed and Fodder (at the Time of Survey)
No
Stall-Feeding
Details of Feed and Fodder (at the Time of Survey) (Kg. /day /Animal)
Animal type (Quantity Fed ( Kg))
Local Cows Cross Breed
SM MM LM TM SM MM LM TM
A DCS
1 Dry Fodder 7.5 7.1 8.1 7.6 7.3 7.9 7.8 7.7
2 Green Fodder 9.5 10.6 10.6 10.3 13.0 12.7 11.1 12.2
3 Concentrates 1.2 1.2 1.2 1.2 0.9 1.1 1.3 1.1
4 Supplements (Gram) 390 432 481 439 380 437 446 423
5 Out feeding Grazing
(No of Hrs./day) 4.0 3.8 3.6 3.8 2.7 2.4 2.5 2.5
B NDCS
1 Dry Fodder 8.2 8.6 8.4 8.4 7.2 8.3 8.2 7.9
2 Green Fodder 10.3 12.5 12.9 11.9 11.3 10.9 11.5 11.2
3 Concentrates 1.1 1.1 1.1 1.1 1.0 0.9 1.0 1.0
4 Supplements (Gram) 500 447 477 476 500 420 438 451
5 Out feeding Grazing
(No of hrs./day) 3.6 3.1 3.5 3.4 2.4 2.5 2.5 2.5
Source: Field Survey Data.
It was interesting to find that for local animals NDCS household across all size-classes were
feeding their cattle with more of dry and green fodder and supplements as compared to the
DCS farmers (Table 5.9). In case for concentrates DCS and NDCS farmers were applying
prepared cattle feed in more or less equal quantity. In case of cross bred cow, however,
feeding was higher among the DCS households than their NDCS counterparts. It might be a
case where the DCS households are taking more care of their cross bred animals for a better
return. Out feeding and grazing had been higher among local cattle than the cross bred
ones. Average grazing hours for local cattle was 3.4-3.8 hours while it was 2.5 for cross bred
cattle.

91
Table 5.10: Availability of Water for Dairy activities- DCS households
No.
Particulars
Availability of Water for Dairy –DCS (% of response)
Rainy Winter Summer
SM MM LM TM SM MM LM TM SM MM LM TM
A
Sources of Water
Available for
Dairy Purpose
1 Open Well 5.0 5.0 0.0 3.3 0.0 0.0 0.0 0.0 0.0 0.0 2.5 0.8
2 Tubewell 70.0 75.0 80.0 75.0 75.0 80.0 80.0 78.3 75.0 80.0 77.5 77.5
3 River 0.0 0.0 0.0 0.0 0.0 0.0 0.0 0.0 0.0 0.0 0.0 0.0
4 Canal 0.0 0.0 0.0 0.0 0.0 0.0 0.0 0.0 0.0 0.0 0.0 0.0
5 Village Talawadi 0.0 0.0 0.0 0.0 0.0 0.0 0.0 0.0 0.0 0.0 0.0 0.0
6 Farm Pond 25.0 20.0 20.0 21.7 25.0 20.0 20.0 21.7 25.0 20.0 20.0 21.7
7 Tanker 0.0 0.0 0.0 0.0 0.0 0.0 0.0 0.0 0.0 0.0 0.0 0.0
Av. Distance
(Meters) 41.4 44.8 29.3 38.7 36.6 44.1 29.0 36.7 37.3 44.1 29.0 36.9
B
Supply of Water
is adequate
1 Yes 100 100 100 100 95.0 95.0 97.5 95.8 95.0 95.0 97.5 95.8
2 No 0.0 0.0 0.0 0.0 5.0 5.0 2.5 4.2 5.0 5.0 2.5 4.2
C
Water Quality
(Village
talawadi/Tanker)
1 Normal 90.0 95.0 97.5 94.2 95.0 97.5 87.5 93.3 95.0 97.5 97.5 96.7
2 Poor 5.0 2.5 2.5 3.3 0.0 0.0 12.5 4.2 0.0 0.0 2.5 0.8
3 Very Poor 5.0 2.5 0.0 2.5 5.0 2.5 0.0 2.5 5.0 2.5 0.0 2.5
D
Alternative
source of Water
supply in
shortage
None 50.0 45.0 50.0 48.3 52.5 45.0 50.0 49.2 50.0 45.0 50.0 48.3
1 Open Well 0.0 0.0 0.0 0.8 0.0 0.0 0.0 0.8 0.0 0.0 0.0 0.8
2 TubeWell 50.0 50.0 50.0 51.7 47.5 50.0 50.0 50.8 50.0 50.0 50.0 51.7
3 River 0.0 5.0 0.0 4.2 0.0 5.0 0.0 4.2 0.0 5.0 0.0 4.2
4 Canal 0.0 0.0 0.0 3.3 0.0 0.0 0.0 3.3 0.0 0.0 0.0 3.3
5 Village Talawadi 0.0 0.0 0.0 4.2 0.0 0.0 0.0 4.2 0.0 0.0 0.0 4.2
6 Farm Pond 0.0 0.0 0.0 5.0 0.0 0.0 0.0 5.0 0.0 0.0 0.0 5.0
7 Tanker 0.0 0.0 0.0 5.8 0.0 0.0 0.0 5.8 0.0 0.0 0.0 5.8
Av. Distance
(Meters) 93.0
146.
4 85.8
109.
6 91.6
146.
4 85.8
109.
4 93.0
146.
4 85.8
109.
6
E
Payment Made
for Water, If any
(Rs)
0.0 0.0 0.0 0.0 0.0 0.0 0.0 0.0 0.0 0.0 0.0 0.0
Source: Field Survey Data.

92
Table 5.11: Availability of Water for Dairy activities- NDCS households
No.
Particulars
Availability of Water for Dairy –NDCS (% of response)
Rainy Winter Summer
SM MM LM TM SM MM LM TM SM MM LM TM
A
Source of Water
Available for Dairy
Purpose
1 Open Well 2.5 0.0 2.5 1.7 2.5 0.0 2.5 1.7 2.5 0.0 2.5 1.7
2 Tubewell 72.5 80.0 75.0 75.8 72.5 80.0 75.0 75.8 72.5 80.0 75.0 75.8
3 River 0.0 0.0 0.0 0.0 0.0 0.0 0.0 0.0 0.0 0.0 0.0 0.0
4 Canal 0.0 0.0 0.0 0.0 0.0 0.0 0.0 0.0 0.0 0.0 0.0 0.0
5 Village Talawadi 0.0 0.0 0.0 0.0 0.0 0.0 0.0 0.0 0.0 0.0 0.0 0.0
6 Farm Pond 25.0 20.0 22.5 22.5 25.0 20.0 22.5 22.5 25.0 20.0 22.5 22.5
7 Tanker 0.0 0.0 0.0 0.0 0.0 0.0 0.0 0.0 0.0 0.0 0.0 0.0
Av. Distance (Meters) 31.3 31.5 27.1 29.9 32.3 31.5 27.1 30.3 32.3 31.5 27.1 30.3
B
Supply of Water is
adequate
1 Yes 100 100 100 100 100 100 100 100 100 100 100 100
2 No 0.0 0.0 0.0 0.0 0.0 0.0 0.0 0.0 0.0 0.0 0.0 0.0
C
Water Quality
(Village
talawadi/Tanker)
1 Normal 100.0 100.0 100.0 100.0 100.0 100.0 90.0 96.7 100.0 100.0 100.0 100.0
2 Poor 0.0 0.0 0.0 0.0 0.0 0.0 10.0 3.3 0.0 0.0 0.0 0.0
3 Very Poor 0.0 0.0 0.0 0.0 0.0 0.0 0.0 0.0 0.0 0.0 0.0 0.0
D
Alternative source of
Water supply in
shortage
None 25.0 25.0 25.0 25.0 25.0 25.0 25.0 25.0 27.5 25.0 25.0 25.8
1 Open Well 0.0 0.0 0.0 0.0 5.0 0.0 0.0 1.7 5.0 0.0 0.0 1.7
2 TubeWell 60.0 62.5 62.5 61.7 55.0 62.5 62.5 60.0 52.5 62.5 62.5 59.2
3 River 2.5 0.0 0.0 0.8 2.5 0.0 0.0 0.8 2.5 0.0 0.0 0.8
4 Canal 0.0 0.0 0.0 0.0 0.0 0.0 0.0 0.0 0.0 0.0 0.0 0.0
5 Village Talawadi 5.0 12.5 12.5 10.0 5.0 12.5 12.5 10.0 5.0 12.5 12.5 10.0
6 Farm Pond 7.5 0.0 0.0 2.5 7.5 0.0 0.0 2.5 7.5 0.0 0.0 2.5
7 Tanker 0.0 0.0 0.0 0.0 0.0 0.0 0.0 0.0 0.0 0.0 0.0 0.0
Av. Distance (Meters) 72.8 73.4 75.7 74.0 72.8 73.4 75.7 74.0 72.8 73.4 75.7 74.0
E
Payment Made for
Water, If any (Rs) 0.0 0.0 0.0 0.0 0.0 0.0 0.0 0.0 0.0 0.0 0.0 0.0
Source: Field Survey Data.
Apart from feed and fodder, importance of water is no less in dairy activities. Adequate and
assured supply of good quality of water remains a vital component for improved cattle
health. In the villages of the present study (both DCS & NDCS) normal water of adequate
quantity was reported by the respondents. The main source of water for dairy had been
tube wells supplemented by farm ponds and open wells (Table 5.10 & Table 5.11). Over 70

93
per cent of farmers were observed using tube wells as the primary source of water in DCS
and NDCS villages. About 20-25 per cent reported using ponds as the source of water and
rest using dug wells. In all seasons viz. rainy, winter and summer tube wells turned out to be
the main source from which water was collected. Average distance of water source in DCS
villages had been 29-45 metres while it was 27-32 metres in NDCS villages. So, in general the
dairy farmers in general did not suffer from scarcity of water throughout the year. Main
alternative source had also been tube wells installed at furthest distance less than 150
metres. No payment for water was observed in the study area.
5.5 Details on Veterinary and Breeding Services and Expenditures
Veterinary expenditure figures revealed that most of the animals in DCS and NDCS villages
across size-classes received vaccines like HS, BQ and FMD (Table 5.12 & Table 5.13).
Vaccination among the small size-class had been a little lower as compared with the other
two size-classes. Use of vaccines for cross bred cows was marginally higher than the local
cows. Average expenditure on medicines and doctors was to the tune of Rs. 497.00 for local
cow and Rs. 544.00 for cross bred cows in DCS villages in aggregate. Contrarily, NDCS
villages revealed low expenditure on medicines and doctors for cross bred cow in
comparison with the local ones.
Table 5.12: Details of Veterinary and Breeding Expenditure during last one year DCS
Households No. Particulars
DCS - Veterinary and Breeding Expenditure during Last year (2015-16)
LC CB
SM MM LM TM SM MM LM TM
A Vaccination
HS 10 23 54 87 12 30 50 92
BQ 21 43 92 156 35 80 132 247
FMD 22 42 81 145 25 65 76 166
B Medicines + Doctor(
Rs ) 471 517 499 497 497 554 577 544
C Av. No. of Visit By
Vet./Year 2.7 2.7 2.6 2.7 2.9 3.1 3.1 3.0
D Service
Artificial
Insemination 19 22 27 68 31 35 35 101
Natural service 1 0 0 1 0 0 0 0
Amount 160 159 158 159 140 147 143 143
E No. of AI Per
conception 2.0 1.9 1.9 2.0 2.0 1.8 2.0 2.0
F Per visit rate paid to
vet. Doctor (Rs/visit 118 124 121 121 122 120 116 119
Source: Field Survey Data
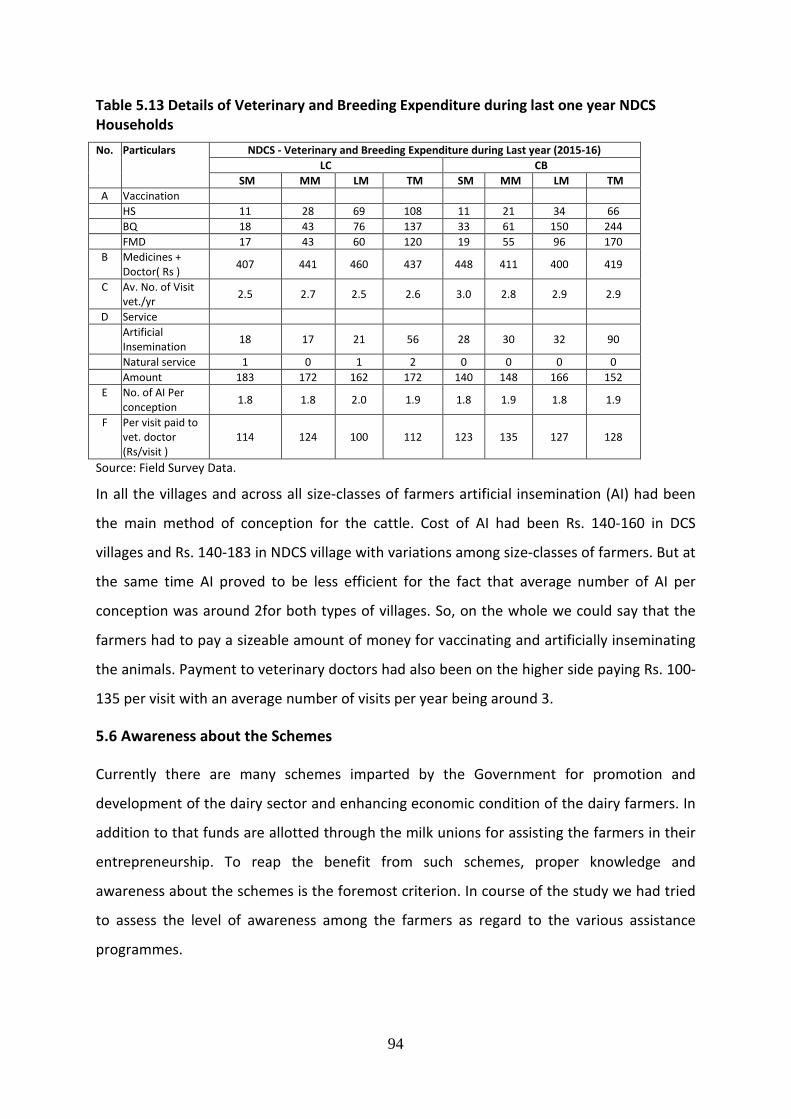
94
Table 5.13 Details of Veterinary and Breeding Expenditure during last one year NDCS
Households
No. Particulars
NDCS - Veterinary and Breeding Expenditure during Last year (2015-16)
LC CB
SM MM LM TM SM MM LM TM
A Vaccination
HS 11 28 69 108 11 21 34 66
BQ 18 43 76 137 33 61 150 244
FMD 17 43 60 120 19 55 96 170
B Medicines +
Doctor( Rs ) 407 441 460 437 448 411 400 419
C Av. No. of Visit
vet./yr 2.5 2.7 2.5 2.6 3.0 2.8 2.9 2.9
D Service
Artificial
Insemination 18 17 21 56 28 30 32 90
Natural service 1 0 1 2 0 0 0 0
Amount 183 172 162 172 140 148 166 152
E No. of AI Per
conception 1.8 1.8 2.0 1.9 1.8 1.9 1.8 1.9
F Per visit paid to
vet. doctor
(Rs/visit )
114 124 100 112 123 135 127 128
Source: Field Survey Data.
In all the villages and across all size-classes of farmers artificial insemination (AI) had been
the main method of conception for the cattle. Cost of AI had been Rs. 140-160 in DCS
villages and Rs. 140-183 in NDCS village with variations among size-classes of farmers. But at
the same time AI proved to be less efficient for the fact that average number of AI per
conception was around 2for both types of villages. So, on the whole we could say that the
farmers had to pay a sizeable amount of money for vaccinating and artificially inseminating
the animals. Payment to veterinary doctors had also been on the higher side paying Rs. 100-
135 per visit with an average number of visits per year being around 3.
5.6 Awareness about the Schemes
Currently there are many schemes imparted by the Government for promotion and
development of the dairy sector and enhancing economic condition of the dairy farmers. In
addition to that funds are allotted through the milk unions for assisting the farmers in their
entrepreneurship. To reap the benefit from such schemes, proper knowledge and
awareness about the schemes is the foremost criterion. In course of the study we had tried
to assess the level of awareness among the farmers as regard to the various assistance
programmes.

95
Table 5.14: Details on Awareness about various schemes
Sr.
No.
Particulars
DCS % of response NDCS % of response
SM MM LM TM SM MM LM TM
1 Awareness about different
Vaccinations
schemes/programmes (%) Yes 100.00 100.00 100.00 100.00 100.00 100.00 100.00 100.00
No 0.00 0.00 0.00 0.00 0.00 0.00 0.00 0.00
2 Awareness about Artificial
Insemination (AI) programmes
(%)-Yes 100.00 100.00 100.00 100.00 100.00 100.00 100.00 100.00
No 0.00 0.00 0.00 0.00 0.00 0.00 0.00 0.00
3 Awareness about any dairy
development
scheme/programmes (%)- Yes 75.00 77.50 95.00 82.50 7.50 37.50 40.00 28.33
No 25.00 22.50 5.00 17.50 92.50 62.50 60.00 71.67
4 Sources of information about
schemes (%)
a) Govt. Animal Husbandry
Department 0.00 0.00 0.00 0.00 0.00 0.00 0.00 0.00
b) Dairy Cooperative/ Milk
Union 72.50 77.50 95.00 81.67 0.00 0.00 0.00 0.00
c) Media (Press/TV) 0.00 0.00 0.00 0.00 0.00 0.00 0.00 0.00
d) Fellow farmer/dairy
owner/neighbor 0.00 0.00 0.00 0.00 7.50 37.50 40.00 28.33
5. Have you benefited with any
dairy scheme (%) Yes 52.50 60.00 65.00 59.17 - - - -
No 47.50 40.00 35.00 40.83 - - - -
a) If benefited, please provide
following
i) Av. No. of visits to concern
office - - - - - - - -
ii) Wage days lost, if any (Days) - - - - - - - -
iii) Total Expenditure to avail
scheme (doc/travel/etc.) - - - - - - - -
iv) Bribe paid to any one - - - - - - - -
v) Quality of material received
- - - -
Good 92.31 100.0 100.0 100.0 - - - -
Bad 8.33 0.00 0.00 0.00 - - - -
vi)Satisfied with benefit
received (%) -Yes 95.00 82.50 92.50 90.00 - - - -
No 5.00 17.50 7.50 10.00 - - - -
If no, give reason - - - - - - - -
Chicks Died 2.50 0.00 0.00 0.83
Poor Quality 0.00 7.50 7.50 5.00
Small Quantity 2.50 10.00 0.00 4.17
Source: Field Survey Data.
Responses about vaccination and artificial insemination were similar in both types of villages
and across all size-classes of farmers. We have already observed in the preceding section
that the households were quite conscious about vaccinating their cattle. And artificial
insemination had been a common practice across all villages. Hence, knowledge and

96
awareness regarding these had been to the fullest extent. In all villages irrespective of
DCS/NDCS and milch animal size-class the farmers had a complete knowledge about such
schemes (Table 5.14). But when the question boiled down to awareness about other
schemes there was sharp contrast between the farmers of DCS and NDCS villages. Over 70
per cent of the dairy farmers in cooperative village responded in affirmative as regard to
their knowledge about other dairy development scheme though level of awareness
increased with increase in the size-class category. In aggregate 82.5 per cent of the total
farmers in DCS category were found aware about other schemes. On the contrary, situation
in the NDCS villages was rather gloomy with a meager 28.3 per cent awareness among
farmers of all size-classes. In these villages too, knowledge among small farmers was poor as
compared to their middle and large counterparts. For the DCS farmers’ knowledge had been
imparted by the milk cooperatives functioning in the area. In addition, personnel from milk
unions have played crucial role in informing the farmers about the schemes. For the NDCS
farmers, however, source of their awareness had been fellow farmers and neighbours.
Most of the benefitted farmers seemed to be satisfied with the assistance they received
through the several schemes and reported quality of the material had been up to their
expectation.
5.7 Cost of Milk Production
To assess profitability of the dairy enterprise information on cost and returns per animal per
day were collected. Total cost comprised of cost on feed and fodder, labour cost and
veterinary cost. As in all the villages the dairy farms are run solely by family labour, we had
imputed the value of family labour with ruling wages rates for male and female. It is
observed that labour cost has been the main component of total cost in all cases. Among
DCS households, imputed value of family labour was to the tune of 58.4 per cent of total
cost for local cows and 56.9 per cent in case of cross bred cows (Table 5.15). The proportion
of labour component, however, was found decreasing with increase in the size-class.

97
Table 5.15: Cost of Cow Milk Production and Net Returns- DCS households
Sr.
No. Particulars
DCS- Cost of Milk Production –Cow
LC CB
SM MM LM TM SM MM LM TM
1 Total Dry Fodder
(Rs./Animal/Day)
16.0 15.3 17.1 16.2 15.6 16.7 16.6 16.4
(7.2) (9.7) (12.6) (9.7) (8.0) (10.3) (12.1) (10.0)
2 Total Green Fodder
(Rs./Animal/Day)
12.0 13.6 13.1 12.9 16.3 16.0 13.9 15.4
(5.4) (8.6) (9.6) (7.7) (8.4) (9.9) (10.1) (9.4)
3 Total Concentrates
(Rs./Animal/Day)
19.1 19.9 18.8 19.2 15.0 17.9 20.6 18.0
(8.6) (12.6) (13.8) (11.5) (7.7) (11.0) (14.9) (11.0)
4 Total Supplements
(Rs./Animal/Day)
16.0 17.7 19.7 18.0 15.6 17.9 18.3 17.3
(7.2) (11.2) (14.5) (10.8) (8.0) (11.0) (13.3) (10.6)
5 Total feed & fodder
(Rs./Animal/Day)
63.0 66.5 68.7 66.4 62.5 68.5 69.5 67.1
(28.5) (42.2) (50.6) (39.7) (32.2) (42.3) (50.4) (41.1)
6 Total Labour
(Rs./Day)
Male (Rs./Day)
50.3 40.0 28.6 38.5 55.8 45.1 30.1 43.1
(22.8) (25.4) (21.0) (23.0) (28.8) (27.8) (21.8) (26.4)
Female (Rs./Day)
104.5 47.7 35.3 59.3 72.6 45.2 34.9 49.8
(47.3) (30.3) (25.9) (35.4) (37.4) (27.9) (25.4) (30.5)
Total
154.8 87.7 63.8 97.8 128.5 90.3 65.0 92.9
(70.1) (55.7) (47.0) (58.4) (66.2) (55.7) (47.2) (56.9)
7 Veterinary Cost
(Rs./Animal/Day)
3.0 3.3 3.0 3.1 3.2 3.3 3.4 3.3
(1.4) (2.1) (2.2) (1.8) (1.6) (2.0) (2.5) (2.0)
8 Total Cost
(Rs./Animal/Day)
220.8 157.5 135.9 167.4 194.1 162.1 137.9 163.2
(100.0) (100.0) (100.0) (100.0) (100.0) (100.0) (100.0) (100.0)
9 Milk Production
(Litre/Animal) 2.6 2.8 2.5 2.6 5.9 5.6 5.6 5.7
10 Price (Rs. /litre) 24.9 24.8 24.5 24.7 24.1 24.2 24.1 24.1
11
Returns from
Milk Production
(Production*Avg
Price)
63.3 69.6 60.8 64.3 139.8 134.0 132.8 135.3
12 Income from Dung
(Rs./Animal/Day) 35.8 35.9 36.6 36.2 43.3 44.8 44.4 44.2
13 Total Income
(Rs./Animal/Day) 99.1 105.5 97.4 100.5 183.2 178.8 177.2 179.5
14 Net Return/Profit
(RS./Animal/Day) -121.8 -52.0 -38.5 -66.9 -10.9 16.7 39.3 16.3
15
Net Return/Profit
without imputed
value of fam.lab.
(Rs./Animal/Day)
33.1 35.8 25.3 30.9 117.5 107.0 104.3 109.2
Source: Field Survey Data.

98
Table 5.16: Cost of Cow Milk Production and Net Returns- NDCS households
Sr.
No. Particulars
NDCS- Cost of Milk Production -Cow
LC CB
SM MM LM TM SM MM LM TM
1 Total Dry Fodder
(Rs./Animal/Day)
18.6 18.4 17.9 18.2 15.0 17.7 17.5 16.8
(7.6) (10.9) (13.2) (10.3) (6.7) (11.2) (12.7) (9.9)
2 Total Green Fodder
(Rs./Animal/Day)
13.1 15.7 16.3 15.2 13.9 13.7 14.4 14.0
(5.3) (9.3) (12.1) (8.6) (6.2) (8.7) (10.5) (8.3)
3 Total Concentrates
(Rs./Animal/Day)
15.1 18.1 17.7 17.1 15.6 15.0 16.6 15.7
(6.2) (10.7) (13.1) (9.7) (7.0) (9.5) (12.1) (9.3)
4 Total Supplements
(Rs./Animal/Day)
20.5 18.2 19.5 19.4 20.5 17.2 17.9 18.4
(8.3) (10.8) (14.5) (11.0) (9.2) (10.9) (13.1) (10.9)
5 Total feed & fodder
(Rs./Animal/Day)
67.3 70.4 71.4 69.9 64.9 63.6 66.4 65.0
(27.4) (41.6) (52.9) (39.6) (29.2) (40.4) (48.4) (38.4)
6 Total Labour (Rs./Day)
Male (Rs./Day)
48.7 46.3 28.9 39.9 74.9 48.9 36.5 52.1
(19.9) (27.4) (21.4) (22.6) (33.7) (31.0) (26.6) (30.7)
Female (Rs./Day)
126.5 49.6 32.0 63.8 79.8 42.0 31.5 49.3
(51.6) (29.3) (23.7) (36.2) (35.8) (26.7) (22.9) (29.1)
Total
175.2 95.9 60.9 103.7 154.7 90.9 67.9 101.4
(71.4) (56.7) (45.1) (58.8) (69.5) (57.7) (49.5) (59.9)
7 Veterinary Cost
(Rs./Animal/Day)
2.8 2.9 2.8 2.8 3.0 3.1 3.0 3.0
(1.1) (1.7) (2.0) (1.6) (1.3) (1.9) (2.2) (1.8)
8 Total Cost
(Rs./Animal/Day)
245.3 169.2 135.0 176.4 222.6 157.5 137.3 169.4
(100.0) (100.0) (100.0) (100.0) (100.0) (100.0) (100.0) (100.0)
9 Milk Production
(Litre/Animal) 2.6 3.3 2.8 2.9 4.8 5.7 5.7 5.4
10 Price (Rs. /litre) 23.8 23.0 22.3 23.0 22.1 22.6 22.7 22.5
11
Returns from
Milk Production
(Production*Avg
Price)
61.1 74.4 61.1 65.3 105.4 128.5 127.7 121.4
12 Income from Dung
(Rs./Animal/Day) 37.7 38.4 36.9 37.6 43.4 43.5 44.2 43.7
13 Total Income
(Rs./Animal/Day) 98.8 112.9 98.0 102.9 148.8 171.9 171.9 165.1
14 Net Return/Profit(
RS./Animal/Day) -146.6 -56.4 -37.0 -73.5 -73.8 14.5 34.6 -4.3
15
Net Return/Profit
without imputed value
of fam.lab.
(Rs./Animal/Day)
28.7 39.5 23.8 30.1 79.4 105.3 102.5 96.4
Source: Field Survey Data.
A similar pattern was observed in the NDCS households too where the labour cost had been
observed as 58.8 per cent and 59.9 per cent in aggregate for localand cross bred cows
respectively (Table 5.16).On the other hand the quantum of milk production per animal per

99
day was higher for cross bred cow than local ones. The DCS villages had a marginal edge in
terms of milk output from cross bred cows over NDCS ones while the contrary was observed
in case of local breeds. The prices offered by the private agents were lower than the prices
paid by the local dairy cooperatives.
Coming to the question of net returns per day per animal, which is of foremost importance
for the enterprise, we are faced with a situation where farmers were incurring heavy losses.
Barring only two categories of middle and large farmers rearing cross bred cows in both
types of villages all other farmers were suffering sizeable amount of net losses per day. It is
a fact that cross bred cows offer more milk as compared to the local non-descript varieties.
The small farmers owning one cross bred cow or at most two could not find it economical
from the point of profitability. At the same time we must take note of the fact that most of
the households in either DCS or NDCS villages were pursuing dairy activities as their
subsidiary source of income and managing them solely with participation of family labours.
Family labour, when employed in the activities, does not consider the optimization criterion
for maximization of profit from the enterprise. This remains true for the owned agriculture
too. Over optimal use of family labour, when imputed with market wage rates got inflated
and ended in showing heavy losses from the dairy business. In addition, the opportunity
cost of labour particularly of women from relatively higher ethnic strata of the rural society
seems to be very poor. Moreover, social and cultural practices that prevail in the agrarian
society restrict them from opting for economic employment outside the domestic
periphery.
But if the imputed value of labour gets deducted from total cost the households across
each and every size-class and for all types of cows earned substantial positive profit per day
per animal which again might not be the real scenario. The actual profit earning might be
lying somewhere between the two poles. But at this juncture, on the basis of availed data, it
could be asserted that rearing of cross bred cows as dairy enterprise were profitable than
nurturing of local non-descript breeds.
5.8 Chapter Summary
In DCS villages herd strength of local milch animals are higher than that in the NDCS villages
across all size-classes. But when it comes to rearing of cross bred animals, NDCS farmers

100
owned more cross bred cow than the former ones. So far as the cattle sheds are concerned
NDCS farmers were found to own more sheds on an average for their cattle than DCS
farmers.
Average yield of cross bred cows were substantially higher than the local cows. However, in
the DCS the average yield of milk seemed to be higher than NDCS ones.
Average age of the breedable local cows in the DCS villages was 6 years in aggregate of all
size-classes while for cross bred cow average age had been 5 years. Average age at first
calving for local cows was higher than the cross bred cows in both the areas. Lactation
order was found more or less same for all types of farmers with marginal variation among
the village clusters and size-classes.
A dismal scenario was observed as regards to insurance coverage for the cattle.
Milk output of cross bred cows had always been higher than the local cow irrespective of
seasons, locational specificity (i.e. DCS/NDCS) and size-class categories.
In both DCS and NDCS villages no hired labour had been employed for dairy operations. It is
noteworthy to mention that in DCS villages across all size-class participation of women
family members had been higher both in terms of number per day as well as hours of
involvement in such activities. Moreover they had been members of DCS too.
NDCS household across all size-classes were feeding their cattle with more of dry and green
fodder and supplements as compared to the DCS farmers. In case for concentrates DCS and
NDCS farmers were applying prepared cattle feed in more or less equal quantity. In case of
cross bred cow, however, feeding was higher among the DCS households than their NDCS
counterparts. Average grazing hours for local cattle was 3.4-3.8 hours while it was 2.5 for
cross bred cattle.
In the villages of the present study (both DCS & NDCS) normal water of adequate quantity
was reported by the respondents. The main source of water for dairy had been tube wells
supplemented by farm ponds and open wells.
Most of the animals in DCS and NDCS villages across size-classes received vaccines like HS,
BQ and FMD. Vaccination among the small size-class had been a little lower as compared
with the other two size-classes. Use of vaccines for cross bred cows was marginally higher
101
than the local cows. Artificial insemination (AI) had been the main method of conception for
the cattle.
Knowledge and awareness regarding vaccination and AI schemes had been to the fullest
extent. But when the question boiled down to awareness about other schemes there was
sharp contrast between the farmers of DCS and NDCS villages. For the DCS farmers
knowledge had been imparted by the milk cooperatives and milk unions functioning in the
area. For the NDCS farmers, however, source of their awareness had been fellow farmers
and neighbours.
Most of the benefitted DCS farmers seemed to be satisfied with the assistance they received
through the several schemes and reported quality of the material had been up to their
expectation.
For calculating cost and returns we had imputed the value of family labour with ruling
wages rates for male and female. It is observed that labour cost has been the main
component of total cost in all cases. The proportion of labour component, however, was
found decreasing with increase in the size-class of both DCS and NDCS villages. The prices
offered by the private agents were lower than the prices paid by the local dairy
cooperatives.
Coming to the question of net returns per day per animal, we are faced with a situation
where farmers were incurring heavy losses. Barring only two categories of middle and large
farmers rearing cross bred cows in both types of villages all other farmers were suffering
sizeable amount of net losses per day. But if the imputed value of labour gets deducted
from total cost the households across each and every size-class and for all types of cows
earned substantial positive profit per day per animal.

102
Chapter VI
Milk Consumption and Marketable Surplus
6.1 Introduction
We have so far been engaged in discussing various aspects of cattle rearing and production
of milk. But as we all know that liquid milk is a highly perishable output hence it needs
proper care for preservation and marketing. Moreover, preparation of milk products adds
value to the basic output and has larger market opportunities. In West Bengal, however, the
Government run milk processing plants are few in number and have little opportunities of
product diversification. Apart from that there are innumerable private middlemen who play
a very important role in supplying milk and some basic milk products like Paneer, Curd etc.
to the consumers in the townships and cities. There local and faraway sweetshops also
depend on these middlemen for uninterrupted supply of milk and products for their own
use in preparing sweets.
Though we have already seen that the local vendors pay less to the farmers than the
cooperatives, nonetheless farmers having no cooperative in the vicinity prefer to sell their
product to the middlemen. Moreover, the local vendors collect the milk from the door step
of the farmer and one does not have to commute to the milk procurement point. The price
offered by the vendors does not depend on the fat content in the milk supplied by the
households.
But even after such advantages that are given by the private vendors the farmers who have
the opportunity of having milk cooperative in neighbourhood choose to be a member of the
one.
Presently, we shall be discussing these issues on the basis of out observations at the field
level.
6.2 Use of Milk at Home and Processing
In course of the village survey data as regard to production and use of milk by the
households was collected. In the DCS households data for milk drawn per animal per day
revealed that the quantity of milk drawn per local cow was 2.64 litres for the DCS village

103
while it had been 5.65 litres for cross bred cow. For NDCS households, however, quantities
were to the tune of 2.93 litres and 5.45 litres respectively (Table 6.1 and Table 6.2). In case
of local cattle NDCS households were drawing more milk from cow while milk from cross
bred cow was greater among DCS households.
Table 6.1: Production and Use of Milk by selected DCS Households (day of visit)
Sr.
No. Particulars
Local Cow Crossbred Cow
SM MM LM TM SM MM LM TM
1 Milk Drawn
Lit/animal
2.59 2.83 2.54 2.64 5.87 5.55 5.56 5.65
2 Use of Milk at Home
(lit)
11.30 11.70 13.00 36.00 18.50 18.00 16.70 53.20
% Milk used at
Home
19.96 17.70 18.95 18.82 10.27 8.71 8.43 9.10
For Direct
Consumption (%)
84.07 82.05 92.31 86.39 77.30 44.44 37.13 53.57
For Processing (%)
15.93 17.95 7.69 13.61 22.70 55.56 62.87 46.43
3 Raw/Liquid Milk
sold (Lit)
45.30 54.40 55.60 155.30 161.70 188.70 181.30 531.70
% to total
production
80.04 82.30 81.05 81.18 89.73 91.29 91.57 90.90
Source: Field Survey Data.
Table 6.2: Production and Use of Milk by selected NDCS Households (day of visit)
Sr.
No. Particulars
Local Cow Crossbred Cow
SM MM LM TM SM MM LM TM
1 Milk Drawn
Lit/animal
2.74 3.30 2.82 2.93 4.87 5.71 5.68 5.45
2 Use of Milk at Home
(lit)
16.00 8.80 21.20 46.00 19.30 14.50 11.00 44.80
% Milk used at Home
27.59 15.49 30.59 24.99 14.89 8.43 6.07 9.28
For Direct
Consumption (%)
60.00 56.82 58.49 58.70 76.68 72.41 69.09 73.44
For Processing (%)
40.00 43.18 41.51 41.30 23.32 27.59 30.91 26.56
3 Raw/Liquid Milk sold
(Lit)
42.00 48.00 48.10 138.10 110.30 157.50 170.30 438.10
% to total production 72.41 84.51 69.41 75.01 85.11 91.57 93.93 90.72
Source: Field Survey Data.
General practice among the farmers of all categories was to sell out bulk of the liquid milk.
In the DCS villages over 80 per cent of total milk production from local cow was sold while
the corresponding percentage for cross bred milk was to the tune of over 90 per cent. In the
NDCS case proportion of milk sold accounted for 75 per cent and about 91 per cent

104
respectively. It was interesting to note that in both cases milk of cross bred cow was sold
directly in greater proportion than the milk of local cow. This in a way points towards
household’s preference for milk of the local cow for their own consumption. This gets
corroborated from the data on usage of milk at home from two different varieties of cattle.
The DCS households preferred cross bred milk for processing while NDCS preferred milk of
local cow for such preparations. There was not much of a difference among the size-classes
except for the fact that the large farmers of DCS villages had a strong preference for milk
from local cow for direct consumption at home.
6.3 Sale of Milk and Cost of Milk Marketing
It is evident from Table 6.3 and Table 6.4 that bulk of the milk produced by the DCS farmer
across all size-classes and breed were disposed at dairy cooperatives. In all size-class
categories the percentage of sale to DCS accounted for over 85 per cent. For NDCS farmers,
however, proportion of total sales to the same tune had been given to the private vendors
and middlemen. The DCS households were found selling a small quantum directly to local
customers. Middle and large farmers rearing local cattle and small and large producers
rearing cross breed had their own marketing in a meagre proportion. Private vendors and
local sweet shops also had a marginal share of total sale of cross breed milk by the DCS
farmers. The price offered by cooperatives had always been higher than the price offered by
the private ones. Price paid by the DCS had been Rs. 24.91 per litre for local cow’s milk and
Rs. 24.38 for cross breed milk while price offered by private vendors and sweet shops or
even direct customers was around Rs. 22-23 per litres. Payments by DCS were generally
transferred to suppliers’ bank accounts on weekly basis whereas payments from local
vendors were received after a month. However, no reasons were reported by the farmers as
to their disposal with avenues other than DCS.

105
Table 6.3: Sale of Milk and Cost of Milk Marketing- DCS Households
Sr.
No
Particulars DCS HH- Sale of Milk and Cost of Milk Marketing
Local Cow Crossbred Cow
SM MM LM TM SM MM LM TM
1 Milk Sold (% to total
prod 80.04 82.30 81.05 81.18 89.73 91.29 91.57 90.90
2 Agencies
A DCS
Milk Sold (% to total
sale) 94.48 94.85 85.79 91.50 86.64 91.10 88.75 88.94
Price (Rs./Lit 24.95 25.00 24.79 24.91 24.29 24.59 24.24 24.38
Payment (%) - - - - - - - -
Daily - - - - - - - -
Weekly 100.0 100.0 100.0 100.0 100.0 100.0 100.0 100.0
Monthly - - - - - - - -
Half Monthly - - - - - - - -
Distance (Kms) 0.55 0.40 0.48 0.48 0.42 0.50 0.46 0.46
Transport Cost (Rs.) 0.00 0.00 0.00 0.00 0.00 0.06 0.00 0.02
B Consumer
Milk Sold (% to total
sale) - 5.15 14.21 6.89 3.40 - 2.76 1.97
Price Rs./Lit - 21.50 22.23 22.05 23.00 - 22.20 22.60
Payment (%) - - - - - - - -
Daily - - - - - - - -
Weekly - - - - - - - -
Monthly - 100.0 100.0 100.0 100.0 - 100.0 100.0
Half Monthly - - - - - - - -
Distance (Kms) - 0.00 0.00 0.00 0.50 - 0.00 0.25
Transport Cost (Rs.) - 0.00 0.00 0.00 0.00 - 0.00 0.00
C Private vendor
/Middlemen
Milk Sold (% to total
sale) 5.52 - - 1.61 2.47 6.04 - 2.90
Price Rs./Lit 23.00 - - 23.00 21.50 21.43 - 21.45
Payment (%) - - - - - - - -
Daily - - - - - - - -
Weekly - - - - - - - -
Monthly 100.0 - - 100.0 100.0 100.0 - 100.0
Half Monthly - - - - - - - -
Distance (Kms) 0.00 - - 0.00 0.00 0.07 - 0.05
Transport Cost (Rs.) 0.00 - - 0.00 0.00 0.00 - 0.00
D Sweet Shops
Milk Sold (% to total
sale) - - - - 7.48 2.86 8.49 6.19
Price Rs./Lit - - - - 23.25 21.50 22.77 22.72
Payment - - - - - - - -
Daily - - - - - - - -
Weekly - - - - - - - -
Monthly - - - - 100.0 100.0 100.0 100.0
Half Monthly - - - - - - - -
Distance (Kms) - - - - 0.30 0.30 0.27 0.28
Transport Cost (Rs.) - - - - 0.00 0.00 0.00 0.00
G members did not
sale milk to dairy
reasons NR NR NR
NR NR NR
Source: Field survey data; NR-Not Reported.

106
Table 6.4: Sale of Milk and Cost of Milk Marketing- NDCS Households
Sr.
No
Particulars NDCS HH- Sale of Milk and Cost of Milk Marketing
Local Cow Crossbred Cow
SM MM LM TM SM MM LM TM
1 Milk Sold (% to
total prod 72.41 84.51 69.41 75.01 85.11 91.57 93.93 90.72
2 Agencies
A DCS
Milk Sold (% to
total sale)
23.81 22.08 - 14.92 - - - -
Price (Rs./Lit 25.00 24.50 - 24.75 - - - -
Payment (%) - - - - - - - -
Daily - - - - - - - -
Weekly 100.0 100.0 - 100.0 - - - -
Monthly - - - - - - - -
Half Monthly - - - - - - - -
Distance (Kms) 0.75 0.75 - 0.75 - - - -
Transport Cost
(Rs.) 0.00 0.00 - 0.00 - - - -
B Consumer
Milk Sold (% to
total sale) - - - - - - - -
Price Rs./Lit - - - - - - - -
Payment (%) - - - - - - - -
Daily - - - - - - - -
Weekly - - - - - - - -
Monthly - - - - - - - -
Half Monthly - - - - - - - -
Distance (Kms) - - - - - - - -
Transport Cost
(Rs.) - - - - - - - -
C Private Vendor
Middlemen
Milk Sold (% to
total sale)
76.19 77.92 100.00 85.08 100.00 100.00 100.00 100.00
Price Rs./Lit 22.89 22.82 22.32 22.64 21.94 22.63 22.69 22.45
Payment (%) - - - - - - - -
Daily - - - - - - - -
Weekly - - - - - - - -
Monthly 100.0 100.0 100.0 100.0 100.0 100.0 100.0 100.0
Half Monthly - - - - - - - -
Distance (Kms) 0.00 0.40 0.25 0.21 0.00 0.01 0.03 0.01
Transport Cost
(Rs.) 0.00 0.00 0.00 0.00 0.00 0.00 0.00 0.00
D Sweet Shops
Milk Sold (% to
total sale) - - - - - - - -
Price Rs./Lit - - - - - - - -
Payment - - - - - - - -
Daily - - - - - - - -
Weekly - - - - - - - -
Monthly - - - - - - - -
Half Monthly - - - - - - - -
Distance (Kms) - - - - - - - -
Transport Cost
(Rs.) - - - - - - - -
Source: Field survey data.

107
Non DCS farmers, on the other hand, depended on private vendors and middlemen for
disposal of milk though at a lower price offered by the PDCS. A few non-members were
found disposing a part of their output from local cow at the nearest procurement point of
local dairy cooperative. However, no direct sale to consumers or sweet shops was observed
in case of NDCS farmers. Cross Breed milk was totally procured by the middlemen.
6.4 Handling of Income from Dairying
As we have observed in the preceding chapter that participation of family members
particularly women were of crucial importance for dairy farming at the family level. Our
sample consisted of families which in no way were in position to employ hired labour for
their enterprise.
Table 6.5: Details about Income received from Dairying and its use
Sr.
No
Particulars
Who receives the income Income spent on (share in approx.)
Family Exp Animal Feed & Health
SM MM LM TM SM MM LM TM SM MM
I DCS
A Income from dairy (sale of milk )
1 Male 22.50 25.00 25.00 24.17
54.75 53.63 55.68 45.25 46.38 44.33 2 Female 37.50 25.00 30.00 30.83
3 Both 40.00 50.00 45.00 45.00
B Income from sale of products
1 Male 0.00 2.50 0.00 0.83
83.75 73.33 0.00 16.25 26.67 0.00 2 Female 7.50 5.00 0.00 4.17
3 Both 2.50 0.00 0.00 0.83
4 N.A. 90.00 92.50 100.00 94.17
C Income sale of dung /FYM
1 Male 5.00 12.50 10.00 9.17
44.38 40.25 52.38 55.63 59.75 47.63 2 Female 80.00 75.00 62.50 72.50
3 Both 15.00 12.50 27.50 18.33
II NDCS
A Income from dairy (sale of milk )
1 Male 27.50 27.50 32.50 29.17
57.00 52.00 54.53 43.00 48.00 45.48 2 Female 40.00 35.00 35.00 36.67
3 Both 32.50 37.50 32.50 34.17
B Income from sale of products
1 Male 0.00 2.50 2.50 1.67
44.00 12.50 27.22 56.00 87.50 72.78 2 Female 22.50 17.50 20.00 20.00
3 Both 2.50 0.00 0.00 0.83
4 N.A. 75.00 80.00 77.50 77.50
C Income sale of dung /FYM
1 Male 10.00 17.50 12.50 13.33
52.00 47.29 47.71 48.00 52.71 52.29 2 Female 57.50 52.50 47.50 52.50
3 Both 20.00 17.50 27.50 21.67
4 N.A. 12.50 12.50 12.50 12.50
Source: Field Survey Data.

108
At the same time in the districts we came across primary dairy cooperatives being run by
women in general. Particularly in the districts of North and South Twenty Four Parganas
participation of women in decision making at the household level as well as DCS level had
been at a considerable extent. In other districts too, female members of families were of
utmost importance for dairy enterprises. This gets reflected in Table 6.5 where it is found
that over 70 per cent of the DCS families in aggregate reported involvement of women
members while receiving the income from sale of milk. Women solely accounted for around
31 per cent while spouse together accounted for 45 per cent. The feature is observed in all
size-class categories. As far as income from sale of cow dung, cow dung cakes and farm yard
manure, women had almost unquestionable authority of receiving the income. In NDCS
households too, women had their fair share in decision making in dairy enterprises.
When we look into the data as to the distribution of income received from dairy into family
expenses vis-à-vis expenses incurred for animal feed and health, an interesting feature is
observed. When sales proceeds of liquid milk was concerned, which had been the main
source of dairy income, household spent more on family maintenance rather than diverting
the money to meet expenses of dairy activities. This was a feature observed in DCS as well
as in NDCS villages. Contrarily, income from dung sale was switched towards upkeep of the
cattle herd in greater proportions with some variations within size-classes.
6.5 Problems in Milk Marketing
There have been continuous attempts for development of milk sector and improving the
conditions of milk producers in the state. But it is evident from the present study that small
producers operating at family level dominated the scenario. Hence, it remained mostly
unorganized. The milk cooperatives in every district were found to operate but they were
too small in number to wrap the large number of small milk producers in respective areas.
Moreover, their procurement capacity had been rather small as compared to the supply of
liquid milk.
At the same time there operated small private vendors who generally collected milk from
producer’s door step. It would be almost impossible for the little producers to sell their
109
output without these intermediaries. Innumerable small producers were in no position to
have a control over market price.
Over and above all, there existed acute problem of milk adulteration and malpractice by the
small private players as complained by some of the DCS members.
6.6 Chapter Summary
In the DCS households data for milk drawn per animal per day revealed that the quantity of
milk drawn per local cow was 2.64 litres for the DCS village while it had been 5.65 litres for
cross bred cow. For NDCS households, however, quantities were to the tune of 2.93 litres
and 5.45 litres respectively.
General practice among the farmers of all categories was to sell out bulk of the liquid milk. It
was interesting to note that in both cases milk of cross bred cow was sold directly in greater
proportion than the milk of local cow. This in a way points towards household’s preference
for milk of the local cow for their own consumption.
In all size-class categories the percentage of sale to DCS accounted for over 85 per cent. For
NDCS farmers, however, proportion of total sales, being around 85 per cent, had been given
to the private vendors and middlemen.
The price offered by cooperatives had always been higher than the price offered by the
private ones. Payments by DCS were generally transferred to suppliers’ bank accounts on
weekly basis whereas payments from local vendors were received after a month.
Involvement of women members in receiving income from sale of milk was found in both
DCS and NDCS families. As far as income from sale of cow dung, cow dung cakes and farm
yard manure, women had almost unquestionable authority of receiving the income in both
types of villages.
Share of expenses for family maintenance had been higher in comparison with the share of
expenses for dairy activities from sales proceeds of milk. However, income from dung sale
was switched towards upkeep of the cattle herd in greater proportion with some inter size-
class variations.

110
The milk cooperatives, though operating in every district, were too small in number to wrap
the large number of small milk producers in respective areas. Moreover, their procurement
capacity had been rather small as compared to the supply of liquid milk. And these
cooperatives were faced with competition from the enumerable private intermediaries who
collected the milk from producer’s door steps.
Over and above all, there existed acute problem of milk adulteration and malpractice by the
small private players as complained by some of the DCS members.

111
Chapter VII
Constrains faced in Production and Marketing of Milk and
Suggestions
7.1 Introduction:
In this chapter we are concerned with the constraints that were being faced by the milk
producers in course of their entrepreneurship. On one hand, hindrance might have been in
the production process due to insufficiency of service delivery, infrastructural inadequacy,
and economic stringency and so on. On the other, there might be hurdles in marketing of
the output by the farmers. Nature and extent of various constraints faced by the farmers as
well as their suggestions in this regard was recorded in course of our field survey. The
results are being discussed in this chapter for DCS and NDCS households.
7.2 Service Delivery System
Efficacy in service delivery of input and output is one of the main determinants for
successful and profitable operation of animal husbandry in general and dairy enterprise in
particular. Adequacy and timeliness in supplying cattle feed, veterinary services including
artificial insemination, proper vaccination to check disease outbreak are important
components of input service delivery. On the other hand it is a fact that the primary output
of dairy sector i.e. liquid milk is a highly perishable commodity and hence needs proper and
efficient output delivery system whether been provided by the government/cooperative
societies or the private players in this sector. At the same time the economics of this
enterprise i.e. profitability from dairy business is of primary concern to the farmers.
Assistance to the farmers in respect of input and output delivery should be such that the
farmers could make it a profitable business proposition.
It is in this light we take up the present section considering farmers from the DCS as well as
NDCS villages analyzing their experience as regards to input and output delivery system.

112
Table 7.1: Details of Input and Output Service Delivery experienced by DCS households No
Particulars
Service Provider (% of response) - DCS
PDCS Agent Private agent
SM MM LM TM SM MM LM TM SM MM LM TM
A Input Delivery (%)
1 Supply of Cattle Feed
Adequate 33.3 0.0 0.0 22.5 - - - - 23.1 37.5 17.1 26.3
Inadequate 66.7 100.0 100.0 77.5 - - - - 76.9 62.5 82.9 73.8
Not Available - - - - - - - - - - -
2 Cattle feed & fodder seed
on Credit
Available 0.0 0.0 0.0 0.0 - - - - 59.1 63.3 65.4 62.8
Not Available 100.0 100.0 100.0 100.0 - - - - 40.9 36.7 34.6 37.2
3 Cost of cattle feed &
mineral mixture
High 9.1 0.0 0.0 6.7 - - - - 100.0 100.0 84.6 94.3
ok 90.9 100.0 100.0 93.3 - - - - 0.0 0.0 15.4 5.7
Not Available
4 Emergency Veterinary
Services (EVS)
Available 0.0 0.0 0.0 0.0 - - - - 100.0 100.0 100.0 100.0
Not Available 100.0 100.0 100.0 100.0 - - - - 0.0 0.0 0.0 0.0
Charges for EVS
High - - - - - - - - 100.0 92.5 92.5 95.0
Medium - - - - - - - - 0.0 7.5 7.5 5.0
Low - - - - - - - - 0.0 0.0 0.0 0.0
Rs/Visit - - - - - - - -
5 Vaccines
Adequate 0.0 0.0 0.0 0.0 - - - - 5.0 0.0 0.0 1.7
Inadequate 0.0 0.0 0.0 0.0 - - - - 95.0 100.0 100.0 98.3
Not Available 100.0 100.0 100.0 100.0 - - - - 0.0 0.0 0.0 0.0
6
Delivery &applications of
quality & requisite quantity
of vaccines
Yes - - - - - - - - 5.0 0.0 0.0 1.7
No - - - - - - - - 95.0 100.0 100.0 98.3
7 Semen at the AI centre
Adequate - - - - - - - - 0.0 0.0 0.0 0.0
Inadequate - - - - - - - - 100.0 100.0 100.0 100.0
Not Available - - - - - - - - 0.0 0.0 0.0 0.0
8
Provision of loan in society
or govt. for Purchasing
cattle
Adequate 0.0 0.0 0.0 0.0 - - - - 0.0 0.0 0.0 0.0
Inadequate 0.0 0.0 0.0 0.0 - - - - 0.0 0.0 0.0 0.0
Not Available 100.0 100.0 100.0 100.0 - - - - 100.0 100.0 100.0 100.0
9 Charges for insurance
Very high - - - - - - - - - - - -
High - - - - - - - - - - - -
Medium - - - - - - - - - - - -
10 Technical Guidance
Available
100.
0
100.0 100.0 100.0 - - - - 100.0 100.0 100.0 100.0
Not available 0.0 0.0 0.0 0.0 - - - - 0.0 0.0 0.0 0.0
B OUTPUT DELIVERY
1 Milk Price( Rs./lit )
Adequate 0.0 0.0 0.0 0.0 - - - - 0.0 0.0 0.0 0.0
Low 100.0 100.0 100.0 100.0 - - - - 100.0 100.0 100.0 100.0
2 Payment of Milk
Immediate 0.0 0.0 0.0 0.0 - - - - 0.0 0.0 0.0 0.0
Within 2 days 0.0 0.0 0.0 0.0 - - - - 0.0 0.0 0.0 0.0
Within 15 days 100.0 100.0 100. 100.0 - - - - 0.0 0.0 0.0 0.0
More than 15 days 0.0 0.0 0.0 0.0 - - - - 100.0 100.0 100.0 100.0
3 incentives or bonus for
supplying milk
Adequate -* - - - - - - - -* - - -
Low - - - - - - - - - - - -
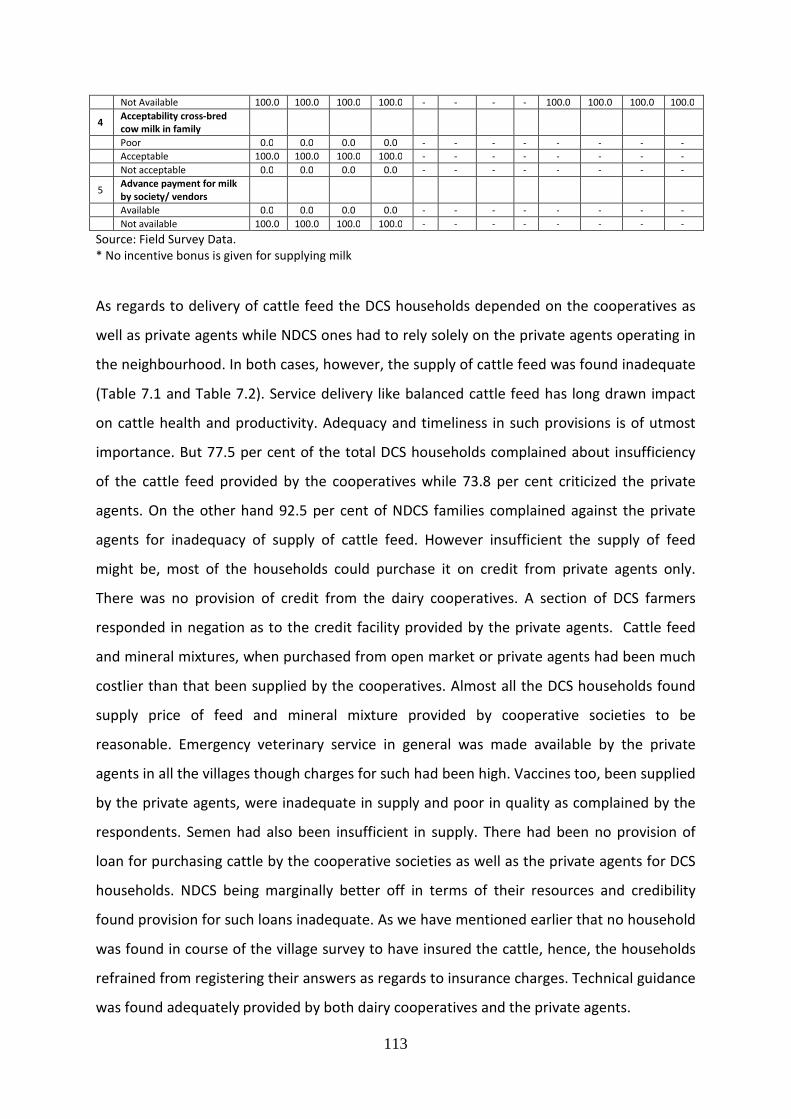
113
Not Available 100.0 100.0 100.0 100.0 - - - - 100.0 100.0 100.0 100.0
4 Acceptability cross-bred
cow milk in family
Poor 0.0 0.0 0.0 0.0 - - - - - - - -
Acceptable 100.0 100.0 100.0 100.0 - - - - - - - -
Not acceptable 0.0 0.0 0.0 0.0 - - - - - - - -
5 Advance payment for milk
by society/ vendors
Available 0.0 0.0 0.0 0.0 - - - - - - - -
Not available 100.0 100.0 100.0 100.0 - - - - - - - -
Source: Field Survey Data.
* No incentive bonus is given for supplying milk
As regards to delivery of cattle feed the DCS households depended on the cooperatives as
well as private agents while NDCS ones had to rely solely on the private agents operating in
the neighbourhood. In both cases, however, the supply of cattle feed was found inadequate
(Table 7.1 and Table 7.2). Service delivery like balanced cattle feed has long drawn impact
on cattle health and productivity. Adequacy and timeliness in such provisions is of utmost
importance. But 77.5 per cent of the total DCS households complained about insufficiency
of the cattle feed provided by the cooperatives while 73.8 per cent criticized the private
agents. On the other hand 92.5 per cent of NDCS families complained against the private
agents for inadequacy of supply of cattle feed. However insufficient the supply of feed
might be, most of the households could purchase it on credit from private agents only.
There was no provision of credit from the dairy cooperatives. A section of DCS farmers
responded in negation as to the credit facility provided by the private agents. Cattle feed
and mineral mixtures, when purchased from open market or private agents had been much
costlier than that been supplied by the cooperatives. Almost all the DCS households found
supply price of feed and mineral mixture provided by cooperative societies to be
reasonable. Emergency veterinary service in general was made available by the private
agents in all the villages though charges for such had been high. Vaccines too, been supplied
by the private agents, were inadequate in supply and poor in quality as complained by the
respondents. Semen had also been insufficient in supply. There had been no provision of
loan for purchasing cattle by the cooperative societies as well as the private agents for DCS
households. NDCS being marginally better off in terms of their resources and credibility
found provision for such loans inadequate. As we have mentioned earlier that no household
was found in course of the village survey to have insured the cattle, hence, the households
refrained from registering their answers as regards to insurance charges. Technical guidance
was found adequately provided by both dairy cooperatives and the private agents.

114
Table 7.2: Details of Input and Output Service Delivery experienced by NDCS households
No
Particulars
Service Provider (% of response) - NDCS
PDCS Agent Private agent
SM MM LM TM SM MM LM TM SM MM LM TM
A Input Delivery (%)
1 Supply of Cattle Feed
Adequate - - - - - - - - 10.0 5.0 7.5 7.5
Inadequate - - - - - - - - 90.0 95.0 92.5 92.5
Not Available - - - - - - - - 0.0 0.0 0.0 0.0
2 Cattle feed & fodder seed
on Credit
Available - - - - - - - - 75.0 65.0 82.5 74.2
Not Available - - - - - - - - 25.0 35.0 17.5 25.8
3 Cost of cattle feed &
mineral mixture
High - - - - - - - - 100.0 100.0 100.0 100.0
ok - - - - - - - - 0.0 0.0 0.0 0.0
Not Available - - - - - - - -
4 Emergency Veterinary
Services (EVS)
Available - - - - - - - - 100.0 100.0 100. 100.0
Not Available - - - - - - - - 0.0 0.0 0.0 0.0
Charges for EVS
High - - - - - - - - 100.0 100.0 95.0 98.3
Medium - - - - - - - - 0.0 0.0 5.0 1.7
Low - - - - - - - - 0.0 0.0 0.0 0.0
Rs/Visit - - - - - - - -
5 Vaccines
Adequate - - - - - - - - 5.0 2.5 0.0 2.5
Inadequate - - - - - - - - 95.0 97.5 100.0 97.5
Not Available - - - - - - - - 0.0 0.0 0.0 0.0
6
Delivery & applications of
quality & requisite quantity
of vaccines
Yes - - - - - - - - 5.0 2.5 0.0 2.5
No - - - - - - - - 95.0 97.5 100.0 97.5
7 Semen at the AI centre
Adequate - - - - - - - - 0.0 0.0 0.0 0.0
Inadequate - - - - - - - - 100.0 100.0 100.0 100.0
Not Available - - - - - - - - 0.0 0.0 0.0 0.0
8
Provision of loan in society
or govt. for Purchasing
cattle
Adequate - - - - - - - -
Inadequate - - - - - - - - 25.0 25.0 25.0 25.0
Not Available - - - - - - - - 75.0 75.0 75.0 75.0
9 Charges for insurance
Very high - - - - - - - - - - - -
High - - - - - - - - - - - -
Medium - - - - - - - - - - - -
10 Technical Guidance
Available
100.0 100.
0
100.
0
100.0 - - - - 100.0 100.0 100.0 100.0
Not available 0.0 0.0 0.0 0.0 - - - - 0.0 0.0 0.0 0.0
B OUTPUT DELIVERY
1 Milk Price( Rs./lit )
Adequate 0.0 0.0 0.0 0.0 - - - - 0.0 0.0 0.0 0.0
Low 100.0 100.0 - 100.0 - - - - 100.0 100.0 100.0 100.0
2 Payment of Milk
Immediate 0.0 0.0 0.0 0.0 - - - - 0.0 0.0 0.0 0.0
Within 2 days 0.0 0.0 0.0 0.0 - - - - 0.0 0.0 0.0 0.0
Within 15 days 100.0 100.0 - 100.0 - - - - 0.0 0.0 0.0 0.0
More than 15 days 0.0 0.0 0.0 0.0 - - - - 100.0 100.0 100.0 100.0
3 incentives or bonus for
supplying milk

115
Adequate - - - - - - - - - - - -
Low - - - - - - - - - - - -
Not Available - - - - - - - - 100.0 100.0 100.0 100.0
4 Acceptability cross-bred
cow milk in family
Poor - - - - - - - - 0.0 0.0 0.0 0.0
Acceptable - - - - - - - - 100.0 100.0 100.0 100.0
Not acceptable - - - - - - - - 0.0 0.0 0.0 0.0
5 Advance payment for milk
by society/ vendors
Available - - - - - - - - 0.0 0.0 0.0 0.0
Not available - - - - - - - - 100.0 100.0 100.0 100.0
Source: Field Survey Data.
Being a highly perishable output disposal of liquid milk is of extreme importance for growth
of the dairy sector. Regularity and adequacy in output service delivery is hence necessary.
All the milk producers found the milk procurement price to be low whether being disposed
with cooperatives or private vendors. However, the regularity of payment differed between
the societies and vendors. Payment from society was received by the suppliers within a
week or at most two. But for payment from private agents they had to wait for a month.
Nonetheless as regards to disposals none of the households complained about irregularity
of payment from DCS though few complained about delayed payment by private agents.
There had been no incentive bonus and advance payment to the producers either by
cooperative societies or the private agents for supplying milk in the villages of the present
study. Though the farmers responded in affirmative as to the acceptability of cross bred
milk in the family, but in the previous chapter we had observed that the families prefer milk
of the local cow for their own consumption.
7.3 Infrastructural Constraints
Proper infrastructural support to the farmers is one of the necessary conditions for
development of dairy farming at the village level. As of infrastructure, it was found that the
households mainly suffered from lack of improved equipment and training facilities,
irregularity of supply of cattle feed, vaccines, semen at AI centre and infrequent visit of
veterinary staff (Table 7.3). This had been the situation in all the villages irrespective of
having cooperative society or not. But the farmers never complained about inconveniences
as regards to delivery time of milk throughout the year even under extreme climatic
conditions.

116
Table 7.3: Details on Infrastructural Constraints faced by Selected Households
No. Particulars Infrastructural Constraints (IC) (% to total responses )
DCS households NDCS households
SM MM LM TM SM MM LM TM
1 Lack of improved equipment
Never 0.0 5.0 7.5 12.5 0.0 0.0 10.0 10.0
Sometime 15.0 27.5 50.0 92.5 5.0 37.5 40.0 82.5
Always 85.0 67.5 42.5 65.0 95.0 62.5 50.0 69.2
2 Irregular & inadequate supply of cattle
feed
Never 0.0 0.0 0.0 0.0 0.0 0.0 0.0 0.0
Sometime 7.5 25.0 40.0 24.2 10.0 27.5 32.5 23.3
Always 92.5 75.0 60.0 75.8 90.0 72.5 67.5 76.7
3 Unavailability of emergency veterinary
services
Never 0.0 0.0 0.0 0.0 0.0 0.0 0.0 0.0
Sometime 2.5 22.5 35.0 20.0 10.0 25.0 25.0 20.0
Always 97.5 77.5 65.0 80.0 90.0 75.0 75.0 80.0
4 Infrequent visit of veterinary staff
Never 0.0 0.0 0.0 0.0 0.0 0.0 0.0 0.0
Sometime 17.5 20.0 32.5 23.3 7.5 35.0 20.0 20.8
Always 82.5 80.0 67.5 76.7 92.5 65.0 80.0 79.2
5 Unavailability of vaccines
Never 0.0 0.0 0.0 0.0 0.0 0.0 0.0 0.0
Sometime 17.5 17.5 30.0 21.7 15.0 27.5 22.5 21.7
Always 82.5 82.5 70.0 78.3 85.0 72.5 77.5 78.3
6 Occasional Availability of semen at the AI
centre
Never 0.0 0.0 0.0 0.0 0.0 0.0 0.0 0.0
Sometime 5.0 12.5 12.5 10.0 7.5 10.0 25.0 14.2
Always 95.0 87.5 87.5 90.0 92.5 90.0 75.0 85.8
7 Lack of training facilities
Never 0.0 0.0 0.0 0.0 0.0 0.0 0.0 0.0
Sometime 0.0 0.0 0.0 0.0 0.0 0.0 0.0 0.0
Always 100.0 100.0 100.0 100.0 100.0 100.0 100.0 100.0
8 Unsuitability of the time of delivery of
milk during winters due to bitter cold in
early hours of the day
Never 100.0 100.0 100.0 100.0 100.0 100.0 100.0 100.0
Sometime 0.0 0.0 0.0 0.0 0.0 0.0 0.0 0.0
Always 0.0 0.0 0.0 0.0 0.0 0.0 0.0 0.0
9 Unavailability of green/dry fodder
throughout the year
Never 22.5 30.0 25.0 25.8 5.0 27.5 20.0 17.5
Sometime 77.5 70.0 75.0 74.2 95.0 72.5 80.0 82.5
Always 0.0 0.0 0.0 0.0 0.0 0.0 0.0 0.0
10 Unavailability of cattle feed and fodder
seed on credit
Never 0.0 20.0 30.0 16.7 5.0 12.5 32.5 16.7
Sometime 10.0 47.5 55.0 37.5 10.0 42.5 52.5 35.0
Always 90.0 32.5 15.0 45.8 85.0 45.0 15.0 48.3
11 Low average milk yield of the milk
animals
Never 0.0 0.0 0.0 0.0 0.0 0.0 0.0 0.0
Sometime 0.0 0.0 0.0 0.0 0.0 0.0 0.0 0.0
Always 100.0 100.0 100.0 100.0 100.0 100.0 100.0 100.0
Source: Field Survey Data.

117
7.4 Economic Constraints
The agrarian sector in West Bengal, as we all know, is dominated by marginal and small
farmers. And in the present study we have seen the eight villages of our concern were no
exception to that. So far as the economic capabilities are concerned households of the
present study remained enveloped in the lower deciles of economic hierarchy though there
had been obvious differences between the size-classes and around membership of
cooperative societies. Households in general were faced with economic hardship.
Table 7.4: Details on Economic Constraints faced by Selected Households
No. Particulars
Economic Constraints (EC) (% to total responses )
DCS households NDCS households
SM MM LM TM SM MM LM TM
1 High cost of fodder seed
Never 0.0 10.0 10.0 6.7 0.0 0.0 0.0 0.0
Sometime 65.0 72.5 55.0 64.2 12.5 40.0 37.5 30.0
Always 35.0 17.5 35.0 29.2 87.5 60.0 62.5 70.0
2 Delay in payment of milk
Never 100.0 100.0 100.0 100.0 50.0 52.5 57.5 53.3
Sometime 0.0 0.0 0.0 0.0 50.0 47.5 42.5 46.7
Always 0.0 0.0 0.0 0.0 0.0 0.0 0.0 0.0
3 Low price of milk offered
Never 0.0 0.0 0.0 0.0 0.0 0.0 0.0 0.0
Sometime 0.0 0.0 0.0 0.0 0.0 0.0 0.0 0.0
Always 100.0 100.0 100.0 100.0 100.0 100.0 100.0 100.0
4 High cost of cross bred cow
Never 0.0 0.0 0.0 0.0 0.0 0.0 0.0 0.0
Sometime 0.0 32.5 47.5 26.7 5.0 27.5 42.5 25.0
Always 100.0 67.5 52.5 73.3 95.0 72.5 57.5 75.0
5 High cost of veterinary medicines
Never 0.0 0.0 0.00 0.0 0.0 0.0 0.0 0.0
Sometime 0.0 17.5 40.0 19.2 0.0 20.0 52.5 24.2
Always 100.0 82.5 60.0 80.8 100.0 80.0 47.5 75.8
6
High cost of cattle feed and mineral
mixture
Never 0.0 0.0 0.0 0.0 0.0 0.0 0.0 0.0
Sometime 0.0 0.0 0.0 0.0 0.0 0.0 0.0 0.0
Always 100.0 100.0 100.0 100.0 100.0 100.0 100.0 100.0
7
Low provision of loan in society or govt.
for purchasing cattle
Never 0.0 0.0 0.0 0.0 0.0 0.0 0.0 0.0
Sometime 0.0 0.0 0.0 0.0 0.0 12.5 20.0 10.8
Always 100.0 100.0 100.0 100.0 100.0 87.5 80.0 89.2
8
Low incentives or bonus for supplying
milk
Never 0.0 0.0 0.0 0.0 0.0 0.0 0.0 0.0
Sometime 0.0 0.0 0.0 0.0 0.0 0.0 0.0 0.0
Always 100.0 100.0 100.0 100.0 100.0 100.0 100.0 100.0
9
High charges of emergency veterinary
services
Never 0.0 0.0 0.0 0.0 0.0 0.0 0.0 0.0
Sometime 0.0 0.0 0.0 0.0 0.0 0.0 0.0 0.0
Always 100.0 100.0 100.0 100.0 100.0 100.0 100.0 100.0
10 High charges for insurance
Never NA NA NA NA NA NA NA NA
Sometime NA NA NA NA NA NA NA NA
Always NA NA NA NA NA NA NA NA
Source: Field Survey Data., *NA= Not Applicable.

118
Economic adversity had a direct bearing on their responses regarding economic constraints that
they are faced with. High cost of feed and mineral mixture, veterinary medicines emergency
veterinary services added with low price of milk are major economic hurdles (Table 7.4). A section of
NDCS farmers, however, complained about delay in payment by the private vendors.
7.5 Marketing Constraints
The households in general seemed unaware about marketing strategies of their own (Table 7.5). It
might have been due to the practice that either they poured the milk in society’s procurement
centre or the vendors collected the milk from door steps. These had been the assured channel of
milk disposal. Hence, lack of time for marketing or risk taking behavior had been none of their
concern. The farmers, however, were looking for advance payment for milk. In face of increasing
prices of feed, fodder, vaccination and medicines this had been their priority. In addition, there were
fewer opportunities to market homemade value added milk products like Ghee or Paneer or even
sweets.
Table 7.5: Details on Marketing Constraints faced by Selected Households
No.
Constraints
Marketing Constraints (MC) (% to total responses )
DCS households NDCS households
SM MM LM TM SM MM LM TM
1 Irregular sell of milk
Never 100.0 100.0 100.0 100.0 100.0 100.0 100.0 100.0
Sometime 0.0 0.0 0.0 0.0 0.0 0.0 0.0 0.0
Always 0.0 0.0 0.0 0.0 0.0 0.0 0.0 0.0
2 Lack of time for marketing
Never NR* NR NR NR NR NR NR NR
Sometime NR NR NR NR NR NR NR NR
Always NR NR NR NR NR NR NR NR
3
Less knowledge about marketing
strategies
Never NR* NR NR NR NR NR NR NR
Sometime NR NR NR NR NR NR NR NR
Always NR NR NR NR NR NR NR NR
4 Low risk taking behaviour
Never NR* NR NR NR NR NR NR NR
Sometime NR NR NR NR NR NR NR NR
Always NR NR NR NR NR NR NR NR
5
No or less advance payment for
milk by society/venders
Never 0.0 0.0 0.0 0.0 0.0 0.0 0.0 0.0
Sometime 0.0 0.0 0.0 0.0 0.0 0.0 0.0 0.0
Always 100.0 100.0 100.0 100.0 100.0 100.0 100.0 100.0
6
Inability to market for value
added products
Never 5.0 20.0 12.5 12.5 7.5 5.0 10.0 7.5
Sometime 17.5 22.5 27.5 22.5 12.5 22.5 30.0 21.7
Always 77.5 57.5 60.0 65.0 80.0 72.5 60.0 70.8
Source: Field Survey Data., NR-Not Reported

119
7.6 Technical Constraints
All household irrespective of their location in DCS village or not are faced with all technical
constraints. In Table 7.6 we find that both DCS and NDCS households were complaining
against poor conception rate through AI, poor knowledge about proper feeding and health
care and cheap and scientific housing for animals. Unavailability of high genetic merit bull
had been a general phenomenon and farmers thus had to depend on AI.
Table 7.6: Details on Technical Constraints faced by Selected Households
No.
Constraints
Technical Constraints (TC) (% to total responses )
DCS households NDCS households
SM MM LM TM SM MM LM TM
1 Lack of technical guidance
Never 100.0 100.0 100.0 100.0 100.0 100.0 100.0 100.0
Sometime 0.0 0.0 0.0 0.0 0.0 0.0 0.0 0.0
Always 0.0 0.0 0.0 0.0 0.0 0.0 0.0 0.0
2
Unavailability of high genetic merit
bull
Never 0.0 0.0 0.0 0.0 0.0 0.0 0.0 0.0
Sometime 0.0 0.0 0.0 0.0 0.0 0.0 0.0 0.0
Always 100.0 100.0 100.0 100.0 100.0 100.0 100.0 100.0
3
Poor conception rate through
artificial insemination
Never 0.0 0.0 0.0 0.0 0.0 0.0 0.0 0.0
Sometime 0.0 0.0 0.0 0.0 0.0 0.0 0.0 0.0
Always 100.0 100.0 100.0 100.0 100.0 100.0 100.0 100.0
4
Poor knowledge about Feeding and
health care
Never 0.0 0.0 0.0 0.0 0.0 0.0 0.0 0.0
Sometime 0.0 0.0 0.0 0.0 0.0 0.0 0.0 0.0
Always 100.0 100.0 100.0 100.0 100.0 100.0 100.0 100.0
5
Lack of knowledge about cheap &
scientific housing of animal
Never 0.0 0.0 0.0 0.0 0.0 0.0 0.0 0.0
Sometime 0.0 0.0 0.0 0.0 0.0 0.0 0.0 0.0
Always 100.0 100.0 100.0 100.0 100.0 100.0 100.0 100.0
Source: Field Survey Data.
7.7 Socio-Psychological Constraints
Details of socio-psychological constraints faced by the farmers are presented in Table 7.7.
Main constraints for DCS and NDCS farmers turned out to be lack of purchasing power
resulting out of lower socio-economic conditions. However, there were few households in
middle and large size groups in both types of villages who were in disagreement with the
proposition that lower socio-economic condition had a bearing on their behavior.

120
Table 7.7: Details on Socio-Psychological Constraints faced by Selected Households
No.
Constraints
Socio-Psychological Constraints (SC) (% to total responses )
DCS households NDCS households
SM MM LM TM SM MM LM TM
1 Lower socio- economic conditions
Never 0.0 10.0 17.5 9.2 0.0 2.5 17.5 6.7
Sometime 2.5 37.5 50.0 30.0 0.0 27.5 30.0 19.2
Always 97.5 52.5 32.5 60.8 100.0 70.0 52.5 74.2
2 Lack of purchasing power
Never 0.0 0.0 0.0 0.0 0.0 0.0 0.0 0.0
Sometime 0.0 0.0 0.0 0.0 0.0 0.0 0.0 0.0
Always 100.0 100.0 100.0 100.0 100.0 100.0 100.0 100.0
3
Lack of time due to busy in
domestic/ agricultural work
Never 92.5 92.5 90.0 91.7 90.0 72.5 77.5 80.0
Sometime 7.5 7.5 10.0 8.3 10.0 27.5 22.5 20.0
Always 0.0 0.0 0.0 0.0 0.0 0.0 0.0 0.0
4
Lack of cooperation and
coordination among members
Never NR* NR NR NR NR NR NR NR
Sometime NR NR NR NR NR NR NR NR
Always NR NR NR NR NR NR NR NR
5
Milk producers are meant for
influential people
Never NR* NR NR NR NR NR NR NR
Sometime NR NR NR NR NR NR NR NR
Always NR NR NR NR NR NR NR NR
6
Milk of cross-bred cow has poor
acceptability (family members )
Never 100.0 100.0 100.0 100.0 100.0 100.0 100.0 100.0
Sometime 0.0 0.0 0.0 0.0 0.0 0.0 0.0 0.0
Always 0.0 0.0 0.0 0.0 0.0 0.0 0.0 0.0
Source: Field Survey Data., NR- Not Reported
7.8 Other Constraints
Among other constraints faced by both types of households, lack of awareness about quality
milk production, lack of finance for investment, lack of veterinary services and proper
medicines and equipment, knowledge about mastitis and lack of poor milk testing facilities
were found important (Table 7.8). The NDCS households in addition complained against lack
of milk chilling facilities in the village.

121
Table 7.8: Details on Other Constraints faced by Selected Households
No. Constraints
Other Constraints (OC) (% to total responses )
DCS households NDCS households
SM MM LM TM SM MM LM TM
1 Unavailability of chilling facilities at village level for milk preservation 0.0 0.0 0.0 0.0 65.0 62.5 65.0 64.2
2 Diversion of feed and fodder ingredients for industrial use
NR* NR NR NR NR NR NR NR
3 Majority of grazing lands are either degraded or encroached 42.5 7.5 20.0 23.3 25.0 15.0 27.5 22.5
4 Poor access to organized markets deprive farmers in getting proper milk price 2.5 7.5 27.5 12.5 0.0 30.0 37.5 22.5
5 Irregular quality electricity supply 0.0 0.0 0.0 0.0 0.0 0.0 0.0 0.0
6 Poor irrigation facility to grow fodder crops 0.0 0.0 0.0 0.0 0.0 0.0 0.0 0.0
7 Non availability of improved fodder seed 27.5 17.5 5.0 16.7 95.0 65.0 75.0 78.3
8 Poor livestock extension services 27.5 20.0 25.0 24.2 62.5 62.5 50.0 58.3
9 Poor knowledge about scientific animal husbandry practices and dairy farming 35.0 50.0 50.0 45.0 62.5 60.0 55.0 59.2
10 Poor knowledge of mastitis (mastitis in dairy animal ) in dairy animals 82.5 72.5 62.5 72.5 97.5 87.5 77.5 87.5
11 Lack of awareness about quality milk production 100.0 100.0 100.0 100.0 100.0 100.0 100.0 100.0
12 Poor housing to milch animals 30.0 25.0 12.5 22.5 47.5 40.0 10.0 32.5
13 Unavailability of medicine and equipment required for quality milk production 65.0 50.0 65.0 60.0 77.5 60.0 57.5 65.0
14 Lack of milk testing and animal screening facilities 62.5 30.0 60.0 50.8 52.5 52.5 52.5 52.5
15 Lack of veterinary services in village for quality milk production 65.0 50.0 65.0 60.0 77.5 60.0 57.5 65.0
16 Lack of nutrition’s feed for quality milk production 42.5 57.5 50.0 50.0 72.5 47.5 65.0 61.7
17 Lack of ecto parasites control programmes NAW# NAW NAW NAW NAW NAW NAW NAW
18 Lack of finance to invest in dairy business for quality milk production/ Inadequate finance
100.0 100.0 100.0 100.0 100.0 100.0 100.0 100.0
19 Lack of necessary space required for tying the milking animals 2.5 20.0 32.5 18.3 0.0 30.0 25.0 18.3
20 Lack of marketing facility for dairy business 20.0 20.0 22.5 20.8 60.0 60.0 52.5 57.5
21 Uneconomical capital investment on quality milk production
NAW NAW NAW NAW NAW NAW NAW NAW
22 Lack of water supply 0.0 0.0 0.0 0.0 0.0 0.0 0.0 0.0
23 Inadequate labour supply 0.0 0.0 0.0 0.0 0.0 0.0 0.0 0.0
24 Ecological factors- High heat/temperature, High cold, etc
0.0 0.0 0.0 0.0 0.0 0.0 0.0 0.0
25 Competition from established and large units 0.0 0.0 0.0 0.0 0.0 0.0 0.0 0.0
26 Difficulty to store milk in summer 0.0 0.0 0.0 0.0 0.0 0.0 0.0 0.0
27 low acceptability of AI in buffalo NA+ NA NA NA NA NA NA NA
28 Disease outbreak: mortality and morbidity 27.5 17.5 25.0 23.3 37.5 40.0 32.5 36.7
29 Politics in Cooperative is not good NR NR NR NR NR NR NR NR
Source: Field Survey Data, *NR-Not Responded; #NAW-Not Aware, +NA-Not Applicable (As no Buffalo)

122
7.9 Suggestions
Suggestions were sought from the respondents as to their opinion regarding development
of the dairy sector in the villages. Irrespective of their locational specificity and position in
the size-class hierarchy suggestions centered on a number of parameters that in their
assessment could improve the situation and expedite development process. As suggested
by the farmers there were urgent need to improve the service delivery along with reducing
the cost of medical and veterinary services including AI (Table 7.9). Moreover, regular and
timely availability of these services should be ensured. Farmers felt that they were lacking
proper technical knowledge for managing the dairy enterprise. So, provisions could be
extended to impart scientific and technical knowhow to the farmers. Veterinary literature
should be made available at the village level. But over and above all there had been a
unanimous demand to enhance the milk procurement price by the milk cooperative
societies as well as by the private vendors. It is a fact that the private vendors operated
outside the purview of the milk societies and functioned in a manner that the individual
farmers had been in a no-bargain situation as regards to price. Prices offered by the
middlemen in this sector were rather low. Hence, the NDCS farmers were looking for village
level outlets for milk and milk products.
Future Challenges
West Bengal features an ever increasing population on a fertile land. In thickly populated
villages it is the marginal and small cultivators who are of sizeable majority. In addition
there are landless populations who are mostly wage earners. Still cropping is the main
source of livelihood in the rural areas of the state. This was reflected in the results of the
present study. We have mentioned that the farmers in the villages tried to pursue dairy
activities as an alternative source of income. As a means of living animal husbandry in
general and dairy enterprises in particular could play a significant role. But tiny producers
scattered over the whole of the state have to be roped in a form of society that could
render the necessary assistance to them. With such intensions the dairy cooperative
societies were established. But outreach of these societies is still very limited and a large
section of dairy farmers are left out of the little benefits that are being imparted by the
primary dairy societies. The cooperative societies, on the other hand, are faced with a
number of governance restrictions and other limitations of which we shall be discussing

123
later in this chapter. Presently we take up the constraints faced by the primary dairy
cooperative societies.
Table 7.9: Suggestions for improvement in adoption of dairy schemes
Sr. No Suggestions % of response to DCS % of response to NDCS
SM MM LM TM SM MM LM TM
1 Marketing facilities be provided at village
level for the outlet of milk and milk products 20.0 20.0 22.5 20.8 60.0 60.0 52.5 57.5
2 Providing technical knowledge to manage
the dairy Enterprise 100.0 100.0 100.0 100.0 100.0 100.0 100.0 100.0
3 There should be regular and planned supply
of vaccines (100%) 100.0 100.0 100.0 100.0 100.0 100.0 100.0 100.0
4 Subsidies should be given on certain inputs
like veterinary medicines, fodder seeds, etc. 100.0 100.0 100.0 100.0 100.0 100.0 100.0 100.0
5 Enhanced milk price for the producers 100.0 100.0 100.0 100.0 100.0 100.0 100.0 100.0
6 Loan sanction procedure should be made
easy 7.5 30.0 40.0 25.8 0.0 10.0 22.5 10.8
7 The loan amount for the purchase dairy
animals need to be increased 2.5 12.5 27.5 14.2 0.0 7.5 5.0 4.2
8 Concentrates should be made available at
cheaper rate and in time 100.0 100.0 100.0 100.0 100.0 100.0 100.0 100.0
9 Providing proper A.I. facility at village level
/door step 100.0 100.0 100.0 100.0 100.0 100.0 100.0 100.0
10 Cost of veterinary services need to be
reduced 100.0 100.0 100.0 100.0 100.0 100.0 100.0 100.0
11 Provide veterinary literature in village 100.0 100.0 100.0 100.0 100.0 100.0 100.0 100.0
12 Small scale dairy industries be encouraged at
village level 10.0 32.5 35.0 25.8 7.5 17.5 30.0 18.3
13 Need to improve service delivery
100.0 100.0 100.0 100.0 100.0 100.0 100.0 100.0
Source: Field Survey Data
7.10 Constraints faced by PDCS /Private Dairy Units
Major constraints faced by the cooperative societies could be classified into three broad
categories viz. milk supply related, infrastructural and market related constraints. From
Table 7.10 it is seen that inability on the part of DCS to make advance payment to milk
producers is visualized as one of the major hurdles. The DCSs were unable to provide feed
and fodder seeds on credit. Inadequate and irregular supply of milk had been a problem in
Bankura and Nadia. However, all the DCS were of the opinion that the average milk yield in
the respective areas was sometimes low. Unavailability of emergency veterinary services
and infrequent visit by veterinary staff had been a serious obstacle in Nadia, North and
South Twenty Four Parganas. Large number of small producers in Nadia and South Twenty
Four Parganas posed serious problem of monitoring and follow-up activities by the DCSs. In
Bankua, South and North Twenty Four Parganas Scarcity of green fodder throughout the
year had also been a serious problem.

124
Table 7.10: Milk Supply related Constraints faced by the PDCS & Private Dairy Units
No. Constraints Milk Supply related Constraints faced by (% to total responses)
PDCS (% to total responses) PDU (% to total responses)
Bankura Nadia South 24
Parganas
North 24
Parganas
Bankura Nadia South 24
Parganas
North 24
Parganas
1 High number of small producers
Never 25.0 0.0 0.0 25.0 - - - -
Sometime 0.0 12.5 0.0 0.0 - - - -
Always 0.0 12.5 25.0 0.0 - - - -
2 No or less provision for advance payment for milk by society or vendors
Never 0.0 0.0 0.0 0.0 - - - -
Sometime 0.0 12.5 0.0 0.0 - - - -
Always 25.0 12.5 25.0 25.0 - - - -
3 Unable to provide cattle feed and fodder seed on credit to members
Never 0.0 0.0 0.0 0.0 - - - -
Sometime 0.0 0.0 0.0 25.0 - - - -
Always 25.0 25.0 25.0 0.0 - - - -
4 Poor Quality milk
Never 0.0 0.0 0.0 0.0 - - - -
Sometime 25.0 25.0 25.0 0.0 - - - -
Always 0.0 0.0 0.0 25.0 - - - -
5 Irregular & inadequate supply of milk
Never 0.0 0.0 25.0 25.0 - - - -
Sometime 12.5 25.0 0.0 0.0 - - - -
Always 12.5 0.0 0.0 0.0 - - - -
6 Late delivery
Never 25.0 0.0 25.0 0.0 - - - -
Sometime 0.0 25.0 0.0 25.0 - - - -
Always 0.0 0.0 0.0 0.0 - - - -
7 Unavailability of emergency veterinary services
Never 25.0 0.0 0.0 0.0 - - - -
Sometime 0.0 25.0 12.5 25.0 - - - -
Always 0.0 0.0 12.5 0.0 - - - -
8 Infrequent visit of veterinary staff
Never 0.0 0.0 0.0 0.0 - - - -
Sometime 25.0 25.0 12.5 12.5 - - - -
Always 0.0 0.0 12.5 12.5 - - - -
9 Unavailability of vaccines
Never 25.0 25.0 25.0 0.0 - - - -
Sometime 0.0 0.0 0.0 12.5 - - - -
Always 0.0 0.0 0.0 12.5 - - - -
10 Occasional availability of semen at the AI centre
Never 25.0 25.0 25.0 25.0 - - - -
Sometime 0.0 0.0 0.0 0.0 - - - -
Always 0.0 0.0 0.0 0.0 - - - -
11 Unsuitability of the time of delivery of milk during winters due to bitter
cold in early hours of the day
Never 25.0 25.0 12.5 0.0 - - - -
Sometime 0.0 0.0 12.5 25.0 - - - -
Always 0.0 0.0 0.0 0.0 - - - -
12 Unavailability of green/ dry fodder throughout the year
Never 0.0 25.0 0.0 0.0 - - - -
Sometime 25.0 0.0 0.0 25.0 - - - -
Always 0.0 0.0 25.0 0.0 - - - -
13 Low average milk yield of the milk animals in area
Never 0.0 0.0 0.0 0.0 - - - -
Sometime 25.0 25.0 25.0 25.0 - - - -
Always 0.0 0.0 0.0 0.0 - - - -
14 Lack of cooperation and coordination among members
Never 25.0 25.0 0.0 0.0 - - - -
Sometime 0.0 0.0 25.0 25.0 - - - -
Always 0.0 0.0 0.0 0.0 - - - -
Source: Field Survey Data.
Note: There were no PDU in the districts under consideration.

125
Among the infrastructural constraints lack of training facilities and necessary space for diary
activities turned out to be major constraints (Table 7.11). In addition lack of improved
equipment and scarcity of decentralized chilling facilities sometimes posed hindrance to
activities of DCSs.
Table 7.11: Infrastructure related Constraints faced by the PDCS & Private Dairy Units
No. Constraints Infrastructure related Constraints faced by (% to total responses)
PDCS (% to total responses) PDU (% to total responses)
Bankura Nadia South 24
Parganas
North 24
Parganas
Bankura Nadia South 24
Parganas
North 24
Parganas
1 Unavailability of chilling facilities at village level for milk preservation.
Never 12.5 25.0 0.0 0.0 - - - -
Sometime 12.5 0.0 25.0 0.0 - - - -
Always 0.0 0.0 0.0 25.0 - - - -
2 Lack of improved equipment
Never 0.0 25.0 0.0 0.0 - - - -
Sometime 12.5 0.0 0.0 25.0 - - - -
Always 12.5 0.0 25.0 0.0 - - - -
3 Lack of necessary space required for dairy operation
Never 0.0 25.0 0.0 0.0 - - - -
Sometime 12.5 0.0 12.5 25.0 - - - -
Always 12.5 0.0 12.5 0.0 - - - -
4 Lack of training facilities
Never 0.0 25.0 0.0 0.0 - - - -
Sometime 12.5 0.0 0.0 25.0 - - - -
Always 12.5 0.0 25.0 0.0 - - - -
Source: Field Survey Data.
Note: There were no PDU in the districts under consideration.
Table 7.12: Market related Constraints faced by the PDCS & Private Dairy Units
No. Constraints Market related Constraints faced by (% to total responses)
PDCS (% to total responses) PDU (% to total responses)
Bankura Nadia South 24
Parganas
North 24
Parganas
Bankura Nadia South 24
Parganas
North 24
Parganas
1 Inability to market for value-added products
Never 0.0 0.0 0.0 0.0 - - - -
Sometime 0.0 0.0 0.0 0.0 - - - -
Always 25.0 25.0 25.0 25.0 - - - -
2 Competition from private dairy
Never 25.0 0.0 0.0 0.0 - - - -
Sometime 0.0 0.0 12.5 25.0 - - - -
Always 0.0 25.0 12.5 0.0 - - - -
3 Poor Road infrastructure
Never 0.0 25.0 0.0 0.0 - - - -
Sometime 12.5 0.0 0.0 25.0 - - - -
Always 12.5 0.0 25.0 0.0 - - - -
4 Unstable prices of milk
Never 12.5 0.0 0.0 0.0 - - - -
Sometime 12.5 25.0 25.0 25.0 - - - -
Always 0.0 0.0 0.0 0.0 - - - -
5 Competition from imported dairy product
Never 25.0 25.0 25.0 25.0 - - - -
Sometime 0.0 0.0 0.0 0.0 - - - -
Always 0.0 0.0 0.0 0.0 - - - -
Source: Field Survey Data.
Note: There were no PDU in the districts under consideration.

126
Market related constraints included DCS’s inability to market value added milk products in
all districts. In fact there was no provision at the DCS level to process milk and produce
value added products. The DCSs generally collected and chilled the milk in their chilling
plant located centrally and transport it to the milk unions. The DCSs of Nadia, North and
South Twenty Four Parganas faced competition from private dairy operating in the districts
(Table 7.12). The primary dairy cooperatives of Bankura and North Twenty Four Parganas
complained about occasionally poor roadway infrastructure. In South twenty Four Parganas
roadway communication had long been difficult. Instability of milk price was another
difficulty faced by DCSs.
7.11 Constraints faced by Milk Unions
There were, however, various issues as regards to functioning of the milk unions in the
districts. First and foremost was deficiency in skilled manpower of which all the milk unions
were suffering (Table 7.13). In Nadia skilled personnel in key positions like product
marketing and managerial work for DCS were priority. Almost all the milk unions suffered
from manpower shortage.
Technical constraints included unavailability of required inputs, technical knowhow and
instruments to detect adulterants in milk, state of the art technology for quick fat detection.
In view of poor electric supply in South Twenty Four Parganas, there was demand for bulk
milk cooler runby solar energy. North Twenty Four Parganas, however, did not report any
technical constraint.
As far as the governance issues were concerned, it was observed that some of the milk
unions were looking for autonomy and staff recruitment for smooth functioning and
monitoring of the MU and the DCSs. Formation of new Board of Directors was a necessity in
Nadia for good governance. In Bankura, the political intervention must have been posing
hindrance for effective operation of the MU.
Gradual increase in overhead expenditure coupled with decreasing quantum of milk
procurement had resulted in a severe financial crisis in the districts of Nadia and North
Twenty Four Parganas.
There were few valuable suggestions by the responsible administrative authorities of the
milk unions so as to enhance the dairy practices. In the face of increasing price level and

127
intervention of private players in the sector, remunerative and competitive price for milk
might be offered to motivate dairy farmers for production of quality milk. Processing plants
are of urgent importance for production of value added milk products. Increasing awareness
and imparting training as regards to milking own cow to the farmers was thought essential
to get rid of their dependency on milk vendors.
Table 7.13: Constraints faced by Milk Unions-West Bengal Sr.
No
Particulars Constraints faced by Milk Unions in West Bengal
1 Milk Union
(Name)
Bankura Nadia South 24 Parganas North 24 Parganas
2 Constraints faced
a Manpower
Constraints (eg.
Problems In
Recruiting Staff,
Etc.)
• There is acute
shortage of skilled
manpower.
• Fresh recruitment
is also a problem.
• Acute shortage of
manpower in key
positions like Product
marketing, DCS
Supervisory work and
Milk Procurement
etc.
• Formationof Board of
Directors is
necessary.
• Skilled personnel for running
the MU and DCSs are
required.
• New recruitments are
necessary.
• Insufficiency of
skilled manpower.
• Fresh recruitment
is not possible
due to financial
hardship.
b Technical
Constraints
• There is shortfall in
technical
assistance.
• Availability of
inputs remains a
constant problem.
• Technical assistance
with availability of
instruments for
detection of
adulterants (like
whey water, veg. oil)
in milk on spot is
highly needed during
milk collection at
reception centre
• Bulk milk cooler with solar
panel are required for the
district where the electricity
connectivity and supply is
poor.
• Fat detection technique
being used presently takes
time. Updated technology
for detection of fat is
required.
• For ensuring the cold chain
for milk supply non-
conventional sources of
energy (e.g. solar panel)
might be an alternative.
• No problem as
regards to
availability and
supply of inputs.
c Governance
Issues
• Autonomy may be
given to decide
producers’ and
consumers’ price
for milk.
• Autonomy in
recruitment and
transfer of staff is
required for
smooth
functioning.
• Political
interference poses
hindrance in
functioning of the
MU.
• The Milk Union is
managed by its bye-
laws, WBCS Act &
Rules. Formation &
functioning of Board
of Directors as per
bye-laws of the Milk
Union is essential for
good governance.
• As many areas of this district
is very remote and is difficult
to commute, day to day
monitoring becomes a little
difficult in view of scarcity of
personnel.
• Payment for milk
procurement must be
computerized with the
central server at MU office
so that the books of
accounts could be
maintained properly.
• The Milk Union
functions as per
rules of West
Bengal
Cooperative
Society Act &
Rules.
• The Union
operates under
the technical and
administrative
guidance of West
Bengal Milk
Federation and
NDDB.
d Financial
Constraints
• There is no
financial constraint.
• Gradual
enhancement of
overhead
expenditure,
decreasing quantum
of milk procurement
and low milk price
retention are the
major financial
constraints.
• Acute financial
• At present there is little
financial hardship.
• With decrease in
the quantity of
milk procurement
the Union is faced
with severe
financial hardship.

128
stringency is posing
hindrance in day to
day functioning.
3 Any Other
suggestion
- • The MU is facing an
uneven competition
in milk procurement
in the face of higher
milk price offered by
private units
irrespective of the
quality of milk.
• Competitive milk
price is needed to
ensure the quality &
quantity of milk
supplied by the
farmers and
motivating them to
join DCS.
• Increasing awareness
and imparting
training as regards to
milking own cow to
the farmers is
essential to get rid of
their dependency on
milk vendors.
• Farmers are to be motivated
for improving the quality of
milk through remunerative
price.
• Value added dairy products
should be produced with
establishment of processing
plant.
• Farmers are to be motivated
to insure the cattle.
-
4 Potential For
Future
- • Extension of input
distribution and
transfer of modern
technology through
DCS would add
impetus to better
entrepreneurship.
• Creation of extensive
infrastructure for
milk reception
centres through DCS
would help the
farmers to cope with
exploitation by the
middlemen.
• Extension of plants
for milk processing
and manufacturing
value added milk
products might be
helpful in offering
better price for liquid
milk to the farmers.
• Improvement of roadway
infrastructure to Kolkata can
open up new marketing
avenues.
-
Source: As reported by the Managing Directors of the Milk Unions.
7.11 Chapter Summary
Constraint faced by Producers
As regards to delivery of cattle feed from the DCS and private agents it was found
inadequate. Most of the households could purchase cattle feed on credit from private
agents only. There was no provision of credit from the dairy cooperatives. Cattle feed and
mineral mixtures, when purchased from open market or private agents had been much
costlier than that been supplied by the cooperatives.

129
Emergency veterinary service in general was made available by the private agents in all the
villages though charges for such had been high. Vaccines too, been supplied by the private
agents, were inadequate in supply and poor in quality. Semen had also been insufficient in
supply.
All the milk producers found the milk procurement price to be low whether being disposed
with cooperatives or private vendors. However, the regularity of payment differed between
the societies and vendors. There had been no incentive bonus and advance payment to the
producers either by cooperative societies or the private agents for supplying milk.
As of infrastructure, it was found that the households mainly suffered from lack of improved
equipment and training facilities, irregularity of supply of cattle feed, vaccines, semen at AI
centre and infrequent visit of veterinary staff.
High cost of feed and mineral mixture, veterinary medicines emergency veterinary services
added with low price of milk are major economic hurdles.
The households in general seemed unaware about marketing strategies of their own. Lack
of time for marketing or risk taking behavior had been none of their concern.
Both DCS and NDCS households were complaining against poor conception rate through AI,
poor knowledge about proper feeding and health care and cheap and scientific housing for
animals.
Main constraints for DCS and NDCS farmers turned out to be lack of purchasing power
resulting out of lower socio-economic conditions.
Among other constraints lack of awareness about quality milk production, lack of finance for
investment, lack of veterinary services and proper medicines and equipment, knowledge
about mastitis and lack of poor milk testing facilities were found important.
As suggested by the farmers there were urgent need to improve the service delivery along
with reducing the cost of medical and veterinary services including AI. Moreover, regular
and timely availability of these services should be ensured. Farmers felt that provisions
could be extended to impart scientific and technical knowhow to them.

130
Constraints faced by DCS
All the DCS were of the opinion that the average milk yield in the respective areas was
sometimes low. Unavailability of emergency veterinary services and infrequent visit by
veterinary staff had been a serious obstacle in Nadia, North and South Twenty Four
Parganas. Large number of small producers in Nadia and South Twenty Four Parganas posed
serious problem of monitoring and follow-up activities by the DCSs.
Among the infrastructural constraints lack of training facilities and necessary space for diary
activities turned out to be major constraints.
Market related constraints included DCS’s inability to market value added milk products in
all districts. In fact there was no provision at the DCS level to process milk and produce
value added products.
Constraints faced by MU
There was deficiency in skilled manpower of which all the milk unions were suffering.
Technical constraints included unavailability of required inputs, technical knowhow and
instruments to detect adulterants in milk, state of the art technology for quick fat detection.
As far as the governance issues were concerned, it was observed that some of the milk
unions were looking for autonomy and staff recruitment for smooth functioning and
monitoring of the MU and the DCSs. Formation of new Board of Directors and reduction in
political intervention was also necessary.
Gradual increase in overhead expenditure coupled with decreasing quantum of milk
procurement had resulted in a severe financial crisis in the districts of Nadia and North
Twenty Four Parganas.
Suggestions
In the face of increasing price level and intervention of private players in the sector,
remunerative and competitive price for milk might be offered to motivate dairy farmers for
production of quality milk. Processing plants are of urgent importance for production of
value added milk products. Increasing awareness and imparting training is also a necessity.

131
Chapter VIII
Conclusions and Recommendations
8.1 Conclusions
On the basis of the discussions made in the preceding chapters we come to the conclusions
that
• The State and Central Government policy has been providing necessary support for
dairy development in the state of West Bengal through co-operative sector.
• However, as against the estimated animals’ requirements, feed resources available
in West Bengal are lower.
• In West Bengal, however, there exists high incidence of non-descript cows in
comparison with the crossbred varieties.
• In terms of socio-economic parameters villages of four districts (both DCS and NDCS
villages) reveal more or less similar pattern. Families were mostly farming families
pursuing cultivation as their principal occupation. Most of the households took up
dairy enterprise as their subsidiary source of income. In the villages dairy enterprise
was being run solely by family labour. It is noteworthy to mention participation of
women family members remained crucial for such operation.
• Poor state of awareness about various dairy developments schemes were observed
among the NDCS households. For the DCS farmers knowledge had been imparted by
the milk cooperatives and milk unions functioning in the area. For the NDCS farmers,
however, source of their awareness had been fellow farmers and neighbours. A
dismal scenario was observed as regards to insurance coverage for the cattle in all
the villages regardless of DCS or NDCS.
• It is observed that labour cost has been the main component of total cost in all
cases. There might be over optimal use of family labour.
• The milk cooperatives, though operating in every district, were too small in number
to wrap the large number of small milk producers in respective areas. Moreover,
their procurement capacity had been rather small as compared to the supply of
liquid milk. And these cooperatives were faced with competition from the

132
enumerable private intermediaries who collected the milk from producer’s door
steps.
• Service delivery of cattle feed and fodder was found inadequate. Moreover, there
was no provision of credit from the dairy cooperatives. Cattle feed and mineral
mixtures, when purchased from open market or private agents had been much
costlier.
• Procurement price of milk had been non-remunerative for the farmers whether
purchased by cooperatives or private vendors.
• As of infrastructure, the households suffered from lack of improved equipment,
training facilities, irregularity of supply of cattle feed, vaccines, semen at AI centre
and infrequent visit of veterinary staff. Charges for emergency veterinary service
provided by private agents had been high.
• Lack of awareness about quality milk production and lack of finance for investment
had been important problems.
• All the DCS were of the opinion that the average milk yield in the respective areas
was sometimes low. Unavailability of emergency veterinary services and infrequent
visit by veterinary staff had been a serious obstacle. Large number of small
producers also posed serious problem of monitoring and follow-up activities by the
DCSs.
• There was severe deficiency in skilled manpower of which all the milk unions were
suffering. Technical constraints included unavailability of required inputs, technical
knowhow and instruments to detect adulterants in milk, state of the art technology
for quick fat detection. As far as the governance issues were concerned, it was
observed that some of the milk unions were looking for autonomy and staff
recruitment for smooth functioning and monitoring of the MU and the DCSs. Gradual
decrease in quantum of milk procurement has posed serious threat.
• Over and above all, there exists deficiency in secondary information as regards to
dairy sector development in villages, districts and the state in West Bengal.

133
8.2 Suggestions
• Innumerable small dairy farms are to be fastened in some sort of milk chain by the
cooperative societies. So, there is urgent need to enhance the number of PDCS in
each district to reduce the exploitation by private vendors.
• The infrastructure for milk procurement and transportation should be improved at
the DCS level.
• Enhanced operation of DCS offering remunerative price to farmers can motivate
them in joining the society and at the same time this partnership would be able to
make a dent in farmers’ economic hardship.
• Service delivery of feed and fodder to be enhanced. Provision for vaccinations and
emergency veterinary services including AI needed to be boosted. In this aspect DCSs
working at the village level could play an important role.
• Re-orientation and proper implementation of government policies for dairy
development at the grassroots must be taken care of. And in view of such re-
orientation more autonomy and funds are to be provided to DCS.
• For increasing awareness regarding scientific dairy farming new training programmes
need to be arranged especially for the women. These might be able serve twin
purposes of imparting improved consciousness among women regarding dairy
farming and might as well be supportive for women empowerment in the village
society. Department of Animal Husbandry of the State Government along with the
milk unions could take up such programmes.
• It remained essential that the farmers be motivated to insure their cattle for it
minimized the risk. Procedural changes, if necessary, can be thought of so that the
farmers can avail these benefits. Outreach of the facility needs to be provided at the
village level. For DCS membership insuring cattle might be made a mandatory
criterion.
• The DCSs were of opinion that there had been fluctuations in milk yield across
seasons. Proper and scientific dairy practices backed by better awareness supported
by government veterinary and DCS staff might be able to bring about a change in
such paucity.

134
• The milk unions be provided with skilled manpower for proper implementation and
monitoring of the operations of DCS. More autonomy in MUs’ functioning might be
necessary and political intervention must be restricted.
• Establishing milk processing plants in the districts are of urgent importance for
production of value added milk products that would ensure higher return.
• Offering remunerative price for milk is a decision that depends on the policy of the
government. In face of rising cost a hike in procurement price may be thought of
which in turn would motivate and improve economic conditions of the farmers.
• As such there are ample central and state sector schemes for development of animal
husbandry in general and dairy expansion in particular. Convergences of many of
such schemes were found in the survey area of this present study. But the scope and
coverage seemed somewhat restrictive. Policy re-orientation might be sought for
rejuvenating the dairy sector in the villages of West Bengal.

135
References
Bhattacharya D. (1976). India’s Five Year Plan : An Economic Analysis, Progressive
Publishers, Calcutta, 1976,P.46
Birthal, Pratap S. (2016). Innovations in Marketing of Livestock Products in India, Indian
Journal of Agricultural Marketing, Vol. 30, No. 3, September – December, pp.88-
107.
Birthal, Pratap S. and Digvijay S. Negi (2012). Livestock for Higher, Sustainable and Inclusive
Agricultural Growth, Economic and Political Weekly, Vol. XLVII, Nos. 26 & 27, pp.
89-99.
GOI (1984).Report of working group on Animal Husbandry Conference, Calcutta, 1984.
GOI (2010). Basic animal husbandry statistics, Dept. of Animal Husbandry, Dairying and
Fisheries, Govt. of India (2010)
GOI (2011).Census of India 2011, Office of the Registrar General and Census Commissioner,
India.
GOI (2012a). Economic Survey, Ministry of Finance, Govt. of India (2011-12)
GOI (2012b). Report of the Working Group on Animal Husbandry and Dairying 12th Five
Year Plan (2012-17), Planning Commission, Government of India, New Delhi.
GOI (2013). Statewise Estimates of Value of Output from Agriculture and Allied Activities
with New Base Year 2004-2005, CSO, MOSPI, Government of India.
GOI (2014).Basic Animal Husbandry & Fisheries Statistics, AHS Series-15,Department of
Animal Husbandry, Dairying and Fisheries , Ministry of Agriculture, Krishi Bhawan,
New Delhi.
GOI (2014). Key Indicators of land and livestock holdings in India, National Sample Survey
Office, Ministry of Statistics and Programme Implementation, Delhi.
GOI (2015). Basic Animal Husbandry & Fisheries Statistics-2016, Department of Animal
Husbandry, Dairying & Fisheries, Ministry of Agriculture, Government of India.
GOI (2016a). Statewise Estimates of Value of Output from Agriculture and Allied Activities
with New Base Year 2011-2012, CSO, MOSPI, Government of Indai (2016).
GOI (2016b). Basic Animal Husbandry & Fisheries Statistics-2016, Department of Animal
Husbandry, Dairying & Fisheries, Ministry of Agriculture, Government of India.
GOI (2016c). Integrated Sample Survey, Basic Animal Husbandry and Fisheries Statistics,
2016, Department of Animal Husbandry, Ministry of Agriculture and Farmers
Welfare, Government of India
GOWB (2000). Statistical Abstract, Bureau of Applied Economics and Statistics, Government
of West Bengal
GOWB (2004). Statistical Abstract, Bureau of Applied Economics and Statistics, Government
of West Bengal
GOWB (2011). Annual Administrative Report-2010-11, Animal Resources Development
Department, Government of West Bengal

136
GOWB (2013). Statistical Abstract, Bureau of Applied Economics and Statistics, Government
of West Bengal
GOWB (2014a). Statistical Abstract, Bureau of Applied Economics and Statistics,
Government of West Bengal
GOWB (2014b). Annual Administrative Report-2013-14, Animal Resource Development
Department, Government of West Bengal
Gupta, H.C. (2011). Dairying in India, Bombay: ASIA Publishing House, p.125.
Kalamkar, S. S.; H. Sharma and M. Makwana (2017). Assessment of the Status of Dairying
and Potential to Improve Socio-Economic Status of the Milk Producers and
Convergence of all Central & State Schemes at District level in Gujarat, AERC Report
No. 168, Agro-Economic Research Centre, Sardar Patel University, Vallabh
Vidyanagar, Anand, Gujarat.
Khurody, D.N. (1974). Dairying in India, Bombay: ASIA Publishing House, p.105.
Kishore, Avinash; Pratap S. Birthal; P. K. Joshi; Tushaar Shah and Abhishek Saini (2016).
Patterns and Drivers of Dairy Development in India: Insights from Analysis of
Households and District-level Data, Agricultural Economics Research Review, Vol.
29 (No. 1), January-June 2016, pp. 1-14.
Meena, G. L. and D. K. Jain (2012). Economics of Milk Production in Alwar District
(Rajasthan): A Comparative Analysis, International Journal of Scientific and
Research Publications,2(8): 1-5.
Mishra, Prachi and Devesh Roy (2011).Explaining Inflation in India: The Role of Food Prices,
(Mime), International Monetary Fund, Washington, D.C.
NAAS (2003).“Export Potential of Dairy Products, Policy Paper 23, National Academy of
Agricultural Sciences, India, December.
NABARD (1999). Annual Report, National Bank for Agriculture and Rural Development,
Mumbai
NDDB (2011).Annual Report– 2010-11, New Delhi.
NDDB (2014). Compendium of Documents on Dairy development and Animal Husbandry
Schemes being implemented by different departments of Government of India,
NDDB, August 2004, Mimeo.
NDDB (2017). Dairying in West Bengal, A Statistical Profile 2017, Salt Lake, Kolkata.
NSSO (1987).Estimates of livestock and Agricultural Implements Classified by Household
Operational Holding, 37th Rounds, Report No.338, National Sample Survey Office,
Ministry of Statistics and Programme Implementation, GOI.
NSSO (1997). Livestock & Agricultural Implements in Household operational holdings, 1991-
92, 48th Rounds, Report No. 408, National Sample Survey Office, Ministry of
Statistics and Programme Implementation, GOI.
NSSO (2006). Livestock ownership across operational land holding classes in India, 2002-03,
59th Rounds, Report No. 493, National Sample Survey Office, Ministry of Statistics
and Programme Implementation, GOI.

137
Rajendran, K. and Samarendu Mohanty (2004). Dairy Cooperatives and Milk Marketing in
India: Constraints and Opportunities, Journal of Food Distribution Research, Vol. 35,
No. 2, July, pp.34-41.
Rajeshwaran, S. & Gopal Naik (2016). Milk production in India rises by a historic 6.25% in
2014-15: A boon or a bane?, IIMB-WP N0. 518
Randolph T.F. , Schelling E., Grace D., Nocholson C F, Leroy J K, Cole D C, Demment M W,
Omore A, Zinsstag J, Rule M (2007). Role of Livestock in human Nutrition and
Health for Poverty Reduction in Developing Countries, Journal of Animal Sciences,
Vo. 85, pp. 2788-2800.
Sarkar, Debnarayan and Bikash Kumar Ghosh (2010). Constraints of Milk Production: A
Study on Cooperative and Non-cooperative Dairy Farmers in West Bengal,
Agricultural Economics Research Review, Vol. 23, July December 2010, pp. 303-314.
Saxena, R. Et al (2002), “Life Cycle Assessment of Milk Production in India”, Int J LCA, Vol.7
(3), Pp. 1- 89.
Sharma, Vijay Paul (2004). Livestock Economy of India: Current Status, Emerging Issues and
Long Term Prospects, Keynote Paper, Indian Journal of Agricultural Economics, Vol.
59, No. 3, p. 512-554 July-September 2004.
Shiyani, R.L. (1996). An Economic Inquiry into the Impact of Dairy Cooperatives on Milk
Production, Indian Journal of Agricultural Economics, Vol. 51, no. 3, July-
September, pp. 396 –406.
Singh, K. M. And M. S. Meena (2012). Livestock Value Chains: Prospects, Challenges and
Policy Implications, in Eds: B. P. Bhatt, A. K. Sikka, Joydeep Mukherjee, Adlul Islam,
A. Dey, Status of Agricultural Development in Eastern India, pp. 493-508.
Websites visited:
http://dahd.nic.in
http://dahd.nic.in/sites/default/files/BAHS-2016%20Updated%20on%2016.08.16.pdf.
http://dahd.nic.in/dahd/division/cattle-and-dairy-
development.aspxhttp://www.fao.org/wairdocs/lead/x6170e/x6170e2z.htm
http://data.gov.in/keywords/capita-availability
http://www.nddb.org/sites/default/files/pdfs/guidelines/PIP-Vol-VGuidelines-on-RBP-
FD.pdf

138
Annexure I Comments on draft report
Assessment of the status of Dairying and Potential to improve
Socio-Economic Status of the Milk Producers and Convergence of all Central & State Schemes at District Level in West Bengal
Comments received from the Coordinating Centre
Agro-Economic Research Centre
For the states of Gujarat and Rajasthan
(Ministry of Agriculture & Farmers Welfare, Govt. of India) Sardar Patel University, Vallabh Vidyanagar, Dist. Anand, Gujarat
1. Title of report Assessment of the status of Dairying and Potential
to improve Socio-Economic Status of the Milk Producers in West Bengal
2. Date of receipt of the Draft report
28/08/2017
3. Date of dispatch of the comments
29/09/2017
4. Comments on the Objectives of the study
Objectives of the study have been satisfied.
5. Comments on the methodology
As suggested, proper sampling and methodology have been used.
6. Comments on analysis,
organization, presentation etc.
Detailed analysis is undertaken and organized as suggested. Add Executive Summary.
7. References: Source of data is mentioned
8. General remarks: The study is a comprehensive study on dairy sector in West Bengal and suggested appropriate and feasible policy measures.
9. Overall view on acceptability of report: The report is acceptable after
incorporation of executive summary as mentioned above.

139
Annexure II
Action Taken based on Comments on draft report
Assessment of the status of Dairying and Potential to improve Socio-Economic Status of the Milk Producers in West Bengal
1. Title of report Necessary changes in the title have been incorporated.
2. Date of receipt of the comments
29/09/2017
3. Date of dispatch of the final report
21/10/2017
4. Comments on the Objectives of the study
No changes were suggested.
5. Comments on the methodology
No changes were suggested.
6. Comments on
analysis, organization, presentation etc.
Executive Summary has been incorporated.
7. References: No changes were suggested.
8. General remarks: No changes were suggested.
9. Acceptability of report: As proposed the Executive
Summary has been added and the final report is being submitted.
Authors