
Assessment of the Nurse Medication Administration Workflow ...
14
Research Article Assessment of the Nurse Medication Administration Workflow Process Nathan Huynh, 1 Rita Snyder, 2 José M. Vidal, 3 Omor Sharif, 1 Bo Cai, 4 Bridgette Parsons, 3 and Kevin Bennett 5 1 Civil & Environmental Engineering, University of South Carolina, Columbia, SC 29208, USA 2 College of Nursing, University of Arizona, Tucson, AZ 85721, USA 3 Computer Science and Engineering, University of South Carolina, Columbia, SC 29208, USA 4 Epidemiology and Biostatistics, University of South Carolina, Columbia, SC 29208, USA 5 School of Medicine, University of South Carolina, Columbia, SC 29208, USA Correspondence should be addressed to Nathan Huynh; [email protected] Received 29 February 2016; Accepted 15 June 2016 Academic Editor: Feng-Huei Lin Copyright © 2016 Nathan Huynh et al. is is an open access article distributed under the Creative Commons Attribution License, which permits unrestricted use, distribution, and reproduction in any medium, provided the original work is properly cited. is paper presents findings of an observational study of the Registered Nurse (RN) Medication Administration Process (MAP) conducted on two comparable medical units in a large urban tertiary care medical center in Columbia, South Carolina. A total of 305 individual MAP observations were recorded over a 6-week period with an average of 5 MAP observations per RN participant for both clinical units. A key MAP variation was identified in terms of unbundled versus bundled MAP performance. In the unbundled workflow, an RN engages in the MAP by performing only MAP tasks during a care episode. In the bundled workflow, an RN completes medication administration along with other patient care responsibilities during the care episode. Using a discrete-event simulation model, this paper addresses the difference between unbundled and bundled workflow and their effects on simulated redesign interventions. 1. Introduction In recent years, concern about the impact of health care system interventions on clinical workflow processes has escalated primarily due to the implementation of electronic health records and computerized provider order entry sys- tems [1–4]. e impact and unintended consequences of these system redesign interventions have underscored the lack of knowledge about high-risk clinical processes and the concomitant patient safety risks associated with system redesign that may destabilize these processes in dynamic care delivery environments [1]. Evidence about clinical workflow processes is quite limited. eir dynamic nature and the complexity of healthcare environments within which they occur make them difficult to assess with current observation methods and tools. ere is a critical need for innovative methods and technologies that support a low-risk envi- ronment in which to visualize, examine, and manipulate high-risk clinical processes to assess the potential impact of redesign interventions on multilevel systems, clinician, and patient outcomes [5, 6]. Medication errors remain a serious health care problem in the United States which result in approximately 7,000 deaths, cause harm to approximately 1.5 million people, and cost billions of dollars in hospital treatment annually [7– 11]. Leape et al.’s [12] early research into medication errors highlighted the need to examine system factors associated with medication errors. is research used a systems analysis approach to examine all phases of the medication process, that is, physician ordering, transcription/verification, phar- macy dispensing, and nurse administration, to determine types of medication errors by stage of drug ordering and delivery. Findings indicated that, of the identified medication errors ( = 334), nurse medication administration errors (38%) were the second largest category of medication errors following physician medication order errors (39%) [12]. e Hindawi Publishing Corporation Journal of Healthcare Engineering Volume 2016, Article ID 6823185, 14 pages http://dx.doi.org/10.1155/2016/6823185
Transcript of Assessment of the Nurse Medication Administration Workflow ...

Research ArticleAssessment of the Nurse Medication AdministrationWorkflow Process
Nathan Huynh,1 Rita Snyder,2 José M. Vidal,3 Omor Sharif,1 Bo Cai,4
Bridgette Parsons,3 and Kevin Bennett5
1Civil & Environmental Engineering, University of South Carolina, Columbia, SC 29208, USA2College of Nursing, University of Arizona, Tucson, AZ 85721, USA3Computer Science and Engineering, University of South Carolina, Columbia, SC 29208, USA4Epidemiology and Biostatistics, University of South Carolina, Columbia, SC 29208, USA5School of Medicine, University of South Carolina, Columbia, SC 29208, USA
Correspondence should be addressed to Nathan Huynh; [email protected]
Received 29 February 2016; Accepted 15 June 2016
Academic Editor: Feng-Huei Lin
Copyright © 2016 Nathan Huynh et al.This is an open access article distributed under the Creative Commons Attribution License,which permits unrestricted use, distribution, and reproduction in any medium, provided the original work is properly cited.
This paper presents findings of an observational study of the Registered Nurse (RN) Medication Administration Process (MAP)conducted on two comparablemedical units in a large urban tertiary caremedical center inColumbia, SouthCarolina. A total of 305individual MAP observations were recorded over a 6-week period with an average of 5 MAP observations per RN participant forboth clinical units. A keyMAP variation was identified in terms of unbundled versus bundledMAP performance. In the unbundledworkflow, an RN engages in the MAP by performing only MAP tasks during a care episode. In the bundled workflow, an RNcompletes medication administration along with other patient care responsibilities during the care episode. Using a discrete-eventsimulation model, this paper addresses the difference between unbundled and bundled workflow and their effects on simulatedredesign interventions.
1. Introduction
In recent years, concern about the impact of health caresystem interventions on clinical workflow processes hasescalated primarily due to the implementation of electronichealth records and computerized provider order entry sys-tems [1–4]. The impact and unintended consequences ofthese system redesign interventions have underscored thelack of knowledge about high-risk clinical processes andthe concomitant patient safety risks associated with systemredesign that may destabilize these processes in dynamic caredelivery environments [1]. Evidence about clinical workflowprocesses is quite limited. Their dynamic nature and thecomplexity of healthcare environments within which theyoccur make them difficult to assess with current observationmethods and tools. There is a critical need for innovativemethods and technologies that support a low-risk envi-ronment in which to visualize, examine, and manipulate
high-risk clinical processes to assess the potential impact ofredesign interventions on multilevel systems, clinician, andpatient outcomes [5, 6].
Medication errors remain a serious health care problemin the United States which result in approximately 7,000deaths, cause harm to approximately 1.5 million people, andcost billions of dollars in hospital treatment annually [7–11]. Leape et al.’s [12] early research into medication errorshighlighted the need to examine system factors associatedwith medication errors.This research used a systems analysisapproach to examine all phases of the medication process,that is, physician ordering, transcription/verification, phar-macy dispensing, and nurse administration, to determinetypes of medication errors by stage of drug ordering anddelivery. Findings indicated that, of the identifiedmedicationerrors (𝑛 = 334), nurse medication administration errors(38%) were the second largest category of medication errorsfollowing physician medication order errors (39%) [12]. The
Hindawi Publishing CorporationJournal of Healthcare EngineeringVolume 2016, Article ID 6823185, 14 pageshttp://dx.doi.org/10.1155/2016/6823185

2 Journal of Healthcare Engineering
MAP is, predominantly, a nursing responsibility that has beenestimated to consume approximately 40% of nursing practicetime [13]. Since Leape et al.’s [12] early research onmedicationerrors, the MAP has become increasingly complex dueto escalating patient acuity, numerous generic and trademedication names, expanded medication delivery routes,increased use of new and diverse medication safety technolo-gies, and an increased number of medication orders [13, 14].The lack of standardization of theMAP is also a key contribut-ing factor in medication administration complexity [13].
Typically, the MAP involves a Registered Nurse (RN)performing many tasks, including, but not limited to, (1)assessing the patient to obtain pertinent data, (2) gatheringmedications, (3) confirming the six rights (i.e., right dose,patient, route, medication, time, and documentation), (4)administering the medications, (5) documenting adminis-tration, and (6) observing for therapeutic and untowardeffects [15]. Clinical observation has confirmed a significantdegree of nurse-to-nurse variability in MAP tasks and tasksequencing that is subject to environmental interruptionsthat result inmedication administration practices that deviatefrom standard practice protocols. Empirical evidence, how-ever, is lacking about MAP characteristics and the natureof RN and environmental characteristics and interruptionsthat influence it. This makes it very difficult to anticipatethe impact of system redesign interventions undertakento enhance medication safety, for example, introduction ofmedication safety technology and the potential consequencesof redesign interventions. To this end, this study identifiedMAP workflow characteristics and developed a computersimulation model based on these characteristics to assessthe impact of simulated MAP redesign interventions onselected MAP redesign outcomes. It builds on our previouswork where we developed a mobile application for recordinglive MAP observations [16] and a discrete-event simulationmodel of the MAP [17].
2. Methods
2.1. Setting. The study was undertaken in a tertiary medicalcenter in Columbia, South Carolina, United States. Themedical center is a 414-bed modern complex that anchorsa comprehensive network of 600-plus affiliated physicians,including six strategically located community medical andurgent care centers, an occupational health center, the largestextended care facility in the Carolinas, and an Alzheimer’sCare Center. The medical center also supports an array ofhealth and wellness classes. The hospital employs more than5,200 people and offers a variety of community outreach pro-grams and education and health screenings. A high surgicalvolume is supported with 29 state-of-the-art operating roomsthat have cutting edge, state-of-the-art medical technologyand procedures. Patient safety and security are top concernsand health care team work is stressed. Identification bands,proper cough etiquette, frequent hand-washing, protectivewear, and public safety officers are integral parts of themedical center’s commitment to patient safety and security.
The study was conducted on two comparable medi-cal units that served adult patients with medical, surgical,
neurological, oncology, orthopedic, and renal conditions.Patients were typically admitted for chronic care manage-ment, diagnostic studies, and medical interventions. Theunits were comparable in terms of size (range = 30–36 beds),average daily census (range = 26–31 patients), patient lengthof stay (range = 6.5–7 days), and number of RNs (range = 25–29 full-time equivalent), as well as numbers and types of tech-nical and secretarial support staff. The term “average” refersto arithmetic mean hereafter. Both clinical units comprisedsingle bed rooms along 4 hallways. Each patient room had anindividual bathroom, an inside supply cabinet, and a lockedmedication cabinet. A wall-mounted locked documentationstation with a drop-down writing platform was locatedoutside each patient room. A nurses’ station was centrallylocated with an adjacent dumbwaiter and various separaterooms, for example, medications, clean/soiled equipment,supplies, breaks, family consultation, and a manager office.An integrated electronic health record (EHR) was usedon each unit for all documentation, including medicationadministration andmanagement. Two rolling computer cartswere available on each hallway and RNs used them duringwalking rounds to receive change-of-shift report, and todocument all care, including medication administration.More acutely ill patients were routinely assigned to roomscloser to the nurses’ station.
2.2. Sample. Since medication administration is predomi-nantly a responsibility of RNs, the study sample comprisedRNs. The study did not involve patients and no patientinformation was collected during the course of the study. Fol-lowing protocol approvals fromuniversity andmedical centerInstitutional Review Boards, RN volunteers were recruitedfrom full-time RN populations for each study unit. All full-time RNs from Unit 1 (𝑁 = 16) and Unit 2 (𝑁 = 20) wereinvited to participate. Study recruitment information wasdistributed at unit staffmeetings by unitmanagers and duringunit recruitment visits by the study Principal Investigator(PI). Registered Nurses interested in volunteering for thestudy met with the PI in a unit conference room where thePI explained the study prior to them signing a consent formand completing a demographic information form. A total of17 RNs participated in the study with 7 from Unit 1 (44%)and 10 from Unit 2 (50%). Demographic findings indicatedthat RN characteristics were comparable across the two units.Combined findings for all 17 RN volunteers indicated thatthe majority were white [𝑛 = 15 (88%)] women [𝑛 = 16(94%)] who had been licensed as an RN an average of 11years, had practiced as an RN an average of 10 years, and hadworked at the medical center an average of 6 years with 60%or more of that time spent on their study unit. The majorityof RNs reported that they had a totally supportivemedicationsafety culture [𝑛 = 11 (65%)] on their unit and that they felttotally comfortable [𝑛 = 10 (59%)] with reportingmedicationsafety practice variations. Most RNs also indicated that theythought about medication safety frequently [𝑛 = 15 (88%)]and that the quality of the medication safety process on theirunit was extremely high [𝑛 = 9 (53%)]. Medication safetytechnology, such as smart intravenous infusion pumps, wasreadily available [𝑛 = 13 (76%)] on the units, and themajority

Journal of Healthcare Engineering 3
Figure 1: Screenshot of iMedTracker.
of the RNs used it frequently [𝑛 = 16 (94%)]. The majority ofRNs had also completed 1 self-paced computer instructionalprogram [𝑛 = 15 (88%)] on medication safety, with 7 (41%)completing this within one month prior to the study. Themajority of RNs reported that they were very likely [𝑛 = 11(65%)] to be interrupted while engaged in the medicationadministration process. Their self-reports, however, did notprovide any specific interruption types or patterns.
2.3. MAP Observation Data Collection
2.3.1. MAP Observation Recording Tool. To record RN medi-cation administration functions, tasks, and interruptions ina live clinical environment and to generate baseline datafor the development of our computer simulation model, theresearch team developed the “iMedTracker” mobile appli-cation; it is an extension of the application we developedin our previous study [16]. The iMedTracker is a web-basedapplication developed using the jQuery Mobile framework(http://jquerymobile.com/). The team chose to develop aweb-based application instead of a native application becauseit would allow the application to run on any smartphone ortablet. The iMedTracker represents one of the first mobileapplications designed specifically to record MAP workflowsand one that can run on multiple mobile devices. Figure 1provides a screenshot of the iMedTracker application runningon a Nexus 10.
The first menu item of iMedTracker is the MAP function.Observers can change the function by tapping on the item.When the item is pressed, a drop-down list is displayed forusers to choose from. The list of choices include “preparemedication” and “administer medication.”There is a separatelist of tasks associated with each function, and they changeaccording to the function selected. To facilitate the recordingprocess, themedication documentation tasks are listed underthe administer medication function.
The threemenu items to the right of “preparemedication”allow observers to record the location of the activity (e.g.,patient’s room, medication room, and kitchen), patient’sroomnumber, if applicable, and the clinical unit number (e.g.,6th and 7th). As their names imply, the “Undo” menu itemundoes the last recorded activity, and the “Erase Log” menu
item erases the stored data. The last menu item “Settings”takes observers to another screen where they can input theirname, input the code (instead of name) of the RN beingshadowed, and e-mail the data to project investigators. Nopatient data are recorded.
On the iMedTracker, the left column lists the tasks,and the right column lists the interruptions. When a taskor interruption is selected, the application automaticallycaptures its start time and writes the record to the database.The application indicates that the activity is in operation byhighlighting that item, as illustrated by the “clean hands”task in Figure 1. To record the end of an activity, observerswould press on that item and the application would automat-ically capture the activity’s end time. If a mistake is made,observers can tap on the Undo button to cancel the lastaction.
2.3.2. MAP Observation Data Collection Protocol. The MAPobservational data collection protocol was field tested inthis study using expanded methods and developed in ourprevious studies [16, 17]. Several steps were taken to ensuredata recording consistency including (1) observer training inthe use of the mobile device and iMedTracker application;(2) creation of common observation rules and data collectionprocedures; and (3) assessment of observer interrater reliabil-ity (IRR).
Three student observers participated in two 4-hour class-room training sessions that included (1) an introduction tothe iMedTracker application, (2) group recording practiceusing iMedTracker and sample MAP videotapes from aprevious study, and (3) four independent recording sessionsusing iMedTracker and sample MAP videotapes. Indepen-dent observer recordings were compared and discussed bythe group to assess recording variations. Following classroomtraining, observers participated in a one-week orientationto the two study units. During this week, observers usediMedTracker to record live MAP observations for three datacollection sessions and participate in debriefing conferenceswith study investigators at the conclusion of each session.Debriefing feedback was used to establish observation rulesto enhance observer recording consistency and clarify datacollection procedures (Table 1).
4 Journal of Healthcare Engineering
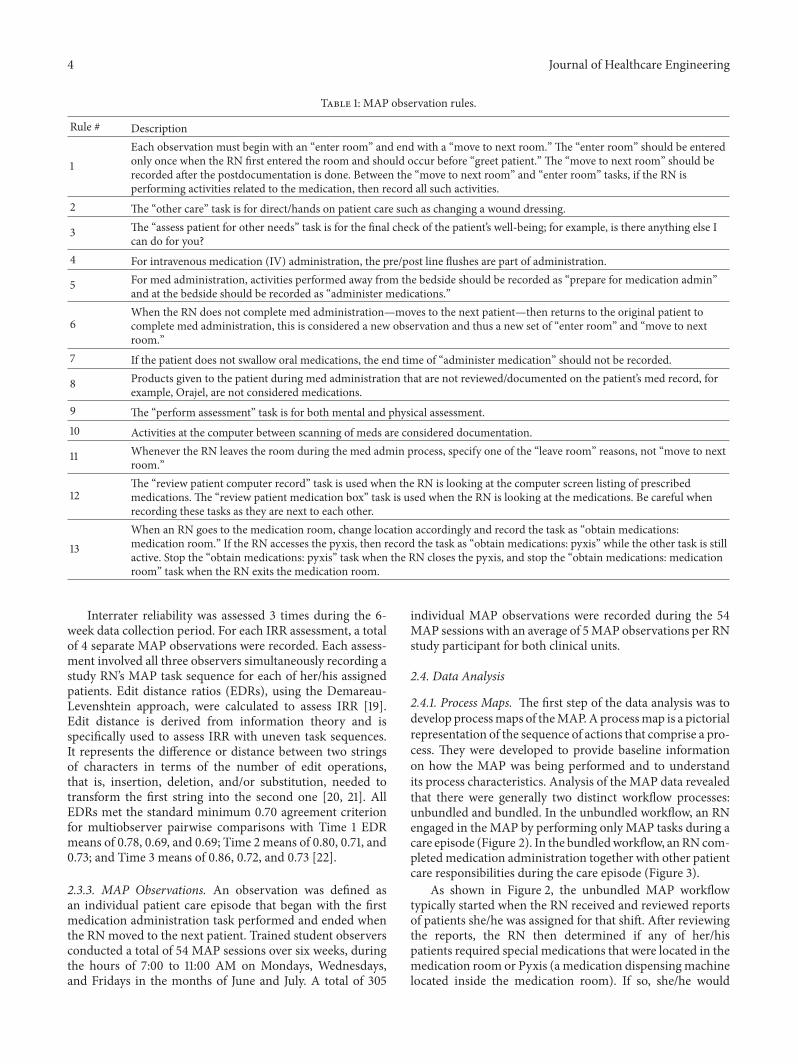
Table 1: MAP observation rules.
Rule # Description
1Each observation must begin with an “enter room” and end with a “move to next room.” The “enter room” should be enteredonly once when the RN first entered the room and should occur before “greet patient.” The “move to next room” should berecorded after the postdocumentation is done. Between the “move to next room” and “enter room” tasks, if the RN isperforming activities related to the medication, then record all such activities.
2 The “other care” task is for direct/hands on patient care such as changing a wound dressing.
3 The “assess patient for other needs” task is for the final check of the patient’s well-being; for example, is there anything else Ican do for you?
4 For intravenous medication (IV) administration, the pre/post line flushes are part of administration.
5 For med administration, activities performed away from the bedside should be recorded as “prepare for medication admin”and at the bedside should be recorded as “administer medications.”
6When the RN does not complete med administration—moves to the next patient—then returns to the original patient tocomplete med administration, this is considered a new observation and thus a new set of “enter room” and “move to nextroom.”
7 If the patient does not swallow oral medications, the end time of “administer medication” should not be recorded.
8 Products given to the patient during med administration that are not reviewed/documented on the patient’s med record, forexample, Orajel, are not considered medications.
9 The “perform assessment” task is for both mental and physical assessment.10 Activities at the computer between scanning of meds are considered documentation.
11 Whenever the RN leaves the room during the med admin process, specify one of the “leave room” reasons, not “move to nextroom.”
12The “review patient computer record” task is used when the RN is looking at the computer screen listing of prescribedmedications. The “review patient medication box” task is used when the RN is looking at the medications. Be careful whenrecording these tasks as they are next to each other.
13When an RN goes to the medication room, change location accordingly and record the task as “obtain medications:medication room.” If the RN accesses the pyxis, then record the task as “obtain medications: pyxis” while the other task is stillactive. Stop the “obtain medications: pyxis” task when the RN closes the pyxis, and stop the “obtain medications: medicationroom” task when the RN exits the medication room.
Interrater reliability was assessed 3 times during the 6-week data collection period. For each IRR assessment, a totalof 4 separate MAP observations were recorded. Each assess-ment involved all three observers simultaneously recording astudy RN’s MAP task sequence for each of her/his assignedpatients. Edit distance ratios (EDRs), using the Demareau-Levenshtein approach, were calculated to assess IRR [19].Edit distance is derived from information theory and isspecifically used to assess IRR with uneven task sequences.It represents the difference or distance between two stringsof characters in terms of the number of edit operations,that is, insertion, deletion, and/or substitution, needed totransform the first string into the second one [20, 21]. AllEDRs met the standard minimum 0.70 agreement criterionfor multiobserver pairwise comparisons with Time 1 EDRmeans of 0.78, 0.69, and 0.69; Time 2 means of 0.80, 0.71, and0.73; and Time 3 means of 0.86, 0.72, and 0.73 [22].
2.3.3. MAP Observations. An observation was defined asan individual patient care episode that began with the firstmedication administration task performed and ended whenthe RN moved to the next patient. Trained student observersconducted a total of 54 MAP sessions over six weeks, duringthe hours of 7:00 to 11:00 AM on Mondays, Wednesdays,and Fridays in the months of June and July. A total of 305
individual MAP observations were recorded during the 54MAP sessions with an average of 5MAP observations per RNstudy participant for both clinical units.
2.4. Data Analysis
2.4.1. Process Maps. The first step of the data analysis was todevelop processmaps of theMAP.Aprocessmap is a pictorialrepresentation of the sequence of actions that comprise a pro-cess. They were developed to provide baseline informationon how the MAP was being performed and to understandits process characteristics. Analysis of the MAP data revealedthat there were generally two distinct workflow processes:unbundled and bundled. In the unbundled workflow, an RNengaged in the MAP by performing only MAP tasks during acare episode (Figure 2). In the bundledworkflow, anRNcom-pleted medication administration together with other patientcare responsibilities during the care episode (Figure 3).
As shown in Figure 2, the unbundled MAP workflowtypically started when the RN received and reviewed reportsof patients she/he was assigned for that shift. After reviewingthe reports, the RN then determined if any of her/hispatients required special medications that were located in themedication room or Pyxis (a medication dispensingmachinelocated inside the medication room). If so, she/he would

Journal of Healthcare Engineering 5
Receive report
Move to nextroom
Obtain medication frommedication room or pyxis
Enter roomGreet patient
Clean hands or put on glovesLogin to mobile computer
Scan patient ID
Does patientrequire special
medication?Yes
No
Scan patient medsPrepare meds for admin
Explain medsAdminister meds
Document med admin
Review patient med box
Are meds available?
Are assessmentsneeded?
Yes
Performassessment Yes
No
Call/send request/go topharmacy, or
go to medication roomNo
More medsrequired?
Yes
Close med boxClean equipment
No
Document postadministration inroom or hallway
No
Figure 2: Unbundled MAP workflow.
retrieve them.The RN then visited each patient one at a time.The care episode or observation began when the RN enteredthe patient’s room.This was often followed by a combinationof tasks such as greet patient, clean hands or put on gloves, login to mobile computer, and scan patient’s ID. After reviewing
the patient’s medication list, the RN reviewed the medicationbox that was located in the patient’s room to determine if all ofthe needed medications were available. If not, she/he neededto call the pharmacy, send a request to the pharmacy throughthe computer, or go to the pharmacy or medication room.

6 Journal of Healthcare Engineering
Receive report
Move to nextroom
Obtain medication frommedication room or pyxis
Enter roomGreet patient
Clean hands or put on glovesLogin to mobile computer
Scan patient ID
Does patientrequire special
medication?Yes
No
Scan patient medsPrepare meds for admin
Explain medsAdminister meds
Document med admin
Review patient med box
Are meds available?
Are assessmentsneeded?
Yes
Performassessment Yes
No
Call/send request/go topharmacy, or
go to medication roomNo
More medsrequired?
Yes
Close med boxClean equipment
No
Patient has otherneeds?
Document postadministration inroom or hallway
No
Perform non-medsassessment or
perform other careYes
Perform non-medsassessment or
perform other care
Figure 3: Bundled MAP workflow.

Journal of Healthcare Engineering 7
Table 2: Characteristics of unbundled versus bundled observations.
Unbundled BundledNumber of observations 102 203Number of observationswith interruptions 84 187
Probability of interruptions 0.82 0.92Average duration ofobservation (minutes) 14.11 26.06
Standard deviation ofobservation duration(minutes)
12.378 90.95
These events were considered patient-driven interruptions;an interruption is an event that requires the RN tomomentar-ily break away from his/her current task. If the medicationswere available, then the RN would check to see if any ofthe medications to be given required an assessment (i.e.,a pulse for a patient receiving Digoxin). Once assessmentswere done, if applicable, the RN then proceeded with themedication administration tasks: scanning patient medica-tions, preparing medications for administration, explainingmedications to the patient, administering the medication,and documenting the medication administration. The medi-cation administration tasks were repeated for however manymedications the patient needed. Once the RN completed themedication administration tasks, she/he then closed themed-ication box and cleaned her/his equipment.This was followedby the postadministration medication documentation task.Some RNs performed this task while they were still inside thepatient’s room, while others preferred to do it in the hallway.The care episode or observation ended when the RN movedto the next patient’s room.
As highlighted in Figure 3 for the bundled MAP work-flow, the key difference between the unbundled and bundledworkflowwas the added “nonmedication assessment or othercare” tasks. These included tasks such as changing a wounddressing, assessing the physical and mental capacity of thepatient (Rule #9, Table 1), or providing assistance with dietaryneeds. It was observed that these nonmedication tasks couldtake place before, during, or after medication administration.
2.4.2. Process Characteristics. Table 2 provides a summary ofthe differences between unbundled and bundled observa-tions. Of the 305 observations, there were almost twice asmany bundled observations as there were unbundled ones(203 versus 102). Bundled observations took nearly twice aslong to complete (26 versus 14 minutes). The contrast instandard deviations indicated that the bundled observationwas highly variable, with someobservations taking nearly twohours to complete. Lastly, bundled observations were morelikely to be associated with interruptions (patient-drivenor time-driven) compared to unbundled observations (92%versus 82%). That is, the bundled MAP workflow had a 92%chance of having one or more interruptions. Patient-driveninterruptions were defined as those that were triggered bypatient-related care, whereas time-driven interruptions were
Table 3: MAP workflow interruptions.
Patient-driven Time-drivenLeave room to obtain supplies Leave room due to bed alarmLeave room to locate medication Staff inquiryLeave room due to patient request Personal timeLeave room to assist patient tobathroom Answer phone call
Leave room due to family request Make phone callPatient inquiry Computer battery issueFamily inquiry Unable to scan medMedication follow-up Other interruptionsObtain supplies from utility roomObtain supplies from medicationroomObtain supplies from kitchenObtain supplies from front RNstationObtain supplies from back RNstation
Prepare Administer Document InterruptionAver
age t
ime s
pent
on
func
tion
activ
ity (s
ec.)
0
50
100
150
200
250
300
Unbundled workflowBundled workflow
Figure 4: Average MAP task time (error bars indicate one standarddeviation).
triggered by other sources (considered as random events)(Table 3).
Figure 4 shows the difference in the average amount oftime between unbundled and bundled MAP workflows foran RN performing specific MAP tasks, for example, preparemedication, administer medication, and document medica-tion. Additionally, Figure 4 shows the difference in the timespent on interruptions for the unbundled and bundled MAPworkflows. The error bars in the graph denote one standarddeviation. Results indicated that RNs spentmore time prepar-ing and documenting medication for the bundled MAPworkflow. The time spent administering medications wascomparable between the two MAP workflows. While theunbundled MAP workflow had a lower chance of incurringinterruptions, the duration of interruptions was slightly
8 Journal of Healthcare Engineering
0 200 400 600 800 1000 1200Map functions and durations for unbundled workflow (seconds)
20 ra
ndom
unb
undl
ed
Prepare medicationAdminister medication
DocumentationInterruption
obse
rvat
ions
(a)
0 100 200 300 400 500 600 700 800 900 1000Map functions and durations for bundled workflow (seconds)
20 ra
ndom
bun
dled
obs
erva
tions
Prepare medicationAdminister medication
DocumentationInterruption
(b)
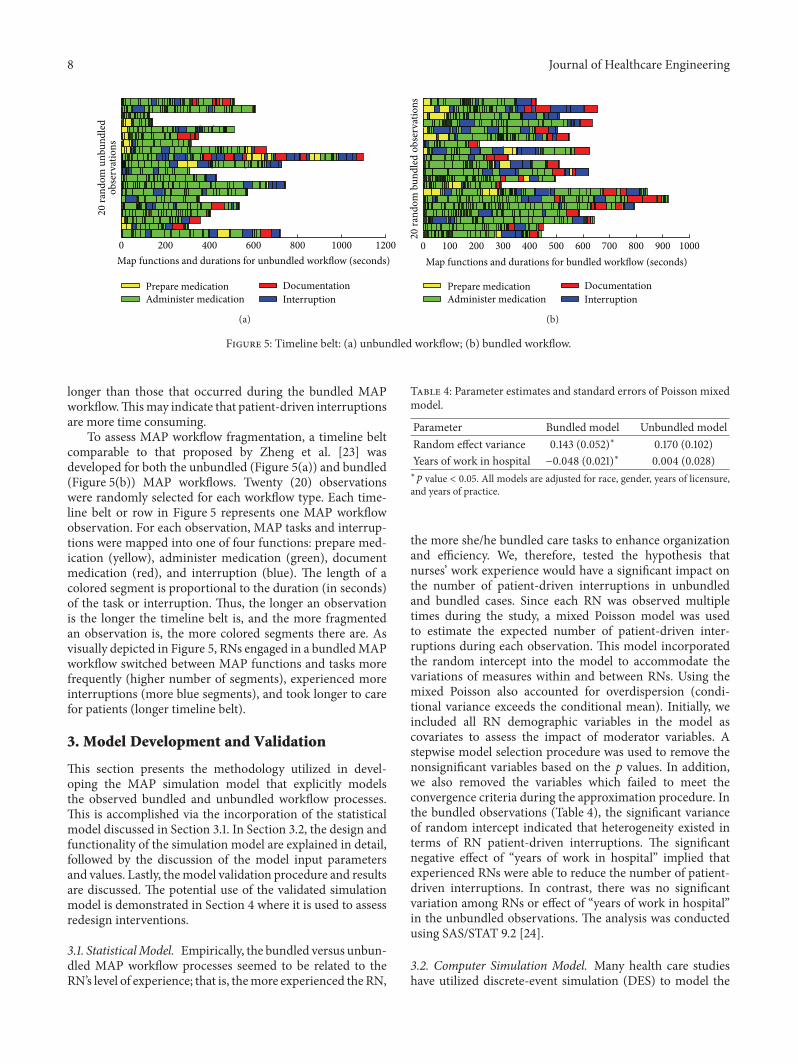
Figure 5: Timeline belt: (a) unbundled workflow; (b) bundled workflow.
longer than those that occurred during the bundled MAPworkflow.Thismay indicate that patient-driven interruptionsare more time consuming.
To assess MAP workflow fragmentation, a timeline beltcomparable to that proposed by Zheng et al. [23] wasdeveloped for both the unbundled (Figure 5(a)) and bundled(Figure 5(b)) MAP workflows. Twenty (20) observationswere randomly selected for each workflow type. Each time-line belt or row in Figure 5 represents one MAP workflowobservation. For each observation, MAP tasks and interrup-tions were mapped into one of four functions: prepare med-ication (yellow), administer medication (green), documentmedication (red), and interruption (blue). The length of acolored segment is proportional to the duration (in seconds)of the task or interruption. Thus, the longer an observationis the longer the timeline belt is, and the more fragmentedan observation is, the more colored segments there are. Asvisually depicted in Figure 5, RNs engaged in a bundledMAPworkflow switched between MAP functions and tasks morefrequently (higher number of segments), experienced moreinterruptions (more blue segments), and took longer to carefor patients (longer timeline belt).
3. Model Development and Validation
This section presents the methodology utilized in devel-oping the MAP simulation model that explicitly modelsthe observed bundled and unbundled workflow processes.This is accomplished via the incorporation of the statisticalmodel discussed in Section 3.1. In Section 3.2, the design andfunctionality of the simulation model are explained in detail,followed by the discussion of the model input parametersand values. Lastly, themodel validation procedure and resultsare discussed. The potential use of the validated simulationmodel is demonstrated in Section 4 where it is used to assessredesign interventions.
3.1. StatisticalModel. Empirically, the bundled versus unbun-dled MAP workflow processes seemed to be related to theRN’s level of experience; that is, themore experienced the RN,
Table 4: Parameter estimates and standard errors of Poisson mixedmodel.
Parameter Bundled model Unbundled modelRandom effect variance 0.143 (0.052)∗ 0.170 (0.102)Years of work in hospital −0.048 (0.021)∗ 0.004 (0.028)∗𝑝 value < 0.05. All models are adjusted for race, gender, years of licensure,and years of practice.
the more she/he bundled care tasks to enhance organizationand efficiency. We, therefore, tested the hypothesis thatnurses’ work experience would have a significant impact onthe number of patient-driven interruptions in unbundledand bundled cases. Since each RN was observed multipletimes during the study, a mixed Poisson model was usedto estimate the expected number of patient-driven inter-ruptions during each observation. This model incorporatedthe random intercept into the model to accommodate thevariations of measures within and between RNs. Using themixed Poisson also accounted for overdispersion (condi-tional variance exceeds the conditional mean). Initially, weincluded all RN demographic variables in the model ascovariates to assess the impact of moderator variables. Astepwise model selection procedure was used to remove thenonsignificant variables based on the 𝑝 values. In addition,we also removed the variables which failed to meet theconvergence criteria during the approximation procedure. Inthe bundled observations (Table 4), the significant varianceof random intercept indicated that heterogeneity existed interms of RN patient-driven interruptions. The significantnegative effect of “years of work in hospital” implied thatexperienced RNs were able to reduce the number of patient-driven interruptions. In contrast, there was no significantvariation among RNs or effect of “years of work in hospital”in the unbundled observations. The analysis was conductedusing SAS/STAT 9.2 [24].
3.2. Computer Simulation Model. Many health care studieshave utilized discrete-event simulation (DES) to model the

Journal of Healthcare Engineering 9
Figure 6: Graphical user interface of MAP simulation model.
operation of a system as a discrete sequence of events in time.The MAP workflows reflected a discrete set of events andwere best modeled using DES. However, the RNs were not ahomogenous set of agents with identical characteristics andthis had an effect on their MAP workflows. In particular,the RNs’ number of years worked in the hospital was cor-related with the number of patient-driven interruptions forbundledworkflows. For this reason, it was necessary tomodelRNs as individual agents with their own characteristics.Pseudocode 1 provides a high-level algorithmic view of thesimulation model, which was implemented using Netlogo[25]. We chose Netlogo because of our prior experience withit.
As illustrated in Pseudocode 1, the simulation model hasthree key procedures: setup, simulate, and do-task. The setupprocedure performed all the preliminary steps before theworkflow is simulated. In this procedure, the model initial-ized the variables, drew the layout of the units (to show loca-tion of RNs), generated a user-specified number of RNswork-ing on a unit and patients to be assigned to each RN (the ratioof RNs to patients is based on collected data), and assignedspecific attributes to each RN. The model simulated RNs’movements according to the actual study clinical unit floorlayout and patient room numbers. This was done to track thetotal RN walking distance as a proxy for fatigue, which haslong been considered a contributory factor in patient careerrors [23]. The RN attributes that were explicitly modeledincluded the workflow type (i.e., bundled or unbundled)and the “years of work in hospital.” As discussed, the cha-racteristic “years of work in hospital” was used to estimatethe number of patient-driven interruptions each RN wouldencounter per observation. Time-driven interruptions were
calculated per 10-minute intervals using the probabilitydetermined from data.
The simulate procedure was responsible for controllingthe program flow. It maintained a queue of RNs to simulateand RNswere selected from this queue based on the timing ofthe events to be simulated. For each RN, it determined if theRN had completed all the tasks for an observation. If so, theRN was moved to the next room (i.e., observation/patient).If not, it assigned the next task to the RN and the time ittook to complete that task. This information was then placedin the priority queue and subsequently drawn when it got tothe front of the queue. The task processing times were deter-mined using best-fit distributions and parameters (deter-mined based on sample data). Thus, the simulation model isa stochastic model due to the randomness in task processingtimes and number of interruptions. The simulate procedureended when all RNs had completed their assignments.
The simulate procedure relied on the do-task function todetermine the next task within the unbundled or bundledworkflow. The “conditional” term in the do-task functiondenoted a decision point in the workflow (represented bydiamond shapes in Figures 2 and 3). When a conditionalwas encountered, the model determined the branch it fol-lowed based on the observed probabilities. Thus, while MAPactivities were structured based on the workflows, there wassignificant workflow variability due to a number of con-ditionals (i.e., special medications, medication availability,medication-related assessments, and other care).
Figure 6 shows a screenshot of the developed MAPsimulation model. The graphical user interface includes the“setup” button that calls the setup procedure and the “go”button that calls the simulate procedure. Additionally, the

10 Journal of Healthcare Engineering
Setup procedure
Initialize variables
Draw floor layout of units
Generate RN agents and patients for each unit
Create RN characteristics
Simulate procedure
(RN, RN.task) = pick from the front of priority queue
if RN.task = 0 then go-to-next-room
next-task = ask RN to do-task RN.task
add (RN, next-task, duration-of next-task) to priority
queue until no more patients left
do-task [task] function
if task is a conditional
result = run conditional
next-task = pick based on result and workflow
else
next-task = pick based on workflow
return next-task
Pseudocode 1: MAP computer simulation model high-level pseudocode.
GUI includes sliders that allow users to specify the number ofRNs to simulate, the probability that an RN follows the bun-dled workflow, and the probabilities that they will encounterinterruptions in the unbundled and bundled workflows.When themodel is running, the GUI shows which rooms theRNs are in, their current activities, and relevant statistics.
3.3. Input Parameters. The simulation model uses a numberof input parameters.Theprimary input is the list of tasks asso-ciated with unbundled and bundled workflows. Algorithm 1provides a portion of the codes we implemented to modelthe bundled workflow. Each row in Algorithm 1 is an “edge”in the workflow graph. The first item is the “from” task ofthe edge. If there is no second item in the row then thefirst item in the next row is the “to” task. If the task endsin a ? then it is a conditional, to be executed at runtime.If the conditional statement evaluates to true (based on theobserved probabilities) then we perform the second task inthe row; otherwise, we perform the third task in the row.Thetask durationswere drawn from theGammadistributionwithparameters𝛼 and𝜆, where𝛼=mean∗mean/variance and𝜆=mean/variance. The durations of the commonly encounteredbundled tasks are shown in Table 5; there are over 60 tasks ineach of the two workflows; thus, not all tasks are shown.
Values related to the number of patients assigned to anurse, the number of patient-driven and time-driven inter-ruptions, and the number of medications needed by apatient were drawn from a discrete empirical distributionconstructed from the observed data. Table 6 shows the cumu-lative distribution function (CDF) values used by the simu-lation model to determine the values for these parameters.That is, a random number between 0 and 1 is generated andthe CDF is used to determine the value for the correspondingparameter.
3.4. Model Validation. Model validation is the process ofensuring that the simulation model behaves in the way it
Table 5: Duration of bundled tasks.
Task nameAverageduration(sec)
Std. dev.(sec)
Clean hands (upon entering room) 5.08 10.14Put on gloves 13.82 6.38Enter room 2.34 3.32Greet patient 3.38 6.37Login to mobile computer 7.51 4.65Review patient computer record 17.65 25.99Scan patient ID 6.52 4.90Perform assessment 63.75 78.65Review patient med box 17.04 16.42Scan patient meds 4.24 6.16Document med admin 6.43 7.64Administer meds 68.94 88.72Other care 61.65 99.21Explain meds 13.63 14.35Prepare meds for admin 34.47 37.19Close medication box 4.67 6.66Clean equipment 19.71 19.41Clean hands (upon leaving room) 5.87 9.88Document post administration (inhallway) 148.67 118.42
Document post administration (inpatient’s room) 76.06 106.43
Obtain meds from pyxis 42.92 27.92Obtain meds frommedication room 52.19 39.69Obtain meds from pharmacy 489.00 162.53
was intended according to the modeling assumptions made.The MAP model validation was achieved by comparing

Journal of Healthcare Engineering 11
set bundled [
"receive report"
["require special medication?" "medroom or pyxis?" "enter room"]
["medroom or pyxis?" "obtain meds medroom" "obtain meds pyxis"]
["obtain meds medroom" "enter room"]
["obtain meds pyxis" "enter room"]
"enter room"
"greet patient"
⋅ ⋅ ⋅
⋅ ⋅ ⋅
]
Algorithm 1: Bundled workflow data input to simulation model.
Table 6: Simulation model parameters.
Model parameter Discrete cumulative distribution functionNumber of patients assigned to nurse(1, 2, . . . , 11)
DISC (0, 0.23171, 0.14634, 0.08537, 0.14634, 0.17073, 0.08537, 0.10976,0.01219, 0, 0, 0.01219)
Number of patient-driven interruptions(for unbundled workflow: 1, 2, . . . , 11)
DISC (0, 0.37333, 0.22666, 0.22666, 0.10666, 0.01333, 0.01333, 0.02670, 0, 0, 0,0.01333)
Number of patient-driven interruptions(for bundled workflow: 1, 2, . . . , 11)
DISC (0, 0.225, 0.2375, 0.21875, 0.1375, 0.09375, 0.04375, 0.00625, 0.00625,0.0125, 0.0125, 0.00625)
Number of time-driven interruptions(for unbundled workflow: 1, 2, . . . , 6) DISC (0, 0.61165, 0.26214, 0.05340, 0.04854, 0.01456, 0.00971)
Number of time-driven interruptions(for bundled workflow: 1, 2, . . . , 8)
DISC (0, 0.57271, 0.27069, 0.09620, 0.04251, 0.01119, 0.00224, 0.00224,0.00224)
Number of medications needed by a patient(1, 2, . . . , 16)
DISC (0, 0.032787, 0.2, 0.118033, 0.12131, 0.10492, 0.07213, 0.09836, 0.06885,0.02951, 0.05246, 0.02951, 0.01311, 0.01311, 0.01639, 0.01311, 0.01639)
the model’s observation duration with the actual MAPobservation duration. Netlogo’s Behavior Space tool wasused to generate 1,000 observations (i.e., replications) andeach observation was run until the nurse completes MAPfor all of her/his assigned patients. Note that the durationof each replication is dependent on a number of randomfactors, including how many patients are assigned to thenurse and howmany medications are needed by the patients.The model’s average observation durations were comparedagainst the actual average observation durations. Since theobservation durations are not normally distributed, theWilcoxon Rank-SumTest was used to test the null hypothesisthat the distribution of observation durations generated bythe model was the same as that of the actual observationdurations. The Wilcoxon test, using the statistical software R[26], yielded a 𝑝 value = 0.5341 for unbundled observationsand a 𝑝 value = 0.7629 for bundled observations, and the nullhypothesis could not be rejected.
4. Assessment of MAP Redesign Interventions
The validated MAP simulation model was used to assessthe impact of two hypothetical redesign interventions in asimulated setting: (1) intervention 1 increased RNs’ use of anunbundled MAP workflow and (2) intervention 2 reduced
Table 7: Results of intervention 1.
Unbundledpercentage (%)
Average number ofinterruptions per RNper shift (95% CI)
Average observationduration per RN pershift, min (95% CI)
0 10.48 (10.24 to 10.71) 16.58 (16.34 to 16.82)33.5 (base case) 9.15 (8.93 to 9.37) 15.14 (14.92 to 15.36)50 9.02 (8.81 to 9.24) 14.92 (14.70 to 15.14)100 7.17 (7.0 to 7.34) 12.74 (12.55 to 12.92)∗Confidence intervals were calculated using Kelton et al.’s method [18].
MAP patient-driven interruptions. For intervention 2, thetime-driven interruptions were not considered because theyare random and RNs do not have control over them.
To assess the impact of intervention 1, the input to theMAP model was modified to have different percentages ofRNs follow the unbundled workflow, that is, 0%, 33.5% (basecase), 50%, and 100%. The experimentation was conductedusing 1,000 replications and each replicationwas run until thenurse completes all of her/his assignments. Table 7 providesa summary of the results for intervention 1, and Figure 7illustrates the impact of these scenarios on the averageobservation duration per RN per shift. The results indicated

12 Journal of Healthcare Engineering
Table 8: Results of intervention 2 for unbundled workflow.
Probability of incurringinterruption
Interruption counts per RNper shift (95% CI)
Average observation duration perRN per shift, min (95% CI)
Base case 0.82 7.46 (7.28 to 7.63) 13.66 (13.23 to 14.09)10% reduction 0.738 6.75 (6.58 to 6.92) 13.38 (12.95 to 13.80)20% reduction 0.656 5.86 (5.70 to 6.02) 13.30 (12.88 to 13.72)30% reduction 0.574 5.19 (5.05 to 5.34) 13.23 (12.81 to 13.65)∗Confidence intervals were calculated using Kelton et al.’s method [18].
Table 9: Results of intervention 2 for bundled workflow.
Probability of incurringinterruption
Interruption counts per RNper shift (95% CI)
Average observation duration perRN per shift, min (95% CI)
Base case 0.92 10.15 (9.93 to 10.37) 18.40 (17.82 to 18.98)10% reduction 0.828 9.73 (9.50 to 9.96) 17.80 (17.23 to 18.36)20% reduction 0.736 8.26 (8.06 to 8.46) 18.02 (17.45 to 18.59)30% reduction 0.644 7.49 (7.29 to 7.68) 17.19 (16.64 to 17.73)∗Confidence intervals were calculated using Kelton et al.’s method [18].
16.5815.14 14.92
12.74
0
2
4
6
8
10
12
14
16
18
Scen
ario
1:
unbu
ndle
d =
0%
Base
case
(unb
undl
ed =
33.
5%)
Scen
ario
2:
unbu
ndle
d =
50%
Scen
ario
3:
unbu
ndle
d =
100%
Aver
age o
bser
vatio
n du
ratio
n pe
rnu
rse p
er sh
ift
Figure 7: Impact of intervention 1 on average (mean) observationduration in minutes (note: base case and scenario 2 have a mixtureof unbundled and bundled observations).
that as the percentage of RNs following the unbundledworkflow increased, the average number of interruptions andobservation duration decreased.
To assess the impact of intervention 2, the input to theMAPmodel wasmodified to assume a reduction of 10%, 20%,and 30% in patient-driven interruptions for both unbundledand bundled workflows. Tables 8 and 9 provide a summaryof the results for the unbundled and bundled workflow,respectively. As shown in Table 8, for unbundled workflow,the results indicated that as the probability of interruptionsdecreased, so did the interruption counts and observation
duration. This result implied that if RNs could avoid situa-tions that lead to interruptions, they would be more efficient.A similar result was observed for bundledworkflow (Table 9),except that the average observation duration did not follow adecreasing trend. This was most likely due to other nonmed-ication tasks incorporated into the bundled workflow. Also,the patient-driven interruption time for bundled workflowtended to be lower than that of unbundled workflow. Thus,the fewer number of patient-driven interruptions had lessof an impact on observation duration for bundled workflowthan it did for unbundled workflow.
5. Discussion
Study findings indicated that there was a lack of consis-tent MAP workflow among RNs. Two predominant MAPworkflow patterns, unbundled and bundled, emerged fromthe data. However, even within these two workflow pat-terns, additional variations were observed. For example, thenumber of patient-driven interruptions was associated withan RN’s years of work in the hospital. Hence, it is possiblethat other RN characteristics might play a role in RN MAPworkflow and additional research is needed in this area.
MAP timeline belts suggested that the bundled workflowis not desirable due to a higher incidence of MAP taskswitching (i.e., workflow fragmentation) and interruptions.Previous research findings have shown that frequent taskswitching often increases physical activities that can resultin a higher likelihood of cognitive slips and mistakes thatcan lead to performance error [23]. Study qualitative findingsfrom tape recorded comments pointed to a number ofinterruptions thatwere likely to occur from“other care”whenRNs followed a bundledMAPworkflowpattern. For example,RNs engaged in a bundled MAP workflow pattern oftenresponded to patient requests for dietary assistance and othercare requests such as toileting assistance (Table 10). While we

Journal of Healthcare Engineering 13
Table 10: Nonmedication related sources of interruptions.
Category Interruption source
Patient dietary assistance
Give patient requested foodGet ice for patient
Leave room to find apple sauceLeave room to dispose of patient’s
breakfast
Patient care assistance
Assist another patientAssist patient to the bathroomGet translator for patientGet towels from linen room
classified these patient requests as interruptions, we recognizethat they are necessary or essential to the patients’ wellbeing.Moreover, we recognize that RNs cannot seek to be moreefficient at the expense of the quality or completeness of care.Nevertheless, these “other care” interruptions raised a varietyof nursing practice questions about the safety impact of thebundled MAP workflow pattern on medication administra-tion error outcomes and other practice considerations suchas use of aseptic technique in medication administration.Additional research is needed to address these and otheremergent questions.
6. Conclusions
This study developed a computer simulation model to assessthe performance of nursing unbundled versus bundled MAPworkflows. It extended our previous work in several areas:(1) the iMedTracker was modified to work on iPad devicesinstead of iPod Touch to minimize scrolling and therebyfacilitate the recording of live MAP observations, (2) datacollection took place in an actual hospital setting instead of anacademic simulation laboratory and thereby provided morerealistic RN characteristics andMAP workflow observations,(3) theMAP agent-level DES simulationmodel was modifiedto incorporate RN and MAP characteristics to accountfor patient-driven and time-driven interruptions, and (4)statistical modeling techniques were used to complimentdevelopment of the MAP computer simulation model. Whileour methods and tools were validated in this study, keylimitations should be considered when reviewing studyresults. These included (1) one study hospital, (2) only 2medical units, (3) small number of RN participants (𝑛 =17), (4) lack of patient contextual data, (5) small numberof MAP observations (𝑛 = 305), and (6) data collectedonly during morning shifts of Mondays, Wednesdays, andFridays. These limitations prohibited us from conductingan actual process redesign with the stakeholders. We planto address these shortcomings in a larger proposed fieldstudy that is currently under review. Furthermore, in futurework, we plan to develop an agent-based model of MAPthat simulates the complex behavior of RNs through the useof agents. Specifically, we wish to model the autonomousbehavior of the nurse agents and the interactions betweenthe agents themselves and their environment. To accomplish
this goal, we are currently expanding the capabilities ofthe iMedTracker to provide data for the agent-based modeldevelopment and validation.
Competing Interests
The authors indicated no potential competing interests.
Acknowledgments
The authors greatly appreciate the support of the study hos-pital nursing staff and managers. This study could not havebeen completed without them. The authors also extend sin-cere thanks to study research assistants, Caroline Mulatya,Matthew Fleming, Krishma Naik, and Bradley Huffman, fortheir dedication to the project. The study was supported byfunds fromDr. Snyder’s SmartState Endowed Chair in HealthInformatics Quality and Safety Evaluation during her tenureat the University of South Carolina.The SmartState EndowedChair Program is funded by the South Carolina Commissionon Higher Education.
References
[1] J. S. Ash, D. F. Sittig, E. G. Poon, K. Guappone, E. Campbell,and R. H. Dykstra, “The extent and importance of unintendedconsequences related to computerized provider order entry,”Journal of the AmericanMedical Informatics Association, vol. 14,no. 4, pp. 415–423, 2007.
[2] Z. Niazkhani, H. Pirnejad, M. Berg, and J. Aarts, “The impact ofcomputerized provider order entry systems on inpatient clinicalworkflow: a literature review,” Journal of the American MedicalInformatics Association, vol. 16, no. 4, pp. 539–549, 2009.
[3] J. M. Walker and P. Carayon, “From tasks to processes: the casefor changing health information technology to improve healthcare,” Health Affairs, vol. 28, no. 2, pp. 467–477, 2009.
[4] J. Grossman, R. Gourevitch, and D. A. Cross, “Hospital expe-riences using electronic health records to support medicationreconciliation,” Research Brief Number 17, National Institute forHealth Care Reform (NIHCR), Washington, DC, USA, 2014.
[5] P. Carayon, A. Schoofs Hundt, B.-T. Karsh et al., “Work systemdesign for patient safety: the SEIPS model,” Quality and Safetyin Health Care, vol. 15, supplement 1, pp. i50–i58, 2006.
[6] Institute of Medicine, Keeping Patients Safe: Transforming theWork Environment of Nurses, National Academies Press, Wash-ington, DC, USA, 2004.
[7] S. B. Lee, L. L. Lee, R. S. Yeung, and J. T. Chan, “A continuousquality improvement project to reduce medication error in theemergency department,”World Journal of Emergency Medicine,vol. 4, no. 3, pp. 179–182, 2013.
[8] K. G. Burke, “Executive summary: the state of the scienceon safe medication administration symposium,”The AmericanJournal of Nursing, vol. 105, no. 3, pp. 4–9, 2005.
[9] R. G. Hughes and E. Ortiz, “Medication errors: why theyhappen, and how they can be prevented,” American Journal ofNursing, vol. 105, no. 3, pp. 14–24, 2005.
[10] C. Sullivan, K. M. Gleason, D. Rooney, J. M. Groszek, and C.Barnard, “Medication reconciliation in the acute care setting:opportunity and challenge for nursing,” Journal of Nursing CareQuality, vol. 20, no. 2, pp. 95–98, 2005.

14 Journal of Healthcare Engineering
[11] S. H. Sanchez, S. S. Sethi, S. L. Santos, and K. Boockvar,“Implementing medication reconciliation from the planner’sperspective: a qualitative study,” BMC Health Services Research,vol. 14, no. 1, article 290, 2014.
[12] L. L. Leape, D. W. Bates, D. J. Cullen et al., “Systems analysisof adverse drug events,” Journal of the American Medical Asso-ciation, vol. 274, no. 1, pp. 35–43, 1995.
[13] K. McBride-Henry and M. Foureur, “Medication administra-tion errors: understanding the issues,” Australian Journal ofAdvanced Nursing, vol. 23, no. 3, pp. 33–42, 2006.
[14] H. Pirinen, L. Kauhanen, R. Danielsson-Ojala et al., “RegisteredNurses’ experiences with the medication administration pro-cess,”Advances in Nursing, vol. 2015, Article ID 941589, 10 pages,2015.
[15] S. K. Garrett and J. B. Craig, “Medication administration andthe complexity of nursing workflow,” in Proceedings of the21st Annual Society for Health Systems Conference and Expo,Chicago, Ill, USA, April 2009.
[16] R. Snyder, N. Huynh, B. Cai, and A. S. Tavakoli, “Evaluation ofmedication administration process: tools and techniques,” Jour-nal of Healthcare Engineering, vol. 2, no. 4, pp. 527–538, 2011.
[17] N. Huynh, R. Snyder, J. M. Vidal, A. S. Tavakoli, and B. Cai,“Application of computer simulation modeling to medicationadministration process redesign,” Journal of Healthcare Engi-neering, vol. 3, no. 4, pp. 649–662, 2012.
[18] W. D. Kelton, R. P. Sadowski, and D. A. Sadowski, Simulationwith ARENA, McGraw-Hill, New York, NY, USA, 6th edition,2014.
[19] R. A. Wagner and R. Lowrance, “An extension of the string-to-string correction problem,” Journal of the ACM, vol. 22, pp. 177–183, 1975.
[20] R. O. Duda, P. E. Hart, and D. G. Stork, Pattern Classification,John Wiley & Sons, New York, NY, USA, 2nd edition, 2001.
[21] J. J. Liu, Y. L. Wang, and G. S. Huang, Solving some SequenceProblems on Run-Length Encoded Strings: Longest CommonSequences, Edit Distances, and Squares, VDM Verlag Dr.Mueller, Saarbrucken, Germany, 2008.
[22] M. A. Pett, Nonparametric Statistics for Health Care Research,Sage, Thousand Oaks, Calif, USA, 1997.
[23] K. Zheng, H. M. Haftel, R. B. Hirschl, M. O’Reilly, and D. A.Hanauer, “Quantifying the impact of health IT implementationson clinical workflow: a new methodological perspective,” Jour-nal of the American Medical Informatics Association, vol. 17, pp.454–461, 2010.
[24] SAS Institute, SAS/STAT� 9.2 User’s Guide, SAS Institute, Cary,NC, USA, 2008.
[25] U. Wilensky, NetLogo, Center for Connected Learning andComputer-Based Modeling, Northwestern University, Evan-ston, Ill, USA, 1999, http://ccl.northwestern.edu/netlogo/.
[26] RDevelopment Core Team, R: A Language and Environment forStatistical Computing, R Foundation for Statistical Computing,Vienna, Austria, 2013, http://www.R-project.org/.