Assessment of the Hybrid Solar Technologies for Air ...
139
1 Final Report: January 20, 2016 Assessment of the Hybrid Solar Technologies for Air Conditioning in the Sustainable City of Dubai Principal Investigator: Prof. Pieter Stroeve Sponsor: Diamond Developers of Dubai, UAE This report has been prepared by collaboration between researchers at the University of California Davis (UC Davis) and the American University of Beirut (AUB). Researchers from UC Davis: Prof. Pieter Stroeve, Dr. Sarah Outcault, Dr. Masoud Rahman and Tobias Benjamin Barr. Researchers from AUB: Prof. Nesreene Ghaddar and Prof. Kamel Ghali. Disclaimer: No specific product or technology constitutes an endorsement by the researchers of this report and UC Davis.
Transcript of Assessment of the Hybrid Solar Technologies for Air ...
1
Final Report: January 20, 2016
Assessment of the Hybrid Solar
Technologies for Air Conditioning in the
Sustainable City of Dubai
Principal Investigator: Prof. Pieter Stroeve
Sponsor: Diamond Developers of Dubai, UAE
This report has been prepared by collaboration between researchers at the University of California Davis
(UC Davis) and the American University of Beirut (AUB).
Researchers from UC Davis: Prof. Pieter Stroeve, Dr. Sarah Outcault, Dr. Masoud Rahman and Tobias
Benjamin Barr.
Researchers from AUB: Prof. Nesreene Ghaddar and Prof. Kamel Ghali.
Disclaimer: No specific product or technology constitutes an endorsement by the researchers of this report
and UC Davis.
2
Contents
Executive Summary ...................................................................................................................................... 5
List of Abbreviations ................................................................................................................................ 6
1 Introduction ........................................................................................................................................... 7
1.1 Dubai Weather ................................................................................................................................. 7
1.2 Sustainable Center of Excellence: the SCE Building ...................................................................... 9
1.3 Sustainable Center of Excellence: Occupants ................................................................................ 14
1.4 Sustainable Center of Excellence: Energy Demand ....................................................................... 15
1.5 Building Materials and Specifications ........................................................................................... 16
2 Project Background ............................................................................................................................. 19
2.1 Introduction .................................................................................................................................... 19
2.2 Thermally Driven Air Conditioning .............................................................................................. 19
2.3 PV/T Technology ........................................................................................................................... 20
2.3.2 Thermal Comfort..................................................................................................................... 23
2.3.3 Solar-based Absorption Chillers ............................................................................................. 28
2.3.4 Ventilation Requirements ....................................................................................................... 28
2.4. References ........................................................................................................................................ 29
3 System Designs and Models ............................................................................................................... 30
3.1 Sizing of Building Solar-Powered Cooling Systems ..................................................................... 33
3.2 HVAC Electric Load Calculation .................................................................................................. 36
4 Solar Technology Design .................................................................................................................... 37
4.1 Energy Demand of the Building .................................................................................................... 37
4.2 Sizing the solar technology for thermal energy demand ................................................................ 40
4.2.1 PV/T System ........................................................................................................................... 40
4.2.2 Evacuated Tube Solar Collectors ............................................................................................ 43
4.3 Sizing Solar Technologies for Electrical Demand of Building ...................................................... 46
4.3.1 PV System ............................................................................................................................... 46

3
4.3.2 PV Design for the Building ..................................................................................................... 53
4.3.3 PV/T System ........................................................................................................................... 55
4.4 Building Integrated Solar Technologies ........................................................................................ 57
4.4.1 Rooftop BIPV ......................................................................................................................... 58
4.4.2 BIPV Façade ........................................................................................................................... 59
4.4.3 BIPV Window ......................................................................................................................... 59
4.4.4 Shade Analysis and Solar Energy Output Modeling ............................................................... 62
4.4.5 References ............................................................................................................................... 65
4.5 Integrated Design ........................................................................................................................... 67
5 Life Cycle Analysis (LCA) ................................................................................................................. 68
5.1 Solar Technologies ......................................................................................................................... 68
5.2 Air Conditioning System ............................................................................................................... 82
5.3 References ......................................................................................................................................... 83
6 Social and Behavioral Studies: Promoting Energy Conservation from a Hybrid Solar-Air
Conditioning System ................................................................................................................................... 84
6.1 Technology & energy conservation ............................................................................................... 84
6.2 Behavior & energy conservation .................................................................................................... 85
6.2.1 Theory of behavior change ..................................................................................................... 93
6.2.2 Encouraging acceptance .......................................................................................................... 94
6.2.3 Encouraging adaption ........................................................................................................... 102
6.2.4 Empowering occupants to change temperature ..................................................................... 104
6.3 Conclusion ................................................................................................................................... 113
6.4 Next steps ..................................................................................................................................... 117
6.5 References .................................................................................................................................... 117
Conclusions and Next Steps ...................................................................................................................... 120
Appendix 1 ................................................................................................................................................ 121
Appendix 2 ................................................................................................................................................ 123

4
Appendix 3 ................................................................................................................................................ 124
Appendix 4- Thermal Comfort Survey ..................................................................................................... 125
Appendix 5 BIPV Technologies ............................................................................................................... 135
5
Executive Summary
Air conditioning is one of the major energy consumption items in Dubai and countries with the
same environmental conditions. Providing the majority of the air conditioning energy demand by
renewable technologies will be a major step toward sustainable and green communities. The
Sustainable City (TSC) in Dubai is currently under design, construction, and development by
Diamond Developers Company (DD) with the most recent and innovative sustainable standards
and technologies. As part of its policy to support research and development as well as to use the
state of the art technology and knowledge for projects, DD collaborated with UC Davis and has
sponsored multiple research projects. The current report has been sponsored by DD and
summarizes the results of research by researchers from UC Davis and American University of
Beirut (AUB).
In this study, different scenarios of integrated solar technologies and air conditioning systems for
providing the energy demand of the Center of Excellence (SCE) building in the Sustainable City
of Dubai has been evaluated. This study includes the determination of air conditioning demand of
the building based on the environmental condition, behavioral aspects of the users of the building,
air conditioning modeling, and the technologies available in the building.
After comparison of various scenarios, we recommend photovoltaic (PV) technologies for
supplying the electrical demand of the building. Evacuated tube solar collectors will be used to
provide the thermal energy for the thermal-driven single state absorption chiller. The results show
that 1764 PV panels and 4120 evacuated tube solar collectors will be required for the SCE
building. Additionally, the potential advantages of the building-integrated solar technologies for
the building has been calculated and discussed. The life cycle assessment of solar and air
conditioning technologies for the building shows that the payback time is in the range of 4 to 8
years. The study also addresses the human factors related to system performance and
acceptability, and main barrier being an anticipated temperature setting of 24°C, slightly highly
than the local norm. Ensuring system performance may require changes in occupant behavior. To
estimate the acceptability of such changes, a survey on thermal comfort in the workplace was
conducted. Twelve recommendations addressing occupant behavior were developed based on the
survey results, the theory of behavior change, the physiological and cultural aspects of thermal
comfort, and international best practice on thermostatic control. The recommendations address
selecting controls technology, encouraging occupant acceptance and adaption, and empowering
occupants to control temperature settings, in order to promote energy conservation and reliable
system operation.

6
List of Abbreviations
Table 1: List of abbreviations.
DD Diamond Developers
TSC The Sustainable City
UC Davis University of California Davis
AUB American University of Beirut
SCE Sustainable Center of Excellence
GF Ground Floor
1F First Floor
2F Second Floor
PV Photovoltaic
PV/T Photovoltaic/Thermal
BIPV/T Building-Integrated Photovoltaic/Thermal
BAPV Building-Applied Photovoltaic
SAPV Stand-Alone Photovoltaic

7
1 Introduction
The Sustainable City (TSC) in Dubai is currently under design, construction, and development by
Diamond Developers Company (DD) with the most recent and innovative sustainable standards.
TSC will be the first residential community in Dubai adopting sustainable design, highest
environmental standards, and eco-tourism. TSC is an outstanding model of sustainable living,
work, education and entertainment. The current report has been sponsored by DD and
summarizes the results of research by researchers from UC Davis and AUB.
Air conditioning is a major energy consumer in hot and humid environments. Providing the air
conditioning requirement of buildings by renewable resources is a promising approach toward
sustainable design of buildings or zero net energy communities, especially at the time when non-
renewable resources are being harshly exhausted. The design of the Sustainable City of Dubai is
among the pioneering designs in employment of state-of-the-art research and technology toward
green designs.
One of the main features of TSC is its net-zero-energy design. Around 10 MWP of solar panels on
the rooftop of the buildings and parking shades will generate most of the required electricity of
the city. By proper design of the architectural regions a microclimate with cleaner air and lower
temperature has been provided for the residents.
In this report, the first chapter summarizes the building information, weather, and occupants of
the buildings. This information has been used as the input for the following chapters.
1.1 Dubai Weather
The average monthly temperatures in Dubai are presented in Figure 1.

8
Figure 1: Average monthly high and low temperatures in Dubai. (Ref: worldweatheronline.com)
The average daily sunshine hours and humidity for each month in Dubai are summarized in
Figure 2.

9
Figure 2 The average daily sunshine (up) and humidity (bottom) for each month in Dubai. (Ref:
worldweatheronline.com)
1.2 Sustainable Center of Excellence: the SCE Building
TSC contains the following sections:
Table 2: Buildings in the Sustainable City of Dubai.
1- Buffer Zone 7- Eco-Resort & Spa
2- Equestrian Centre 8- Country Club
3- The Central Green Spine 9- School
4- Residential Clusters 10- Science Museum & Planetarium
5- Community Mall 11- Sustainability Centre of Excellence
6- Mosque
The various sections are shown in the following schematic of the city (Figure 3). The location of
TSC is shown in Figure 4. The approximate GPS location of the city is 25.029332, 55.280821.

10
Figure 3: The general plan of TSC
Figure 4: Location of TSC.
11
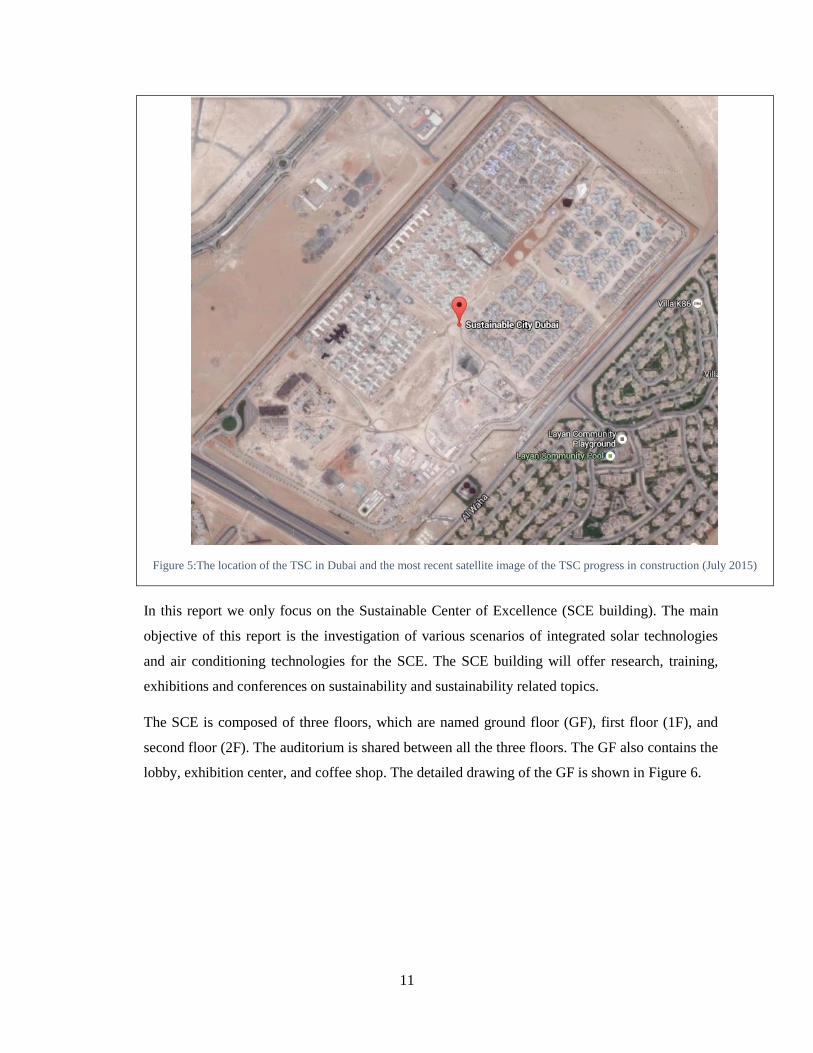
Figure 5:The location of the TSC in Dubai and the most recent satellite image of the TSC progress in construction (July 2015)
In this report we only focus on the Sustainable Center of Excellence (SCE building). The main
objective of this report is the investigation of various scenarios of integrated solar technologies
and air conditioning technologies for the SCE. The SCE building will offer research, training,
exhibitions and conferences on sustainability and sustainability related topics.
The SCE is composed of three floors, which are named ground floor (GF), first floor (1F), and
second floor (2F). The auditorium is shared between all the three floors. The GF also contains the
lobby, exhibition center, and coffee shop. The detailed drawing of the GF is shown in Figure 6.
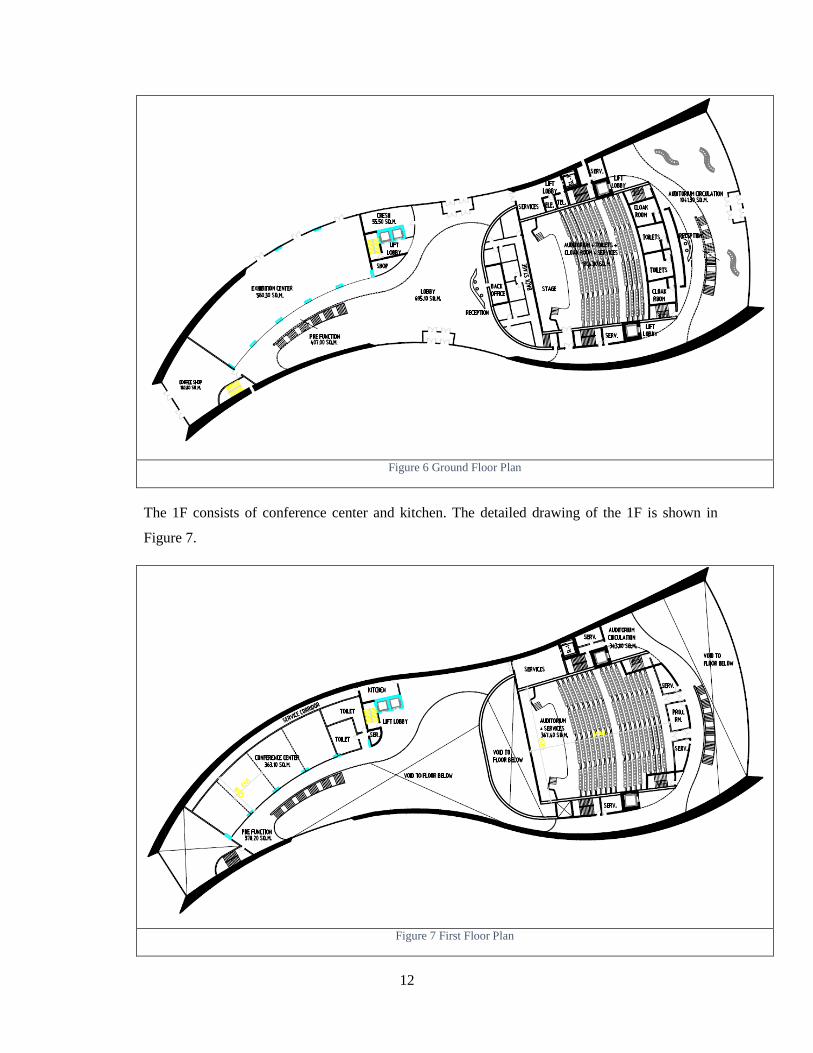
12
Figure 6 Ground Floor Plan
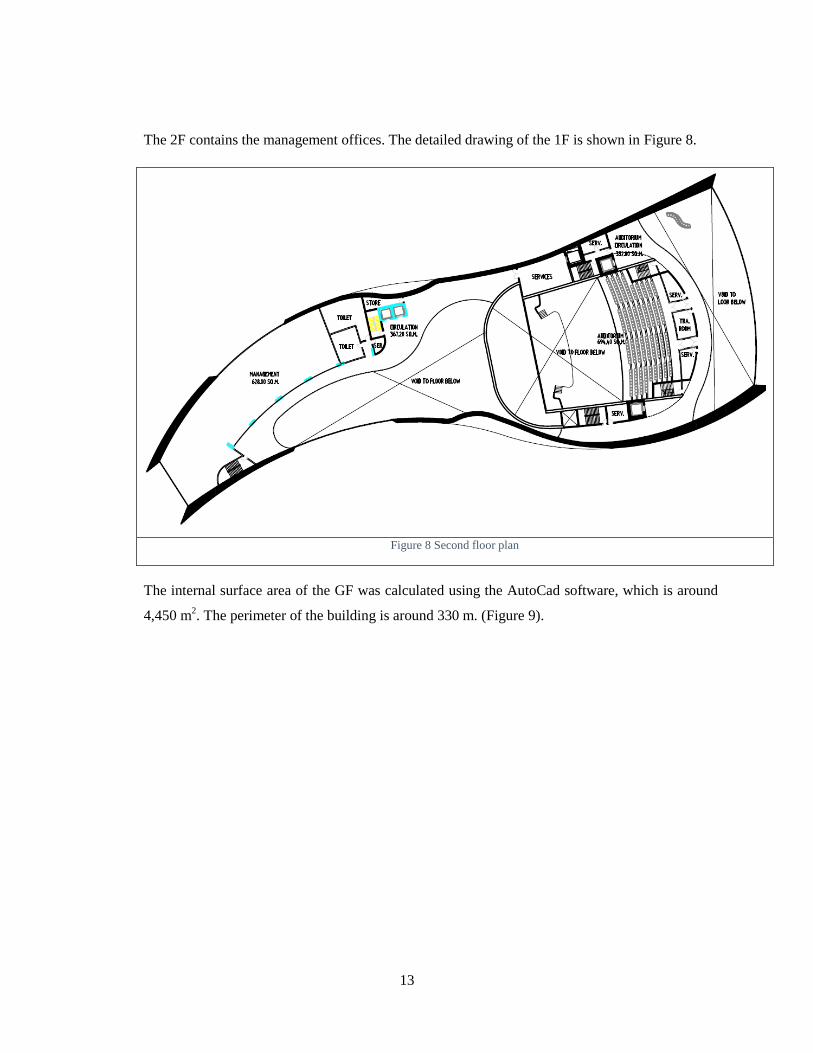
The 1F consists of conference center and kitchen. The detailed drawing of the 1F is shown in
Figure 7.
Figure 7 First Floor Plan
13
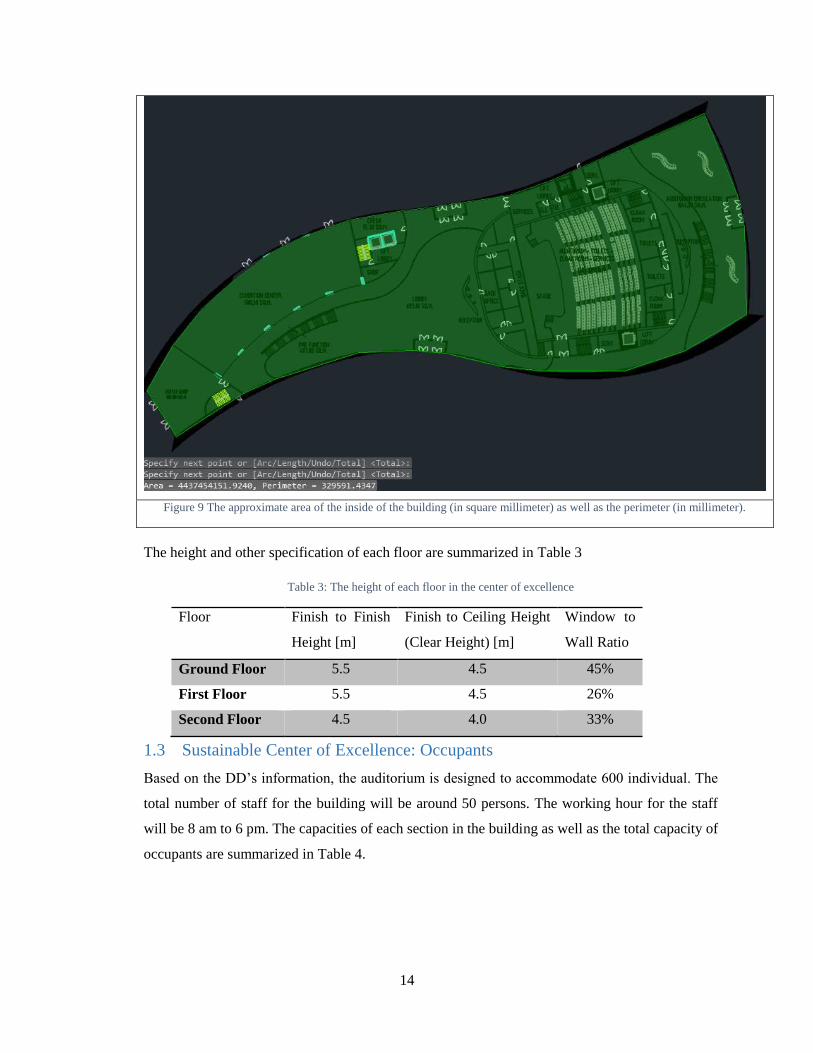
The 2F contains the management offices. The detailed drawing of the 1F is shown in Figure 8.
Figure 8 Second floor plan
The internal surface area of the GF was calculated using the AutoCad software, which is around
4,450 m2. The perimeter of the building is around 330 m. (Figure 9).
14
Figure 9 The approximate area of the inside of the building (in square millimeter) as well as the perimeter (in millimeter).
The height and other specification of each floor are summarized in Table 3
Table 3: The height of each floor in the center of excellence
Floor Finish to Finish
Height [m]
Finish to Ceiling Height
(Clear Height) [m]
Window to
Wall Ratio
Ground Floor 5.5 4.5 45%
First Floor 5.5 4.5 26%
Second Floor 4.5 4.0 33%
1.3 Sustainable Center of Excellence: Occupants
Based on the DD’s information, the auditorium is designed to accommodate 600 individual. The
total number of staff for the building will be around 50 persons. The working hour for the staff
will be 8 am to 6 pm. The capacities of each section in the building as well as the total capacity of
occupants are summarized in Table 4.

15
Table 4 The capacity of each section in the building
Location Capacity for People
Auditorium 600
Conference Hall (Four Halls) 4 x 30 = 120
Exhibition Hall 230
Management Offices 200
Total Occupants 1150
1.4 Sustainable Center of Excellence: Energy Demand
According to the sponsor’s comments, the following criteria were considered for our calculations:
Electricity need of the building: 90 kWh/m2 per year
System oversize: 140% (The reason is to make sure that the energy balance is not only
on the yearly operation but also on the life cycle of the building. The sponsor wants to
account the building energy from cradle to grave of 50 years.)
The following table summarizes the surface area of each section in each floor. The required annual energy
for the building was calculated based on the 90 kWh/m2. Therefore, considering 40% over design, the
total annual electrical energy demand for the Center of Excellence is 975 MWh.
Table 5 The surface area and the electrical energy demand of each section of the SCE building.
Locations Surface
Area (m2)
Annual Electricity Requirement
(MWh/yr)
40% Over Design
(MWh/yr)
Ground Floor
1.1 Coffee Shop 180.8 16.272 22.78
1.2 Exhibition Center 580.3 52.227 73.12
1.3 Pre Function 407 36.63 51.28
1.4 Crèche 55.5 4.995 6.99
1.5 Lobby 695.1 62.559 87.58
1.6 Auditorium + Toilets + Cloak Room + Services
1304 117.36 164.30
1.7 Auditorium Circulation 1041.3 93.717 131.20
Total GF 4264 383.76 537.26
First Floor
2.1 Pre Function 378.2 34.038 47.65
2.2 Conference Center 363.1 32.679 45.75
2.3 Auditorium + Services 367.4 33.066 46.29
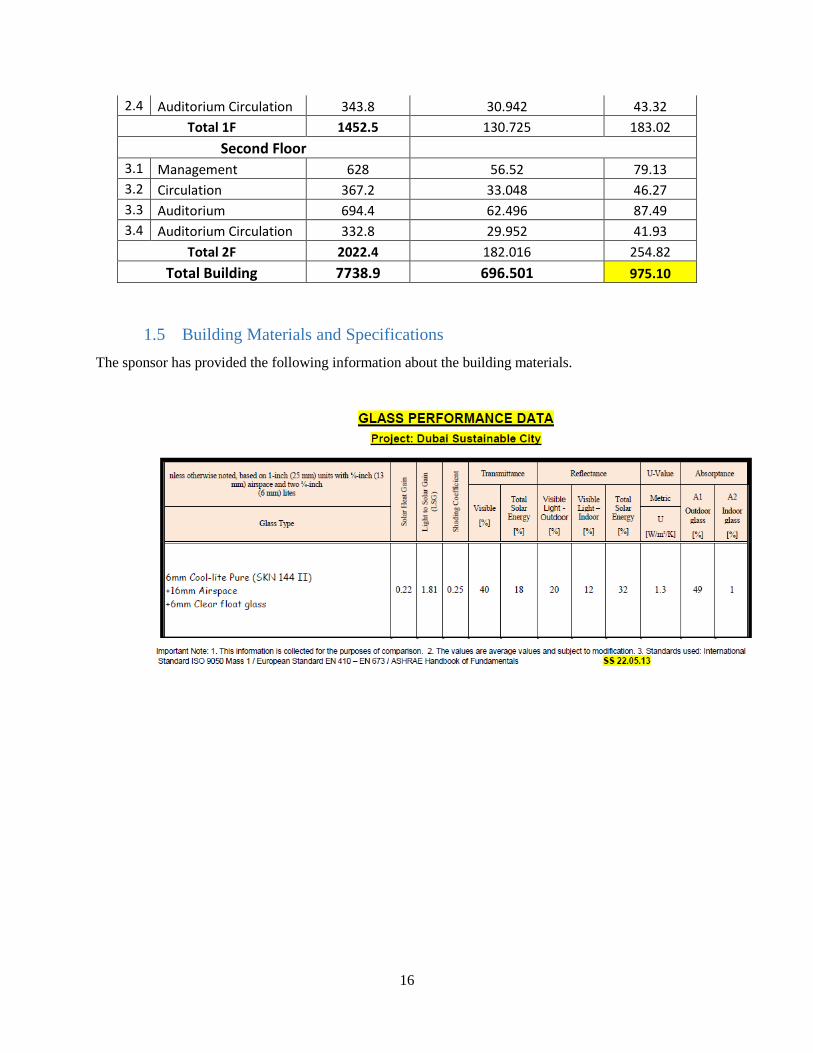
16
2.4 Auditorium Circulation 343.8 30.942 43.32
Total 1F 1452.5 130.725 183.02
Second Floor
3.1 Management 628 56.52 79.13
3.2 Circulation 367.2 33.048 46.27
3.3 Auditorium 694.4 62.496 87.49
3.4 Auditorium Circulation 332.8 29.952 41.93
Total 2F 2022.4 182.016 254.82
Total Building 7738.9 696.501 975.10
1.5 Building Materials and Specifications
The sponsor has provided the following information about the building materials.

17
18
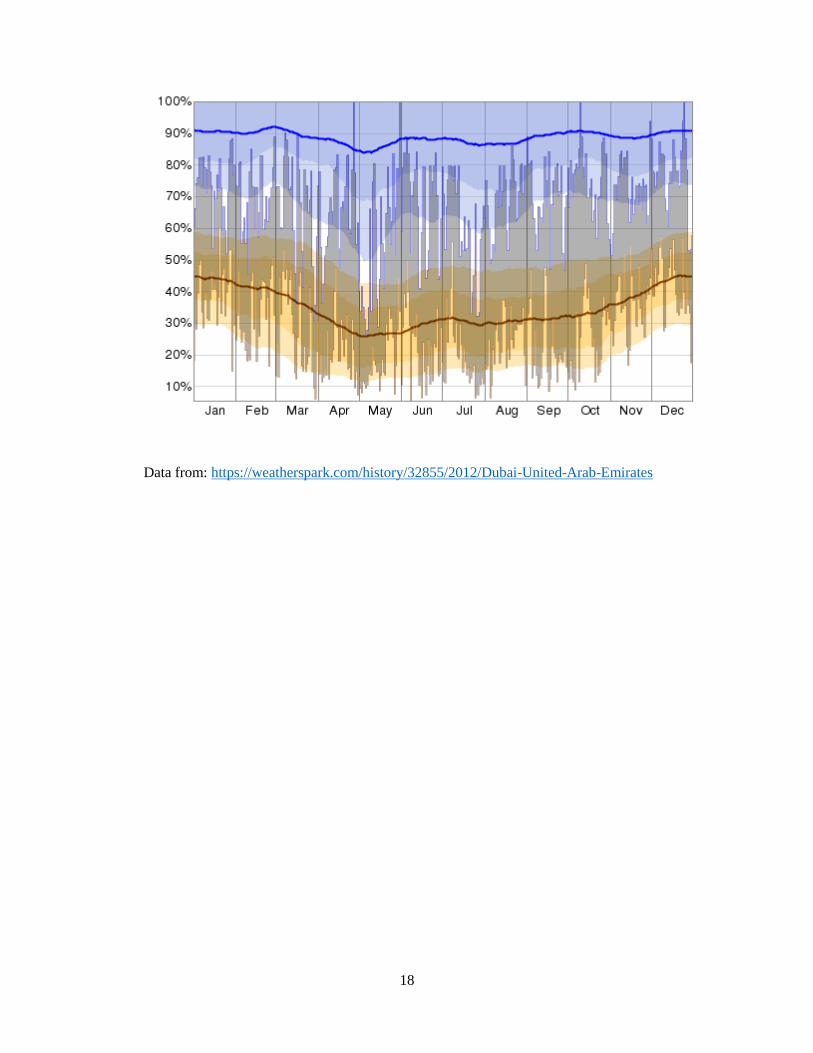
Data from: https://weatherspark.com/history/32855/2012/Dubai-United-Arab-Emirates

19
2 Project Background
2.1 Introduction
The continuing rise in energy demand, costs as well as associated climate change and
environmental problems, have increased emphasis on the design of energy efficient and renewable driven
air conditioning systems for both industrial and comfort applications. Buildings are responsible for
approximately 40% of the world’s total annual energy consumption.1 In hot and humid climates such as
Dubai, large portion of the building energy consumption is dedicated to the air conditioning (AC). The
AC increases the Dubai’s energy consumption by 60% during the summer months.2 The high solar
irradiance intensity of Dubai provides the opportunity of using solar technologies for air conditioning.
When considering solar-assisted systems for small scale residential or office building applications, the
area requirements for solar collectors and the capital cost associated with it render the use economically
infeasible when compared with conventional air conditioning systems. This report evaluates hybrid solar
powered air conditioning systems to provide the energy demand for building cooling, dehumidification
and electric power. Therefore, the systems contain absorption chiller, desiccant dehumidification wheel,
and hybrid photovoltaic-thermal technologies.
2.2 Thermally Driven Air Conditioning
Thermally driven cooling cycles for air conditioning can work with various sources of thermal
energy such as solar thermal and waste heat. Thermally driven cooling systems are composed of an
absorption chiller. In climates with high humidity, solid or liquid desiccant dehumidification systems can
be integrated to the system These cycles have the advantage that they can be operated at low temperatures
5-6 C. Ghaddar et al. (1997) reported results on a hybrid small-size absorption cooling system where for
each ton of refrigeration it is required to have a minimum solar collector area of 18.2 m2 with an optimal
water storage tank capacity of 1500 liter. Homoud et al. (1996) reported the installation of three 35 kW
LiBr/H2O absorption chillers for an office building in Kuwait using 300 m2 of flat plate water collectors
and a vertical hot water tank of 20 m3. Fong et al. (2011) reported energy savings of more than 35%
compared with conventional air conditioning systems when using solar hybrid system coupled with
chilled water from absorption refrigeration. The ventilation load (largely latent) provided by desiccant
dehumidification while utilizing solar energy for driving the absorption chiller and regenerating the
desiccant.
1 http://www.c2es.org/technology/overview/buildings
2 http://www.thenational.ae/uae/air-conditioning-heats-up-energy-bills

20
Prof Ghaddar and her colleague Prof. Ghali have an extensive and impressive research in applications that
improve efficiency of systems for heating, cooling and water production, human comfort, and clothing
design. Some of the areas of expertise and previous experiences of Prof. Ghaddar and her team can be
summarized in the following points:
1- Localized cooling devices to improve overall thermal comfort indoor and outdoor
The focus of the work is to improve the productivity and the well being of people in both indoor and
outdoor environmental conditions at minimal energy cost. In indoor applications, the aim is to deliver
thermal comfort and good air quality to the occupant at low energy cost (task ventilators, personalized
coolers, clothing design, air cleaning systems, smart space, online HVAC control, hybrid air conditioning
systems). The applications of the bioheat model and predictive models of local and global comfort
enabled addressing important problems that may help approach the zero-net energy building target.
2- Hybrid renewable Energy Systems: Solar-powered air-conditioning liquid desiccant system is a
hybrid system that has been researched to assess if the two needs of fresh water and air conditioning can
be met by use of this system while entirely powered by solar energy in Beirut humid climate. This work
focused on the feasibility of using a solar-powered liquid desiccant system to meet both needs at
minimum cost. We have set up an experimental station connected with the two outdoor climatic chambers
to test the concept and assess comfort conditions in the space while using the dry air stream from the
liquid dehumidifier to supply fresh air to the space.
3- Development of space thermal models for heating and cooling integrated with system models and
bioheat models to improve energy efficiency.
HVAC equipment running cost contributes to more than 35%-40% of the total energy consumption in
buildings. Thermal comfort and indoor air quality (IAQ) for a given space can be provided by different
types of HVAC systems that consume different amounts of energy. We have considered several
applications for improving energy efficiency of heating and cooling systems of buildings.
2.3 PV/T Technology
There are two major challenges with the PV panels. More than 85% of the solar energy cannot be
captured by the PV panels. The hot environment of the Dubai decreases the efficiency of the PV panels.
In order to solve these challenges PV/T panels can be replaced by PV panels. Replacing the PV panels
with PV/T panels has the advantage of simultaneous production of hot water and electricity. Additionally,
the cooling system in PV/T technology decreases the temperature of PV panels and therefore, the

21
efficiency of the electricity production is increased. The combined heat and electricity increases the
efficiency of the solar technology by capturing around 80% of the solar radiation energy.
Photovoltaic thermal technology offers the advantage of providing both high-grade electrical energy and
low-grade thermal energy. The increased electrical energy due to cell cooling, and the high thermal
efficiency of the PV/T panel make the latter a more attractive alternative to conventional electricity, and
make the panels more cost competitive since increased energy yield means a shorter payback period.
PV/T applications are numerous and PV/T panels can be used in practically any application requiring
low-grade thermal energy. Cooling of PV panels can be done by air or water medium. Cooling using
water has higher thermal efficiencies due to higher heat transfer coefficients, but requires special design
and manufacturing considerations, such as fluid tubes, and thermal expansion of the fluid.
The air-cooled panels are regular PV panels, provided with an air channel, and the various designs
include: single air passage above or below the absorber, two air passages above and below the absorber in
a single-pass or a double-pass. According to Hegazy (2000), numerical solutions of the energy balances
show that the single air pass above the absorber has the lowest performance as compared to cooling the
lower absorber side or the two sides of the absorber (above and below) in a single or double passes.
Cooling the panels by air was studied also by Garg and Adhihri (Garg et al., 1999), who found that
thermal and electrical outputs are directly proportional to collector length, airflow rate and packing factor,
and inversely proportional to duct length. In another work, the combined effect of the airflow rate, the air
channel depth, the length and the packing factor on the efficiency and outlet temperature was evaluated
by Prakash (1994). The output temperature decreased with increasing the mass flow rate, while the
thermal efficiency increased. To improve the performance of air-cooled PV/t panels, the addition of fins
was considered in several papers. For example, Kumar and Rosen (2011) evaluated the performance of a
double-pass PV/t solar air heater with and without fins. They found out that the addition of fins in their
model increased the thermal and electrical efficiencies to 15.5% and 10.5%. Other studies conducted by
Tonui and Tripanagnostopoulos (2007) showed that adding a suspended plate to enhance heat transfer to
the air, increased the energy efficiency from 25% to 28%, while adding fins allowed the energy efficiency
to reach 30%. So replacing the PV panels with PV/T panels has the advantage of simultaneous production
of hot water and electricity. The combined heat and electricity increases the efficiency of the solar
technology by capturing around 80% of the solar radiation energy.
The PV/T panels will be considered to minimize the seasonal energy cost (electrical and thermal) of
residence in Dubai City. The project focuses on optimizing the required airflow that will enhance

22
electrical output of the PV/T panels and minimize the thermal heating needs for regenerating the
desiccant wheel during the summer cooling season. Given the limited options for getting cool air stream
due to Dubai high ambient air temperature, we use exhaust return flow to cool the PV panel.
The objectives for the PVT system sizing and utilization in Dubai residential units can be summarized as
follows: 1) Use a simulation model to predict the performance of the PV/T panels at different ambient
conditions and cooling air flow rates for Dubai weather. 2) Integrate the PV/T model with a space model,
a desiccant model and an evaporative cooler model to predict the energy performance of the combined
system and 3) Size and optimize the system’s operation for lowest operating cost while maintaining
thermal comfort.
2.3.1.1 Use of solar powered desiccant dehumidification system to decouple humidity removal from
sensible cooling in the air conditioning system
Dubai climate is known for its high relative humidity during most of the year. Extreme levels of relative
humidity can irritate people's comfort [Yang et al. (2014)]. In humid climates, the humidity issues are a
major contributor to energy inefficiency in HVAC devices. The high humidity of the outside air combined
with ventilation requirement increases the latent load. Most conventional air-conditioning systems are not
designed to independently control temperature and humidity. The conventional way of moisture removal
is cooling the indoor air (using vapor compression cycle) to temperatures below its dew point temperature
to condense the excess moisture followed by reheating to the adequate supply air temperature. This is an
energy intensive process [Bahman et al. (2012)]. Recently, research has been oriented towards
considering non-conventional, passive and less-intensive methods for controlling indoor humidity. A
known sustainable dehumidification technique is the use of desiccant technology as a passive method for
HVAC applications [Ghaddar et al. (2003), Audeh et al. (2011), Li et al. (2011), Wang et al. (2013), El-
Deeb et al. (2009)].
Conventional desiccant dehumidification techniques utilize solid or liquid desiccant based systems. In the
case when a liquid desiccant is used, dehumidification and regeneration tower beds are employed [Li et
al. (2011), Audi et al. (2012)], whereas in the case of a solid desiccant, a rotary desiccant wheel is used
[Wang et al. (2013)]. An attractive feature of desiccant dehumidification systems is their suitability for
solar or other low-grade thermal energy applications [Ghaddar et al. (2003, Wang et al. (2011)].
A solid desiccant dehumidification system will be sized and integrated with an absorption chiller system
to air condition the space. The hybrid system will be totally powered by solar energy that provided
regeneration heat needed for the absorption chiller [Ghaddar et al. (1997)] and the dehumidification solid

23
desiccant wheel as shown in Fig. 1 that integrates PV/T, desiccant dehumidification, and sensible cooling
(absorption chiller) to provide space cooling needs and power needs.
2.3.2 Thermal Comfort
Thermal comfort is a subjective evaluation of one’s satisfaction with the thermal
environment. Comfort roughly equates to thermal neutrality, whereby occupants are neither
losing nor gaining heat from their environment, but instead, are able to maintain equilibrium with
the ambient conditions. In essence, with thermal neutrality, the body does not have to expend
energy to stay warm or to cool off. Thermal comfort is important because it affects occupants’
health, happiness, and productivity.
Providing thermal comfort to occupants is the primary objective of conditioning indoor
spaces. A widely accepted guideline for doing so is provided by ASHRAE Standard 55,
produced by the American Society of Heating, Refrigerating, and Air-Conditioning Engineers.
The stated purpose of ASHRAE Standard 55 is "to specify the combinations of indoor thermal
environmental factors and personal factors that will produce thermal environmental conditions
acceptable to a majority of the occupants within the space".(ASHRAE, 2010) Thus, many of the
specific details on how thermal comfort is measured and what influences it are derived from
ASHRAE Standard 55.
Delivering thermal comfort to many occupants simultaneously is difficult because
thermal comfort is highly individual, and there are many factors that drive thermal comfort.
They can be broadly categorized as either environmental or personal factors.
Environmental factors influencing thermal comfort include air temperature, mean radiant
temperature (derived from heat transferred from a surrounding surface), air speed and humidity.
In general, humans feel relatively warmer as air temperature, radiant temperature and humidity
increases, and as air speed decreases.
The typical personal factors considered include individuals’ metabolic rate and clothing
level. The metabolic rate is a function of human physiology (which includes elements such as
age, gender, body mass, metabolism, and dietary intake) and activity level. The metabolic rate is
expressed in units of “met”, where 1 met = 58.2 W/m² (or 18.4 Btu/h·ft²). ASHRAE provides
estimates for the met value of various activity levels (e.g., 1.0 met for reading or writing while

24
seated, 1.2 for standing relaxed, 1.7 for walking about) undertaken by an “average person”.
(ASHRAE, 2013a)
The insulation humans receive from clothing also affects thermal comfort by preventing
heat loss. The insulation provided by clothing is measured in a unit called a clo value, where 1
clo = 0.155 m²•°C/W (or 0.88 ft²•h•°F/Btu). This is equivalent to the insulation provided by
trousers, a long sleeved shirt, and a jacket, according to ASHRAE Standard 55.
There is also evidence that assessments of thermal comfort have a psychological
component. The human body is highly adaptable, and comfort can be measured (and interpreted)
in absolute terms or in relative or conditional terms. For example, there is evidence that
expectations influence one’s reporting of thermal comfort. Thus, seasonal outdoor temperature
shifts often affect occupants’ expectations of indoor conditions such that thermal comfort, as
they assess it, is associated with slightly higher or lower indoor temperatures throughout the
year, and even throughout the day. (Mishra & Ramgopal, 2013).
Numerous studies have also demonstrated that occupants’ control (or perceived control)
over indoor conditions can also affect occupants’ assessment of thermal comfort. For example,
Karjalainen (2009) found a strong correlation between satisfaction with room temperature and
the perceived level of control over room temperature. This finding was statistically significant in
both home and office environments.
Although norms about spacing conditioning differ substantially around the world, it is
generally accepted that significant cultural differences in thermal comfort do not exist. Indeed,
intra-group differences typically exceed inter-group differences. However, there are cultural
differences in the social norms governing factors such as clothing, body mass, and nutritional
intake, which in turn affect thermal comfort. Thus, when attempting to determine or establish
acceptable indoor conditions, it is important to keep cultural factors in mind. For example, a
field study by Al-Rashidi et al. (2009), found that the comfortable classroom temperatures
differed for boys and girls, something previous studies cited had not reported. The authors found
this by properly accounting for the separation of classrooms by gender (as is the custom) and
differing clo values associated with the boys’ and girls’ mandatory uniforms.
25
While many factors influence thermal comfort, as described above, measuring thermal
comfort is fairly straightforward. Typically, at least two dimensions of thermal comfort are
measured: thermal sensation and comfort. ASHRAE’s thermal sensation measure, for example,
is a 7-point scale where -3 = cold, -2 = cool, -1 = slightly cool, 0 = neutral, +1 = slightly warm,
+2 = warm, and +3 = hot. This scale has been used by many empirical studies of thermal
comfort around the world, although it is by no means the only one.(Zhang, 2003)
Separate from thermal sensation, individuals are often asked to assess their comfort.
ASHRAE’s 9-point scale ranges from −4 (intolerably cold) to +4 (intolerably hot). Other
comfort scales ask about satisfaction with,(Hoyt et al, 2013) or the acceptability, comfort
(Zhang, 2013) or tolerability of, the indoor temperature, without reference to the thermal
sensation.
Some acceptability scales explicitly acknowledge the fact that thermal comfort can be
considered in relative terms. For example, prior UC Davis research has shown that the
acceptability of a given indoor temperature can depend in part on the other parameters over
which an occupant is attempting to maximize utility, i.e., balancing comfort with energy cost or
environmental impact of energy use. There is some evidence to suggest that individuals are
willing to extend their normal boundaries of acceptability to make allowances when thermal
comfort is delivered in more environmentally benign manners (e.g., natural ventilation, solar-
powered air conditioning).(Outcault, et al., 2014)
To measure thermal comfort on an aggregate level, data from thermal sensation ratings
are compiled across a group of occupants. Two commonly used indicators derived from thermal
sensation data are:
Predicted mean vote (PMV), defined by ASHRAE as “an index that predicts the mean
value of the votes of a large group of persons on the seven-point thermal sensation scale”;
and
Predicted percentage of dissatisfied (PPD), defined by ASHRAE as “an index that
establishes a quantitative prediction of the percentage of thermally dissatisfied people
determined from PMV”.
26
Both PMV and PPD are used to establish guidelines for space conditioning, such that
thermal comfort can be optimized across many (potentially diverse) occupants.
There are numerous ways to consider the various types of data collected on occupants’
thermal comfort. An example of a fairly comprehensive tool is the interactive web-based tool
created by the University of California-Berkeley’s Center of the Built Environment to predict
thermal comfort (using ASHRAE Standard 55). The tool allows users to adjust the indoor air
temperature, radiant temperature, air speed, humidity, and occupants’ metabolic rate and clothing
level. The model then generates an estimate of the PMV and the PPD among occupants.
ASHRAE sells a software tool that has similar capabilities (ASHRAE, 2013b). Both tools are
consistent with ASHRAE Standard 55-2010.
When developing new instruments to measure thermal comfort in a particular
environment (e.g., thermal comfort surveys), it is important to consider local conditions and, to
the extent possible, utilize established scales for measuring concepts such as thermal sensation
and comfort. The latter generates data that is both valid and reliable, and facilitates comparisons
with previous studies.
By using the weather data and the online thermal comfort calculator only January and
February meet the requirement of thermal comfort based on the ASHRAE 55-2010 standard. The
results of the thermal comfort modeling for January, February, and March are shown in the
following figures. Therefore, ten months in Dubai the air conditioning is required.
Sponsor mentioned the 22 oC as a set point for temperatures. However, we will provide
some guidance about the set temperature of each room at each season in our final report.

27
Figure 10

28
The thermal comfort modeling for January (top), February (middle), and March (bottom) using
the comfort tool and ASHRAE-55-2010 standard.
2.3.3 Solar-based Absorption Chillers
In general, a single-effect absorption chiller has a rough coefficient of performance (COP) of 0.65
and requires a heat source at a temperature of 90o C. On the other hand, a double effect absorption
chiller has a COP of 1.2 and a heat source at a temperature of 200 C. Therefore in the proposed
chiller system, it is recommend to use single effect absorption chiller (lower temperature heat
source). Below are some comments:
• To prevent crystallization of the LiBr in the absorption chiller, a cooling tower is needed
to deliver cooled water to the absorption condenser at a temperature of 34 C and the water
returning to the cooling tower at 39 C. The design environmental conditions in Dubai are 35 DB
and 30 WB. Please note that the design environmental conditions are taken for the highest WB
temperature and the coincident DB temperature. The highest outdoor temperature is taken as 46
C. Having chosen 30 oC WB and an approach temperature of 4 C for the cooling tower, the
supply cooling water coming out from the tower is chosen as 34 C.
• The low COP of the single effect means that large quantity of heat needs to be dissipated
in the cooling tower requiring large size of the tower and large quantity of water. Alternatively
we can use geothermal to dissipate the absorption-wasted heat to the soil. The temperature of the
desert soil is about 26 C. However, the first cost of installing absorption condenser dissipated
heat to the soil (bore holes) will be large. Another alternative is to use the rejected heat from the
condenser to preheat air for the desiccant dehumidifier and thus reduce solar captured thermal
energy. The sizing has to be done simultaneously for both chiller and dehumidifier.
2.3.4 Ventilation Requirements
There have been several standards for the ventilation requirements. However, the one that will be
used in this project will be ASHRAE standards. ASHRAE recommends a ventilation rate of 0.7
liter/second/m2 for occupancy of 0.08 person/m2. On the other hand, the minimum ventilation
requirement should be set per person in order to provide good and proper indoor air quality.
ASHRAE standards provide a range between 4 and 10 liter/second/person. For Dubai Center of
Excellence, since the metabolic rate is relatively low and the occupants are not doing any hard
physical actions, as well as smoking prohibition inside the building, the ventilation requirement
was set to 4 liter/s/person. The minimum exhaust rate is set to 3.5 liter/s/m2. The relative
humidity of the ventilated space should be maintained between 30% and 70%. Finally, any

29
ventilation system should remove a maximum of 40 W/m2 of heat with a vertical temperature
gradient of around 1.5 C/m.
2.4. References
Al-Rashidi, K. E., Loveday, D. L., & Al-Mutawa, N. K. (2009). Investigating the applicability of different
thermal comfort models in naturally ventilated classrooms in Kuwait. In Proceedings of the Engineering
Congress on Alternative Energy Applications, EC2009, Kuwait.
ASHRAE. (2010). " Standard 55: Thermal Environmental Conditions for Human Occupancy".
ASHRAE. (2013a). “ANSI/ASHRAE Addendum g to ANSI/ASHRAE Standard 55-2010”.
ASHRAE. (2013b). Thermal Comfort Tool, Version 2. ASHRAE, https://www.ashrae.org/resources--
publications/bookstore/thermal-comfort-
tool?utm_source=promotion&utm_medium=landingpage&utm_campaign=86179&utm_term=86179&ut
m_content=86179.
Hoyt, T., Schiavon, S., Piccioli, A., Moon, D., and K. Steinfeld. (2013), CBE Thermal Comfort Tool.
Center for the Built Environment, University of California Berkeley, http://cbe.berkeley.edu/comforttool/.
Karjalainen, S. (2009). Thermal comfort and use of thermostats in Finnish homes and offices. Building
and Environment, 44(6), 1237-1245.
Outcault, S., Heinemeier, K., Kutzleb, J., Pritoni, M. and Q. Wang. (2014) “A Tale of Two Cities:
Comparative Cooling Strategies in Japan and the US”. Research poster presented at Behavior, Energy
and Climate Change (BECC) Conference 2014. Available online at: http://wcec.ucdavis.edu/wp-
content/uploads/2014/12/BECC-2014-Poster_TaleofTwoCities_esogo_WestVillage_PRINT_v2.pdf.
Mishra, A. K., & Ramgopal, M. (2013). Field studies on human thermal comfort—An overview. Building
and Environment, 64, 94-106.
Zhang, H. “Human thermal sensation and comfort in transient and non-uniform thermal environments”,
PhD thesis, University of California, Berkeley, 2003.
30
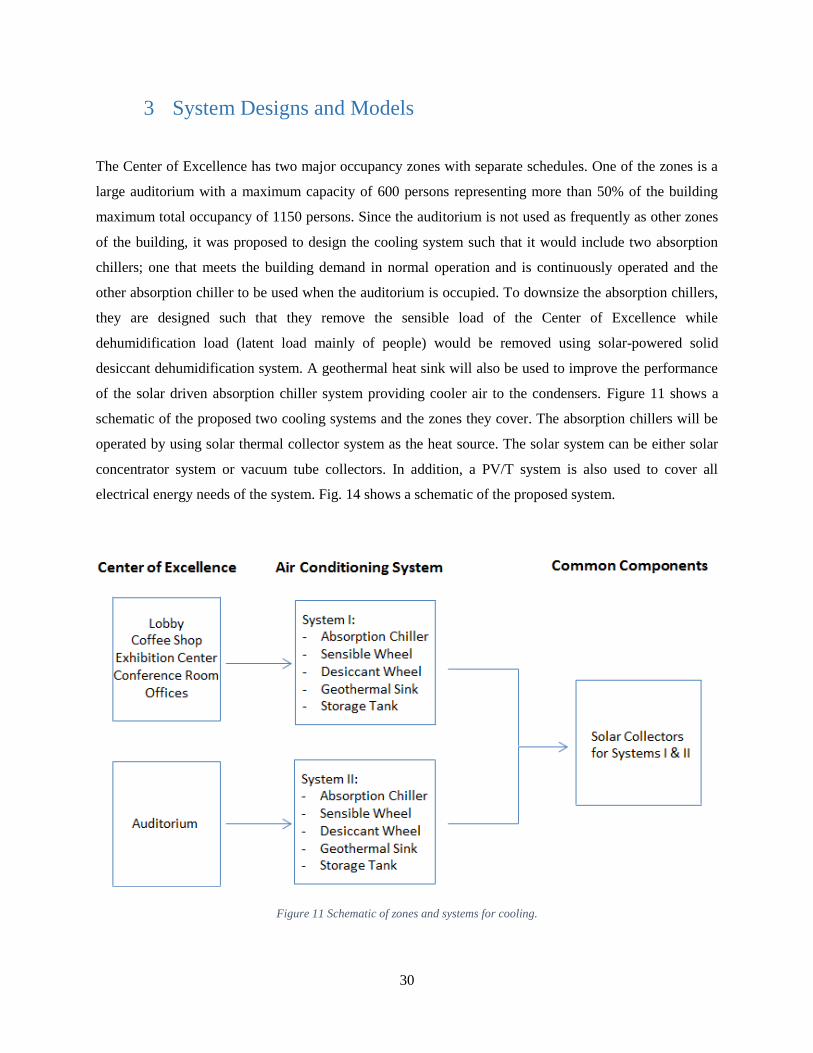
3 System Designs and Models
The Center of Excellence has two major occupancy zones with separate schedules. One of the zones is a
large auditorium with a maximum capacity of 600 persons representing more than 50% of the building
maximum total occupancy of 1150 persons. Since the auditorium is not used as frequently as other zones
of the building, it was proposed to design the cooling system such that it would include two absorption
chillers; one that meets the building demand in normal operation and is continuously operated and the
other absorption chiller to be used when the auditorium is occupied. To downsize the absorption chillers,
they are designed such that they remove the sensible load of the Center of Excellence while
dehumidification load (latent load mainly of people) would be removed using solar-powered solid
desiccant dehumidification system. A geothermal heat sink will also be used to improve the performance
of the solar driven absorption chiller system providing cooler air to the condensers. Figure 11 shows a
schematic of the proposed two cooling systems and the zones they cover. The absorption chillers will be
operated by using solar thermal collector system as the heat source. The solar system can be either solar
concentrator system or vacuum tube collectors. In addition, a PV/T system is also used to cover all
electrical energy needs of the system. Fig. 14 shows a schematic of the proposed system.
Figure 11 Schematic of zones and systems for cooling.
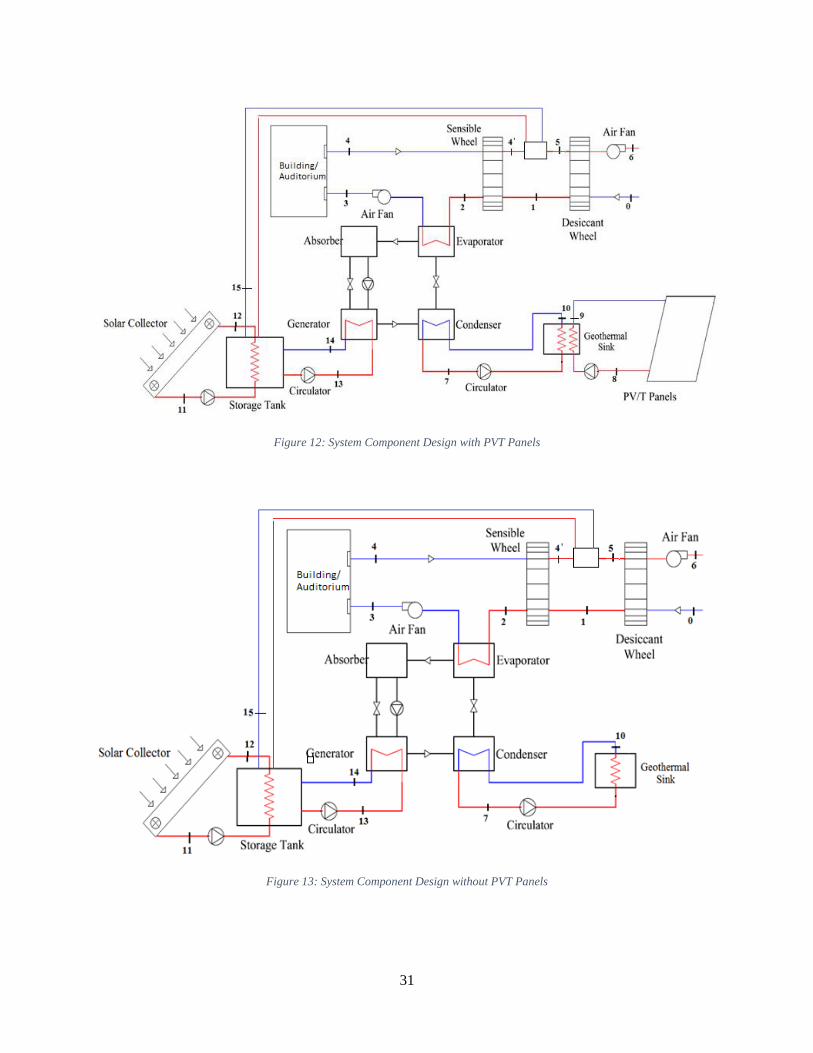
31
Figure 12: System Component Design with PVT Panels
Figure 13: System Component Design without PVT Panels

32
Table 6 demonstrates the scenarios that were studies for the purpose of meeting thermal comfort
requirements in the space. Scenario 4 is the adopted system for which the system has been designed and
sized.
Table 6: Progress of systems to suit the project application.
No. Scenario Description
1 Personalized Cooling
Air Conditioning
System
One of the earliest considered scenarios; it is based on
the idea of increasing the supply air temperature (in
order to decrease the HVAC demand) and provide
personalized cooling for the occupants. This scenario
was found useful in offices rather than in large
centers.
2 PV/T panels and one
absorption chiller
This scenario includes the usage of PV/t panels in
order to produce the needed electricity demand for the
center of excellence. The absorption chiller is used to
meet the sensible cooling demand of the building. A
desiccant wheel for dehumidification purposes has
been also added. However, due to the presence of two
different cooling loads (auditorium and rest of the
building) it was found to be impractical. Lastly, the
condenser of the chiller needed large amounts of heat
removal, which is why a new scenario had to be
introduced.
3 PV/T panels with two
absorption chiller and
geothermal sink
It was decided to use two absorption chillers (one for
the auditorium and one for the rest of the building) in
order to accurately meet the cooling loads as any
deviations from the calculated load will sacrifice the
efficiency of the chiller. Moreover, a geothermal sink
had to be introduced in order to remove large amounts
of heat from the cooling water that is passing through
the condensers of the chillers. However, one hurdle
was faced; the hot water had to be maintained at high
temperature in order to be supplied to the generators
of the chiller. Once again, this scenario had to be
subjected to further changes.
4 PV/T panels, two
absorption chillers,
geothermal sinks and
evacuated tube solar
collectors
This scenario is based on the last scenario but with the
addition of solar collectors in order to keep the hot
water at high temperatures in order to be supplied to
the generators of the chillers. Evacuated tube solar
collectors have been chosen because the sponsor had
extensive knowledge and achievements in this field.
5 PV panels instead of
PV/T, two absorption
chillers, geothermal
sinks and evacuated
tube solar collectors
This is similar to scenario 4 but using PV instead of
PV/T. The hot water stream from the PV/T is at
relatively low temperature (below 45 C) which does
not justify the added cost for using it in the building
cooling systems that need a temperature above 70 C.
33
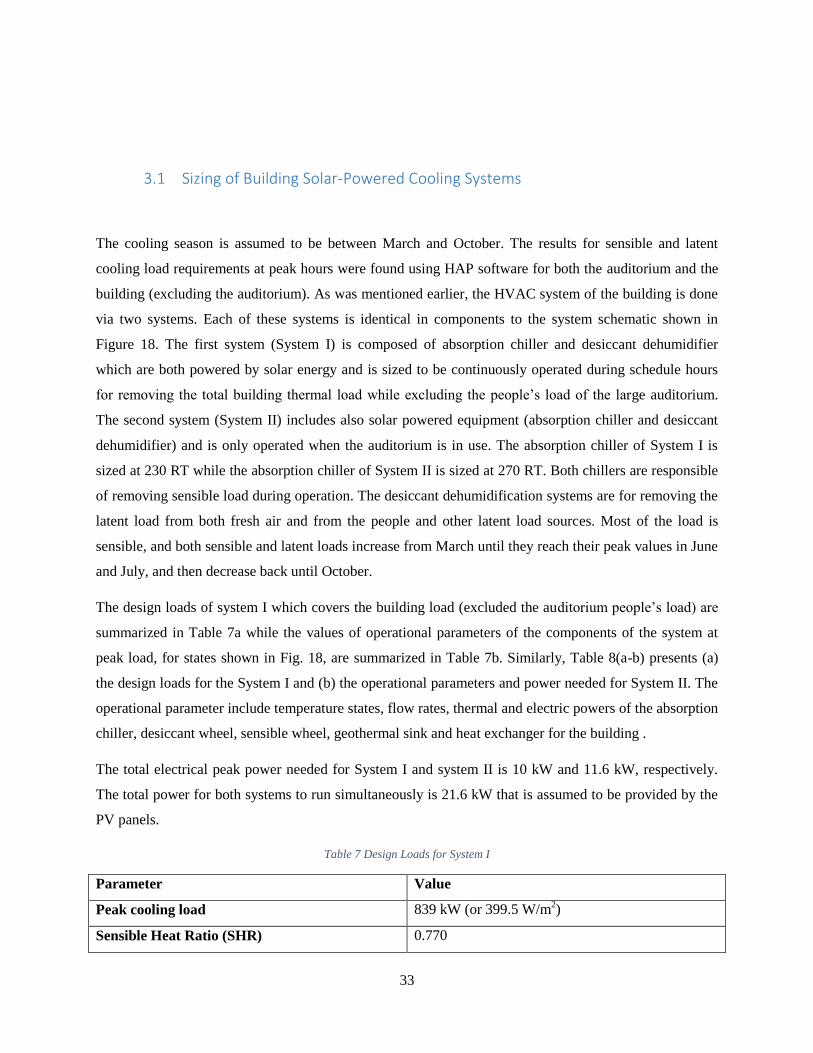
3.1 Sizing of Building Solar-Powered Cooling Systems
The cooling season is assumed to be between March and October. The results for sensible and latent
cooling load requirements at peak hours were found using HAP software for both the auditorium and the
building (excluding the auditorium). As was mentioned earlier, the HVAC system of the building is done
via two systems. Each of these systems is identical in components to the system schematic shown in
Figure 18. The first system (System I) is composed of absorption chiller and desiccant dehumidifier
which are both powered by solar energy and is sized to be continuously operated during schedule hours
for removing the total building thermal load while excluding the people’s load of the large auditorium.
The second system (System II) includes also solar powered equipment (absorption chiller and desiccant
dehumidifier) and is only operated when the auditorium is in use. The absorption chiller of System I is
sized at 230 RT while the absorption chiller of System II is sized at 270 RT. Both chillers are responsible
of removing sensible load during operation. The desiccant dehumidification systems are for removing the
latent load from both fresh air and from the people and other latent load sources. Most of the load is
sensible, and both sensible and latent loads increase from March until they reach their peak values in June
and July, and then decrease back until October.
The design loads of system I which covers the building load (excluded the auditorium people’s load) are
summarized in Table 7a while the values of operational parameters of the components of the system at
peak load, for states shown in Fig. 18, are summarized in Table 7b. Similarly, Table 8(a-b) presents (a)
the design loads for the System I and (b) the operational parameters and power needed for System II. The
operational parameter include temperature states, flow rates, thermal and electric powers of the absorption
chiller, desiccant wheel, sensible wheel, geothermal sink and heat exchanger for the building .
The total electrical peak power needed for System I and system II is 10 kW and 11.6 kW, respectively.
The total power for both systems to run simultaneously is 21.6 kW that is assumed to be provided by the
PV panels.
Table 7 Design Loads for System I
Parameter Value
Peak cooling load 839 kW (or 399.5 W/m2)
Sensible Heat Ratio (SHR) 0.770

34
Peak sensible load 645.7 kW (or 307.5 W/m2)
Latent load at peak sensible load 193.3 kW (or 92.0 W/m2)
Peak sensible load occurs on July at 16:00
Peak Latent Load 194.8 kW (or 92.8 W/m2)
Sensible Load at Peak Latent Load 634.9 kW (or 302.3 W/m2)
Peak Latent Load occurs on June at 16:00
Average cooling load over cooling season 587.1 kWh/cooling season
Average sensible load over cooling season 453.9 kWh/cooling season
Average latent load over cooling season 133.2 kWh/cooling season
Outside dry-bulb temperature 45.7 C
Outside wet-bulb temperature 29.9C
Resulting relative humidity 44%
Table 8 Power rating and operational parameters and states of System I at peak load
Component Sub-
component
Fluid Inlet
Temperature
(°C) – State
Number
Outlet
Temperature
(°C) – State
Number
Flow
Rate
(L/s)
Thermal
Power
(kW)
Electric
Power
(kW)
Absorption
Chiller
Generator Water 80 – State 13 72.4 – State 14 28.2 1175
9.1 Condenser Water 30 – State 10 37 – State 7 55.6 1881
Evaporator Air 53 – State 2 12 – State 3 4400 705.5
Desiccant
Wheel
Regeneration Air 71 – State 5 53 – State 6 4400 92.4 0.2
Supply Air 46 – State 0 67 – State 1 440
Sensible
Wheel
Supply Air 67 – State 1 53 – State 2 4400 61.7 0.2
Exhaust Air 22 – State 4 35.5 – State 4’ 4400
Geothermal
Sink
- Water 37 – State 7 30 – State 10 55.6 - -
Heat
Exchanger
- Water 80 – State 4’ 63.2 – State 5 3 212 0.5
Table 9 Design Loads for System II
Parameter Value

35
Peak cooling load 951.2 kW (or 404.7W/m2)
Sensible Heat Ratio (SHR) 0.865
Peak sensible load 822.6 kW (or 350.0 W/m2)
Latent load at peak sensible load 128.6 kW (or 54.7 W/m2)
Peak sensible and latent loads occurs at the same time
Peak sensible load and latent load occur on June at 4:00 pm
Average cooling load over cooling season 685.1 kWh/cooling season
Average sensible load over cooling season 599.8 kWh/cooling season
Average latent load over cooling season 85.3 kWh/cooling season
Outside dry-bulb temperature 45.2 C
Outside wet-bulb temperature 29.9C
Resulting relative humidity 43%
Table 10: Power rating and operational parameters and states of System II at peak load
Component Sub-
component
Fluid Inlet
Temperature
(°C) – State
Number
Outlet
Temperature
(°C) – State
Number
Flow
Rate
(L/s)
Thermal
Power
(kW)
Electric
Power
(kW)
Absorption
Chiller
Generator Water 80 – State 13 73.4 – State14 31 1281 10.7
Condenser Water 30 – State 10 36.3 – State 7 61.3 2050
Evaporator Air 53 – State 2 12 – State 3o 4800 769
Desiccant
Wheel
Regeneration Air 71 – State 5 51 – State 6 4800 101.3 0.2
Supply Air 46 – State 0 67 – State 1 4800
Sensible
Wheel
Exhaust Air 22 – State 4 35.5 – State 4’ 4800 67.5 0.2
Supply Air 67 – State 1 53 – State 2 4800
Geothermal
Sink
- Water 36.3 – State 7 30 – State 10 61.3 - -
Heat
Exchanger
- Water 80 – State 4’ 63.2 – State 5 3 212 0.5

36
3.2 HVAC Electric Load Calculation
The electricity peak power of the HVAC systems should also be added to building electricity demand to
obtain the total electricity requirements of building and systems as presented in Table 11.
Table 11: Building peak electric demand.
Component Maximum Electric Peak Demand (kW)
Auditorium HVAC System 11.6
Building (Excluding Auditorium)
HVAC System
10.0
Total HVAC Electrical Demand 21.6
Note that the electric requirements of the chillers presented in Tables 8 and 10 consist of the electric
needs for the chiller itself, cooling water pump, chilled water pump and the hot water pump. The need of
each component varies from one vendor to another depending on many design criteria followed by the
manufacturers. The power need for each pump typically ranges between 0.5 kW and 3 kW. The sensible
and desiccant wheels power requirements are those needed to power their motors only. For this reason,
they require minimal power (less than 1 kW). Lastly, the heat exchanger requires power to drive the two
exchanging streams and such large components typically require less than 8 kW. In order to estimate how
much power is needed for each component in our HVAC system we used product specifications of similar
components. Such information can only be obtained from product specs of similar components (with similar
capacity, flow rate, and so on).
For instance, the electric load of the sensible and desiccant wheel for both systems is that of the motors only.
The power needed to run the motor of these wheels is at the maximum 1 kW (typically 0.2 kW for desiccant
and 0.4-0.7 kW for sensible wheel). The same applies for the heat exchangers; small components consume
minimal power (0.5 kW) and larger components consume around 8 kW. Lastly, the power needed for the
absorption chiller is that of the chilled water pump, cooling water pump, hot water pump and the chiller itself
(to power its sub-components). Each pump power depends on the flow rate, and is typically in the range of
0.5 kW to 3 kW. This is actually why absorption chillers, unlike electric chiller, require minimal electric needs.

37
4 Solar Technology Design
The annual sum of global irradiation in Dubai is around 2 MWh/m2 and the average annual outdoor
temperature is 28 C. This shows that Dubai has high solar radiation and is a suitable place for harvesting
the solar energy. The high outdoor temperature and the ventilation should be considered in the design of
photovoltaic systems, which are sensitive to the temperature.
The solar technologies should provide the electrical demand of the building, the electrical demand of the
air conditioning system, and the thermal energy demand for the absorption chillers. Therefore, various
scenarios based on PV, PV/T, evacuated tube solar thermal, and parabolic trough solar thermal
technologies will be considered for the building. This chapter summarizes the calculations and the
technical issues related to the various solar technologies. In addition to the conventional solar
technologies, the emerging Building-Integrated-Solar-Technologies (BIST) for applications such as
windows, facades, and skylights will also be reviewed at the end of this chapter for their potential
application in the Center of Excellence building.
In this chapter, we first summarize all the electrical and thermal energy requirement of the Center of
Excellence building. In the following step, each solar technology will be sized based on the energy
demand. Finally, the best combination of the solar technologies will be discussed.
4.1 Energy Demand of the Building
The energy demands of the building, which should be provided by the solar technologies, are:
1) Electrical energy demand of the building for running the electrical appliance and lightings,
2) Thermal energy demand of the absorption chiller (air conditioning),
3) Electrical energy demand of the air conditioning system.
Generally, the electricity demand is found using ASHRAE standard. For spaces whose description
could be assigned as auditorium, ASHRAE specified a value of 10.76 W/m2 (1 W/ft
2). In order to find the
electricity demand of the auditorium based on typical standard values, the area of the auditorium has to be
found first. The AUTOCAD drawings show that the auditorium, toilets, cloakroom and services have an
area of 1,304 m2. In addition, the auditorium circulation has an area of 1,041 m2. Adding these two values
yields a total area of 2,345 m2. The calculation leads to an electricity demand of 221 MWh/year. Based on
the electrical demand standard of 90 kWh/m2 per year that has been previously specified by the sponsor
(Diamond Developers), the auditorium would need an amount of 211 MWh/year. As it could be noticed,
these two values validate each other. Therefore, for all the building electrical demand we will use the 90
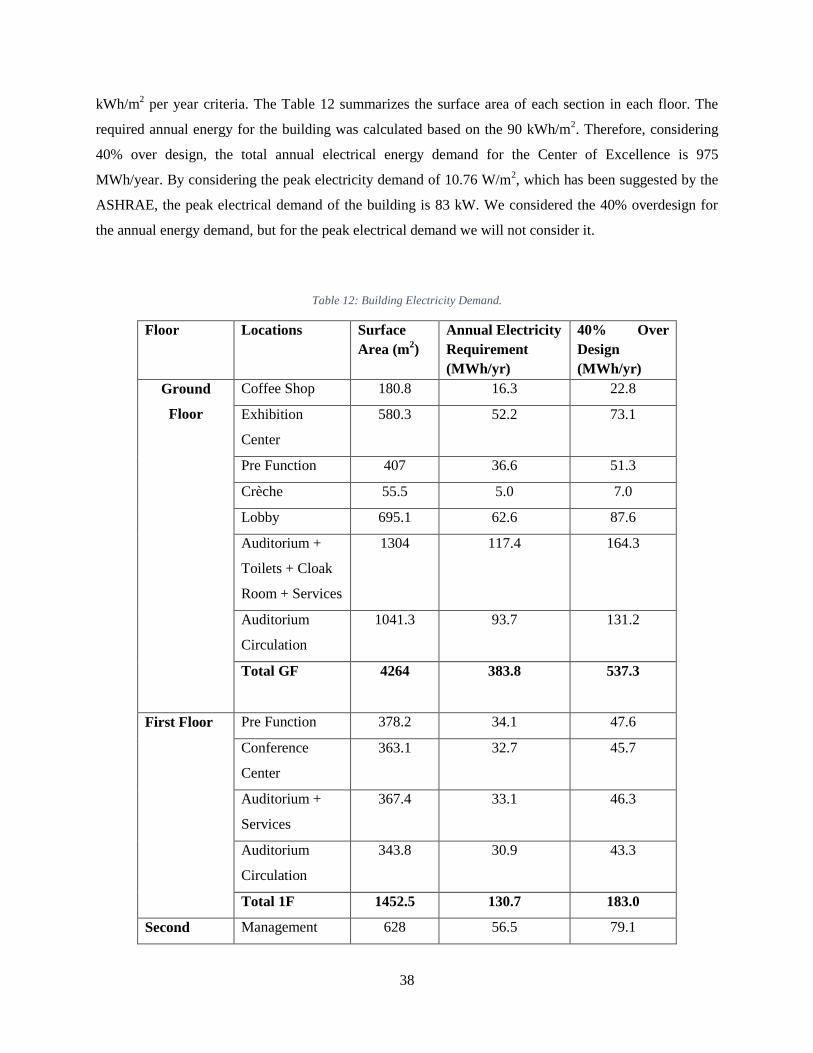
38
kWh/m2 per year criteria. The Table 12 summarizes the surface area of each section in each floor. The
required annual energy for the building was calculated based on the 90 kWh/m2. Therefore, considering
40% over design, the total annual electrical energy demand for the Center of Excellence is 975
MWh/year. By considering the peak electricity demand of 10.76 W/m2, which has been suggested by the
ASHRAE, the peak electrical demand of the building is 83 kW. We considered the 40% overdesign for
the annual energy demand, but for the peak electrical demand we will not consider it.
Table 12: Building Electricity Demand.
Floor Locations Surface
Area (m2)
Annual Electricity
Requirement
(MWh/yr)
40% Over
Design
(MWh/yr)
Ground
Floor
Coffee Shop 180.8 16.3 22.8
Exhibition
Center
580.3 52.2 73.1
Pre Function 407 36.6 51.3
Crèche 55.5 5.0 7.0
Lobby 695.1 62.6 87.6
Auditorium +
Toilets + Cloak
Room + Services
1304 117.4 164.3
Auditorium
Circulation
1041.3 93.7 131.2
Total GF 4264 383.8 537.3
First Floor Pre Function 378.2 34.1 47.6
Conference
Center
363.1 32.7 45.7
Auditorium +
Services
367.4 33.1 46.3
Auditorium
Circulation
343.8 30.9 43.3
Total 1F 1452.5 130.7 183.0
Second Management 628 56.5 79.1

39
Floor Circulation 367.2 33.0 46.3
Auditorium 694.4 62.5 87.5
Auditorium
Circulation
332.8 29.9 41.9
Total 2F 2022.4 182.0 254.8
Building Total Building 7738.9 696.5 975.1
The electrical energy demand for the air condition system was calculated in the previous chapter
(Table 11), which is 21.6 kW. By considering constant peak performance of the air conditioning
throughout the year the maximum annual electricity demand for the air conditioning is 0.2 MWh.
It is obvious that the HVAC electricity demand is negligible compared to the building electric
demand.
The peak thermal energy demand for generator of absorption chiller has been calculated in Table
8 and Table 10. The total peak thermal energy demands of the generator in systems I and II are
1174 and 1281 kW, respectively. By comparison to the electrical energy, it is obvious that the
thermal energy demand for air conditioning is much larger than the electrical energy demand. In
order to calculate the thermal energy consumption, we will consider eight month of cooling
season (March to October). Therefore, the maximum annual thermal energy consumption is
14146 MWh/yr.
All the above-mentioned components of the building electrical and thermal energy demand are
summarized in Table 13.
Table 13 Summary of the electrical and thermal energy requirement of the building
Component Max. Annual Energy Consumption
with 40% overdesign (MWh/yr)
Peak Energy
Demand2 (kW)
Air Conditioning (HVAC)
Electricity Demand
0.2 21.6
Building Electricity
Demand
975.1 83.3
Thermal Energy Demand
for Air Conditioning1
14,146 2,456
1 This is the thermal energy demand for the generator of the absorption chiller and
40
does not consider 40% overdesign.
2 The peak energy demand does not consider 40% overdesign
By knowing the electrical and thermal energy demand of the building, in the next step various solar
technologies will be sized to provide the energy requirement of the building. For sizing the solar
technologies, two approaches will be used the first approach is based on the annual energy consumption
(MWh/yr) and the second approach is based on the peak energy demand (kW). Designing based on the
peak energy demand will guarantee that the solar will provide enough energy even at the peak demand.
The former approach based on the annual energy consumption will guarantee that the building will be
zero net energy and fully sustainable.
4.2 Sizing the solar technology for thermal energy demand
In order to provide the thermal energy for the air conditioning system, the following solar technologies
will be evaluated:
1) Photovoltaic-Thermal (PV/T)
2) Evacuated Tube Solar Collectors
According to the Table 8 and Table 10 the maximum temperature required for the generator of the
absorption chiller is 80oC. Therefore, we will consider one hot water storage tank with a constant
temperature of 85oC. This tank should provide hot water for the generators of both System I and II (see
Figure 13). Therefore, the solar technologies will deliver their thermal energy to the storage tank and the
thermal energy will be used by the absorption chillers. The flow rates for the generator of absorption
chillers in systems I and II are 28.2 and 31 L/s, respectively. Therefore, the total flow rate for the tank
should be about 60 L/s.
4.2.1 PV/T System
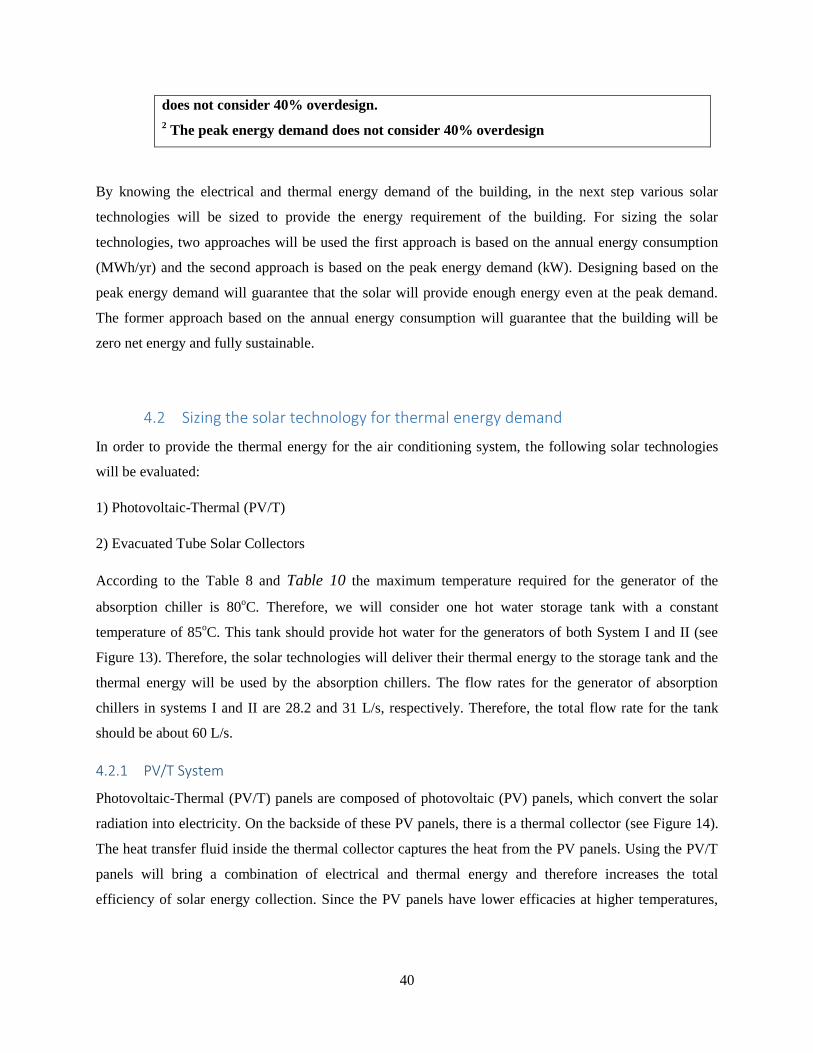
Photovoltaic-Thermal (PV/T) panels are composed of photovoltaic (PV) panels, which convert the solar
radiation into electricity. On the backside of these PV panels, there is a thermal collector (see Figure 14).
The heat transfer fluid inside the thermal collector captures the heat from the PV panels. Using the PV/T
panels will bring a combination of electrical and thermal energy and therefore increases the total
efficiency of solar energy collection. Since the PV panels have lower efficacies at higher temperatures,
41
the cooling should also increase the electrical output of PV/T panels. The high outdoor temperature in
Dubai is one reason for the potential advantage of PV/T compared to PV panels.
Figure 14 The PV/T panel components (Photo: Volther PowerVolt www.newformenergy.ie)
4.2.1.1 PV/T Panel Selection
We used the list of PV/T panels, which has been collected by Polysun Software group. In order to find the
best collector suitable for Dubai environment, the following parameters should be considered.
1) PV electrical efficiency of the PV/T panel,
2) Temperature coefficient, which shows the degradation percent in the efficiency of PV panel by
increasing the temperature,
3) Maximum tolerance temperature, which shows the maximum temperature that the PV/T panel can by
functional without degradation of the components.
We used parameter-based decision-making process to find out the optimum PV/T panel for our project.
For our modeling, calculation, and analysis we will use Solar Zentrum Wiosun PV-Therm PVT 200
panel. The technical specifications of PVT-200P are available in Appendix 2.
4.2.1.2 Energy Output of a Single PV/T Panel in Dubai
We have used the Polysun 8.0 Simulation Software for the analysis of the PV/T panels in Dubai. The
simulation for a single PV/T panels shows that the maximum temperature that the PV/T panels can
provide will be around 50oC (Figure 15). Therefore, for reaching the temperature of 85
oC inside the tank,
the tank should have an additional source of thermal energy such as electrical heater or gas burner. The
electrical and thermal energy output of a single PV/T is shown in Figure 16. Therefore, we can conclude
that since the output temperature of the PV/T panel is lower than the required temperature for the
absorption chillers, using PV/T panels might not be a practical approach. However, for comparison the
full simulation has been provided.

42
Figure 15 The daily maximum temperature of the PV/T panel (starting from January).
Figure 16 Thermal and electrical energy output of a single PV/T panel in Dubai. The total annual thermal and electrical output
is 284 and 335 kWh, respectively.

43
4.2.1.3 Sizing PV/T System
According to Table 8 and Table 10, the solar collector should provide hot water (80oC) with the flow rate
of 60 L/s. Since the PV/T collectors cannot reach the required temperature of 80oC, an additional
electrical heater source was added to the system. The schematic of the PV/T collectors, tank, and
electrical heater is shown in Figure 17.
Figure 17 The schematic presentation of the PV/T system with storage tank and external electric heater.
The system was modeled for the eight months of March to October, which was mentioned in previous
chapter. According to Table 8 and Table 10, the inlet and outlet temperatures of the absorption chiller
generator are 80oC and 71
oC, respectively which are higher than the average output temperature of PV/T
panels (around 50oC). Hence, in this case the PV/T panels can only work as the water jacket around the
storage tank, which not a technical advantage. Therefore, the PV/T scenario for connection with
absorption chiller will not be considered any more. However, in the electrical demand calculations, we
will compare the PV and PV/T panels for their performance in the high temperature environment of
Dubai.
4.2.2 Evacuated Tube Solar Collectors
The evacuated tube solar collectors can reach high temperatures. They are composed of a heat pipe as
their core, which is located inside a transparent vacuum tube for minimum heat loss. The schematic
presentation of evacuated tube solar collectors is shown in Figure 18.

44
Figure 18 Schematic presentation of the components of evacuated tube solar collectors.(Image courtesy www.homepower.com)
There are various producers of evacuated tubes, however, there is not a major difference between the
efficiencies. For our modeling we chose XL 34 P panel produced by Ritter XL Solar Gmbh.
4.2.2.1 Energy Output of a Single Evacuated Tube in Dubai
Modeling the system for a single panels shows that the average collector temperature reaches around
80oC, which is shown in Figure 19.
Figure 19 Maximum daily temperature of a single evacuated tube collector
One panel of evacuated tube solar collector can produce around 3,433 kWh/yr of thermal energy in
Dubai. The monthly production of a single panel is shown in Figure 20.
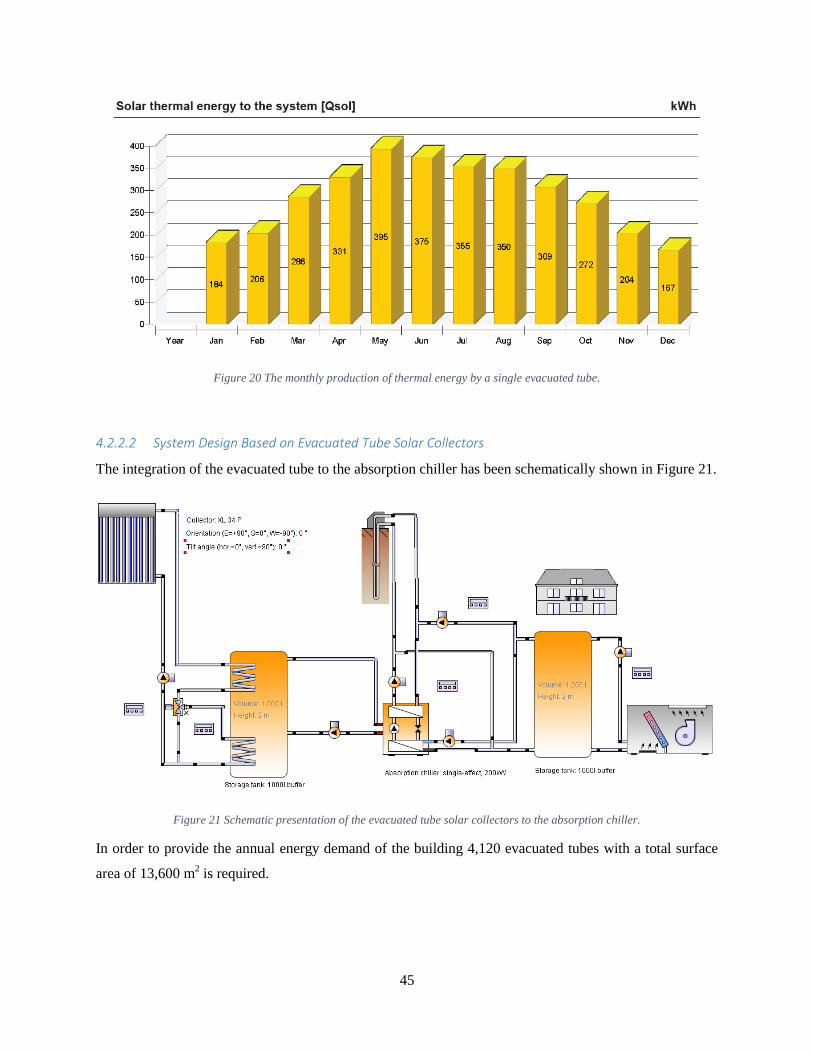
45
Figure 20 The monthly production of thermal energy by a single evacuated tube.
4.2.2.2 System Design Based on Evacuated Tube Solar Collectors
The integration of the evacuated tube to the absorption chiller has been schematically shown in Figure 21.
Figure 21 Schematic presentation of the evacuated tube solar collectors to the absorption chiller.
In order to provide the annual energy demand of the building 4,120 evacuated tubes with a total surface
area of 13,600 m2 is required.

46
4.3 Sizing Solar Technologies for Electrical Demand of Building
In this section, PV and PV/T technologies will be sized to provide the electrical demand of the building.
Later, the potential application of building-integrated-photovoltaics for windows and facades will be
discussed.
4.3.1 PV System
Photovoltaics (PV) can convert the solar energy directly to the electricity. On the other side, solar thermal
technologies convert the solar energy to the thermal energy. Therefore, the proper selection of solar
technologies depends on the thermal and electrical demand of the building. Various materials and
methods have been used for the production of the PV panels. The majority of the commercial PV products
are based on the silicon. Three major categories of the PV panels are monocrystalline, polycrystalline, and
amorphous silicon solar cells. Monocrystalline has the highest and the amorphous silicon solar cells have
the lowest conversion efficiency among silicon-based solar cells. After silicon-based solar cells, thin film
solar cells have the second place in the solar cell market. Two main commercial thin film solar cells are
Cadmium Telluride (CdTe) and Copper Indium Gallium Selenide (CIGS). In order to increase their
voltage, solar cells are (typically 36 cells) connected in series, which are called solar modules. The
conversion efficacies and nominal powers of solar cells are described based on their performance at
Standard Test Condition (STC). According to standard, STC is the irradiation of 1000 W/m2, cell
temperature of 25OC, and air mass of 1.5 (AM1.5).
Multiple modules which are connected in series a called a string. In string inverters, each string will be
converted to AC. Central inverters uses a terminal box to merge all the strings. Our definition for the
module orientation is South = 0, East = 90, West = -90 and for the tilt is floor = 0 and façade = 90.
Increasing the temperature of the module decreases its efficiency. However, the role of temperature
depends on the type of PV module. Amorphous cell have the least sensitivity to the temperature. Soiling
and degradation values for PV panels in Dubai were considered 2% for soiling and annual degradation of
0.5%.
4.3.1.1 PV System Components
There are different parameters, which are important for the selection of the right PV panel. Here the most
important parameters for this project.
4.3.1.1.1 Efficiency
Panels with higher efficiency can produce the same energy with lower space required. Therefore, if the
space availability is a challenge the high efficiency panels are recommended. Usually the monocrystalline
47
silicon solar panels have the highest efficiency. However, there should be a compromise between the
price and the efficiency as more efficient panels are usually more expensive.
4.3.1.1.2 Quality
In order to make sure that the PV panels have been produced form high quality materials. It is important
to consider very well known and reputable panel producers. Since the life of PV panels are considered at
least 25 years during the designs, it is important to make sure that the quality of the PV panels meet this
requirement. Some companies decrease their prices but cutting the corners of the quality of the panels. It
is recommends to have an independent laboratory test the quality of the panels. It is important that the
producers provide long-term warrantee.
4.3.1.1.3 PV panels durable in hot and humid environments
The high temperature and humidity of the Dubai environment can increase the degradation rate of some
of the PV panel components. A comprehensive review of the different degradation mechanisms of the PV
modules has been presented in 2011.3 Some of the main degradation mechanisms are: glass soiling, front-
side delamination, anti-reflecting layer oxidation, mechanical and thermal stress-induced cracks, and
back-sheet delamination. The failure of the PV system can happen due to the following reasons.
Broken interconnects Hot Spots
Broken cells or Broken glass Ground faults
Corrosion Junction box and module
connection failures
Delamination and/or loss of
elastomeric properties of
encapsulant
Structural failures
Encapsulant discoloration Bypass Diode failures
Solder bond failures Open circuiting leading to arcing
4.3.1.1.4 Standards
There are various standards for the measurement and verification of the quality of the PV panels. Some of
these standards are listed here. Asking the PV producers to provide documentation of their compliance
with these standards is a reliable way of verification of the long-term durability of the panels. Many of
these standards utilize accelerated tests to model the behavior of the panel in the lifetime of 25 years.
3 Sánchez‐Friera, Paula, et al. "Analysis of degradation mechanisms of crystalline silicon PV modules
after 12 years of operation in Southern Europe. “Progress in photovoltaics: Research and Applications 19.6 (2011): 658-666.
48
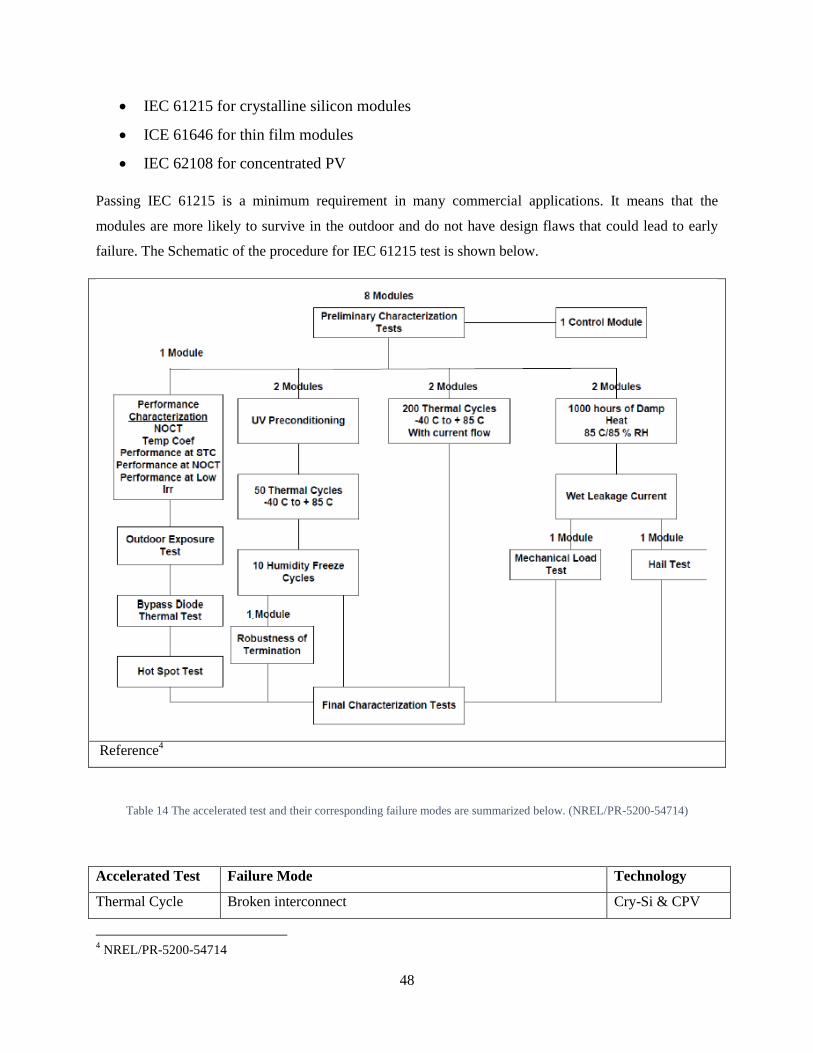
IEC 61215 for crystalline silicon modules
ICE 61646 for thin film modules
IEC 62108 for concentrated PV
Passing IEC 61215 is a minimum requirement in many commercial applications. It means that the
modules are more likely to survive in the outdoor and do not have design flaws that could lead to early
failure. The Schematic of the procedure for IEC 61215 test is shown below.
Reference4
Table 14 The accelerated test and their corresponding failure modes are summarized below. (NREL/PR-5200-54714)
Accelerated Test Failure Mode Technology
Thermal Cycle Broken interconnect Cry-Si & CPV
4 NREL/PR-5200-54714
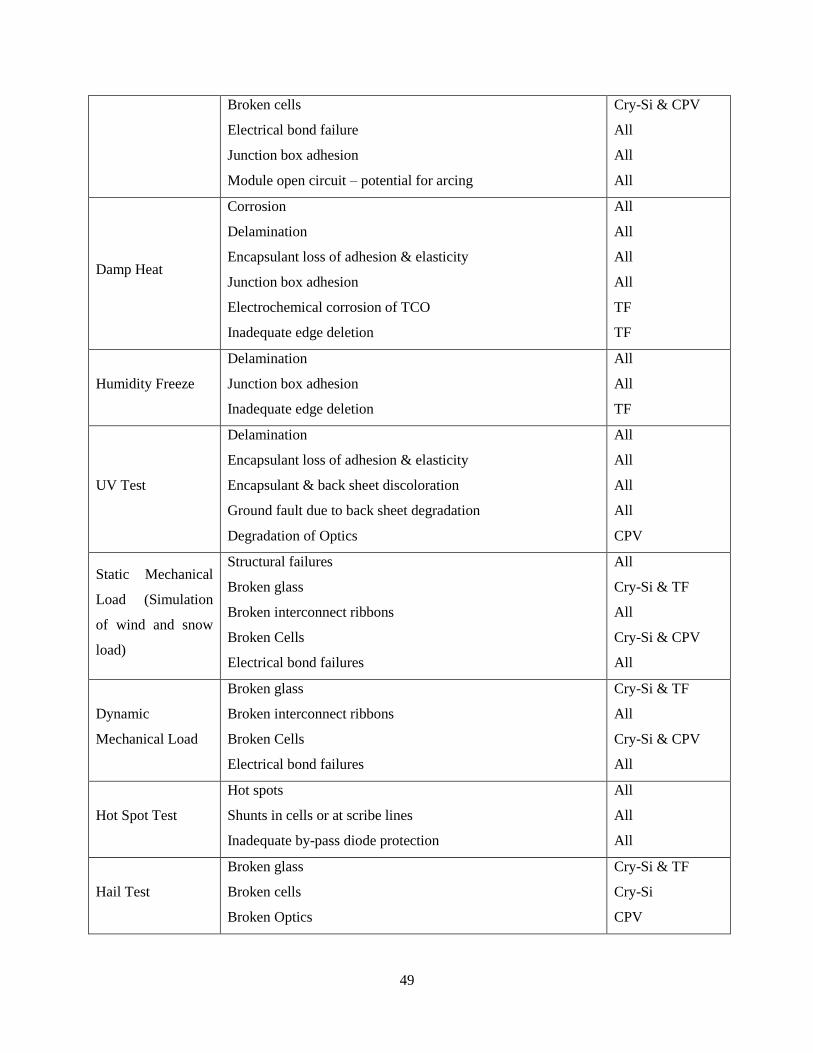
49
Broken cells
Electrical bond failure
Junction box adhesion
Module open circuit – potential for arcing
Cry-Si & CPV
All
All
All
Damp Heat
Corrosion
Delamination
Encapsulant loss of adhesion & elasticity
Junction box adhesion
Electrochemical corrosion of TCO
Inadequate edge deletion
All
All
All
All
TF
TF
Humidity Freeze
Delamination
Junction box adhesion
Inadequate edge deletion
All
All
TF
UV Test
Delamination
Encapsulant loss of adhesion & elasticity
Encapsulant & back sheet discoloration
Ground fault due to back sheet degradation
Degradation of Optics
All
All
All
All
CPV
Static Mechanical
Load (Simulation
of wind and snow
load)
Structural failures
Broken glass
Broken interconnect ribbons
Broken Cells
Electrical bond failures
All
Cry-Si & TF
All
Cry-Si & CPV
All
Dynamic
Mechanical Load
Broken glass
Broken interconnect ribbons
Broken Cells
Electrical bond failures
Cry-Si & TF
All
Cry-Si & CPV
All
Hot Spot Test
Hot spots
Shunts in cells or at scribe lines
Inadequate by-pass diode protection
All
All
All
Hail Test
Broken glass
Broken cells
Broken Optics
Cry-Si & TF
Cry-Si
CPV
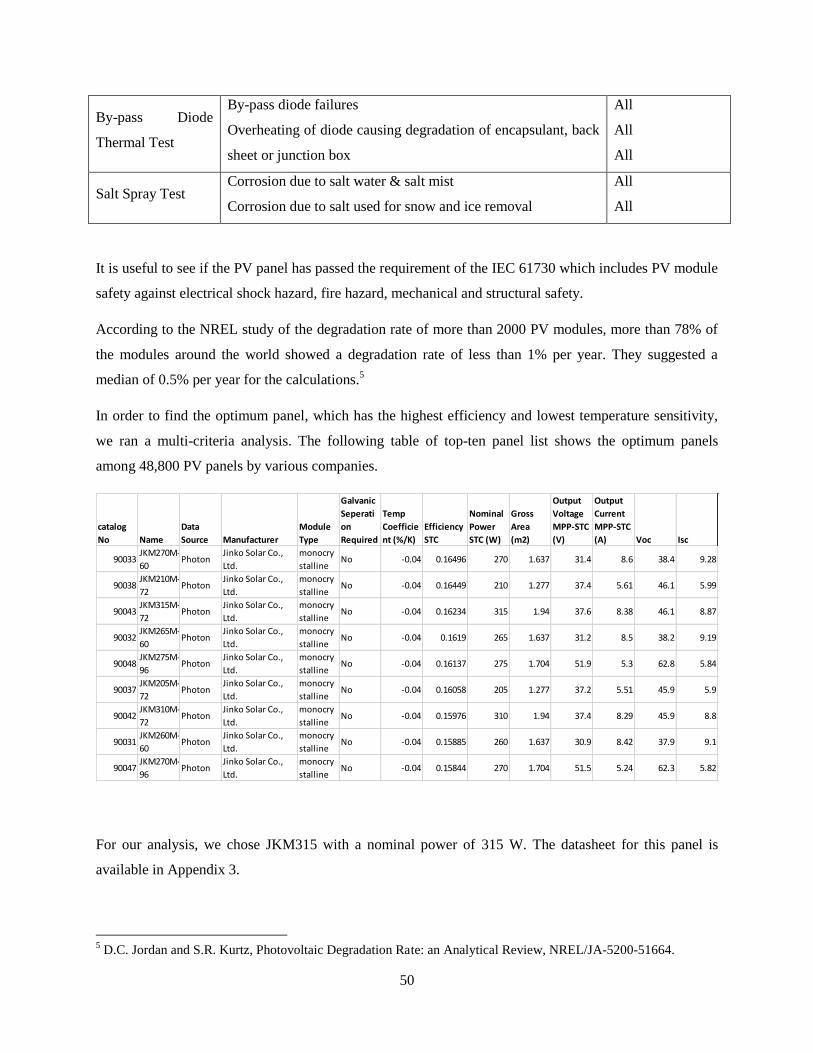
50
By-pass Diode
Thermal Test
By-pass diode failures
Overheating of diode causing degradation of encapsulant, back
sheet or junction box
All
All
All
Salt Spray Test Corrosion due to salt water & salt mist
Corrosion due to salt used for snow and ice removal
All
All
It is useful to see if the PV panel has passed the requirement of the IEC 61730 which includes PV module
safety against electrical shock hazard, fire hazard, mechanical and structural safety.
According to the NREL study of the degradation rate of more than 2000 PV modules, more than 78% of
the modules around the world showed a degradation rate of less than 1% per year. They suggested a
median of 0.5% per year for the calculations.5
In order to find the optimum panel, which has the highest efficiency and lowest temperature sensitivity,
we ran a multi-criteria analysis. The following table of top-ten panel list shows the optimum panels
among 48,800 PV panels by various companies.
For our analysis, we chose JKM315 with a nominal power of 315 W. The datasheet for this panel is
available in Appendix 3.
5 D.C. Jordan and S.R. Kurtz, Photovoltaic Degradation Rate: an Analytical Review, NREL/JA-5200-51664.
catalog
No Name
Data
Source Manufacturer
Module
Type
Galvanic
Seperati
on
Required
Temp
Coefficie
nt (%/K)
Efficiency
STC
Nominal
Power
STC (W)
Gross
Area
(m2)
Output
Voltage
MPP-STC
(V)
Output
Current
MPP-STC
(A) Voc Isc
90033JKM270M-
60Photon
Jinko Solar Co.,
Ltd.
monocry
stallineNo -0.04 0.16496 270 1.637 31.4 8.6 38.4 9.28
90038JKM210M-
72Photon
Jinko Solar Co.,
Ltd.
monocry
stallineNo -0.04 0.16449 210 1.277 37.4 5.61 46.1 5.99
90043JKM315M-
72Photon
Jinko Solar Co.,
Ltd.
monocry
stallineNo -0.04 0.16234 315 1.94 37.6 8.38 46.1 8.87
90032JKM265M-
60Photon
Jinko Solar Co.,
Ltd.
monocry
stallineNo -0.04 0.1619 265 1.637 31.2 8.5 38.2 9.19
90048JKM275M-
96Photon
Jinko Solar Co.,
Ltd.
monocry
stallineNo -0.04 0.16137 275 1.704 51.9 5.3 62.8 5.84
90037JKM205M-
72Photon
Jinko Solar Co.,
Ltd.
monocry
stallineNo -0.04 0.16058 205 1.277 37.2 5.51 45.9 5.9
90042JKM310M-
72Photon
Jinko Solar Co.,
Ltd.
monocry
stallineNo -0.04 0.15976 310 1.94 37.4 8.29 45.9 8.8
90031JKM260M-
60Photon
Jinko Solar Co.,
Ltd.
monocry
stallineNo -0.04 0.15885 260 1.637 30.9 8.42 37.9 9.1
90047JKM270M-
96Photon
Jinko Solar Co.,
Ltd.
monocry
stallineNo -0.04 0.15844 270 1.704 51.5 5.24 62.3 5.82
51
4.3.1.2 Inverter
Solar inverters convert the direct current (DC) output of the PV panel to the alternating current (AC) with
utility frequency. The output AC current can be fed into the electrical grid or it can be used for the off-
grid local network. The inverters are among the most important balance-of-system (BOS) components.
The inverters, which are designed for integration with the PV system, included the maximum power point
tracking (MPP) and anti-islanding protection. The output of the PV panels is described by a non-liner I-V
curve. The MPP is the location on the I-V curve with the maximum power (power is the product of IxV).
There are four algorithms for MPP-tracking: a) constant voltage, b) incremental conductance, c) perturb-
and-observe, and d) current sweep.
Islanding refers to the situation of utility grid outage while some distributed generators continue to
provide power to the local circuits. This situation is dangerous for workers who are trying to fix the
circuit. Additionally, islanding might prevent the automatic re-connection of devices. Therefore, the
distributed generators such as solar and battery connected inverters should stop producing power upon
detecting the utility blackout. The mechanism for detecting and shutting down the power production is
called the anti-islanding.
Based on the applications and the internal components the solar inverters can be classified to the
following groups:
4.3.1.2.1 Stand-alone inverters
These inverters are used in off-grid applications. They are usually equipped with battery chargers and
therefore, they are directly connected to the batteries. The batteries will be charged by the PV panel. Since
these inverters are not connected to the grid they do not require anti-islanding protection.
4.3.1.2.2 Grid-tied inverters
These inverters should provide the utility sine wave with the same phase. Upon grid outage they will shut
down for safety and therefore, they should not be considered as a backup power.
4.3.1.2.3 Battery backup inverters
These inverters are equipped with battery charges and therefore, they will manage the battery charging
and they will send the excess energy to the grid. They can provide backup power during utility outage and
therefore, they are equipped with anti-islanding protection.
4.3.1.2.4 Micro-inverters
The solar micro-inverters are integrated with a single PV panel. Therefore, each micro-inverter can find
the MPP of each PV panel independent of other PV panels. The output of multiple micro-inverters can be
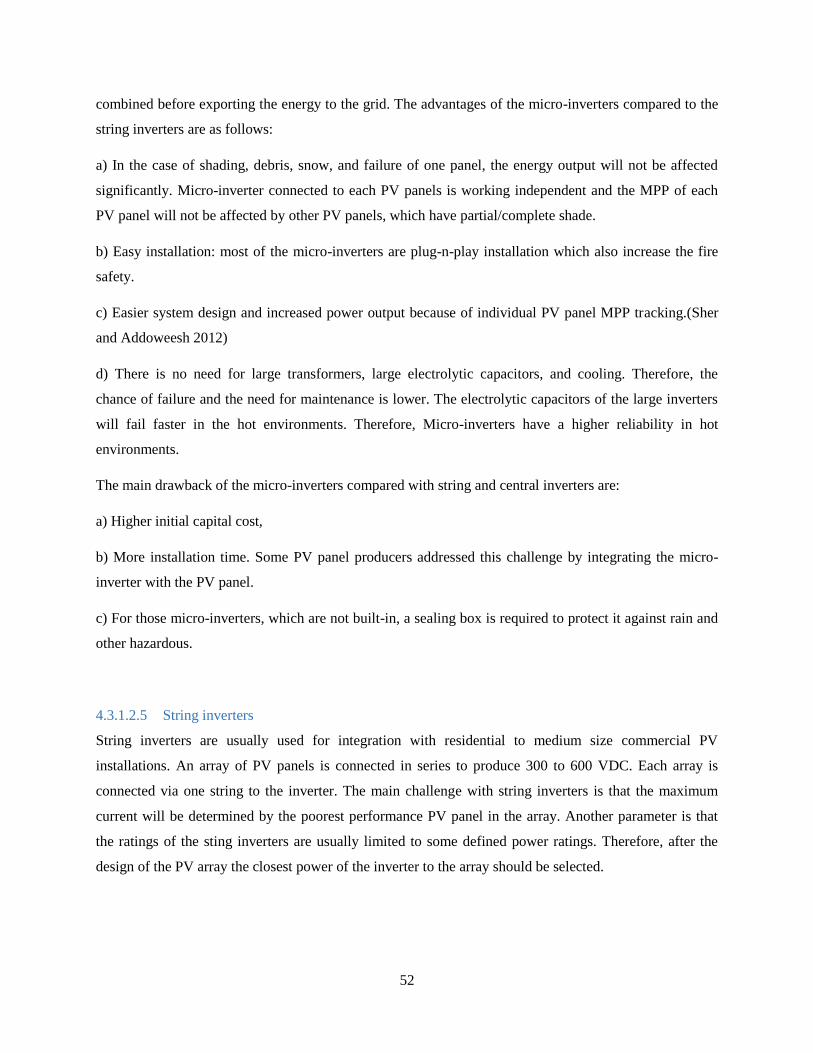
52
combined before exporting the energy to the grid. The advantages of the micro-inverters compared to the
string inverters are as follows:
a) In the case of shading, debris, snow, and failure of one panel, the energy output will not be affected
significantly. Micro-inverter connected to each PV panels is working independent and the MPP of each
PV panel will not be affected by other PV panels, which have partial/complete shade.
b) Easy installation: most of the micro-inverters are plug-n-play installation which also increase the fire
safety.
c) Easier system design and increased power output because of individual PV panel MPP tracking.(Sher
and Addoweesh 2012)
d) There is no need for large transformers, large electrolytic capacitors, and cooling. Therefore, the
chance of failure and the need for maintenance is lower. The electrolytic capacitors of the large inverters
will fail faster in the hot environments. Therefore, Micro-inverters have a higher reliability in hot
environments.
The main drawback of the micro-inverters compared with string and central inverters are:
a) Higher initial capital cost,
b) More installation time. Some PV panel producers addressed this challenge by integrating the micro-
inverter with the PV panel.
c) For those micro-inverters, which are not built-in, a sealing box is required to protect it against rain and
other hazardous.
4.3.1.2.5 String inverters
String inverters are usually used for integration with residential to medium size commercial PV
installations. An array of PV panels is connected in series to produce 300 to 600 VDC. Each array is
connected via one string to the inverter. The main challenge with string inverters is that the maximum
current will be determined by the poorest performance PV panel in the array. Another parameter is that
the ratings of the sting inverters are usually limited to some defined power ratings. Therefore, after the
design of the PV array the closest power of the inverter to the array should be selected.
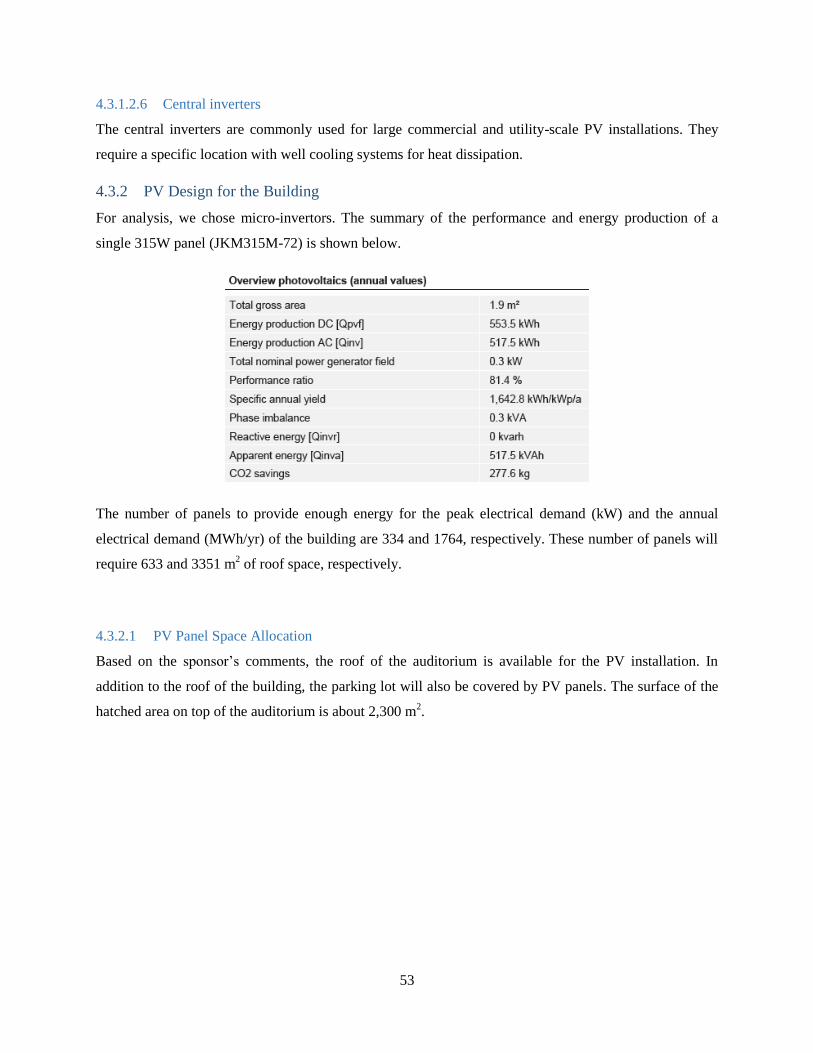
53
4.3.1.2.6 Central inverters
The central inverters are commonly used for large commercial and utility-scale PV installations. They
require a specific location with well cooling systems for heat dissipation.
4.3.2 PV Design for the Building
For analysis, we chose micro-invertors. The summary of the performance and energy production of a
single 315W panel (JKM315M-72) is shown below.
The number of panels to provide enough energy for the peak electrical demand (kW) and the annual
electrical demand (MWh/yr) of the building are 334 and 1764, respectively. These number of panels will
require 633 and 3351 m2 of roof space, respectively.
4.3.2.1 PV Panel Space Allocation
Based on the sponsor’s comments, the roof of the auditorium is available for the PV installation. In
addition to the roof of the building, the parking lot will also be covered by PV panels. The surface of the
hatched area on top of the auditorium is about 2,300 m2.
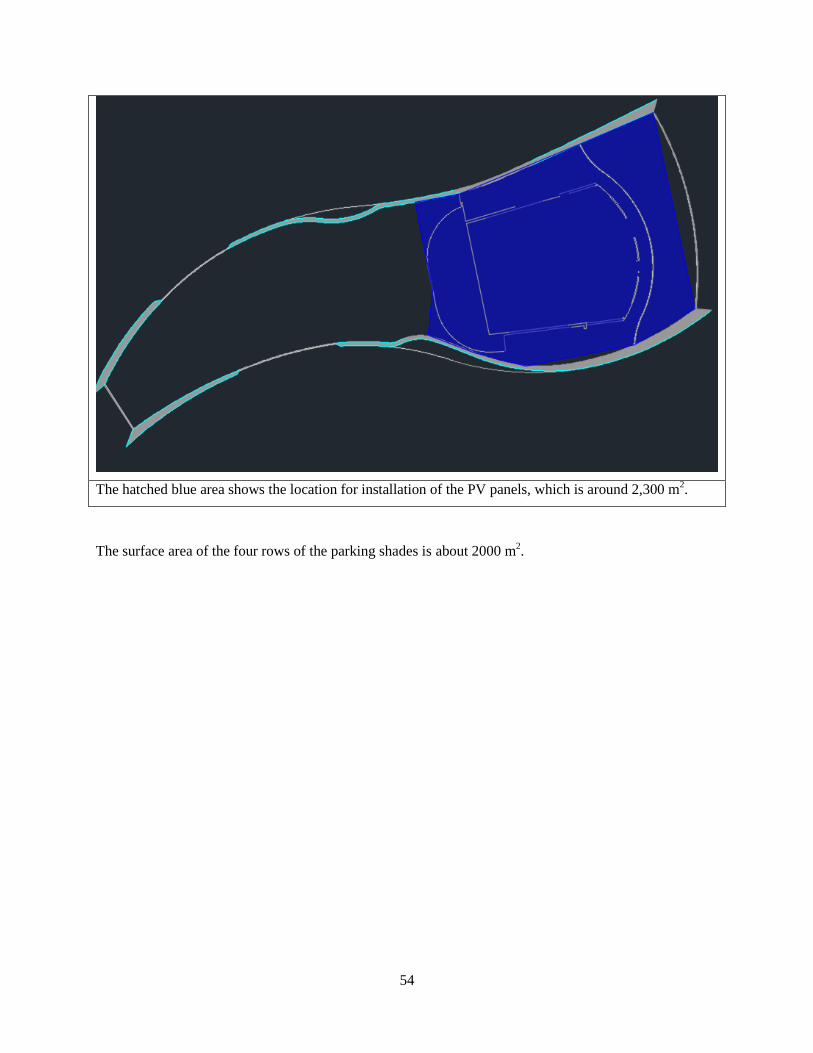
54
The hatched blue area shows the location for installation of the PV panels, which is around 2,300 m2.
The surface area of the four rows of the parking shades is about 2000 m2.
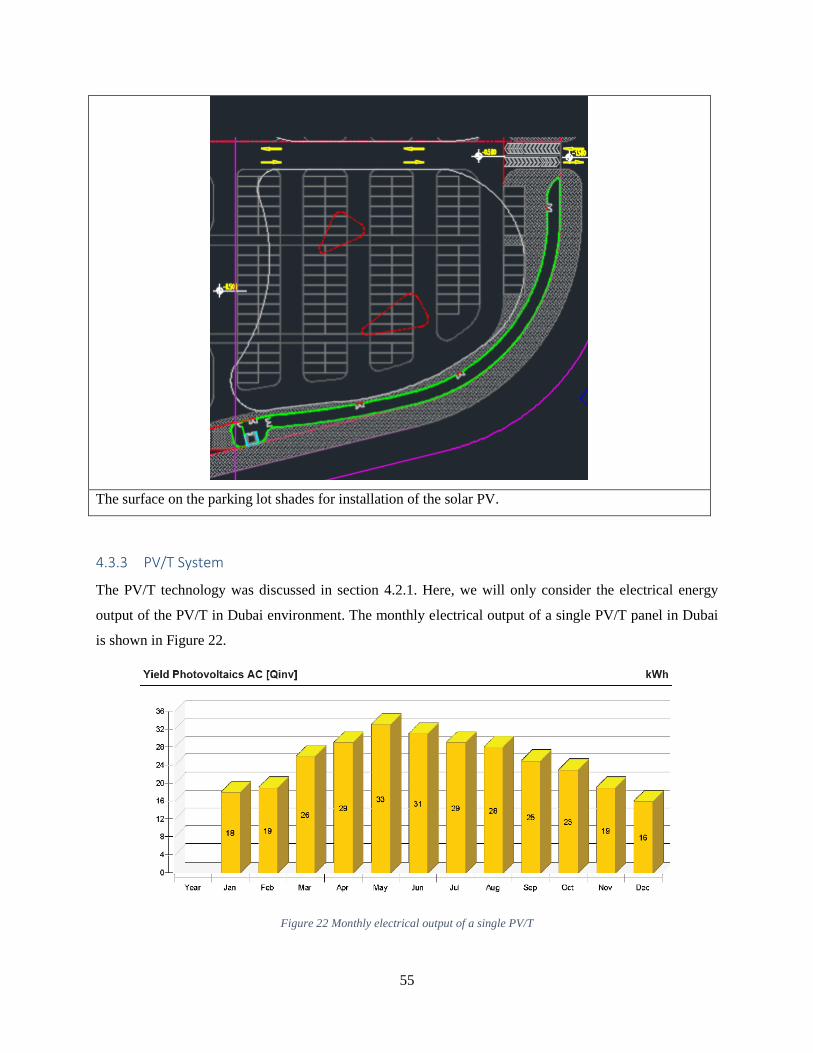
55
The surface on the parking lot shades for installation of the solar PV.
4.3.3 PV/T System
The PV/T technology was discussed in section 4.2.1. Here, we will only consider the electrical energy
output of the PV/T in Dubai environment. The monthly electrical output of a single PV/T panel in Dubai
is shown in Figure 22.
Figure 22 Monthly electrical output of a single PV/T

56
In order to meet the peak demand and the annual demand of the building 682 m2 and 3785 m2 of PV/T
panels are required. By comparison with PV panels, it is obvious that the number of required PV panels is
less, which is because of their higher efficiency. Therefore, we recommend using PV panels.
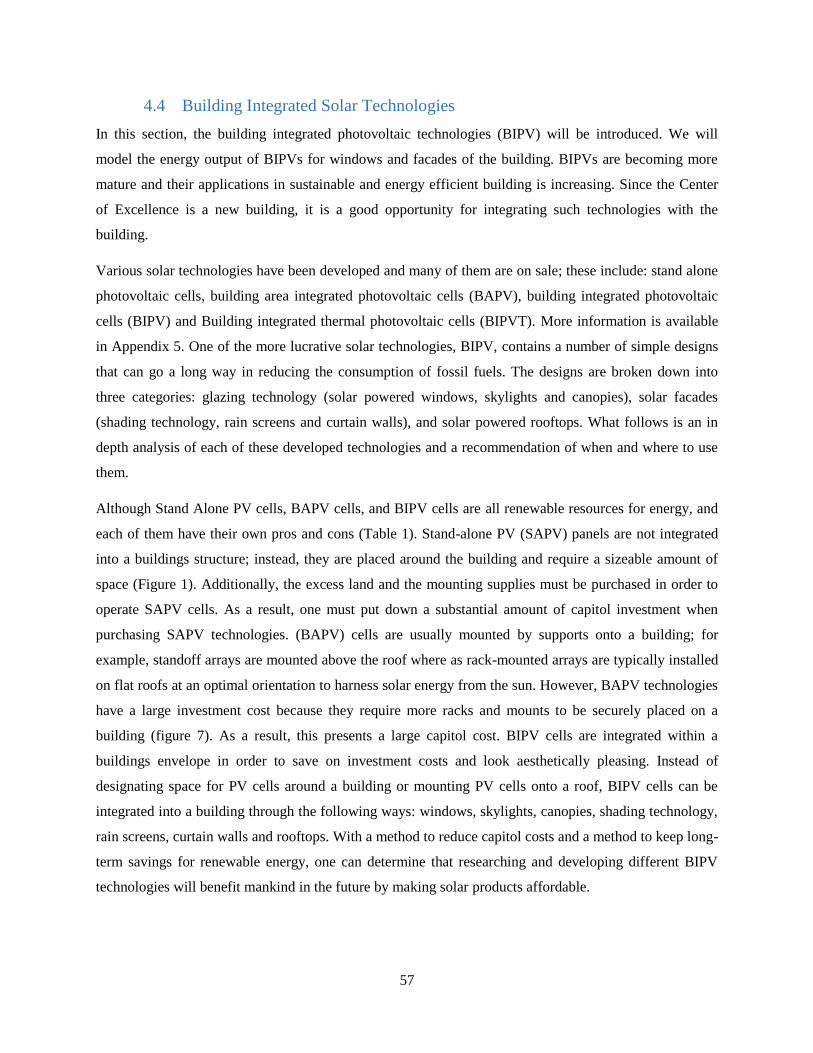
57
4.4 Building Integrated Solar Technologies
In this section, the building integrated photovoltaic technologies (BIPV) will be introduced. We will
model the energy output of BIPVs for windows and facades of the building. BIPVs are becoming more
mature and their applications in sustainable and energy efficient building is increasing. Since the Center
of Excellence is a new building, it is a good opportunity for integrating such technologies with the
building.
Various solar technologies have been developed and many of them are on sale; these include: stand alone
photovoltaic cells, building area integrated photovoltaic cells (BAPV), building integrated photovoltaic
cells (BIPV) and Building integrated thermal photovoltaic cells (BIPVT). More information is available
in Appendix 5. One of the more lucrative solar technologies, BIPV, contains a number of simple designs
that can go a long way in reducing the consumption of fossil fuels. The designs are broken down into
three categories: glazing technology (solar powered windows, skylights and canopies), solar facades
(shading technology, rain screens and curtain walls), and solar powered rooftops. What follows is an in
depth analysis of each of these developed technologies and a recommendation of when and where to use
them.
Although Stand Alone PV cells, BAPV cells, and BIPV cells are all renewable resources for energy, and
each of them have their own pros and cons (Table 1). Stand-alone PV (SAPV) panels are not integrated
into a buildings structure; instead, they are placed around the building and require a sizeable amount of
space (Figure 1). Additionally, the excess land and the mounting supplies must be purchased in order to
operate SAPV cells. As a result, one must put down a substantial amount of capitol investment when
purchasing SAPV technologies. (BAPV) cells are usually mounted by supports onto a building; for
example, standoff arrays are mounted above the roof where as rack-mounted arrays are typically installed
on flat roofs at an optimal orientation to harness solar energy from the sun. However, BAPV technologies
have a large investment cost because they require more racks and mounts to be securely placed on a
building (figure 7). As a result, this presents a large capitol cost. BIPV cells are integrated within a
buildings envelope in order to save on investment costs and look aesthetically pleasing. Instead of
designating space for PV cells around a building or mounting PV cells onto a roof, BIPV cells can be
integrated into a building through the following ways: windows, skylights, canopies, shading technology,
rain screens, curtain walls and rooftops. With a method to reduce capitol costs and a method to keep long-
term savings for renewable energy, one can determine that researching and developing different BIPV
technologies will benefit mankind in the future by making solar products affordable.
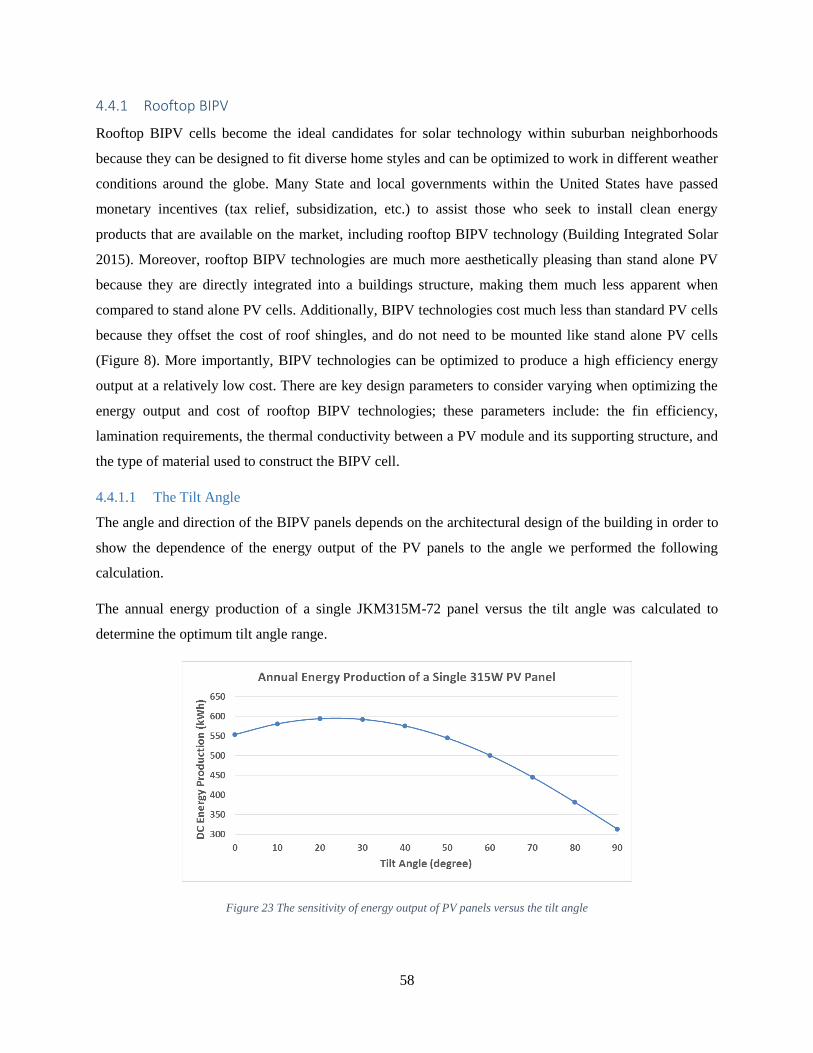
58
4.4.1 Rooftop BIPV
Rooftop BIPV cells become the ideal candidates for solar technology within suburban neighborhoods
because they can be designed to fit diverse home styles and can be optimized to work in different weather
conditions around the globe. Many State and local governments within the United States have passed
monetary incentives (tax relief, subsidization, etc.) to assist those who seek to install clean energy
products that are available on the market, including rooftop BIPV technology (Building Integrated Solar
2015). Moreover, rooftop BIPV technologies are much more aesthetically pleasing than stand alone PV
because they are directly integrated into a buildings structure, making them much less apparent when
compared to stand alone PV cells. Additionally, BIPV technologies cost much less than standard PV cells
because they offset the cost of roof shingles, and do not need to be mounted like stand alone PV cells
(Figure 8). More importantly, BIPV technologies can be optimized to produce a high efficiency energy
output at a relatively low cost. There are key design parameters to consider varying when optimizing the
energy output and cost of rooftop BIPV technologies; these parameters include: the fin efficiency,
lamination requirements, the thermal conductivity between a PV module and its supporting structure, and
the type of material used to construct the BIPV cell.
4.4.1.1 The Tilt Angle
The angle and direction of the BIPV panels depends on the architectural design of the building in order to
show the dependence of the energy output of the PV panels to the angle we performed the following
calculation.
The annual energy production of a single JKM315M-72 panel versus the tilt angle was calculated to
determine the optimum tilt angle range.
Figure 23 The sensitivity of energy output of PV panels versus the tilt angle

59
4.4.2 BIPV Façade
Solar Facades take a different approach to providing larger buildings with solar energy because the solar
irradiation gathered could be used to provide both electrical power and thermal energy in order to comfort
people inside the building. An array of PV cells around the structures envelope could produce the amount
of electricity needed to sustain the optimal operation levels of the building (Figure 11). In addition to this,
the solar energy that is not used as electricity is transported out of the façade through small tubes as
usable thermal energy (Hwang 2012). This usable heat can be used to insulate the building and keep
temperature levels consistent throughout the structures interior. To add to this, people inside the building
will rely much less on artificial lighting because the solar façade can enhance the amount of natural light
used within the building by varying its own transparency levels (Hwang 2012). Manufacturers of solar
façade’s advertise unique traits associated with their products; some of these qualities include: adjusting
the façade throughout the day in order to allow just the right amount of light to permeate through the
building and integrating newer façade’s into older buildings to allow for greener infrastructure without
high construction costs. In order to optimize the amount of solar energy harnessed from the sun, an
inclined façade should be used on a building, this allows for the PV panels to capture a greater amount of
the suns irradiation. Many offices around the world can drastically reduce their reliance on fossil fuels by
installing solar façade’s.
4.4.3 BIPV Window
BIPV windows are candidates for larger commercial buildings and office buildings because they can
easily cover a vast amount of the structures envelope while optimizing the amount of energy yielded. By
varying its transparency, BIPV windows allow the user to specify how much light can enter the building
during various parts of the day (Hwang 2012). Furthermore, because the transparency of the window
changes, it indirectly changes the amount of solar irradiation harnessed from the sun, which varies the
amount of energy the building receives from the BIPV windows. Additionally, BIPV windows offset the
cost of the electricity required by the building and the installation costs of the windows by combining
each function into one working product (Figure 9). In order to produce the most optimal BIPV windows,
one should consider a design in which high efficiency solar panels are bunched together inside the
window; this would produce the greatest energy yield. However, the design must be translucent in order
to provide those inside with an amount of light that is comfortable for them.
60
Table 15 Rooftop BIPV Products Available on the Market Today
Manufacturer Product 𝜼
(%)
𝑼𝒐𝒄
(V)
𝑰𝒔𝒄
(A)
FF Website
BIPV Rooftop
Solardachstein STEP - 0.59 3 0.76 www.solardachstein.com
Lumeta Inc. Solar S Tile - 7.40 5.20 0.73 www.lumetasolar.com
Lumeta Inc. Solar Flat
Tile
- 7.40 5.20 0.73 www.lumetasolar.com
Sharp ND-62RU1 - 10.8 8.00 0.72 [email protected]
Sharp ND62RU2 - 10.9 7.90 0.72 [email protected]
Sunpower SunTile - 14.6 5.65 0.76 Us.sunpowercorp.com
Solon SE Solon Black 13.7 44.5 5.01 0.78 Solon.com
Solon SE Solon Ge 17.7 24.4 8.87 0.76 Solon.com
Soltecture SCG-HV-RI - - - - http://www.soltecture.com/solar-
construction/solar-facades.html
Soltecture SCG-HV-L - - - - http://www.soltecture.com/solar-
construction/solar-facades.html
Soltecture SCG-HV-F - - - - http://www.soltecture.com/solar-
construction/solar-facades.html
𝜼 = Efficiency, 𝑼𝒐𝒄 = Open Circuit Voltage, 𝑰𝒔𝒄 = Closed Circuit Current, FF = Fill Factor (Unit
less)

61
Table 16 BIPV Products Available on the Market Today
BIPV Façade’s
Window’s
Manufacturer Product 𝜼 (%) 𝑼𝒐𝒄
(V)
𝑰𝒔𝒄
(A)
FF Website
Schott Solar ASI THRU-
2-L
27% 111V 1.11A - www.schott.com
Schott Solar ASI THRU-
2-IO
20% 111V 1.11A - www.schott.com
Schott Solar ASI OPAK-
2-L
25% 111V 1.21A - www.schott.com
Yohkon Energia YE6140M
GG
11.0% 21.9V 8.47
A
- https://www.linkedin.com/com
pany/yohkon-energia-
s.a?trk=company_logo
Smile Solar SSNP-
110TA30S
9.42% 78.4V 67A - http://www.smilesolar.com.tw/
en/goods.php
Curtain Wall
Manufacturer Product 𝜼
(%)
𝑼𝒐𝒄
(V)
𝑰𝒔𝒄
(A)
FF Website
Soltecture Façade
cassette
- - - - http://www.soltecture.com/solar-
construction/solar-facades.html
Soltecture SCG-HV-F - - - - http://www.soltecture.com/solar-
construction/solar-facades.html
Zigzagsolar Hit - - - - http://zigzagsolar.com/
Sapa Façade 4150
EF
- - - - http://www.sapagroup.com/en/company
-sites/sapa-building-system-
ab/sapa_building_system_ab_gb/produc
ts/facades/
Rain Screen
Manufacturer Product 𝜼
(%)
𝑼𝒐𝒄
(V)
𝑰𝒔𝒄
(A)
FF Website
Soltecture SCG-HV-L - - - - http://www.soltecture.com/solar-
construction/solar-facades.html
Soltecture SCG-HV-F - - - - http://www.soltecture.com/solar-
construction/solar-facades.html
Concrete Façade
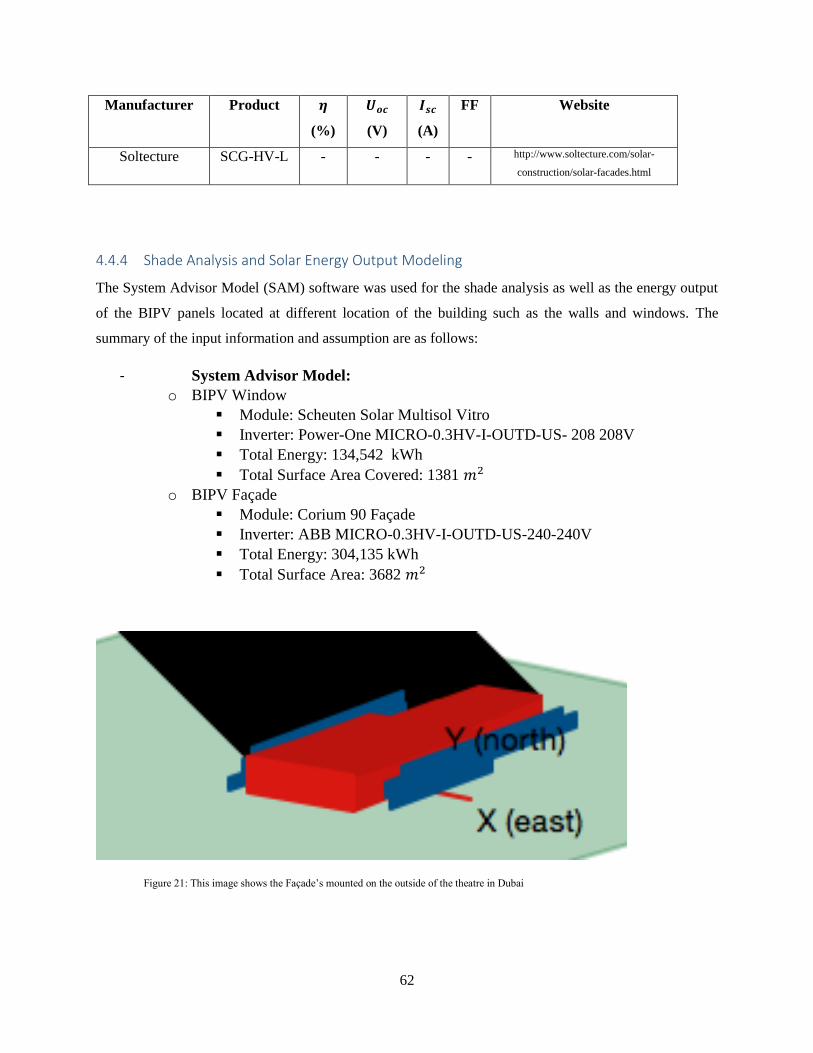
62
Manufacturer Product 𝜼
(%)
𝑼𝒐𝒄
(V)
𝑰𝒔𝒄
(A)
FF Website
Soltecture SCG-HV-L - - - - http://www.soltecture.com/solar-
construction/solar-facades.html
4.4.4 Shade Analysis and Solar Energy Output Modeling
The System Advisor Model (SAM) software was used for the shade analysis as well as the energy output
of the BIPV panels located at different location of the building such as the walls and windows. The
summary of the input information and assumption are as follows:
- System Advisor Model:
o BIPV Window
Module: Scheuten Solar Multisol Vitro
Inverter: Power-One MICRO-0.3HV-I-OUTD-US- 208 208V
Total Energy: 134,542 kWh
Total Surface Area Covered: 1381 𝑚2
o BIPV Façade
Module: Corium 90 Façade
Inverter: ABB MICRO-0.3HV-I-OUTD-US-240-240V
Total Energy: 304,135 kWh
Total Surface Area: 3682 𝑚2
Figure 21: This image shows the Façade’s mounted on the outside of the theatre in Dubai
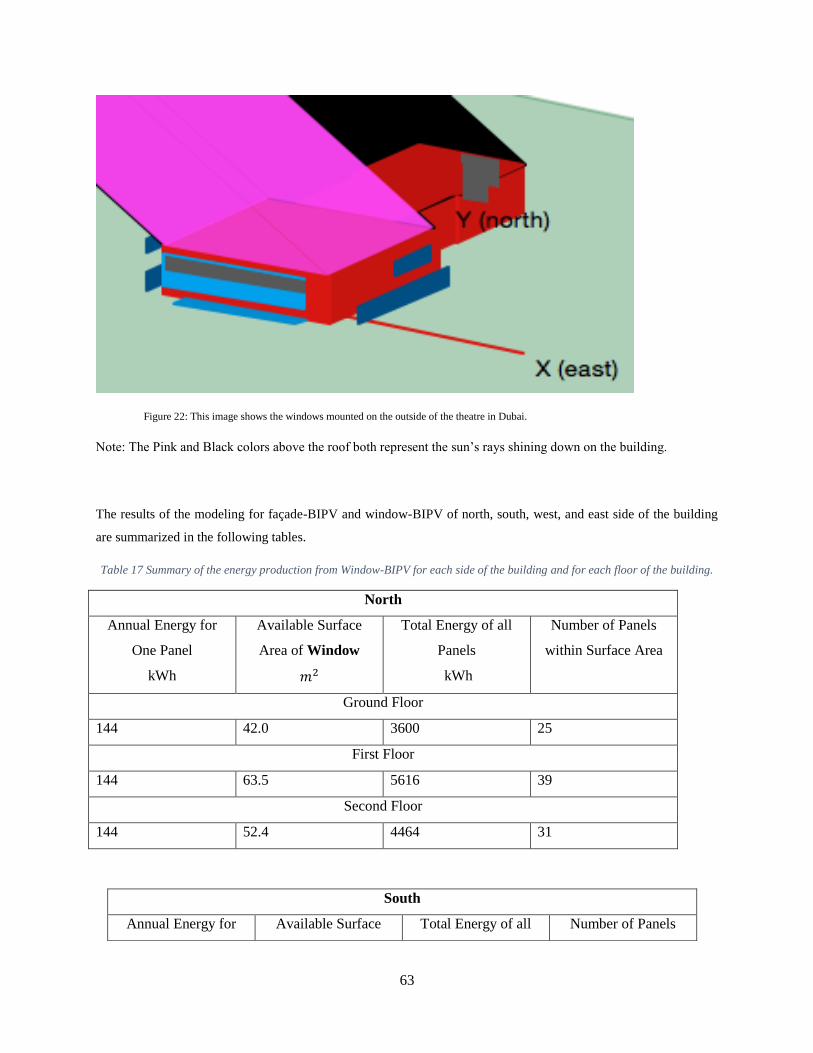
63
Figure 22: This image shows the windows mounted on the outside of the theatre in Dubai.
Note: The Pink and Black colors above the roof both represent the sun’s rays shining down on the building.
The results of the modeling for façade-BIPV and window-BIPV of north, south, west, and east side of the building
are summarized in the following tables.
Table 17 Summary of the energy production from Window-BIPV for each side of the building and for each floor of the building.
North
Annual Energy for
One Panel
kWh
Available Surface
Area of Window
𝑚2
Total Energy of all
Panels
kWh
Number of Panels
within Surface Area
Ground Floor
144 42.0 3600 25
First Floor
144 63.5 5616 39
Second Floor
144 52.4 4464 31
South
Annual Energy for Available Surface Total Energy of all Number of Panels

64
Annual Theoretical Energy for the Window – 132,014 kWh (132 mWh)
Actual Energy - 134, 542 kWh (134.5 mWh)
Note: The effects caused by the self-shading are negligible. This is due to the fact that the panels are
stacked on top of each other and oriented to 90°.
Table 18 Summary of the energy production from Facade-BIPV for each side of the building and for each floor of the building.
East
Annual Energy for
One Panel
kWh
Available Surface
Area of Façade
𝑚2
Total Energy of all
Panels
kWh
Number of Panels
within Surface Area
Ground Floor
57 441.2 31008 544
One Panel
kWh 𝑚2
Area of Window Panels
kWh
within Surface Area
Ground Floor
191 216.6 25212 132
First Floor
191 216.6 25212 132
Second Floor
191 204.885 23684 124
East
Annual Energy for
One Panel
kWh 𝑚2
Available Surface
Area of Window
Total Energy of all
Panels
kWh
Number of Panels
within Surface Area
Ground Floor
97 254.6 15035 155
Second Floor
97 83.7 5044 52
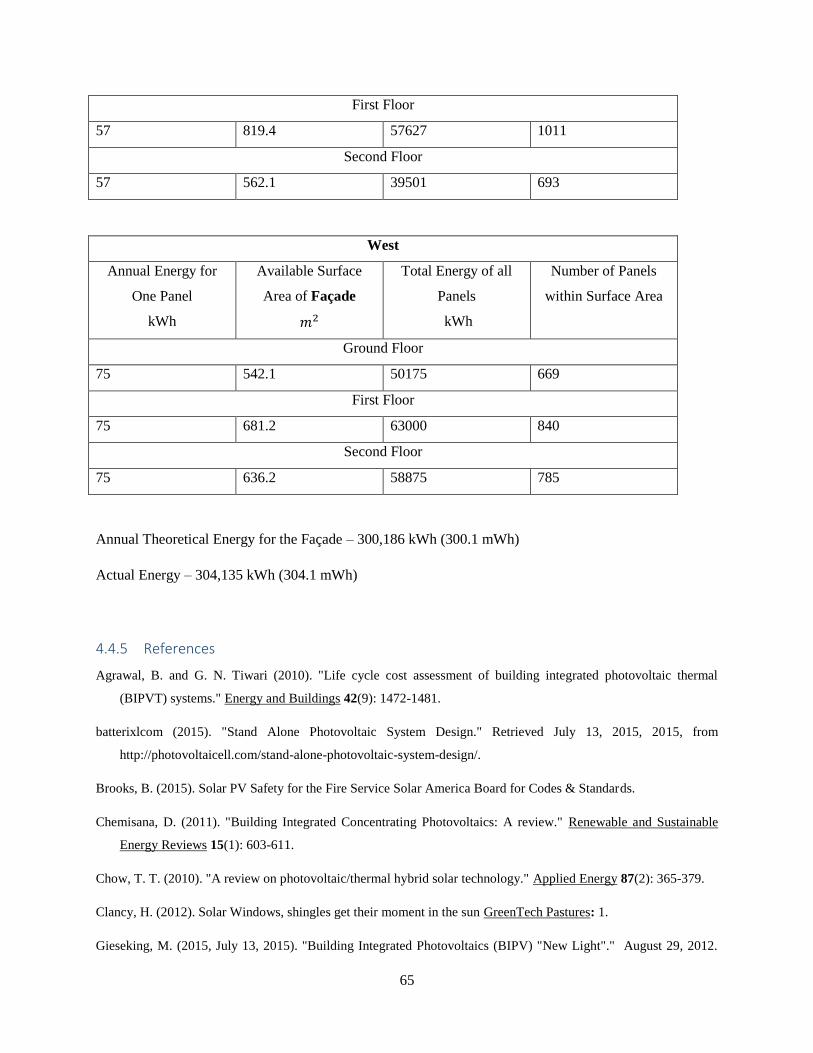
65
First Floor
57 819.4 57627 1011
Second Floor
57 562.1 39501 693
West
Annual Energy for
One Panel
kWh
Available Surface
Area of Façade
𝑚2
Total Energy of all
Panels
kWh
Number of Panels
within Surface Area
Ground Floor
75 542.1 50175 669
First Floor
75 681.2 63000 840
Second Floor
75 636.2 58875 785
Annual Theoretical Energy for the Façade – 300,186 kWh (300.1 mWh)
Actual Energy – 304,135 kWh (304.1 mWh)
4.4.5 References
Agrawal, B. and G. N. Tiwari (2010). "Life cycle cost assessment of building integrated photovoltaic thermal
(BIPVT) systems." Energy and Buildings 42(9): 1472-1481.
batterixlcom (2015). "Stand Alone Photovoltaic System Design." Retrieved July 13, 2015, 2015, from
http://photovoltaicell.com/stand-alone-photovoltaic-system-design/.
Brooks, B. (2015). Solar PV Safety for the Fire Service Solar America Board for Codes & Standards.
Chemisana, D. (2011). "Building Integrated Concentrating Photovoltaics: A review." Renewable and Sustainable
Energy Reviews 15(1): 603-611.
Chow, T. T. (2010). "A review on photovoltaic/thermal hybrid solar technology." Applied Energy 87(2): 365-379.
Clancy, H. (2012). Solar Windows, shingles get their moment in the sun GreenTech Pastures: 1.
Gieseking, M. (2015, July 13, 2015). "Building Integrated Photovoltaics (BIPV) "New Light"." August 29, 2012.
66
from https://mattgieseking.wordpress.com/2012/08/29/building-integrated-photovoltaics-bipv-new-light/.
Hwang, T., et al. (2012). "Optimization of the building integrated photovoltaic system in office buildings—Focus on
the orientation, inclined angle and installed area." Energy and Buildings 46: 92-104.
Maehlum, M. (2013). What is Building-Integrated Photovoltaics (BIPV)? Home Solar PV Green Building Elements.
I: 1.
Martin Treberspurg, M. D., Heimo Staller (2011). "New Technical Solutions for Energy Efficient Buildings " Sci-
Network.
McLaren, W. (2014). "Australian retrofit research and world-beating design." Retrieved 08/12/2015, 2015, from
http://www.architectureanddesign.com.au/news/
News, N. (2015). Solar Cells in the roof and nanotechnology in the walls. Nanowerk. I: 2.
Norton, B., et al. (2011). "Enhancing the performance of building integrated photovoltaics." Solar Energy 85(8):
1629-1664.
Peng, C., et al. (2011). "Building-integrated photovoltaics (BIPV) in architectural design in China." Energy and
Buildings 43(12): 3592-3598.
Petter Jelle, B., et al. (2012). "Building integrated photovoltaic products: A state-of-the-art review and future
research opportunities." Solar Energy Materials and Solar Cells 100: 69-96.
Prasad, D. and M. Snow (2014). Designing with solar power: a source book for building integrated photovoltaics
(BiPV), Routledge.
Singh, T. (2012). "Building-Integrated Photovoltaics Market Projected to Quadruple to $2.4 billion by 2017."
8/22/12. from http://inhabitat.com/building-integrated-photovoltaics-market-projected-to-quadruple-to-2-4-billion-
by-2017/.
Smith, S. (2014). BIPV Market: Global Industry Analysis, Size, Share, Growth, Trends & Forecast, 2013-2019. PR
Newswire, PR Newswire. I: I.
Ted James, A. G., Michael Woodhouse, Robert Margolis, and Sean Ong (2011). Building-Integrated Photovoltaic
(BIPV) in the Residential Sector: An Analysis of Installed Rooftop System Prices. National Renewable Energy
Laboratory: 50.
Wheeldon, D. B. a. D. (2012). Building Integrated Solar Panels. BPN Magazine Architecture & Design.
Yin, H. M., et al. (2013). "Design and performance of a novel building integrated PV/thermal system for energy
efficiency of buildings." Solar Energy 87: 184-195.
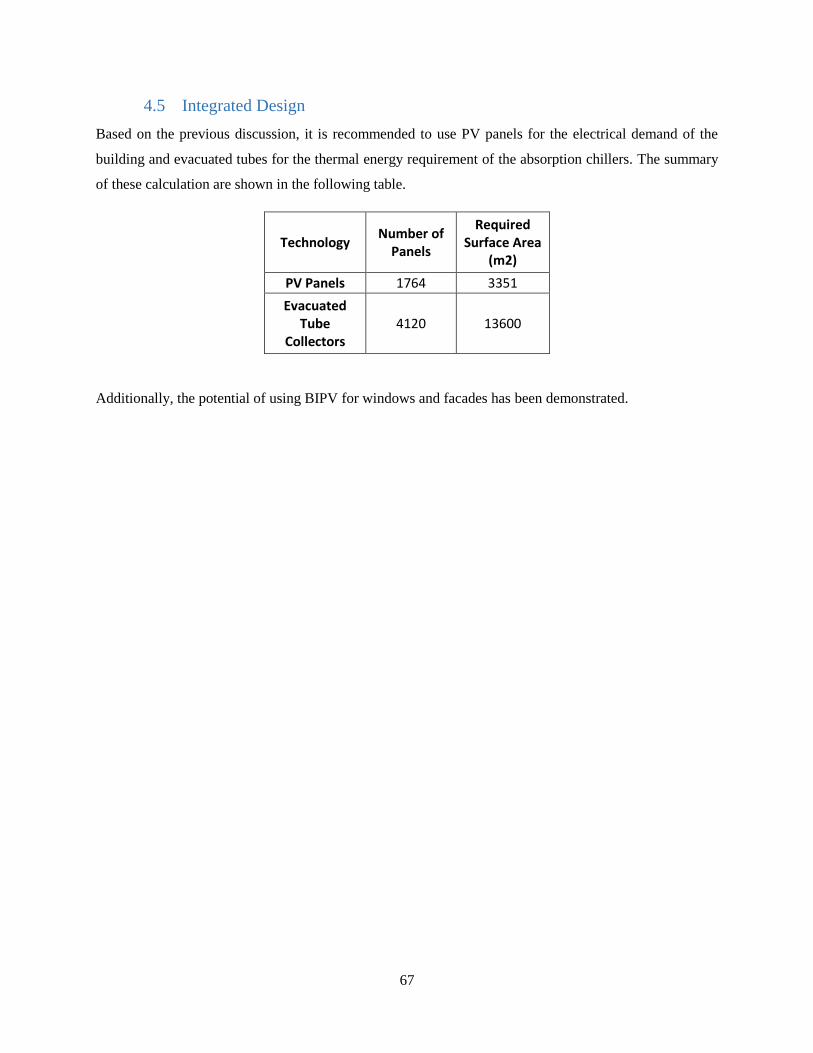
67
4.5 Integrated Design
Based on the previous discussion, it is recommended to use PV panels for the electrical demand of the
building and evacuated tubes for the thermal energy requirement of the absorption chillers. The summary
of these calculation are shown in the following table.
Technology Number of
Panels
Required Surface Area
(m2)
PV Panels 1764 3351
Evacuated Tube
Collectors 4120 13600
Additionally, the potential of using BIPV for windows and facades has been demonstrated.
68
5 Life Cycle Analysis (LCA)
In this section the LCA for the solar technologies and the air conditioning technologies has been
analyzed.
5.1 Solar Technologies
Today, there is much controversy over fossil fuel use due to large amounts of greenhouse
gas (GHG) emission, as well as facilitating depletion of natural resources. To help mitigate these
issues, different types of solar technologies exist which are able to capture solar radiation - a
renewable and widely available resource - and convert it into usable electricity. Examples of
such technologies are photovoltaic (PV), photovoltaic-thermal (PVT), concentrated solar power
(CSP). Using these as an alternative to power residential and commercial buildings lessens the
dependence on fossil fuel use and emission of GHGs into the environment, as these neither
consume fossil fuels nor emit GHGs during their operation (Kannan et al. 2006). However, there
are still energy requirements from sources such as manufacturing processes, transportation,
installation, and final disposal, and these sources also emit GHGs (Kannan et al. 2006). Life
cycle assessment (LCA) is a well-known procedure that can be used to calculate these energy
requirements as well as the environmental impacts (material requirements, GHG emission) for a
technology over its entire life cycle, which is typically from raw material extraction to final
product disposal. Performing LCA to quantify the life cycle energy requirement and GHG
emissions permits comparison of these solar technologies with each other as well as with existing
fossil fuel technology. From here on, we will refer to the life cycle energy requirement as the
embodied energy for simplicity.
A common way to compare technologies in terms of energy use is by calculating the
energy payback time (EPBT) which is the time required to produce energy equal to the embodied
energy,
𝐸𝑃𝐵𝑇 =𝐸𝑚𝑏𝑜𝑑𝑖𝑒𝑑 𝐸𝑛𝑒𝑟𝑔𝑦
𝑅𝑎𝑡𝑒 𝑜𝑓 𝐸𝑛𝑒𝑟𝑔𝑦 𝑃𝑟𝑜𝑑𝑢𝑐𝑡𝑖𝑜𝑛.
Here the embodied energy is in units of energy, and the rate of energy production is in units of
energy per time. To compare technologies based on EPBT, it is sufficient to select an arbitrary

69
rate of energy production to be held constant for all technologies and determine the size of the
system (and thus the embodied energy) required for each.
There are complications that arise in calculating the EPBT using the definition given
above as well as GHG emissions due to sensitivity of both embodied energy and the rate of
energy production. First, since the embodied energy is the sum of all energy requirements during
a products life cycle, it is sensitive to changes in any of these steps, such as the type of
manufacturing process used. GHG emissions are also sensitive to these same changes because
each step emits GHGs. Second, the rate of energy production is sensitive to an expansive set of
variables, some of which are module efficiency, local irradiation, ambient temperature, etc.
Standard test conditions (STC) for a PV module are an irradiation of 1000 𝑊/𝑚2 and an
ambient temperature of 25 °𝐶, and the actual operating conditions may vary greatly from STC. In
a study performed by Kannan et al., PV modules heated to module temperatures greater than
60°𝐶 in Singapore (Kannan et al. 2006). PV modules decrease in performance due to heating of
solar cells as characterized by a power temperature coefficient. For example, SUNPOWER X
Series PV modules have a power temperature coefficient of −0.3%/°𝐶. For these reasons, it is
of importance to calculate EPBT and GHG emissions based on a particular location while
holding as many variables constant as possible, minimizing the need for sensitivity analyses.
Choice of Location
One such location chosen for this work is the United Arab Emirates (UAE), chosen for
the relative absence of rain and cloud cover with 80-90% clear skies throughout the year
(Assessment 2013), and an obvious abundance of sand as a source of silicon. Another reason for
the choice of UAE is that there are several solar projects that either already exist or are expected
to be constructed in the future such as utility scale solar power plants and solar panel
manufacturing industries (Assessment 2013). The Research Center for Renewable Energy
Mapping and Assessment (ReCREMA) at the Masdar Institute developed an atlas of the solar
irradiance in UAE using satellite imagery with 15-minute time and 3 km space resolution
(Assessment 2013). This procedure yielded results of 1800-2200 𝑘𝑊ℎ/𝑚2 per year direct
70
normal irradiation (DNI) between the years of 2008 and 2010 (Assessment 2013). The DNI atlas
for years 2008 and 2010 are shown in the appendix.
Module Temperature
As stated earlier, the performance of a solar panel decreases with increasing module
temperature. The module temperature is dependent on several ambient conditions, some of which
are local irradiation, absorption and thermal dissipation behavior, glazing, tilt angle and wind
speed. Mounting configuration also affects the module temperature; open rack modules have
sufficient space underneath to allow for convective cooling of the module, while roof integrated
modules do not. Most of the dependence of module temperature on these conditions have been
shown to be lumped into a single parameter called the nominal operating cell temperature
(NOCT), which is typically shown on panel specification sheets provided by the manufacturer.
The calculation and use of NOCT is valid for very specific conditions, which are only for open
rack mounted modules with a tilt angle at normal incidence to the direct solar beam at local solar
noon, total irradiance of 800 𝑊/𝑚2, ambient temperature of 20°𝐶, wind speed of 1 𝑚/𝑠, and no
electrical load (Alonso García and Balenzategui 2004). The simplifying fact that allows for quick
calculation of the module temperature from NOCT is that the module temperature minus the
ambient temperature is independent of all ambient conditions, and only scales linearly with local
irradiation according to (Alonso García and Balenzategui 2004),
𝑇𝑚𝑜𝑑𝑢𝑙𝑒 − 𝑇𝑎𝑚𝑏𝑖𝑒𝑛𝑡 =(𝑁𝑂𝐶𝑇 − 20)
800𝐸,
Where E is the local irradiation in 𝑊/𝑚2. This equation is also valid for crystalline and CIGS
PV modules (Alonso García and Balenzategui 2004) under these same conditions. Since the
equation above is only valid for open rack modules and no electrical load, an installed NOCT
(INOCT) is typically used to take into account the mounting configuration and presence of an
electrical load (Alonso García and Balenzategui 2004). INOCT is typically 3°𝐶 less than NOCT
for open rack modules, and 10 − 20°𝐶 above NOCT for roof integrated modules depending on
convective cooling (Alonso García and Balenzategui 2004). We will use the SAM software for

71
modeling electricity production for PV panels, which uses an INOCT of 45C for open rack
modules, and 50C for roof mounted modules.
About LCA
LCA accounts for only the environmental impacts of a given system and excludes economic or
social impacts. A thorough LCA considers the entire life cycle of a system, from raw material
extraction, product manufacturing, and ultimately to end of life disposal. The conventional
procedure for LCA is divided into four phases according to the ISO 14040-2006 standard. These
four phases are a) Goal and Scope Definition, b) Inventory Analysis, c) Impact Assessment, d)
Interpretation of Results.
Goal and Scope
The goal and scope definition phase sets the framework for the entire LCA. The goal of the LCA
is to identify the application, audience, and results of the system to be studied. The scope of the
LCA describes the system, the functional unit, the system boundary, and any assumptions or
limitations. A choice of functional unit is the relative basis for which all results are
communicated. An example of this is choosing a functional unit of 1 kWhr of produced energy
for solar PV modules, and thus all results are reported on the basis of this functional unit. The
system boundary is chosen based on the unit operations that are to be accounted in the LCA.
Inventory Analysis
The inventory analysis phase concerns accounting of data regarding each unit process, such as
material and energy requirements, production, and waste/emissions. There must also be a
validation procedure for this data as well as relation to the functional unit.
Impact Assessment
The impact assessment phase quantifies possible environmental impacts in terms of specific
categories and indicators, clearly stating all assumptions.
Interpretation of Results
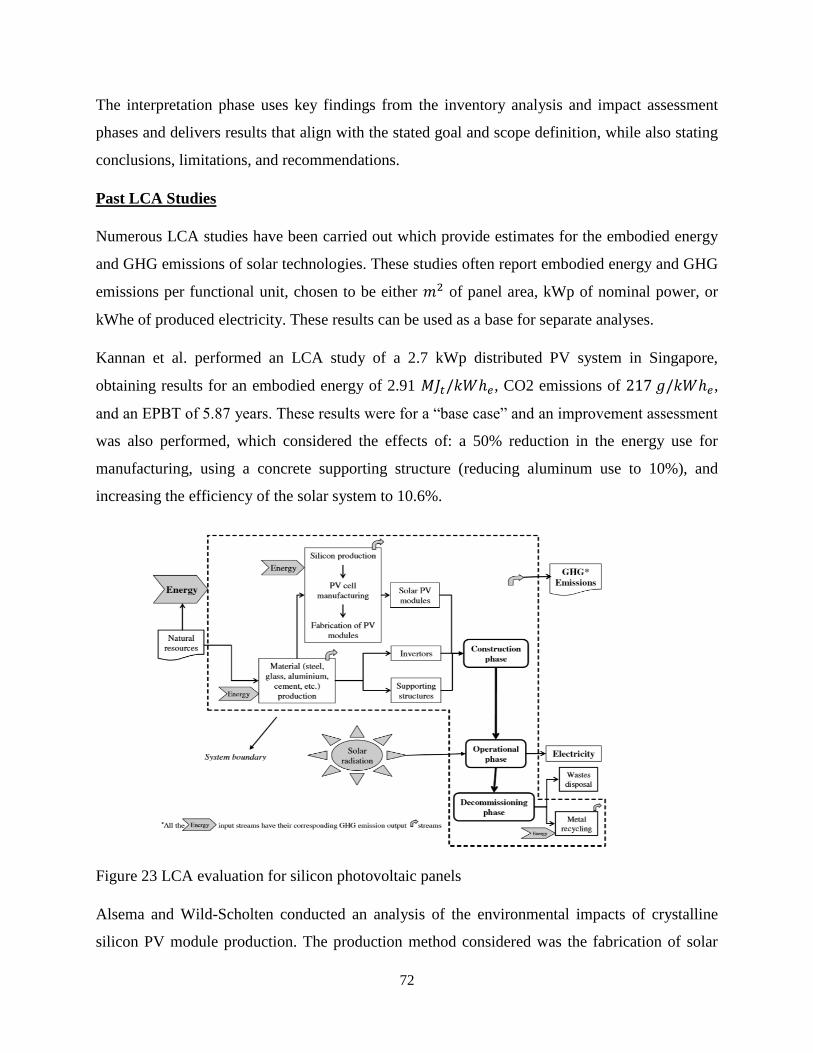
72
The interpretation phase uses key findings from the inventory analysis and impact assessment
phases and delivers results that align with the stated goal and scope definition, while also stating
conclusions, limitations, and recommendations.
Past LCA Studies
Numerous LCA studies have been carried out which provide estimates for the embodied energy
and GHG emissions of solar technologies. These studies often report embodied energy and GHG
emissions per functional unit, chosen to be either 𝑚2 of panel area, kWp of nominal power, or
kWhe of produced electricity. These results can be used as a base for separate analyses.
Kannan et al. performed an LCA study of a 2.7 kWp distributed PV system in Singapore,
obtaining results for an embodied energy of 2.91 𝑀𝐽𝑡/𝑘𝑊ℎ𝑒, CO2 emissions of 217 𝑔/𝑘𝑊ℎ𝑒,
and an EPBT of 5.87 years. These results were for a “base case” and an improvement assessment
was also performed, which considered the effects of: a 50% reduction in the energy use for
manufacturing, using a concrete supporting structure (reducing aluminum use to 10%), and
increasing the efficiency of the solar system to 10.6%.
Figure 23 LCA evaluation for silicon photovoltaic panels
Alsema and Wild-Scholten conducted an analysis of the environmental impacts of crystalline
silicon PV module production. The production method considered was the fabrication of solar

73
PV modules from silicon wafers. They considered one module type with 72 cells,
glass/EVA/tedlar lamination, module area of 1.25 𝑚2, and a glass thickness of 3.6mm. They
considered unframed and framed (3.8kg aluminum frame) modules, and assumed the module
lifetime was 30 years. Their analysis was performed with the Simapro software.
Perpinan et al. performed an LCA comparison of tracking and fixed PV systems. They calculated
EPBTs for double and horizontal axis tracking and fixed systems. According to their
calculations, a grid connected PV system is able to produce from 6-15 times its embodied energy
over a lifetime of 30 years.
Embodied Energy
The embodied energy for PV modules is composed of energy requirements from several life
cycle unit operations. These unit operations are raw material extraction and feedstock generation,
module fabrication, transportation, installation, operation, and disposal/recycling. For PV
modules, it has been shown in previous studies that the fabrication energy for modules is roughly
80% of the embodied energy (Kannan et al. 2006) (Perpiñan et al. 2009), and that the remaining
20% is taken up by lesser contributions such as transportation, installation, and end of life
disposal.
Figure 24 Percent contributions to the embodied energy of solar PV modules, reproduced with
permission from Kannan et al. (Kannan et al. 2006).
74
These contributions present a large potential for sensitivity since there are numerous
combinations of unit operations that can be selected for the entire life cycle. For example, the
transportation energy depends on the method of transportation and the distance between the
manufacturer and the operating location. The installation energy depends on the construction and
materials used in the balance of system (BOS) and the inverters used. The disposal energy
depends on the disposal method, and whether or not there is any recycling of material. For this
reason, calculations of these contributions were neglected, and the embodied energy was scaled
to 100% from the fabrication energy only assuming other factors remain constant at 20%.
Module Fabrication
The since the fabrication energy for PV modules is most of the embodied energy, the type of
process used to manufacture the modules is of great importance. There are several options that
can be used to manufacture the modules, each with their own fabrication energy. Past LCA
studies either use values of the fabrication energy from other studies, or calculate it explicitly in
the LCA study.
Kannan et al. reported values from other studies for the fabrication energy of monocrystalline PV
panels based on the type of process used. These reported values considered the functional unit as
1 kWp of modules. From extracting mineral sand to module fabrication, the fabrication energy
was 13.78 𝑀𝑊ℎ𝑡/𝑘𝑊𝑝. From growth of a silicon ingot to module fabrication, the fabrication
energy was 16 𝑀𝑊ℎ𝑡/𝑘𝑊𝑝. From off-grade silicon to module fabrication, the fabrication
energy was 12.4 𝑀𝑊ℎ𝑒/𝑘𝑊𝑝. From quartz to module fabrication, the fabrication energy was
17.70 𝑀𝑊ℎ𝑒/𝑘𝑊𝑝. From wafer sawing to module fabrication, the fabrication energy was 40.55
𝑀𝑊ℎ𝑡/𝑘𝑊𝑝 (Kannan et al. 2006).
Alsema and Wild-Scholten calculated the fabrication energies for crystalline silicon modules in
their study (Alsema and de Wild 2011). The manufacturing process they considered was
Czochralski crystal growth followed by wafer sawing. Their results for fabrication energies were
5200, 4000, and 2600 MJ per square meter of panel for monocrystalline, polycrystalline, and
CIGS, respectively. The relative contributions of each process step to the fabrication energies are
shown below. The fabrication energy for CIGS modules is the lowest because of lower energy

75
requirements in the crystallization and wafer step, as well as no silicon loss from wafer sawing
(Alsema and de Wild 2011). The fabrication energy for monocrystalline module production is
the highest because of the higher energy requirement for Czochralski crystal growth (Alsema and
de Wild 2011). The relative contributions for each process step to the fabrication energy are
shown below in figure 1. For all three module types, the frame, module assembly, and cell
production contributions are approximately constant. The energy to obtain the silicon feedstock,
grow the ingot, and saw the wafer compose most of the fabrication energy, and it can be inferred
that improvements to these steps would have the most contribution towards reducing the
fabrication energy.
Figure 25 Energy input for crystalline silicon modules, in MJ per square meter, with the relative
contributions of each step. Reproduced with permission from Alsema and Wild-Scholten
(Alsema and de Wild 2011).
For the crystal growth to wafer sawing process, several other results for the energy breakdown of
PV module manufacturing have been tabulated by Peng et al. in their review of life cycle
assessment of solar PV systems (Peng, Lu, and Yang 2013).
GHG Emissions and Environmental Impacts
The GHG emissions were estimated assuming that results from previous studies are sufficient to
act as emission factors for our methodology. Alsema and Wild-Scholten calculated the emission
factors for crystalline silicon PV modules (Alsema and de Wild 2011), and the results are shown

76
below in g CO2/kWh (kg CO2/MWh). The emission factors are comparable to biomass, but
significantly lower than hard coal or gas turbine emission factors.
Figure 26 Greenhouse gas emission of silicon PV compared with other energy resources.
(Alsema and de Wild, 2011)
CO2 emission factors typically show high variability of around 1 order of magnitude (Turconi,
Boldrin, and Astrup 2013) mainly due to local conditions such as electricity and fuel sources,
climate conditions, and panel types. Turconi et al. reviewed the GHG emissions of 22 LCA
studies and found a range of 13-130 kg CO2/MWh.
It is important to note that purely considering CO2 emissions do not represent the full range of
emission types and environmental impacts. For example, solar technologies also have lesser
amounts of NOx and SO2 emissions. To correctly account for the overall emissions, all direct
and indirect emissions must be accounted for. Indirect emissions from fossil fuels may represent
up to 25% of the overall emissions, and this figure is even larger for renewable technologies
(Turconi, Boldrin, and Astrup 2013). Corona et al. considered the following other environmental
impacts in their LCA study (Corona, Miguel, and Cerrajero 2014)of a CSP plant: Human
toxicity, terrestrial acidification, freshwater eutrophication, marine ecotoxicity, natural land
transformation, water depletion, and fossil depletion.
EPBT

77
The EPBT will be calculated by dividing the embodied energy by the rate of energy production,
which we will set constant at 1 MWh/yr of electricity. EPBT is sensitive to several factors, and
thus a variety of sensitivity analyses can be performed to obtain a wide range of EPBTs. For
example EPBT can be defined in terms of consumer energy use instead of on site energy
production, which includes transmission and distribution losses. Kannan et al. found
transmission and distribution losses to be around 4% in Singapore (Kannan et al. 2006). Another
sensitivity analysis that could be performed is an improvement assessment. Kannan et al.
performed an improvement assessment for their PV system in Singapore by considering a “base
case” and several improvement cases (Kannan et al. 2006). These improvement cases included:
A) reducing the fabrication energy by 50%, B) reducing aluminum use by 10%, and C)
increasing solar system efficiency.
LCA Methodology
We will use an approximate LCA methodology conducted using the results of previous studies.
Three types of solar technologies were analyzed: PV, PVT and CSP. For each technology, the
embodied energy will be calculated based on a functional unit of 1 MWh/yr of annual electricity
generation. The GHG emissions will be reported solely on CO2 emissions over the whole life
cycle, in kg. The lifetime of the system will be 25 years.
The most detailed analysis will be performed on PV panels due to the high availability of
information on the production processes of PV panels. For PV and PVT, we will mainly follow
the results obtained by Alsema and Wild-Scholten (Alsema and de Wild 2011), as well as using
information from PV panel specification sheets. The study by Alsema and Wild-Scholten was
listed in the harmonization study by Hsu et al (Hsu et al. 2012), passing the quality, transparency,
and modern relevance screenings, so we assume that their LCA procedure is thorough and
reliable. For PV, we will use the energy modeling software SAM, and for PVT we will use the
energy modeling software POLYSUN. The software will simulate the PV technologies in the
climate of UAE. An approximate scaling analysis will be performed based on a site-specific
LCA study by Corona et al. (Corona, Miguel, and Cerrajero 2014) performed for a CSP plant.
We will use the results of this study because the local irradiation in Castilla La Mancha, Spain is
2030 𝑘𝑊ℎ/𝑚2 per year, which is consistent with the expected range in the UAE. Also, the
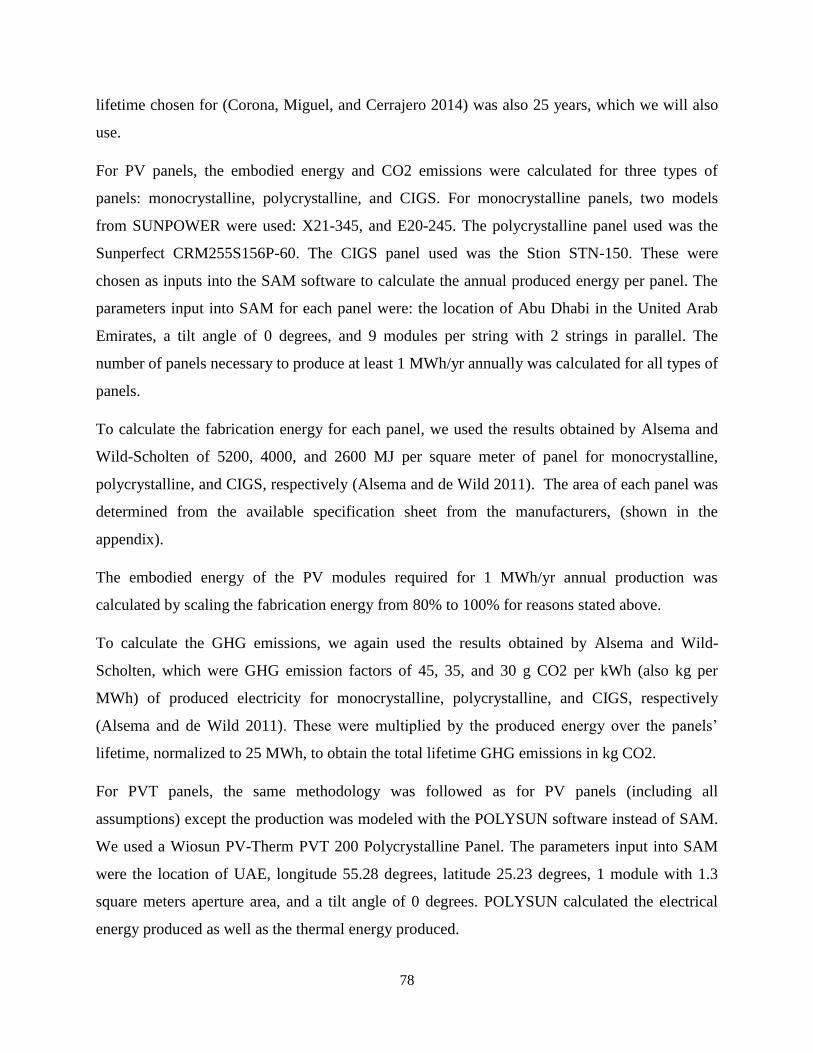
78
lifetime chosen for (Corona, Miguel, and Cerrajero 2014) was also 25 years, which we will also
use.
For PV panels, the embodied energy and CO2 emissions were calculated for three types of
panels: monocrystalline, polycrystalline, and CIGS. For monocrystalline panels, two models
from SUNPOWER were used: X21-345, and E20-245. The polycrystalline panel used was the
Sunperfect CRM255S156P-60. The CIGS panel used was the Stion STN-150. These were
chosen as inputs into the SAM software to calculate the annual produced energy per panel. The
parameters input into SAM for each panel were: the location of Abu Dhabi in the United Arab
Emirates, a tilt angle of 0 degrees, and 9 modules per string with 2 strings in parallel. The
number of panels necessary to produce at least 1 MWh/yr annually was calculated for all types of
panels.
To calculate the fabrication energy for each panel, we used the results obtained by Alsema and
Wild-Scholten of 5200, 4000, and 2600 MJ per square meter of panel for monocrystalline,
polycrystalline, and CIGS, respectively (Alsema and de Wild 2011). The area of each panel was
determined from the available specification sheet from the manufacturers, (shown in the
appendix).
The embodied energy of the PV modules required for 1 MWh/yr annual production was
calculated by scaling the fabrication energy from 80% to 100% for reasons stated above.
To calculate the GHG emissions, we again used the results obtained by Alsema and Wild-
Scholten, which were GHG emission factors of 45, 35, and 30 g CO2 per kWh (also kg per
MWh) of produced electricity for monocrystalline, polycrystalline, and CIGS, respectively
(Alsema and de Wild 2011). These were multiplied by the produced energy over the panels’
lifetime, normalized to 25 MWh, to obtain the total lifetime GHG emissions in kg CO2.
For PVT panels, the same methodology was followed as for PV panels (including all
assumptions) except the production was modeled with the POLYSUN software instead of SAM.
We used a Wiosun PV-Therm PVT 200 Polycrystalline Panel. The parameters input into SAM
were the location of UAE, longitude 55.28 degrees, latitude 25.23 degrees, 1 module with 1.3
square meters aperture area, and a tilt angle of 0 degrees. POLYSUN calculated the electrical
energy produced as well as the thermal energy produced.

79
For CSP, the embodied energy and CO2 emissions were calculated using the results from a
separate LCA study (Corona, Miguel, and Cerrajero 2014) on a reference power plant based on
parabolic troughs with wet cooling. The plant has a 50 MW capacity, synthetic oil as the heat
transfer fluid, and a 7.5-h molten salt thermal energy storage system (Corona, Miguel, and
Cerrajero 2014). The useful results for this LCA study are the embodied energy and emission
factors, which are 1.15 MJ per kWh of produced electricity, and 26.6 kg CO2 per MWh of
produced electricity. These values will be used with a hypothetical annual electricity production
of 1 MWh/yr to calculate the EPBT.
Results
The results of our methodology indicate that for PV technologies, CIGS panels have the lowest
embodied energy, CO2 emissions, and EPBT, making them an attractive option for use in UAE.
The results are reasonable since for all panels the embodied energy, CO2 emissions, and EPBT
are within a factor of 2 apart. The Sunpower X21-345 (Sunpower X) panel has the highest EPBT
of all panels. Comparing the two monocrystalline panels, (Sunpower X and E), the Sunpower X
requires less panels to produce 1 MWh/yr, but still has a higher embodied energy per panel due
to the larger surface area. The EPBTs for the Sunpower E and the Sunperfect panel are the same,
which is probably a coincidence. The EPBT for the Stion STN-150 is the lowest. Even though
the STN-150 needs more panels to produce 1 MWh/yr, the reduction in embodied energy per
panel is significant compared to all other panels. This can be attributed to the low fabrication
energy of 2600 MJ per square meter of panel, since the surface area of a typical PV panel ranges
80
from 1-1.6 square meters and is unlikely to vary too significantly between technologies. From
our methodology it can be generalized that CIGS panels have the lowest GHG emissions because
the electricity production is constant over all panels, making the GHG emissions entirely
dependent on the CO2 emission factor.
The results for the Polysun model for PVT were that the electrical energy production for each
panel was 335 𝑘𝑊ℎ/𝑦𝑟, and the thermal energy production was 284 𝑘𝑊ℎ/𝑦𝑟. The embodied
energy was calculated to be 5.46 MWh since the Wiosun panel is polycrystalline. The CO2
emissions were calculated to be 1625 kg if the emission factor is multiplied by the sum of
thermal and electrical energy, and 875 kg if the emission factor is multiplied with electrical
energy only. The EPBT with electrical energy only was calculated to be 5.43 years, and 2.94
years including thermal energy. From these results we can see that the embodied energy, CO2
emissions, and EPBT of PVT panels are comparable with PV technologies considering only
electrical energy, which is primarily because of using the same methodology. However, with the
consideration of thermal energy the EPBT decreases significantly and this energy can also be
used for other uses.
For the reference CSP plant, the embodied energy and emission factor yielded values of 7.98
MWh for the embodied energy, 665 kg for CO2 emissions, and 7.98 years for the EPBT. It is
notable that the CSP model yielded the lowest CO2 emissions of all technologies considered, but
at the price of a higher EPBT.
For the EVAC, the OI collector was determined to have an embodied energy of 156.52 kWh
while delivering 20.3 kWh/yr of useful heat, leading to an EPBT of 7.51 years. CO2 emissions
were not determined because of a lack of LCA studies performed on evacuated tube collectors.
81
If electrical energy is the only concern, it is recommended to move forward with CIGS panels
due to the low CO2 emissions and EPBT. If electricity and thermal energy are to be considered,
it is recommended to use PVT panels because of the ability to supply thermal energy as well as
having the lowest EPBT with low CO2 emissions as well. If CO2 emissions are the primary
concern, it is recommended to use CSP technology due to having the lowest CO2 emissions.
It is important to note that the results of this LCA study are limited to the assumptions and
methodology used. Notable assumptions include the 80%-100% scaling of the fabrication energy
to represent the embodied energy for PV and PVT panels, as well as the choice for the embodied
energy and CO2 emission factors based on past studies. This study was conducted using the
SAM and Polysun software to model the electricity production for PV and PVT panels, but any
software that can do this will suffice. A limited number of panels were used for the study, which
prevents any sensitivity analyses from being performed. A further extension of this study would
be to use a wider range of panels in order to examine relevant trends and possibly perform an
optimization procedure. The methodology could also be extended to include amorphous Si or
hybrid PV panels. For CSP, the main limitation is from the assumption that the results of the
reference plant can be applied to a hypothetical plant in UAE based on similar annual
irradiances. Realistically, constructing the same plant in UAE would change the embodied
energy. The methodology used for the OI evacuated tube collector may be outdated, as the
equation for the rate of useful heat was derived in 1978. Also, the results are limited to only a
collector of the specified dimensions and materials. Another recommendation for further
research would be to perform a rigorous LCA study for all technologies, and compare the results
to our approximate study.
Conclusion
The approximate LCA methodology yielded reasonable results for the embodied energies, CO2
emissions, and EPBTs of the solar technologies studied. Further research related to this study
could reveal trends about the dependence of specifications such as surface area and other
operating characteristics on the CO2 emissions and EPBT of these technologies. The
methodology and results of this study are useful for evaluating the environmental impacts of
technologies for sustainable zero net energy building design.

82
5.2 Air Conditioning System
After coming up with a design that accurately suits the Center of Excellence in Dubai, it was important to
perform some life cycle cost analysis in order to predict the initial capital cost of the components of the
system. Please note that the numbers provided in this section are estimations of the cost found using
online resources.
Table 19: Component capital cost.
Building absorption chiller $110,000– 220,000
Auditorium absorption chiller $110,000 – 220,000
Building Desiccant Wheel $75,000
Auditorium Desiccant Wheel $75,000
Building Sensible Wheel $11,000
Auditorium Sensible Wheel $11,000
Piping cost $20,000
Solar Collectors 44,000 $
Total (For Max. Price) $636,000
Annual Operating Cost $50,000
Since the proposed project will be generating electricity, the amount of money saved will be compared to
the capital cost of the proposed model. The procedure for Life Cycle Cost (LCC) analysis is shown below
where A is the annual operating cost for each case, DR is the discount rate that was taken as 3% and n is
the number of years:
DCF =A
DRn
CDCF = ∑ DCF
n
1
The electricity charges in the State of Dubai are 38 fils/kWh for industrial applications who consume
more than 10,001 kWh per month. The electricity demand was already found to be 975.1 MWh per year.
Hence, the building would have needed 100,050$ worth of electricity per year. After considering the
maximum HVAC electric need of $22,700 and $20,700 for the auditorium and building absorption
chillers, and using a discount rate of 3% and lifespan of 50 years, the suggested system gave a payback
period of 8 years.

83
5.3 References
Chengdu Xushuang Solar Technology Co., Ltd." http://www.tradett.com/products/u59707p503460/a-si-thin-film-solar-energy-power-bapv-solar-roof.html.
Alonso García, M. C., and J. L. Balenzategui. 2004. "Estimation of photovoltaic module yearly temperature and performance based on Nominal Operation Cell Temperature calculations." Renewable Energy 29 (12):1997-2010. doi: 10.1016/j.renene.2004.03.010.
Alsema, Erik, and Mariska J. de Wild. 2011. "Environmental Impact of Crystalline Silicon Photovoltaic Module Production." MRS Proceedings 895. doi: 10.1557/proc-0895-g03-05.
Assessment, Research Center for Renewable Energy Mapping and. 2013. The UAE Solar Atlas. Masdar Institute. batterixlcom. 2015. "Stand Alone Photovoltaic System Design." Accessed July 13, 2015. http://photovoltaicell.com/stand-alone-
photovoltaic-system-design/. Corona, Blanca, Guillermo San Miguel, and Eduardo Cerrajero. 2014. "Life cycle assessment of concentrated solar power (CSP)
and the influence of hybridising with natural gas." The International Journal of Life Cycle Assessment 19 (6):1264-1275. doi: 10.1007/s11367-014-0728-z.
Gieseking, Matt. 2015. "Building Integrated Photovoltaics (BIPV) "New Light"." Last Modified July 13, 2015. https://mattgieseking.wordpress.com/2012/08/29/building-integrated-photovoltaics-bipv-new-light/.
Hsu, David D., Patrick O’Donoughue, Vasilis Fthenakis, Garvin A. Heath, Hyung Chul Kim, Pamala Sawyer, Jun-Ki Choi, and Damon E. Turney. 2012. "Life Cycle Greenhouse Gas Emissions of Crystalline Silicon Photovoltaic Electricity Generation." Journal of Industrial Ecology 16:S122-S135. doi: 10.1111/j.1530-9290.2011.00439.x.
Kannan, R., K. C. Leong, R. Osman, H. K. Ho, and C. P. Tso. 2006. "Life cycle assessment study of solar PV systems: An example of a 2.7kWp distributed solar PV system in Singapore." Solar Energy 80 (5):555-563. doi: 10.1016/j.solener.2005.04.008.
Peng, Changhai, Ying Huang, and Zhishen Wu. 2011. "Building-integrated photovoltaics (BIPV) in architectural design in China." Energy and Buildings 43 (12):3592-3598. doi: 10.1016/j.enbuild.2011.09.032.
Peng, Jinqing, Lin Lu, and Hongxing Yang. 2013. "Review on life cycle assessment of energy payback and greenhouse gas emission of solar photovoltaic systems." Renewable and Sustainable Energy Reviews 19:255-274. doi: 10.1016/j.rser.2012.11.035.
Perpiñan, O., E. Lorenzo, M. A. Castro, and R. Eyras. 2009. "Energy payback time of grid connected PV systems: Comparison between tracking and fixed systems." Progress in Photovoltaics: Research and Applications 17 (2):137-147. doi: 10.1002/pip.871.
Petter Jelle, Bjørn, Christer Breivik, and Hilde Drolsum Røkenes. 2012. "Building integrated photovoltaic products: A state-of-the-art review and future research opportunities." Solar Energy Materials and Solar Cells 100:69-96. doi: 10.1016/j.solmat.2011.12.016.
Sher, Hadeed Ahmed, and Khaled E. Addoweesh. 2012. "Micro-inverters — Promising solutions in solar photovoltaics." Energy for Sustainable Development 16 (4):389-400. doi: 10.1016/j.esd.2012.10.002.
Singh, Timon. 2012. "Building-Integrated Photovoltaics Market Projected to Quadruple to $2.4 billion by 2017." http://inhabitat.com/building-integrated-photovoltaics-market-projected-to-quadruple-to-2-4-billion-by-2017/.
Turconi, Roberto, Alessio Boldrin, and Thomas Astrup. 2013. "Life cycle assessment (LCA) of electricity generation technologies: Overview, comparability and limitations." Renewable and Sustainable Energy Reviews 28:555-565. doi: 10.1016/j.rser.2013.08.013.
Unknown. 2015. "Building Integrated Solar (BIPV)." Accessed July 13, 2015. http://dynamicsolartech.com/solutions/building-integrated-photovoltaics-bipv-installation/.

84
6 Social and Behavioral Studies: Promoting Energy Conservation from
a Hybrid Solar-Air Conditioning System
In this chapter we address the human factors related to system performance and acceptability. Since the
occupants’ experience of cooling is largely the same with the proposed PVT system as a conventional
HVAC system ubiquitous in the region (i.e., it provides centralized cooling operated by standard
controls), the main concern with respect to social and behavioral considerations relates to control and
acceptability of the temperature setting. Although there are cultural norms that influence thermostat
settings in a given time and place, thermal comfort varies widely across individuals. The Sustainable
Center of Excellence will attract people from around the world, each with their own needs, preferences,
expectations, and priorities. The system design, particularly the expectation of delivering cooling to
24°C, will satisfy some occupants more than others. Ensuring system performance will require that
occupants’ behavior (i.e., use of the system) conforms to the expectations of the model, which may
require certain changes by the occupants themselves.
As this chapter describes, we conducted a survey on thermal comfort in the workplace to gauge the
acceptability of the system design among future occupants of Sustainable Center of Excellence. Based on
those findings, we developed a multi-pronged strategy to encourage conservation among occupants and
address the relevant human factors related to system acceptance. Based on the theory of behavior change,
the physiological and cultural aspects of thermal comfort, and international best practice on thermostatic
control, we developed recommendations for selecting controls technology, encouraging occupant
acceptance and adaption, and empowering occupants to control temperature settings, in order to promote
energy conservation and reliable system operation. In total we provide twelve recommendations on the
human factors related to ensuring performance of the solar PVT system designed in the current project.
6.1 Technology & energy conservation
The first part of the strategy must be to ensure that the space is conditioned only as needed. This can be
done through a variety of methods. Room thermostats can be programmed to deliver varying degrees of
cooling when the space is: a) occupied, b) unoccupied overnight (“nighttime unoccupied”), and c)
unoccupied for a short time between occupied periods (“daytime unoccupied”), the latter being the most
complex. In order to ensure thermal comfort during the occupied times, the timing and temperature
settings have to be established such that the desired temperature during occupied times can be reached
before or soon after occupancy.

85
Inputting schedules in each thermostat requires programming each device according to the room’s
expected usage, which may change over the course of the year, depending on the room’s purpose and the
weather. Some thermostats make this very easy to accomplish. For example, several web-enabled
thermostats on the market can be networked with others in a building and controlled from a central web
portal6. Such technologies can save building facilities staff a substantial amount of time when changes
are needed throughout the system with some regularity.
In addition to conserving energy when rooms are unoccupied, Diamond Developers has expressed the
desire to conserve energy by nudging the default temperature slightly above what is considered standard
by many in Dubai, namely 22°C. Together with Diamond Developers, we have identified 24°C as the
preferred target temperature when the building is occupied. According to Diamond Developers’
suggestion, our air conditioning calculations are based on the AC setting temperature of 22OC. The
technical design of the system has been completed with that target in mind, albeit with some built-in over-
design to ensure reliability. Since slight changes in the temperature setting can have a substantial impact
on the energy demand of the building without sacrificing thermal comfort, we have considered the
implications of a higher temperature settings from behavioral, social, and educational points of view.
Appropriate outreach activities and thermostatic control will be required to ensure that the building is
conditioned in accordance with conservation goals and occupant needs. Recommendations to that end are
outlined below.
6.2 Behavior & energy conservation
The higher set point (i.e., 24°C) will likely be embraced by some and resisted by others. Therefore,
encouraging occupants to accept the system, along with its advantages and disadvantages, will be of
critical importance.
To gauge the level of acceptance or resistance our recommendations are likely to face among building
occupants, we created an online survey7 to gather information on the indoor temperature preferences of
likely building occupants, both regular and sporadic.8 The thermal comfort survey was circulated among
Diamond Developer staff. As individuals who work in environments similar to the future management
6 Examples include “smart” thermostats manufactured by ecobee (www.ecobee.com) and Telkonet’s EcoTouch
(https://telkonet.com). 7 The survey is accessible at https://ucdavisbusiness.co1.qualtrics.com/SE/?SID=SV_4Jyy31mRaNpnfql.
8 The survey questions were derived in part from information gathered from UC Berkeley’s Center for the Built
Environment at http://smap.cbe.berkeley.edu/comforttool and the classic reference by Brager et al (1993).

86
offices of the Center of Excellence (e.g., workers with offices or cubicles), they serve as proxies for future
building occupants. In addition, the survey was circulated among professional contacts of the research
team, primarily from the Middle East, who represent the types of international visitors the Center might
attract.9 The results could provide useful guidance when selecting from among the various technical
options for thermostatic control described below.
Data was collected from 57 individuals. Survey respondents are a diverse group reflecting the variation
in occupants the Center is likely to attract. They are 58% female and relatively young (i.e., 53% under 31
years old, 35% 31-50 years old, 12% 51 years old or greater). Respondents work in a range of
environments (e.g., closed office, cubicle, shared office, other), and their jobs range from very physically
active to not at all physically active.
Sixty-one percent (n=35) have the ability, in terms of both access and permission, to change the
temperature in their workplace. Respondents’ preferred workplace temperature in summer ranges from
18° C to 25° C, averaging 22.3° C. In fact, 48% prefer a temperature greater than 22° C, and 30% prefer
24° C or greater. Figure 24 below shows the exact counts. On the face of it, this would suggest that less
than one-third of respondents, and the future occupants of the Center of Excellence whom they represent,
would be amenable to a temperature setting of 24° C. However, further probing in the survey uncovered
greater willingness to accept higher temperatures, as is discussed below.
Figure 24 Histogram of preferred workplace temperatures in summer
9 Note that the survey was not submitted to the UC Davis Institutional Review Board for a Human Subjects
Protection review. Since the survey was implemented solely for the purpose of collecting information for the Center
for Excellence, and we make no claims of generalizability to the population more broadly, it is considered an
organizational improvement activity, rather than research, per se. As such, it falls outside the purview of the IRB.
0
5
10
15
20
18 19 20 21 22 23 24 25
# o
f re
spo
nd
ents
° C

87
The distribution of actual workplace temperature settings respondents reported skews far more towards
lower temperatures. As Figure 27 below indicates, the vast majority of respondents reported temperatures
of 22° C or less, with some substantially lower.
Figure 27 Typical temperature setting in the workplace, by season
As a point of comparison, respondents were also asked about the temperature settings in their workplace
in winter. Those skew notably higher. Note that from an energy conservation standpoint, this is
backwards. All else equal, far more energy is required to deliver the same cooling temperature, say 22°
C, during the summer heat than during cooler winter months.
This is one area in which the Center of Excellence may want to raise awareness, as it is a basic concept of
space conditioning that many individuals around the world do not understand. The idea of relative
comfort – that a temperature is cool enough given that it is summer, for example – is well accepted in
certain places around the world (e.g., Japan) and is worth promoting in the Center of Excellence. The text
box below illustrates how international norms diverge on this point.
International variation in the seasonality of thermal comfort
The graphic below illustrates typical thermal comfort ranges utilized in the United States and Japan, as
codified by ASHRAE and a Japanese manufacturer, respectively. As such, they indicate what may be
0
5
10
15
18 19 20 21 22 23 24 25 26 27 28 29 30
# o
f re
spo
nd
ents
° C
Summer
0
5
10
15
18 19 20 21 22 23 24 25 26 27 28 29 30#
of
resp
on
den
ts
° C
Winter
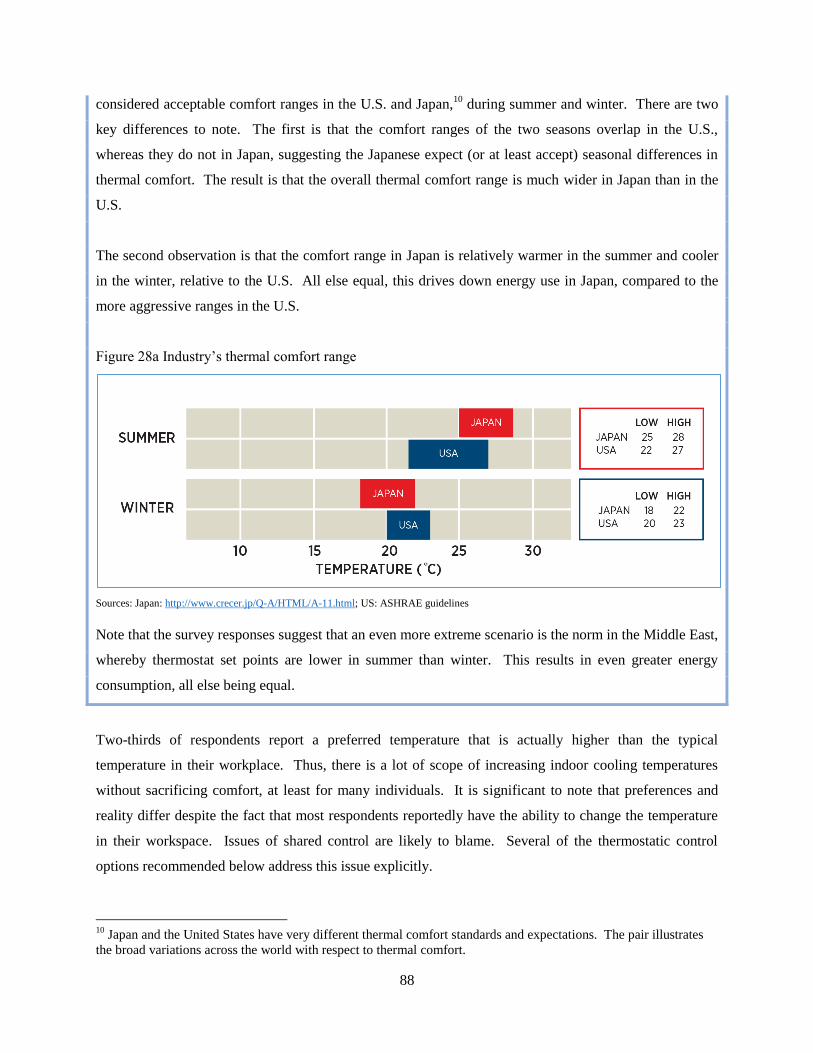
88
considered acceptable comfort ranges in the U.S. and Japan,10
during summer and winter. There are two
key differences to note. The first is that the comfort ranges of the two seasons overlap in the U.S.,
whereas they do not in Japan, suggesting the Japanese expect (or at least accept) seasonal differences in
thermal comfort. The result is that the overall thermal comfort range is much wider in Japan than in the
U.S.
The second observation is that the comfort range in Japan is relatively warmer in the summer and cooler
in the winter, relative to the U.S. All else equal, this drives down energy use in Japan, compared to the
more aggressive ranges in the U.S.
Figure 28a Industry’s thermal comfort range
Sources: Japan: http://www.crecer.jp/Q-A/HTML/A-11.html; US: ASHRAE guidelines
Note that the survey responses suggest that an even more extreme scenario is the norm in the Middle East,
whereby thermostat set points are lower in summer than winter. This results in even greater energy
consumption, all else being equal.
Two-thirds of respondents report a preferred temperature that is actually higher than the typical
temperature in their workplace. Thus, there is a lot of scope of increasing indoor cooling temperatures
without sacrificing comfort, at least for many individuals. It is significant to note that preferences and
reality differ despite the fact that most respondents reportedly have the ability to change the temperature
in their workspace. Issues of shared control are likely to blame. Several of the thermostatic control
options recommended below address this issue explicitly.
10
Japan and the United States have very different thermal comfort standards and expectations. The pair illustrates
the broad variations across the world with respect to thermal comfort.
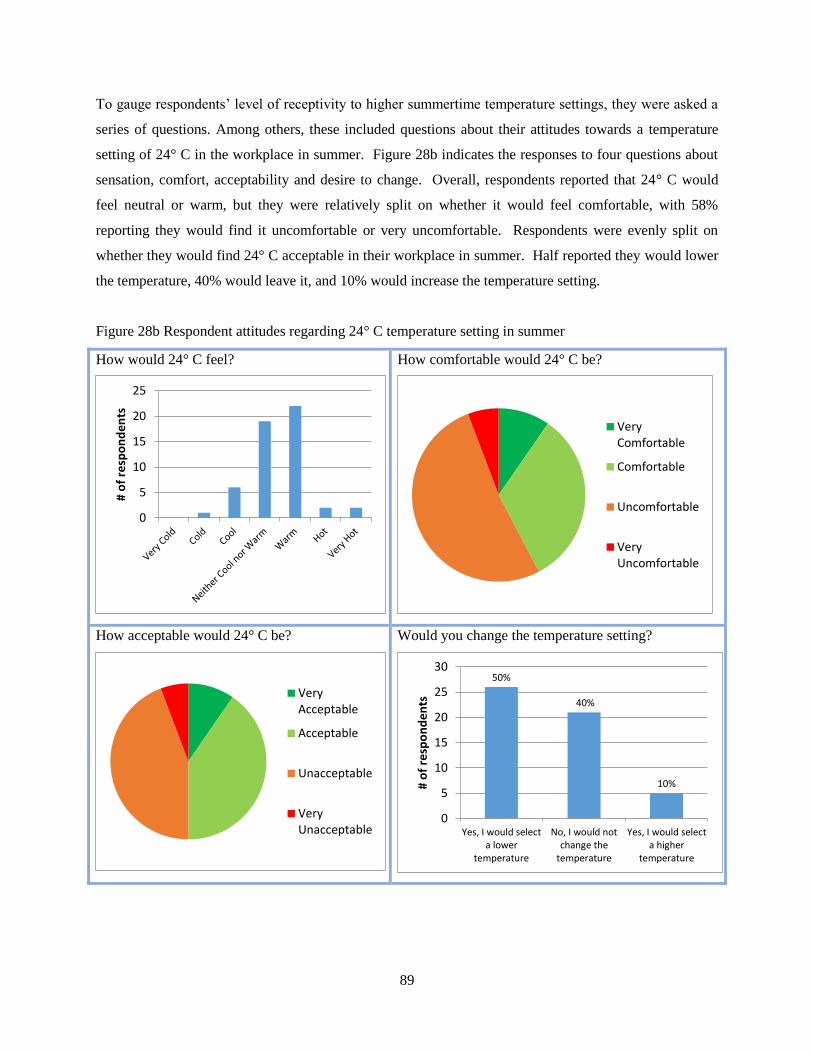
89
To gauge respondents’ level of receptivity to higher summertime temperature settings, they were asked a
series of questions. Among others, these included questions about their attitudes towards a temperature
setting of 24° C in the workplace in summer. Figure 28b indicates the responses to four questions about
sensation, comfort, acceptability and desire to change. Overall, respondents reported that 24° C would
feel neutral or warm, but they were relatively split on whether it would feel comfortable, with 58%
reporting they would find it uncomfortable or very uncomfortable. Respondents were evenly split on
whether they would find 24° C acceptable in their workplace in summer. Half reported they would lower
the temperature, 40% would leave it, and 10% would increase the temperature setting.
Figure 28b Respondent attitudes regarding 24° C temperature setting in summer
How would 24° C feel?
How comfortable would 24° C be?
How acceptable would 24° C be?
Would you change the temperature setting?
0
5
10
15
20
25
# o
f re
spo
nd
en
ts
VeryComfortable
Comfortable
Uncomfortable
VeryUncomfortable
VeryAcceptable
Acceptable
Unacceptable
VeryUnacceptable
50%
40%
10%
0
5
10
15
20
25
30
Yes, I would selecta lower
temperature
No, I would notchange the
temperature
Yes, I would selecta higher
temperature
# o
f re
spo
nd
en
ts
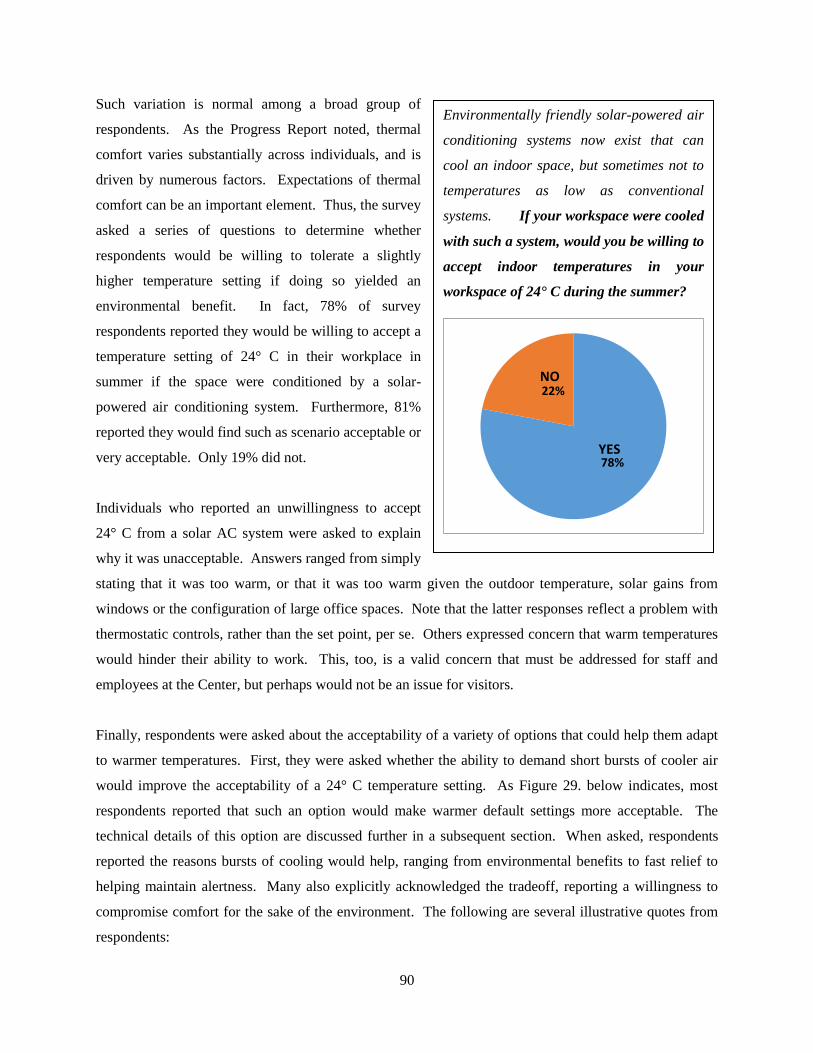
90
Such variation is normal among a broad group of
respondents. As the Progress Report noted, thermal
comfort varies substantially across individuals, and is
driven by numerous factors. Expectations of thermal
comfort can be an important element. Thus, the survey
asked a series of questions to determine whether
respondents would be willing to tolerate a slightly
higher temperature setting if doing so yielded an
environmental benefit. In fact, 78% of survey
respondents reported they would be willing to accept a
temperature setting of 24° C in their workplace in
summer if the space were conditioned by a solar-
powered air conditioning system. Furthermore, 81%
reported they would find such as scenario acceptable or
very acceptable. Only 19% did not.
Individuals who reported an unwillingness to accept
24° C from a solar AC system were asked to explain
why it was unacceptable. Answers ranged from simply
stating that it was too warm, or that it was too warm given the outdoor temperature, solar gains from
windows or the configuration of large office spaces. Note that the latter responses reflect a problem with
thermostatic controls, rather than the set point, per se. Others expressed concern that warm temperatures
would hinder their ability to work. This, too, is a valid concern that must be addressed for staff and
employees at the Center, but perhaps would not be an issue for visitors.
Finally, respondents were asked about the acceptability of a variety of options that could help them adapt
to warmer temperatures. First, they were asked whether the ability to demand short bursts of cooler air
would improve the acceptability of a 24° C temperature setting. As Figure 29. below indicates, most
respondents reported that such an option would make warmer default settings more acceptable. The
technical details of this option are discussed further in a subsequent section. When asked, respondents
reported the reasons bursts of cooling would help, ranging from environmental benefits to fast relief to
helping maintain alertness. Many also explicitly acknowledged the tradeoff, reporting a willingness to
compromise comfort for the sake of the environment. The following are several illustrative quotes from
respondents:
Environmentally friendly solar-powered air
conditioning systems now exist that can
cool an indoor space, but sometimes not to
temperatures as low as conventional
systems. If your workspace were cooled
with such a system, would you be willing to
accept indoor temperatures in your
workspace of 24° C during the summer?
78%
22%
YES
NO

91
An active job resulting in leaving the office several times a day in the summer causes your body
to heat up and so having shorter cooler bursts will help cool you down faster. Once body temp
regulates cooler bursts won't be required
perhaps [short burst of additional cooling] makes the cooler temp last longer
Because it is the healthiest and most environmentally friendly option
On the other hand, respondents who were not positive about the burst of cooling option expressed
concerns about occupants getting sick, becoming distracted by the bursts, or being left wanting more
cooling.
Figure 29 Effect of short bursts of cooling to mitigate warmer temperature settings
Respondents were then asked to offer their own ideas for what additional options might make 24° C more
acceptable. Many of them mentioned common strategies such as lightweight clothing and fans. Some
demonstrated a sophisticated understanding of thermal comfort issues, noting that blinds or tinted
windows might help address solar gains. Others suggested that better insulation or fewer building
occupants might make warmer temperatures more comfortable. Note, however, that again the issue of
temperature setting is being conflated with thermostatic control and zoning. The factors listed are indeed
important to ensure that the ambient temperature actually reflects the thermostat setting, and we have
included recommendations to that effect in the sections below. More personal methods of seeking
thermal comfort cited include drinking cold beverages, washing one’s face, tying up one’s hair, personal
chillers/coolers, moving to another area of the building, and shifting working hours.
33%
49%
18% Yes, much moreacceptable
Yes, a little moreacceptable
No, it would not changethe acceptability of 24° C
No, it would make it lessacceptable

92
Respondents were asked about their willingness to utilize specific personal cooling devices designed to
improve thermal comfort when indoor temperatures are slightly warm. Ceiling fans, personal fans, and
personal cooling devices such as cooling chairs and neck pillows are acceptable to roughly half of
respondents surveyed. More than three-quarters of respondents are willing to wear lightweight clothing
to adapt to warmer indoor temperatures, as the charts below indicate.
Figure 30 Willingness to utilize alternative cooling methods
Finally, respondents were asked to provide their ideas on how to encourage people to accept slightly
warmer indoor temperatures in a building utilizing solar AC. The most common recommendation is to
raise awareness about the environmental benefits of reducing AC usage (or conversely the damage caused
by AC usage). The following are selected quotes from respondents:
“Building occupants should be given awareness on how much energy they are saving due to this
1C slight increase in indoor air temperature ( from 23C to 24C) - Awareness on how HVAC
systems are responsible for approximately 70% of energy consumption in Dubai. - The annual
carbon footprint reduction of having a thermostat set to 24C instead of 23C. - An equivalent
16%
40%
33%
11%
Ceiling fan
Very Willing
Willing
Unwilling
Very unwilling
15%
33% 36%
16%
Portable fan
Very Willing
Willing
Unwilling
Very unwilling
27%
51%
22%
Lightweight clothing
Very Willing
Willing
Unwilling
Very unwilling
15%
33% 36%
16%
Personal cooling device (e.g., chair or neck pillow)
Very Willing
Willing
Unwilling
Very unwilling

93
number of trees that would have to be planted to offset the carbon footprint of setting the
thermostat to 23C instead of 24C.”
“The fact that the energy is renewable and efficient has to be heavily communicated to people. I
think the severe lack of education and common knowledge amongst people about the topic is
what perpetuates poor energy practices.”
Another suggestion provided by several respondents is to inform occupants of the health benefits of
turning up the thermostat (e.g., AC can be drying).
Overall, the survey provides evidence that many likely occupants of the Center of Excellence, including
staff and occasional visitors, would be willing to accept warmer temperature settings, such as 24° C,
especially when it benefits the environment. Many respondents also reported a willingness to utilize
numerous strategies to improve their comfort when indoor temperatures are warmer than usual.
Nevertheless, there are a significant number of respondents who reported resistance to higher
temperatures. Thus, the acceptability of a 24° C cooling set point varies widely among respondents, as it
will among building occupants. The sections below describe how to engage building occupants across the
spectrum to ensure that an acceptable balance of energy conservation and thermal comfort is achieved.
6.2.1 Theory of behavior change
Many aspects of the recommended approach involve urging some behavior change on the part of building
occupants. According to the Fogg Behavioral Model11
, there are three key elements of behavior change.
As Figure 31 below illustrates, these are motivation, ability, and a trigger, which can be described as
follows:
- Motivation encompasses elements such as needs, wants, beliefs, and incentives. Individuals must
have the motivation to take action (e.g., tolerate a higher temperature).
- Ability relates to the time, cost, effort, knowledge, access and permission related to a particular
course of action (e.g., adjust the temperature temporarily).
- Triggers are often required to overcome the inertia of the status quo, even when the motivation
and ability to change exist.12
Triggers can come in various forms, but they each serve to
significantly raise the motivation or ability (or both) to take a certain action, such that the initial
barriers are overcome and action is taken (e.g., discomfort triggers a switch to lightweight
clothing).
11 See http://www.behaviormodel.org/ and Fogg (2009) for an overview. 12 See Fogg 2009; and http://www.behaviormodel.org/triggers.html for an overview.
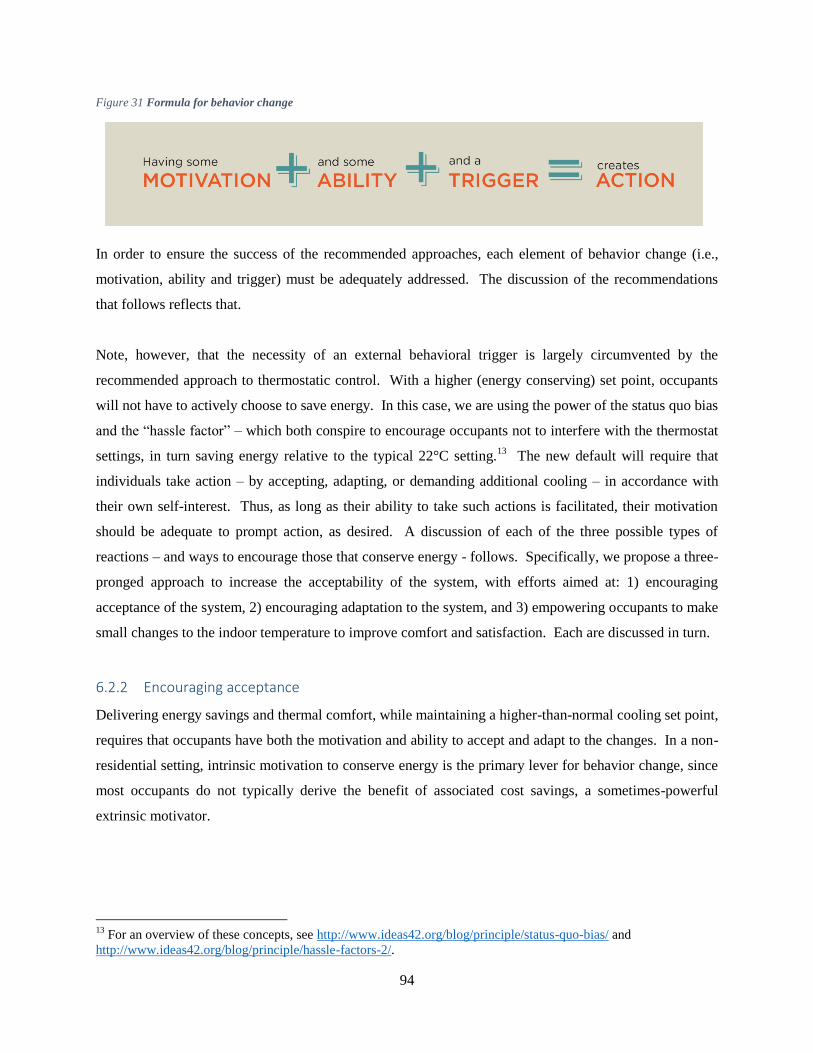
94
Figure 31 Formula for behavior change
In order to ensure the success of the recommended approaches, each element of behavior change (i.e.,
motivation, ability and trigger) must be adequately addressed. The discussion of the recommendations
that follows reflects that.
Note, however, that the necessity of an external behavioral trigger is largely circumvented by the
recommended approach to thermostatic control. With a higher (energy conserving) set point, occupants
will not have to actively choose to save energy. In this case, we are using the power of the status quo bias
and the “hassle factor” – which both conspire to encourage occupants not to interfere with the thermostat
settings, in turn saving energy relative to the typical 22°C setting.13
The new default will require that
individuals take action – by accepting, adapting, or demanding additional cooling – in accordance with
their own self-interest. Thus, as long as their ability to take such actions is facilitated, their motivation
should be adequate to prompt action, as desired. A discussion of each of the three possible types of
reactions – and ways to encourage those that conserve energy - follows. Specifically, we propose a three-
pronged approach to increase the acceptability of the system, with efforts aimed at: 1) encouraging
acceptance of the system, 2) encouraging adaptation to the system, and 3) empowering occupants to make
small changes to the indoor temperature to improve comfort and satisfaction. Each are discussed in turn.
6.2.2 Encouraging acceptance
Delivering energy savings and thermal comfort, while maintaining a higher-than-normal cooling set point,
requires that occupants have both the motivation and ability to accept and adapt to the changes. In a non-
residential setting, intrinsic motivation to conserve energy is the primary lever for behavior change, since
most occupants do not typically derive the benefit of associated cost savings, a sometimes-powerful
extrinsic motivator.
13
For an overview of these concepts, see http://www.ideas42.org/blog/principle/status-quo-bias/ and
http://www.ideas42.org/blog/principle/hassle-factors-2/.

95
Motivation to conserve energy may be derived from a range of factors including environmental attitudes,
social value orientation, and pressure from social norms.14
However, note that individuals are also
motivated by personal comfort, which will be in direct conflict with energy conservation, for those who
prefer cooler indoor temperatures in summer. While conditioning a space involves an inherent trade-off
between thermal comfort and energy conservation, there is also evidence to suggest that these factors can
be mutually reinforcing. In particular, research has shown that individuals are more tolerant of, and even
comfortable in, higher cooling temperatures when they have a strong motivation to conserve energy.15
Thus, stimulating individuals’ motivation to conserve energy is critical to gaining their acceptance of a
slightly higher cooling set point.
However, it should be noted that solar power has been shown to present a perverse incentive to energy
conservation.16
Some occupants of zero-net energy buildings, powered primarily by solar PV, have
expressed confusion about or resistance to energy conservation through higher cooling set points. Their
belief is that there is no need to conserve because the solar power has no detrimental environmental
effect. However, they do not appreciate the cost or environmental impact of providing additional solar
panels, nor the ability to offset grid supply with excess generation, should the solar PV system produce
more electricity than is needed.
Indeed, there are many aspects of solar-powered AC systems that typical building occupants do not
understand. Thus, the primary method we recommend for increasing building occupants’ motivation to
conserve energy is to raise their knowledge and awareness. This would require providing building
occupants with relevant information about how the AC system works; the relationship between
temperature, energy consumption and system design; the environmental impact of energy
savings/consumption; and social comparisons regarding thermal comfort. Providing this type of
information could be achieved with a variety of outreach tools (i.e., touchscreen displays, public
installation, thermostats). Several options are outlined to illustrate how each would work to promote
acceptance and, indirectly, thermal comfort.
Few individuals understand how an AC system works, let alone a solar-powered one. The Center can
play a vital role in changing that. Tablets or large touchscreens could provide visitors (and employees)
14
Abrahamse et al (2005) presents a review of empirical studies on the effect of such factors. For a discussion of
social norms and energy conservation, see http://www.ideas42.org/social-norms-and-energy-conservation/ and
Alcott, 2011; Schultz, et al, 2007. 15
Outcault, et al., 2014b 16
Outcault, et al. 2014b;
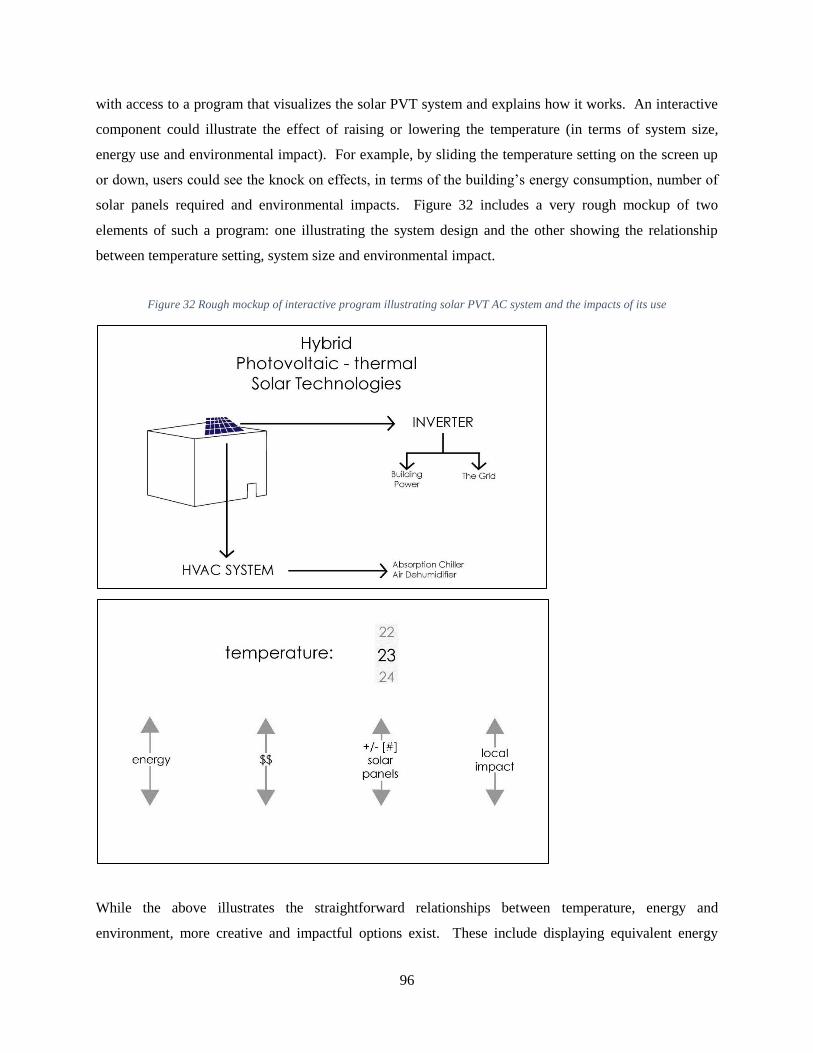
96
with access to a program that visualizes the solar PVT system and explains how it works. An interactive
component could illustrate the effect of raising or lowering the temperature (in terms of system size,
energy use and environmental impact). For example, by sliding the temperature setting on the screen up
or down, users could see the knock on effects, in terms of the building’s energy consumption, number of
solar panels required and environmental impacts. Figure 32 includes a very rough mockup of two
elements of such a program: one illustrating the system design and the other showing the relationship
between temperature setting, system size and environmental impact.
Figure 32 Rough mockup of interactive program illustrating solar PVT AC system and the impacts of its use
While the above illustrates the straightforward relationships between temperature, energy and
environment, more creative and impactful options exist. These include displaying equivalent energy

97
saving activities (to emphasize the relative ease of saving energy through turning up the thermostat),
carbon offsets, or energy consumption relative to conventional AC systems. Figure 33 provides two
examples of energy consumption dashboards relating to transportation, designed by UC Davis
researchers. Both provide concrete, alternative metrics to help users grasp the impact of their actions.
Something similar could be incorporated into the touchscreen display illustrating the impact of
temperature settings at the Center.
Figure 33 Examples of energy consumption feedback displays
Triptracker
OBD Energy
Source: UC Davis’ Consumer Energy Interfaces Lab http://tkstapleton.des157.net/des157/cenergi/projects.html
Social comparisons have also been successfully used to motivate behavior change with respect to energy
conservation.17
The user interface program could leverage the power of social norms by providing users
with information about cooling norms around the world. For example, each temperature on the sliding
scale (say, from 20 to 30°C) could be paired with the name of one or more countries for which that is the
typical cooling temperature (e.g., 24°C in the United States,18
28°C in Japan19
). Such information would
17
Allcott, 2011; Schultz et al., 2007; http://www.ideas42.org/social-norms-and-energy-conservation/ 18
HC 7.11, "2009 RECS (Residential Energy Consumption Survey) Survey Data," U.S. Energy Information
Administration.
http://www.eia.gov/consumption/residential/data/2009/xls/HC7.11%20Air%20Conditioning%20in%20West%20Re
gion.xls. 19
Household Energy-Saving Handbook. Tokyo Metropolitan Governments. http://www.tokyo-
co2down.jp/ecology/home/

98
serve to raise awareness about the heterogeneity of global cooling norms, subtly challenging the status
quo, with the ultimate aim of changing expectations among visitors to the Center.
The design of a user interface program to inform visitors and regular occupants about the building’s solar
PVT AC system, energy consumption, environmental impacts and social norms would need to be
intuitive, engaging, informative, and aesthetic. Many initiatives to promote energy conservation at the
community level have utilized such an approach. Figure 34 below includes two examples: a dashboard
from Oberlin College and another from UC Davis. Both provide users with information about building
energy consumption over time and relative to some other factor (generation in the case of Oberlin and
other buildings in the case of UC Davis). A user interface with a similar aim could be designed for
touchscreens to be displayed at the Center.
Figure 34 Examples of energy consumption feedback displays
Source: http://buildingdashboard.net/oberlin/#/oberlin/ajlc

99
Source: http://ceed.ucdavis.edu
The purpose of the touchscreen devices would be to provide detailed information and a participatory
experience. However, it is important to engage and inform those individuals who will not take the time to
interact with these resources. Thus, we also recommend the installation of a large-scale feedback device
to support the Center’s mission and purpose. In particular, a dynamic, public display of energy
consumption or conservation, either against a goal or over time, could be an effective tool for engaging
and informing visitors and regular occupants. We suggest Diamond Developers consider designing and
installing a 3D, dynamic infographic – e.g., a sculpture that moves or lights up – to illustrate the
building’s AC-related energy use (or energy savings from the use of solar technology) in a way that
captivates viewers. Again, UC Davis researchers have experience designing such a device, images of
which are provided below to illustrate the concept. Note that the Social Energy Sensing Monument
(SESEME) sculpture pictured below is part of an integrated interactive system that also allows users
access additional information from smartphones. As a visitors center, we expect that the touchscreen
displays recommended above would be a better format for providing such information to building
occupants.

100
Figure 35 Example of 3D display illustrating energy consumption. Source: UC Davis’ Consumer Energy
Interfaces Lab. Temporary website: http://tkstapleton.des157.net/des157/InteractivePrototype/3.0/projects.html#
Finally, the typical device through which occupants interact with the HVAC system is the thermostat.
Traditionally, thermostats have provided only minimal information, and no behavioral nudging.
However, space conditioning-related products (e.g., thermostats, wall unit air conditioners and heaters)
are increasingly being designed with feedback mechanisms built in to encourage conservation. It is

101
recommended that the thermostats installed at the Center of Excellence be programmed to display an
encouraging message when the temperature is set to 24°C or higher. The selected symbol or phrase
should be appropriate for the context and universally understood, as the Center will attract visitors from
diverse locations. Examples of symbols used by existing technology include a smiley face, happy Earth,
green leaf, and changing the background display color or design. Customized options are possible, too, if
the user interface is design especially for the Center.
The recommendations above focus on the intrinsic motivations to conserve energy by accepting a higher
cooling set point. These will likely be adequate for occasional visitors, as the survey results presented
above indicate. However, individuals who occupy the building very frequently, especially staff and
employees, may require additional outreach measures to encourage acceptance of a higher cooling set
point. Not only will they have greater exposure to the building, but employees often resist conservation
measures urged by their employer because they may expect a certain level of comfort at work,20
feel they
require greater cooling to be productive at work (as noted by several respondents), and resent making
sacrifices for which only the employer reaps the (direct) benefits, primarily through cost savings.
There is evidence that expectations influence one’s reporting of thermal comfort.21
Thus, future staff of
the Center of Excellence should be made aware of the intended set point and provided with information
explaining the reasoning behind it. They should also be given the opportunity to engage with the
touchscreens, thermostats and large installation intended to raise awareness and acceptability.
Furthermore, Diamond Developers should consider exploiting the power of extrinsic motivations (e.g.,
awards, acclaim, money) for energy conservation. Prior research has shown that having a concrete
motivation related to conservation is essential to maintaining sustained conservation behavior. Goal
setting,22
competition,23
and commitments24
have all proved successful mechanisms for encouraging
behavior change. Each of these could be even more effective if paired with an extrinsic motivator. Thus,
it is recommended that the Center of Excellence consider running competitions among its staff (either
intra-agency or against a target) or encouraging staff to set goals and make commitments to reduced AC
usage, and offering rewards as appropriate. Such activities could be essential to support sustained
20
Karjalainen, 2009 21
Brager & deDear, 1998; Mishra & Ramgopal, 2013 22
Becker (1978) is a classic reference. 23
For example, see the City of Oberlin’s electricity competition at:
http://buildingdashboard.net/oberlincity/#/oberlincity/. 24
See Seligman, 1977; Ashraf et al, 2006

102
behavior change until the desired outcome (i.e., reduced AC usage by maintaining a higher set point)
becomes an ingrained habit.
6.2.2.1 Recommendations
Install interactive touchscreen displays that inform users about the AC system, energy
consumption, thermal comfort and environmental impacts
Install a public installation to illustrate the building’s AC-related energy use
Install thermostats that provide feedback to encourage conservation
Manage expectations by informing incoming staff who will work in the Center of Excellence of
the default temperature settings
6.2.3 Encouraging adaption
In addition to accepting a slightly higher cooling set point, occupants of the Center of Excellence should
be encouraged to adapt to the warmer indoor temperature. By raising the temperature, the default state
will be conservation. This eliminates the problem many conservation schemes face when they depend on
occupants to take some action in order to conserve. This approach uses the power of defaults and inertia
to save energy.
But this does not have to mean that occupants will be uncomfortable. The human body is highly
adaptable.25
Building occupants can learn to accept warmer conditions, as described above, or they can
take active steps to adapt. Their primary motivation for doing the latter will be personal comfort. Self-
interest is indeed a powerful motivator. Here, the key is to facilitate occupants’ ability to adapt, since
they will likely already have the motivation to do so.
There are several ways occupants, particularly employees of the Center, could adapt to warmer indoor
temperatures. As described in the January 2015 Progress Report, clothing is a critical element of thermal
comfort. Through the formal dress code policy and employee training sessions, employees of the Center
(e.g., management office workers, custodial staff, coffee shop workers) should be allowed and
encouraged to wear lightweight clothing that would enable them to work comfortably despite slightly
higher than normal indoor air temperatures. In addition, any uniforms issued should be designed for
comfort in slightly warmer indoor temperatures, especially those for coffee shop and custodial workers
whose jobs are active and located in potentially warmer areas of the building. Of course, it should be
made very clear that the dress code calls for appropriate clothing to be worn at all times, and that the
25 Humphreys & Nicol, 1998; Mishra & Ramgopal, 2013
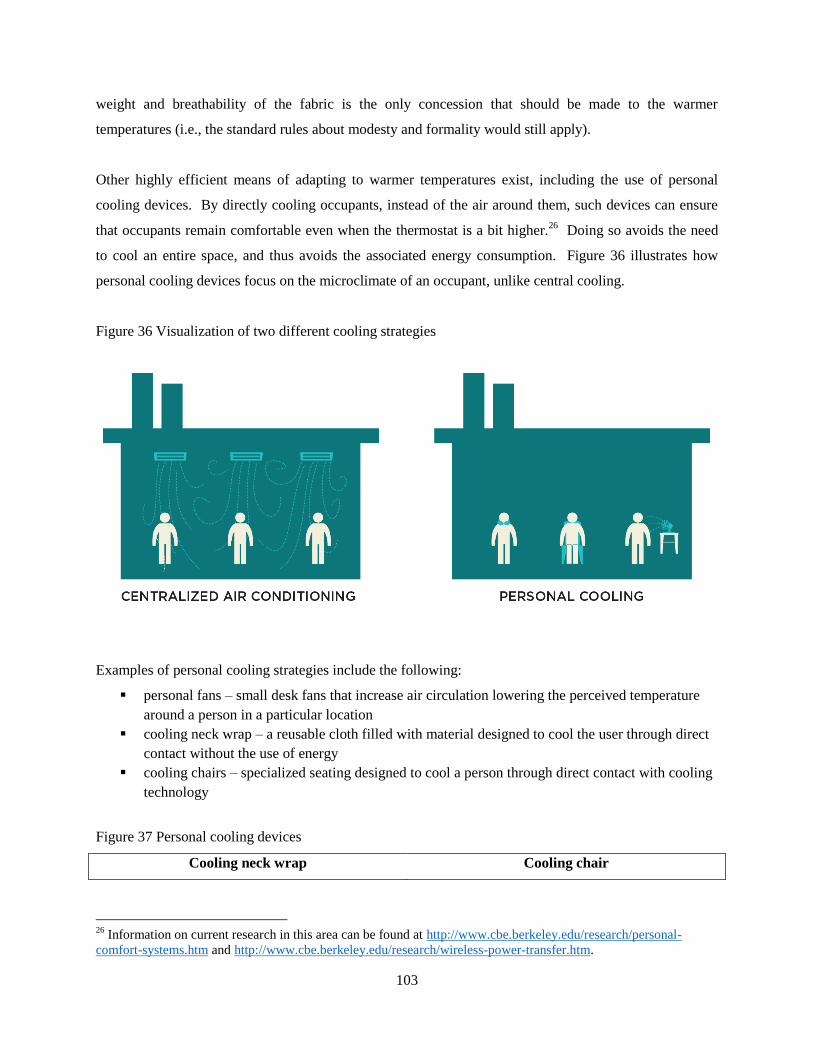
103
weight and breathability of the fabric is the only concession that should be made to the warmer
temperatures (i.e., the standard rules about modesty and formality would still apply).
Other highly efficient means of adapting to warmer temperatures exist, including the use of personal
cooling devices. By directly cooling occupants, instead of the air around them, such devices can ensure
that occupants remain comfortable even when the thermostat is a bit higher.26
Doing so avoids the need
to cool an entire space, and thus avoids the associated energy consumption. Figure 36 illustrates how
personal cooling devices focus on the microclimate of an occupant, unlike central cooling.
Figure 36 Visualization of two different cooling strategies
Examples of personal cooling strategies include the following:
personal fans – small desk fans that increase air circulation lowering the perceived temperature
around a person in a particular location
cooling neck wrap – a reusable cloth filled with material designed to cool the user through direct
contact without the use of energy
cooling chairs – specialized seating designed to cool a person through direct contact with cooling
technology
Figure 37 Personal cooling devices
Cooling neck wrap Cooling chair
26
Information on current research in this area can be found at http://www.cbe.berkeley.edu/research/personal-
comfort-systems.htm and http://www.cbe.berkeley.edu/research/wireless-power-transfer.htm.
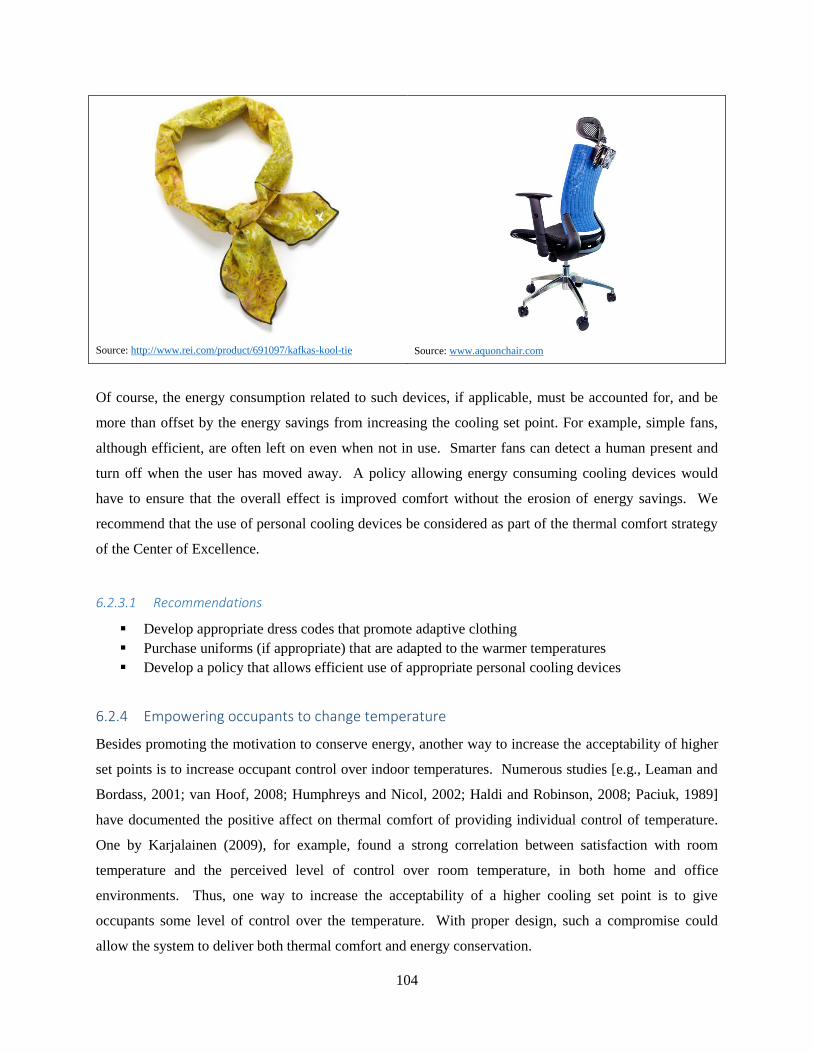
104
Source: http://www.rei.com/product/691097/kafkas-kool-tie
Source: www.aquonchair.com
Of course, the energy consumption related to such devices, if applicable, must be accounted for, and be
more than offset by the energy savings from increasing the cooling set point. For example, simple fans,
although efficient, are often left on even when not in use. Smarter fans can detect a human present and
turn off when the user has moved away. A policy allowing energy consuming cooling devices would
have to ensure that the overall effect is improved comfort without the erosion of energy savings. We
recommend that the use of personal cooling devices be considered as part of the thermal comfort strategy
of the Center of Excellence.
6.2.3.1 Recommendations
Develop appropriate dress codes that promote adaptive clothing
Purchase uniforms (if appropriate) that are adapted to the warmer temperatures
Develop a policy that allows efficient use of appropriate personal cooling devices
6.2.4 Empowering occupants to change temperature
Besides promoting the motivation to conserve energy, another way to increase the acceptability of higher
set points is to increase occupant control over indoor temperatures. Numerous studies [e.g., Leaman and
Bordass, 2001; van Hoof, 2008; Humphreys and Nicol, 2002; Haldi and Robinson, 2008; Paciuk, 1989]
have documented the positive affect on thermal comfort of providing individual control of temperature.
One by Karjalainen (2009), for example, found a strong correlation between satisfaction with room
temperature and the perceived level of control over room temperature, in both home and office
environments. Thus, one way to increase the acceptability of a higher cooling set point is to give
occupants some level of control over the temperature. With proper design, such a compromise could
allow the system to deliver both thermal comfort and energy conservation.
105
There is little scope for concern about occupants’ motivation to change the temperature, albeit
temporarily. The motivation will be comfort. As before, this reverse framing of energy conservation, i.e.,
that conservation mode is the default, avoids the need to create a behavioral trigger. The key will be
ensuring that occupants have the ability to demand temporary relief from the higher set point, the success
of which will depend on the user interface. The typical device occupants use to modify indoor
temperatures is a thermostat, but their mere existence in a space does not guarantee occupants’ ability to
use them. For example, Karjalainen and Koistinen (2007) found that poor access, usability and
knowledge of thermostats made their presence nearly irrelevant. In addition to motivation, occupants
must have:
Access, in terms of permission and physical reach; and
Ability, that is, physical and mental capacity to operate the thermostat27
.
Both physical access and permission to use thermostats can be a significant problem, particularly in non-
residential settings. Granting access to thermostats is somewhat complicated by the fact that they are
almost always operated by multiple users. The fact that no single individual is the “owner” of the
thermostat may result in a failure to implement an optimal schedule of set points. Researchers have
uncovered collective use of thermostats to be a significant problem in commercial buildings.28
What
adaptations are made to accommodate collective use and mitigate its impact on energy use, focus
primarily on “locking out” users. Doing this runs the risk of compromising occupant satisfaction and
comfort.
Establishing differing levels of access can be a promising solution. For example, some sophisticated
thermostats can be programmed to offer a different interface (and set of options) to “Administrators” and
“Occupants”. The former would be responsible for establishing an appropriate setback schedule, as
described earlier, while there are a variety of options for the latter, as discussed below.
The key to balancing energy conservation and thermal comfort through occupant control is to establish
mechanisms for selectively increasing cooling to an extent that improves comfort without completely
eroding energy savings. In addition to the adaptive techniques described above, to make the higher
cooling set point more palatable, we recommend that the system be designed to allow occupants to
demand temporary temperature reductions, when needed.
27
Access and ability reflect what Wyon (1996) calls the 3I-Principle, which says that for effective temperature
control, users must have Insight (i.e., understanding of how the HVAC system and thermostat work), Information
(i.e., knowledge of how to use the thermostat), and Influence (i.e., the power to make temperature adjustments). 28
Karjalainen & Koistinen, 2007

106
As discussed above, a schedule of setbacks should be programmed into the building’s thermostatic
controls to ensure that the space is not conditioned during off-hours (e.g., nights, holidays). However,
given the intended purpose of the Center of Excellence, predicting room occupancy more precisely than
that will be challenging, or impossible. Thus, the controls system should be designed to account for room
occupancy such that the temperature is lowered to the desired set point only when the room is occupied.
Thermostatic control options
There are a range of ways thermostatic control can be accomplished, each with its advantages and
disadvantages. A brief overview of the options is provided. Controls systems are either reactive – i.e.,
responding to occupancy, or proactive – i.e., responding to a demand for conditioning. In addition, the
demand for conditioning may be determined by humans or by technology. The table below illustrates the
intersection of these two dimensions, and provides examples of each type of the mechanism.
Matrix of thermostatic control options
Reactive Proactive
Human-driven Override
Timer
Voting
Programmable
thermostat
Technology-driven Occupancy sensor
Occupancy sensor fusion
Predictive programming
Reactive controls include the following five options:
Override – Thermostats (or other specially designed devices) allow occupants to request a time-
bound override of the existing program. In this case, occupants would be allowed to lower the
temperature from the default of 24°C by a degree or two, for example. The override would last a
pre-determined amount of time, likely between 1 and 4 hours, which is referred to as a “hold”.
More energy is saved by selected a shorter hold period.
Timer – Timers can be installed that allow the temperature to be lowered by a preset amount
(likely one or two degrees) for a user-defined period of time. Again, the shorter the maximum
time period allowed, the more energy is saved.
Voting - A technology called Comfy has recently been developed by Build Robotics which
allows building occupants to “vote” for their desired temperature through an app on their mobile
phone.29
The system then attempts to balance competing needs of the occupants who submit their
preferences.
29
See http://www.buildingrobotics.com/comfy/.

107
Occupancy sensor – A traditional infrared occupancy sensor is designed to sense when a room is
occupied and adjust the temperature according to a preset mandate (i.e., drop from the setback
temperature to the active cooling temperature of 24°C).
Occupancy sensor fusion – Cutting edge technologies now merge data gathered from infrared
sensors, CO2 sensors, mobile phone signals, and lighting to determine occupancy more
precisely.30
Since infrared sensors alone detect only motion, they are imperfect at determining
the presence and concentration of sedentary occupants, especially in large rooms. The fusion
approach aims to address such shortcomings.
All reactive technologies have the disadvantage of adjusting the temperature only after the space has
become occupied (excluding the possibility of voting remotely). The implication is that the space may
initially be uncomfortably warm. By contrast, proactive technologies anticipate the conditioning needs
of building occupants and typically trigger additional cooling in advance of occupancy. The latter
delivers greater comfort, but uses more energy. Proactive thermostats include the following two main
types:
Programmable thermostat – These rely on humans to set schedules to condition the space to
selected temperatures at selected times. In non-residential buildings this is often done by an
administrator, either remotely for many thermostats at once or manually on each device.
Programmable thermostats are widely available, fairly inexpensive, and familiar technology.
They are most appropriate for spaces with predictable occupancy schedules. However, they can
be difficult to program (and re-program when times or schedules change) and are not well suited
to irregular occupancy.
Predictive programming - Thermostats relying on artificial intelligence (e.g., Nest) attempt to
circumvent the challenges users experience in programming their thermostats by carrying out that
function themselves after an initial learning period. But there are some shortcomings to the
technology. Field studies by the research team (Outcault, et al, 2014a) and other researchers have
documented significant problems with usability with “smart” thermostats (Yang and Newman,
2013), especially when occupancy is irregular.
Above, seven mechanisms for changing the temperature to respond to occupancy are described. Each has
its pros and cons. Additionally, there are options for how the AC system responds to occupancy. The
traditional system response is to lower the cooling set point, either for a fixed or variable amount of time,
depending on the controls technology. Recently researchers have been exploring an alternative, energy-
saving approach in which systems are designed to offer an initial blast of cooling, and then allow the
30
Kleiminger et al, 2014

108
temperature to drift upwards.31
This strategy draws on the principle of adaptive thermal comfort, which
describes how the human body adjusts to gradual changes in temperature. Thus the initial blast of cold
air-cools occupants, and they remain cool for a period of time even after the blast of cool air has ended.
This strategy might be appropriate in small rooms, which are occupied sporadically, for relatively short
periods of time (e.g., conference rooms).
Determining the optimal controls device and cooling strategy requires thinking carefully about how a
space will be used, when, and by whom. As a baseline, programmable thermostats should be installed in
each discrete space and networked to allow for centralized control. Each should be programmed in a
manner appropriate to their anticipated occupancy, with reasonable setbacks for times when the building
is closed and when the space is temporarily unoccupied during the day, as mentioned earlier.32
Large
spaces that hold many occupants and take a long time to cool down (e.g., auditorium, lobby) would be
best cooled proactively through scheduling or adjustments to the schedule. Small changes around the set
point could be made by occupants through voting technology as a way of engaging occupants and
encouraging conservation. As a side note, we recommend that entrance to the Center be designed to
supply a blast of cooling that is colder than the standard set point. This will help occupants cool down
quickly after coming inside, making the slightly warmer 24° C set point more comfortable after
adaptation.
For smaller spaces used by repeat occupants (e.g., management offices, conference rooms), we would
recommend controls technology that requires user input. Although much of the latest technology is being
designed to exclude ongoing human input, we believe that is a mistake. Human-driven options shift the
responsibility for demanding additional cooling to the occupants themselves. This has (at least) two
distinct benefits: it raises awareness about energy consumption by engaging occupants and (indirectly)
improves occupant comfort by empowering occupants to influence the indoor temperature. There is
support for this approach in the thermal comfort literature. According to Peffer et al. (2011), the “optimal
path is to provide choices in the balance between user control and automated features.” We agree with
this approach.
To that end, we would recommend Diamond Developers consider installing devices that facilitate shared
control, where appropriate. These could include room thermostats, “blast buttons”, timers, or thermostat
voting technology. Room thermostats could be programmed to allow occupants to temporarily demand
31
See Krioukov & Culler (2012) for an example. 32
Note the setback temperatures may be different for these two cases.

109
up to two degrees cooler (down to 22), and up to 4 degrees warmer. On that latter point, it is important to
note that occupants could be offered a range of thermostatic control options, including fixed or variable
set points that temporarily raise or lower the temperature by a predetermined or user defined amount,
respectively33
. Again, such overrides would be time limited, typically ranging from 1-4 hours.
Alternatively, “blast buttons” could be installed that allow occupants to demand a short-term burst of cold
air. These have the advantage of being simple, requiring no decisions about intensity or duration of
additional cooling. However, occupants who desire prolonged periods of additional cooling would need
to activate the blasts repeatedly.
Thermostat timers would allow multiple users to demand additional cooling for a user-defined period of
time. The associated set point would be pre-programmed, again eliminating the need for users to decide
on the desired temperature. Thermostat timers have the advantage of a simple, easy and intuitive user
interface.
Finally, technology that allows building occupants to vote on their preferred temperature (e.g., Comfy,
UC Davis’s Thermostat34
) is another option. Unlike the others, these technologies acknowledge the fact
that thermal comfort varies across individuals and therefore preferences may differ, and attempts to
mitigate the “thermostat wars” that sometimes ensue in shared spaces.35
Figure 38 presents several
images from UC Davis’s app called Thermostat, which is used to collect feedback on thermal comfort and
energy use. Note, the image of a cow was selected because it has symbolic meaning in the UC Davis
community. An application designed for the Center of Excellence would benefit from following that
example and utilizing a locally meaningful icon. It is widely believed that more highly targeted user
interfaces are more effective than generic ones.
33
Allowing occupants to increase the temperature, and therefore conserve energy more aggressively, would
emphasize the request to conserve energy and improve thermal comfort for those who prefer warmer temperatures. 34
See http://thermoostat.ucdavis.edu. Note that input collected through the Thermostat interface do not yet
influence thermostat settings, although that is the eventual goal. 35
McCalley et al., 2005
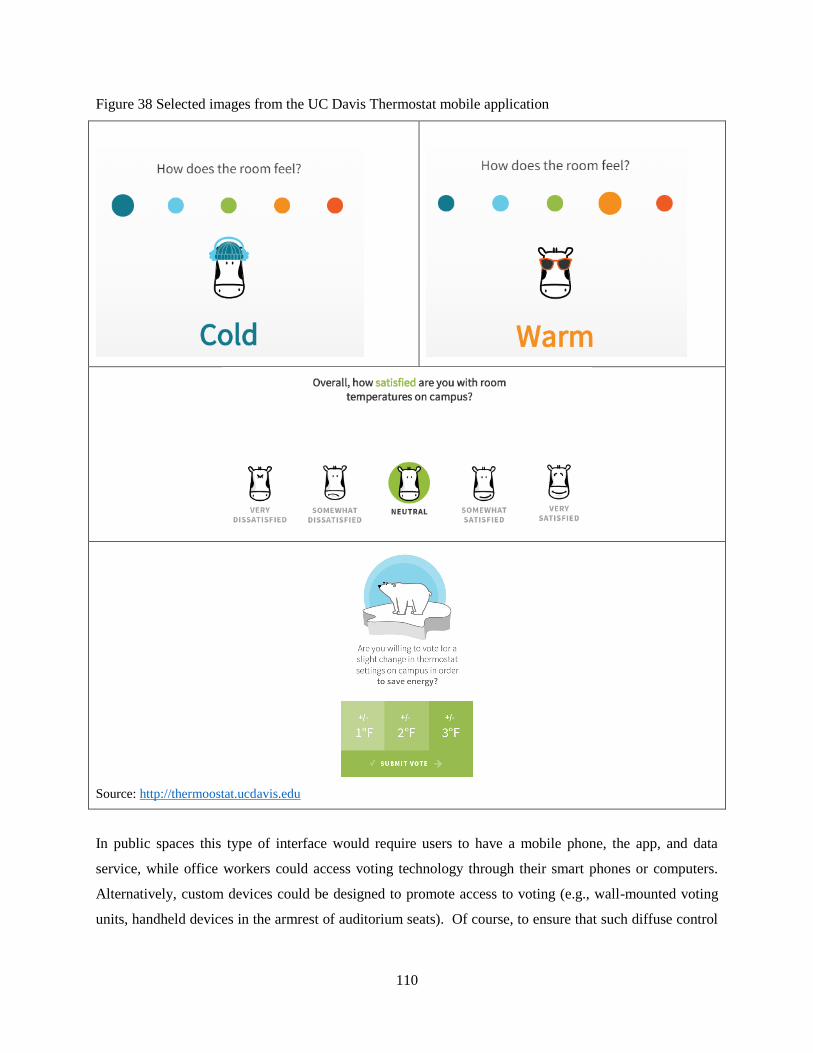
110
Figure 38 Selected images from the UC Davis Thermostat mobile application
Source: http://thermoostat.ucdavis.edu
In public spaces this type of interface would require users to have a mobile phone, the app, and data
service, while office workers could access voting technology through their smart phones or computers.
Alternatively, custom devices could be designed to promote access to voting (e.g., wall-mounted voting
units, handheld devices in the armrest of auditorium seats). Of course, to ensure that such diffuse control
111
does not lead to greater energy consumption, the temperatures from which occupants are permitted to
select would have to be relatively conservative.
Each of the above options would allow occupants to demand cooling and feel a sense of control, which
would both directly and indirectly improve thermal comfort, respectively. Some are very simple to
operate, while others require greater user engagement. Each has advantages and disadvantages in a given
setting.
Ideally, a variety of technologies would be installed along with monitoring devices to measure how well
each technology performed in each setting, and the associated energy consumption/savings. There is a
great need for information on field performance of leading edge thermostat technologies, and the Western
Cooling Efficiency Center at UC Davis has experience conducting field experiments such as this.36
Using
the Center of Excellence as a test site could be one way in which the Center accomplishes its mission of
education and outreach.
In addition, all of the above options leverage the principles of behavioral science to conserve energy; each
reverses the logic of a traditional programmable thermostat by defaulting to an energy saving setting
unless greater cooling is demanded. This frames the decision to engage with the thermostat (or other
control device) differently: changes to the settings are motivated by a desire for cooling, expressed
explicitly through interaction with the device - rather than a desire for conservation, as is the case with
programming setbacks or manually turning up the thermostat. To the extent that comfort is a more potent
motivator than conservation, this approach can be a powerful tool for energy conservation, while
providing some measure of occupant control.
Interface design
Assuming access to the selected technology (or technologies) is granted to end users, their ability to
effectively use controls is affected by the level of effort, knowledge, physical and mental capacities
required to operate them. In fact, one study of thermostat use in office buildings found that the presence
of room thermostats is nearly irrelevant if they have poor usability.37
Even highly motivated users can be
put off by unappealing user interfaces, confusing directions, or simply forgetting to change settings when
appropriate.
36
See project report at http://wcec.ucdavis.edu/wp-content/uploads/2014/10/OutcaultACEEE_Thermostats.pdf. 37
Karjalainen & Koistinen, 2007

112
Although many modern thermostats have attempted to improve user interface (see Meier et al., 2010 for
examples), many are still found to be hard to understand and difficult to learn and remember (Pfeffer et al.
2011). Symbols are not uniform across systems, which confounds learning and retention. A lab study by
Meier et al. (2011) found that some thermostats are so difficult to use that 50% of users failed even the
simplest task assigned (e.g., switching from “off” to “heat”). Thermostat manuals can be long and
confusing, and are unlikely to be utilized by typical occupants in a non-residential building such as the
Center of Excellence.
Thus, while the motivation to change the temperature will exist, the ability to demand temporary
temperature reductions will hinge on well-designed occupant-friendly thermostatic control devices. The
technology selection or design process should bear this in mind.
Furthermore, whichever technology is utilized to deliver sporadic cooling, as demanded by occupants, the
interface design should be such that the motivation to conserve energy is reinforced. Thermostats, or
other devices that allow occupants to demand cooler temperatures for a short period, should be designed
to remind occupants of the additional energy consumption associated with additional cooling. User
interfaces could be programmed to provide negative feedback (e.g., snowflake, red symbol, discouraging
phrase) when demanding additional cooling. Such reminders about the increased energy use will nudge
occupants to use overrides or blast buttons sparingly.
Conversely, a device that enables occupants to increase the temperature temporarily, if such is selected,
should “reward” the user who chooses a temperature higher than the default (24°C) with positive
feedback (e.g., an encouraging phrase, or symbol). For example, the UC Davis Thermostat app displays
more or less ice and blue sky (as shown in the Figure below) depending on the number of degrees by
which users are willing to increase the cooling temperature setting, thereby conserving energy.
+ 1°F + 2°F + 3°F

113
Figure 39 Thermoostat’s feedback on voluntary temperature changes. Source:
http://thermoostat.ucdavis.edu
Extending some measure of control over the building’s air conditioning to the occupants within, if done
carefully, can be a powerful conservation strategy. Empowering occupants to change settings, even
within an approved narrow range, can improve thermal comfort both directly and indirectly, and save
energy while doing so. Balancing the often-competing goals of energy conservation with occupants’
thermal comfort requires thoughtful understanding of and engagement with building occupants, as well as
appropriate technology choices.
6.2.4.1 Recommendations
Establish conservative setback schedules reflecting anticipated occupancy
Select controls technologies that allow occupants to demand additional (or reduced) cooling for
limited periods of time. Technology choice should be driven by how each space will be used,
when and by whom (see Table X below for more details).
Deliver additional cooling at entrances to the Center to promote rapid adaptation to indoor
temperatures
Consider obtaining a customized controls solution that facilitates limited occupant control and
incorporates best practice in interface design and feedback to reinforce conservation behaviors.
Consider utilizing the Center of Excellence as a test site for monitoring controls performance – in
terms of occupant comfort and energy use – of selected technologies
6.3 Conclusion
Conserving energy related to space conditioning requires selecting appropriate technology and developing
a partnership with building occupants. The latter must be informed, engaged, empowered, and motivated
to accept, adapt to, and control the thermal conditions in ways that save energy. Accomplishing this
requires careful consideration of the social and behavioral factors that drive attitudes and decisions

114
regarding thermal comfort. With thoughtful implementation, the Center of Excellence can strike a
balance between comfort and conservation, and raise awareness about sustainable AC systems among
visitors and regular occupants alike.
In the above, twelve recommendations are provided. Eleven of them are location-specific. That is, their
applicability depends on the way a particular space will be used, when and by whom. The table below
identifies the locations within the Center of Excellence to which each of the ten recommendations is most
applicable.
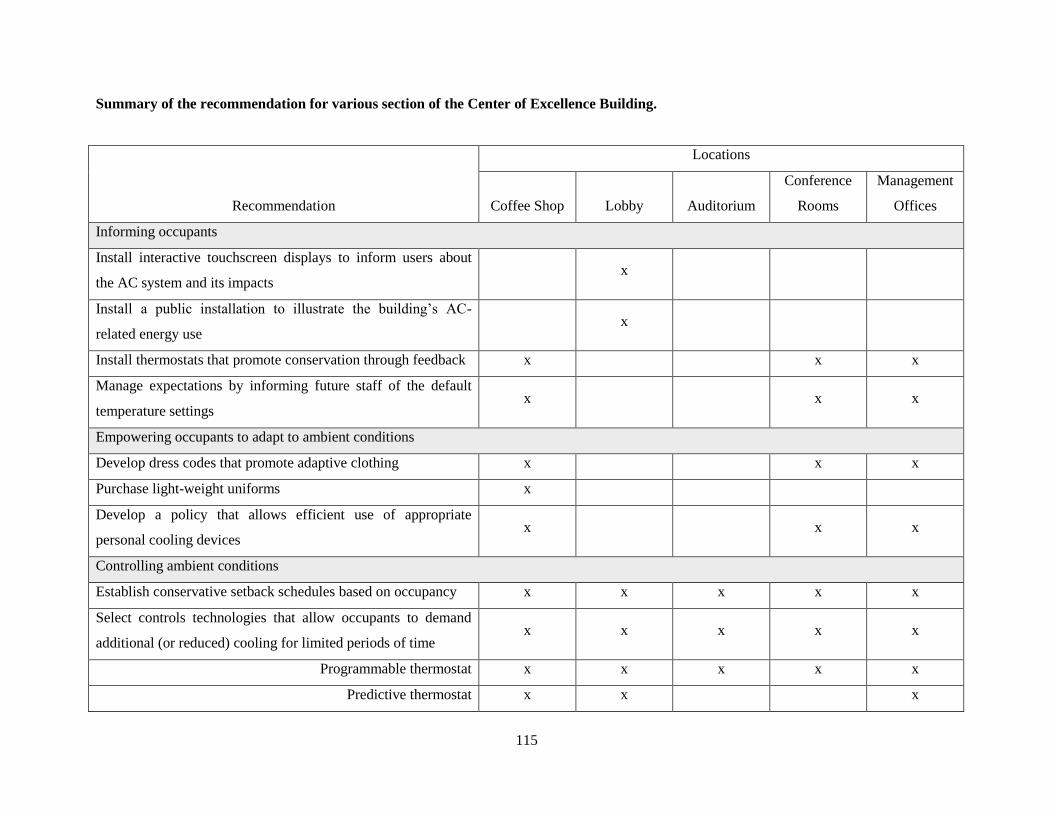
115
Summary of the recommendation for various section of the Center of Excellence Building.
Recommendation
Locations
Coffee Shop Lobby Auditorium
Conference
Rooms
Management
Offices
Informing occupants
Install interactive touchscreen displays to inform users about
the AC system and its impacts x
Install a public installation to illustrate the building’s AC-
related energy use x
Install thermostats that promote conservation through feedback x x x
Manage expectations by informing future staff of the default
temperature settings x x x
Empowering occupants to adapt to ambient conditions
Develop dress codes that promote adaptive clothing x x x
Purchase light-weight uniforms x
Develop a policy that allows efficient use of appropriate
personal cooling devices x x x
Controlling ambient conditions
Establish conservative setback schedules based on occupancy x x x x x
Select controls technologies that allow occupants to demand
additional (or reduced) cooling for limited periods of time x x x x x
Programmable thermostat x x x x x
Predictive thermostat x x x

116
Occupancy sensor x x x
Override x x
Voting x x x x x
Timer x x
Deliver additional cooling at entrances to the Center to promote
rapid adaptation to indoor temperatures x
Consider obtaining a customized controls solution that
facilitates limited occupant control and incorporates best
practice in interface design and feedback mechanisms
x x x x x

Page 117 of 139
6.4 Next steps
We have provided twelve recommendations on the human factors related to ensuring performance of the
solar PVT system designed in the current project. As development of the Center of Excellence
progresses, many decisions will need to be made regarding technology choice and occupant engagement.
To ensure that the sustainability goals are met, occupants must change their behavior to meet
expectations. Facilitating behavior change will require ongoing interventions to inform, educate, and
nudge occupants toward the desired energy use habits. Further research would be valuable to determine
which technologies and interventions would be most effective at influencing occupants’ choices and
delivering sustained energy savings.
6.5 References
Abrahamse, W., Steg, L., Vlek, C., & Rothengatter, T. (2005). A review of intervention studies aimed at
household energy conservation. Journal of environmental psychology, 25(3), 273-291.
Allcott, H. (2011). Social norms and energy conservation. Journal of Public Economics, 95(9), 1082-
1095.
Ashraf, N., D. Karlan, et al. (2006). "Tying Odysseus to the Mast: Evidence from a Commitment Savings
Product in the Philippines." Quarterly Journal of Economics 121(2): 635-672.
ASHRAE. (2010). " Standard 55: Thermal Environmental Conditions for Human Occupancy".
ASHRAE. (2013). “ANSI/ASHRAE Addendum g to ANSI/ASHRAE Standard 55-2010”.
Becker, L. J. (1978). Joint effect of feedback and goal setting on performance: A field study of residential
energy conservation. Journal of Applied Psychology,63(4), 428.
Brager, G. S., & de Dear, R. J. (1998). Thermal adaptation in the built environment: a literature
review. Energy and buildings, 27(1), 83-96.
Brager, G., Fountain, M., Benton, C., Arens, E. A., & Bauman, F. (1993). A comparison of methods for
assessing thermal sensation and acceptability in the field. Proceedings of Thermal Comfort: Past, Present
and Future, ed. Nigel Oseland. British Research Establishment, Watford, United Kingdom, 9-10 June.
Campus Energy Education Dashboard. University of California-Davis. Website: http://ceed.ucdavis.edu.
CRECER corporate website. http://www.crecer.jp/Q-A/HTML/A-11.html.

Page 118 of 139
Fogg, B. J. (2009) "A behavior model for persuasive design." Proceedings of the 4th international
Conference on Persuasive Technology. ACM.
Fogg, B. J. BJ Fogg’s Behavioral Model website. http://www.behaviormodel.org/ Stanford University.
Haldi, F., & Robinson, D. (2008). On the behavior and adaptation of office occupants. Building and
environment, 43(12), 2163-2177.
Humphreys, M.A. & J.F. Nicol. (1998). Understanding the adaptive approach to thermal comfort.
ASHRAE Trans, 104 (1), pp. 991–1004.
Humphreys, M. A., & Nicol, J. F. (2002). The validity of ISO-PMV for predicting comfort votes in every-
day thermal environments. Energy and buildings, 34(6), 667-684.
Ideas42 website. http://www.ideas42.org/
Karjalainen, S. (2009). Thermal comfort and use of thermostats in Finnish homes and offices. Building
and Environment, 44(6), 1237-1245.
Karjalainen, S., & Koistinen, O. (2007). User problems with individual temperature control in offices.
Building and Environment, 42(8), 2880-2887.
Kleiminger, W., Mattern, F., & Santini, S. (2014). Predicting household occupancy for smart heating
control: A comparative performance analysis of state-of-the-art approaches. Energy and Buildings, 85,
493-505.
Krioukov, A., & Culler, D. (2012, April). Personal building controls. In Proceedings of the 11th
international conference on Information Processing in Sensor Networks (pp. 157-158). ACM.
Leaman, A., & Bordass, B. (2001). Assessing building performance in use 4: the Probe occupant surveys
and their implications. Building Research & Information, 29(2), 129-143.
McCalley, L. T., Midden, C. J. H., & Haagdorens, K. (2005). Computing systems for household energy
conservation: Consumer response and social ecological considerations. In Proceedings of CHI 2005
Workshop on Social Implications of Ubiquitous Computing.
Meier, A., C. Aragon, T. Peffer, D. Perry, and M. Pritoni. (2011). “Usability of residential thermostats:
Preliminary investigations.” Building and Environment, 46(10), 1891-1898.
Meier, A., C. Aragon, T. Pfeffer, and M. Pritoni, 2010. “Thermostat Interface and Usability: A Survey”.
Lawrence Berkeley National Laboratory, Berkeley, CA.
Page 119 of 139
Mishra, A. K., & Ramgopal, M. (2013). Field studies on human thermal comfort—An overview. Building
and Environment, 64, 94-106.
Outcault, S., Barriga, C., Heinemeier, K., Markley, J. and D. Berman (2014a). “Thermostats Can’t Fix
This: Case studies on advanced thermostat field tests”, Conference Proceeding Paper. ACEEE Summer
Study on Energy Efficiency in Buildings. Available online at: http://wcec.ucdavis.edu/wp-
content/uploads/2014/10/OutcaultACEEE_Thermostats.pdf.
Outcault, S., Heinemeier, K., Kutzleb, J., Pritoni, M. and Q. Wang. (2014b) “Can AC Use be Reduced?
Field Experiments to Encourage Adoption of Alternative Cooling Strategies in Japan and the U.S.”
Report by Western Cooling Efficiency Center, University of California-Davis. Available online at:
http://wcec.ucdavis.edu/wp-content/uploads/2015/09/WCEC-Passive-Cooling-report-final.pdf.
Paciuk, M. (1989). The role of personal control of the environment in thermal comfort and satisfaction at
the workplace In: Selby RI, editor. Proceedings of the twenty-first annual conference of the
environmental design research association. Oklahoma City, IL: EDRA; 1990. p. 303–12.
Peffer, T., Pritoni, M., Meier, A., Aragon, C., & Perry, D. (2011). How people use thermostats in homes:
A review. Building and Environment, 46(12), 2529-2541.
Schultz, P. W., Nolan, J. M., Cialdini, R. B., Goldstein, N. J., & Griskevicius, V. (2007). The
constructive, destructive, and reconstructive power of social norms. Psychological science, 18(5), 429-
434.
Seligman, C., & Darley, J. M. (1977). Feedback as a means of decreasing residential energy
consumption. Journal of Applied Psychology, 62(4), 363.
Van Hoof, J. (2008). Forty years of Fanger’s model of thermal comfort: comfort for all?. Indoor
Air, 18(3), 182-201.
Wyon, D. (1996) “Indoor environmental effects on productivity”. In: Teichman KY, editor. Proceedings
of IAQ 96—Paths to better building environments. ASHRAE, p. 5–15.
Yang, R., & Newman, M. W. (2013, September). Learning from a learning thermostat: lessons for
intelligent systems for the home. In Proceedings of the 2013 ACM international joint conference on
Pervasive and ubiquitous computing (pp. 93-102). ACM.

Page 120 of 139
Conclusions and Next Steps
The thermal comfort analysis showed that for 9 months of the year the cooling and dehumidification air
conditioning is required for the building. Since the Center of Excellence is composed of a large
auditorium, which might not be in use all the time, two independent air conditioning system based on
absorption chillers were considered for the building. The input energy for the absorption chillers will be
provided by evacuated tube solar thermal collectors. The photovoltaic panels will be used to provide the
required electrical energy for the building. We also evaluated the use of building integrated photovoltaics
as windows and facades. The life cycle analysis of the solar powered air conditioning shows a convenient
payback time of 4 years. In the next step, we prepared a social and behavioral study to understand the
thermal comfort criteria for the people living in the region. Based on the social study we proposed
educational and sustainable practices for various sections of the building.
The next steps will require detailed design of the solar powered air conditioning for Diamond Developers
engineers and contractors. Some of the social/behavioral studies will require the preparation of real-time
data collection, visualization, educational and human interfaces. The preparation of these platforms could
be among the next steps of the project. For consideration of the building integrated solar technologies,
detailed design based on collaboration with building architectural design engineers and the recent data
from solar providers is required.

Page 121 of 139
Appendix 1
300
400
500
600
700
800
900
0 5 10 15 20 25
Sen
sib
le L
oa
d [
kW
]
Time [hr]
Auditorium Sensible Load Vs Time for Cooling
Season
March
April
May
June
July
August
September
October
20
40
60
80
100
120
140
0 5 10 15 20 25
La
ten
t L
oa
d [
kW
]
Time [hr]
Auditorium LatentLoad Vs Time for Cooling
Season
March
April
May
June
July
August
September
October

Page 122 of 139
`
200
250
300
350
400
450
500
550
600
650
700
0 5 10 15 20 25
Sen
sib
le L
oa
d k
W
Time [hr]
Building Sensible Load Vs Time for Cooling
Season
March
April
May
June
July
August
September
October
0
50
100
150
200
250
0 5 10 15 20 25
La
ten
t L
oa
d [
kW
]
Time [hr]
Building Sensible Load Vs Time for Cooling
Season
March
April
May
June
July
August
September
October

Page 123 of 139
Appendix 2

Page 124 of 139
Appendix 3

Page 125 of 139
Appendix 4- Thermal Comfort Survey
This section contains the questions, which was used for the online thermal comfort survey.
Sustainable City - Thermal comfort survey
Q1 In preparation for the design of the Center for Excellence at the Sustainable City, this survey has been
prepared for Diamond Developers to gather input on preferences regarding indoor air temperatures in the
workplace. Please take a few moments to provide us with your feedback. Your responses will be
gathered anonymously and used to improve the design of various aspects of the Center for
Excellence. Thank you!
Q2 Who is your employer and what is your position?
Q3 In a typical week, how many hours do you spend in your current workspace?
1 - 10 hrs. (1)
11 - 30 hrs. (2)
31 or more hours (3)
Q4 Which option best describes the workspace in which you spend most of your working hours?
Cubicle (1)
Closed office (shared) (2)
Closed office (not shared) (3)
Other open space (4)
Other closed space (5)
Q5 Do you have the ability (both access and permission) to change the temperature in your workspace?
Yes (1)
No (2)

Page 126 of 139
Q6 How physically active is your job?
Very (1)
Somewhat (2)
A little (3)
Not at all (4)
Q7 How old are you?
30 years or younger (1)
31-50 years of age (2)
51 years or older (3)
Q8 What is your gender?
Male (1)
Female (2)
Q9 What is your preferred temperature (in degrees Celsius) in your workspace in summer?
Q10 Is central AC the primary method used to cool the building in which you work?
Yes (1)
No (2)
I don't know (3)
Answer If Is central AC the primary method used to cool the building in which you work? I don't know Is
Selected Or Is central AC the primary method used to cool the building in which you work? No Is
Selected
Q45 Are there wall or window AC units in your workspace?
Yes (9)
No (10)
Answer If Are there wall or window AC units in your workspace? No Is Selected
Q11 Without central AC, window or wall AC units, how is your office cooled?

Page 127 of 139

Page 128 of 139
Q13 At what temperature is the AC typically set (in degrees Celsius) in your workspace while it is
occupied in the winter? If you're unsure, just provide your best guess.
18 (1)
19 (2)
20 (3)
21 (4)
22 (5)
23 (6)
24 (7)
25 (8)
26 (9)
27 (10)
28 (11)
29 (12)
30 (13)
°C
(1)
Q12 At what temperature is the AC typically set (in degrees Celsius) in your workspace while it is
occupied in the summer? If you're unsure, just provide your best guess.
18 (1)
19 (2)
20 (3)
21 (4)
22 (5)
23 (6)
24 (7)
25 (8)
26 (9)
27 (10)
28 (11)
29 (12)
30 (13)
°C
(1)
Q16 When you are in your workspace in the summer, how does the temperature you indicated in the
previous question feel to you?
Very Cold (1)
Cold (2)
Cool (3)
Neither Cool nor Warm (4)
Warm (5)
Hot (6)
Very Hot (7)
Q17 When you are in your workspace in the summer, how comfortable is the AC temperature you
indicated above?
Very Comfortable (1)
Comfortable (2)
Uncomfortable (3)
Very Uncomfortable (4)

Page 129 of 139
Q18 When you are in your workspace in the summer, how acceptable is the AC temperature you
indicated above?
Very Acceptable (1)
Acceptable (2)
Unacceptable (3)
Very Unacceptable (4)
Q19 If given the option, would you change the temperature setting in your workspace in the summer?
Yes, I would select a higher temperature (1)
Yes, I would select a lower temperature (2)
No, I would not change the temperature (3)
Answer at what temperature is the AC typically set (in degrees Celsius) in your workspace while it is oC…
- 22 Is Not Selected
Q20 When you are in your workspace in summer, how would 22° C in your workspace feel to you?
Very Cold (1)
Cold (2)
Cool (3)
Neither Cool nor Warm (4)
Warm (5)
Hot (6)
Very Hot (7)
Answer at what temperature is the AC typically set (in degrees Celsius) in your workspace while it is oC...
- 22 Is Not Selected
Q21 When you are in your workspace in summer, how comfortable would 22° C in your workspace feel
to you?
Very Comfortable (1)
Comfortable (2)
Uncomfortable (3)
Very Uncomfortable (4)

Page 130 of 139
Answer at what temperature is the AC typically set (in degrees Celsius) in your workspace while it is oC...
- 22 Is Not Selected
Q22 When you are in your workspace in summer, how acceptable would 22° C in your workspace be to
you?
Very Acceptable (1)
Acceptable (2)
Unacceptable (3)
Very Unacceptable (4)
Answer at what temperature is the AC typically set (in degrees Celsius) in your workspace while it is oC...
- 22 Is Not Selected
Q23 If given the option, would you change the temperature setting from 22° C in your workspace in the
summer?
Yes, I would select a higher temperature (1)
Yes, I would select a lower temperature (2)
No, I would not change the temperature (3)
Answer at what temperature is the AC typically set (in degrees Celsius) in your workspace while it is oC...
- 24 Is Not Selected
Q24 When you are in your workspace in summer, how would 24° C in your workspace feel to you?
Very Cold (1)
Cold (2)
Cool (3)
Neither Cool nor Warm (4)
Warm (5)
Hot (6)
Very Hot (7)

Page 131 of 139
Answer at what temperature is the AC typically set (in degrees Celsius) in your workspace while it is oC...
- 24 Is Not Selected
Q25 When you are in your workspace in summer, how comfortable would 24° C in your workspace feel
to you?
Very Comfortable (1)
Comfortable (2)
Uncomfortable (3)
Very Uncomfortable (4)
Answer at what temperature is the AC typically set (in degrees Celsius) in your workspace while it is oC...
- 24 Is Not Selected
Q26 When you are in your workspace in summer, how acceptable would 24° C in your workspace be to
you?
Very Acceptable (1)
Acceptable (2)
Unacceptable (3)
Very Unacceptable (4)
Answer at what temperature is the AC typically set (in degrees Celsius) in your workspace while it is oC...
- 24 Is Not Selected
Q27 If given the option, would you change the temperature setting from 24° C in your workspace in the
summer?
Yes, I would select a higher temperature (1)
Yes, I would select a lower temperature (2)
No, I would not change the temperature (3)
Q28 Environmentally-friendly solar-powered air conditioning systems now exist that can cool an indoor
space, but sometimes not to temperatures as low as conventional systems. If your workspace were
cooled with such a system, would you be willing to accept indoor temperatures in your workspace of 24
°C during the summer?
Yes (1)
No (2)

Page 132 of 139
Q29 How acceptable or unacceptable would 24° C be in your workspace in summer if the building used a
solar-powered AC system?
Very Acceptable (1)
Acceptable (2)
Unacceptable (3)
Very Unacceptable (4)
Answer how acceptable or unacceptable would 24 degrees be summer at your workspace?
Unacceptable Is Selected Or How acceptable or unacceptable would 24 degrees be summer at your
workspace? Very Unacceptable Is Selected
Q30 What are one or two reasons you feel 24° C is an unacceptable temperature in your workspace
during the summer in a building that uses a solar-powered AC system?
Answer how acceptable or unacceptable would 24 degrees be summer at your workspace?
Unacceptable Is Selected Or How acceptable or unacceptable would 24 degrees be summer at your
workspace? Very Unacceptable Is Selected
Q31 What would make 24° C a more acceptable standard setting in a building that uses a solar-powered
AC system?
Q32 If the AC system were designed to give you and other building occupants the ability to demand short
bursts of cooler temperatures, would it make 24° C a more acceptable temperature setting in summer?
Yes, much more acceptable (1)
Yes, a little more acceptable (2)
No, it would not change the acceptability of 24° C (3)
No, it would make it less acceptable (4)
Answer if the AC system were designed to give occupants the ability to demand short bursts of cooler
temperatures, would it make 24 degrees a more acceptable standard temperature set... No, it would
make it less acceptable Is Selected
Q33 Why would such an option make 24° C a less acceptable standard temperature setting?
Answer if the AC system were designed to give occupants the ability to demand short bursts of cooler
temperatures, would it make 24 degrees a more acceptable standard temperature set... Yes, much more

Page 133 of 139
acceptable Is Selected Or If the AC system were designed to give occupants the ability to demand short
bursts of cooler temperatures, would it make 24 degrees a more acceptable standard temperature set...
Yes, a little more acceptable Is Selected
Q34 Why would such an option make 24° C a more acceptable standard temperature setting?
Answer If the AC system were designed to give you and other building occupants the ability to demand
short bursts of cooler temperatures, would it make 24° C a more acceptable temperature setting in
summer? No, it would not change the acceptability of 24° C Is Selected
Q35 Why wouldn’t such an option change the acceptability of 24° C as a standard temperature setting?
Q36 Besides the ability to deliver short bursts of cooler temperatures, what are one or two other ways that
would make 24° C a more acceptable standard temperature setting?
Q37 How willing would you be to utilize the following supplemental cooling methods in your workspace
if you found 24° C to be uncomfortably warm?
Very Willing (1) Willing (2) Unwilling (3) Very Unwilling (4)
Ceiling fan (1)
Portable fan (2)
Wearing lightweight
clothing (3)
Personal cooling
chair (e.g., chair,
neck pillow) (4)
Q38 Please describe any other ways you would stay cool if you found 24° C uncomfortably warm in your
workplace (besides changing the temperature setting).

Page 134 of 139
Q39 Please share any other comments or suggestions you may have for encouraging people to accept a
slightly warmer indoor temperature in a building cooled by renewable energy.
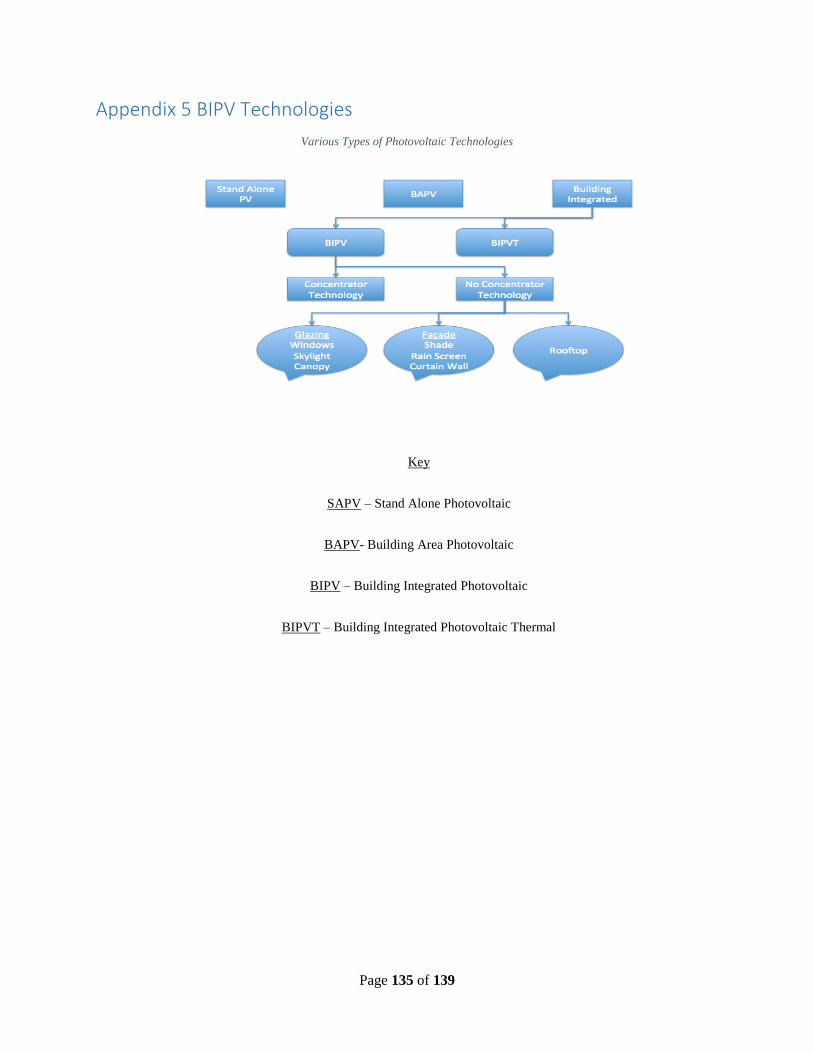
Page 135 of 139
Appendix 5 BIPV Technologies
Various Types of Photovoltaic Technologies
Key
SAPV – Stand Alone Photovoltaic
BAPV- Building Area Photovoltaic
BIPV – Building Integrated Photovoltaic
BIPVT – Building Integrated Photovoltaic Thermal
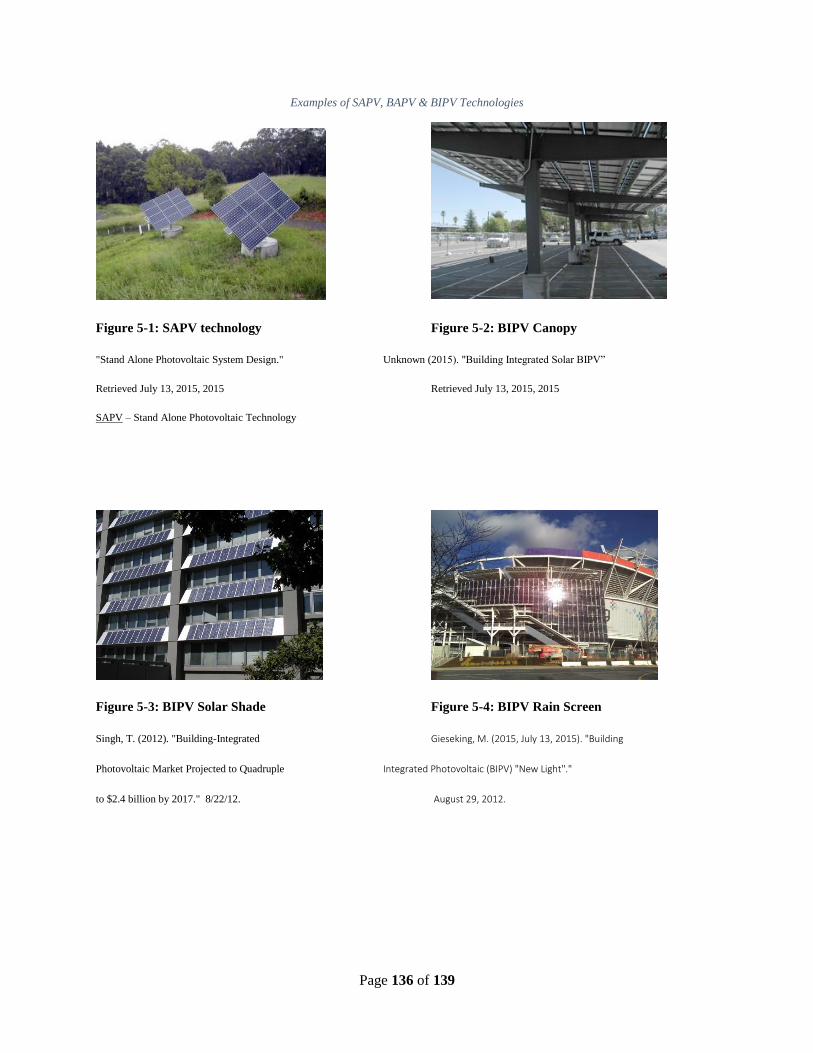
Page 136 of 139
Examples of SAPV, BAPV & BIPV Technologies
Figure 5-1: SAPV technology Figure 5-2: BIPV Canopy
"Stand Alone Photovoltaic System Design." Unknown (2015). "Building Integrated Solar BIPV”
Retrieved July 13, 2015, 2015 Retrieved July 13, 2015, 2015
SAPV – Stand Alone Photovoltaic Technology
Figure 5-3: BIPV Solar Shade Figure 5-4: BIPV Rain Screen
Singh, T. (2012). "Building-Integrated Gieseking, M. (2015, July 13, 2015). "Building
Photovoltaic Market Projected to Quadruple Integrated Photovoltaic (BIPV) "New Light"."
to $2.4 billion by 2017." 8/22/12. August 29, 2012.

Page 137 of 139
Figure 5-5: BIPV window Figure 5-6: BIPV Curtain Wall
Gieseking, M. (2015, July 13, 2015). “Building Integrated Gieseking, M. (2015, July 13, 2015). "Building
Photovoltaic (BIPV) “New Light”, August 29, 2012. Integrated Photovoltaic (BIPV) "New Light"."
August 29, 2012.
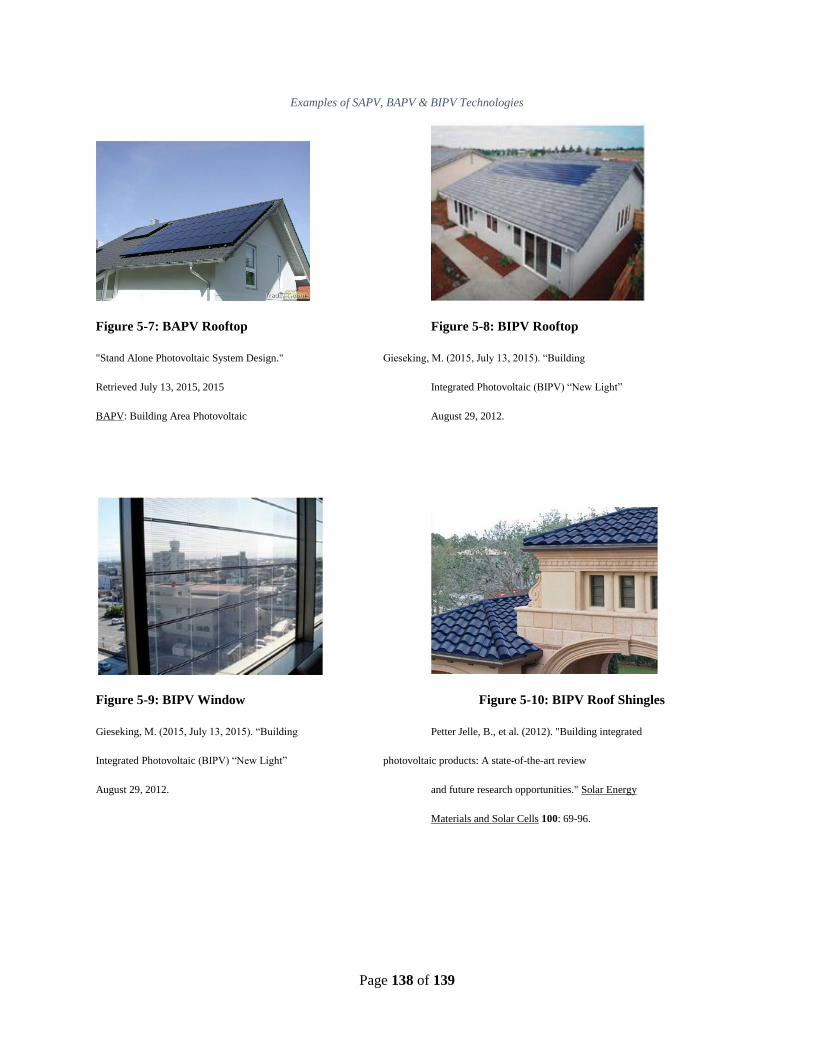
Page 138 of 139
Examples of SAPV, BAPV & BIPV Technologies
Figure 5-7: BAPV Rooftop Figure 5-8: BIPV Rooftop
"Stand Alone Photovoltaic System Design." Gieseking, M. (2015, July 13, 2015). “Building
Retrieved July 13, 2015, 2015 Integrated Photovoltaic (BIPV) “New Light”
BAPV: Building Area Photovoltaic August 29, 2012.
Figure 5-9: BIPV Window Figure 5-10: BIPV Roof Shingles
Gieseking, M. (2015, July 13, 2015). “Building Petter Jelle, B., et al. (2012). "Building integrated
Integrated Photovoltaic (BIPV) “New Light” photovoltaic products: A state-of-the-art review
August 29, 2012. and future research opportunities." Solar Energy
Materials and Solar Cells 100: 69-96.
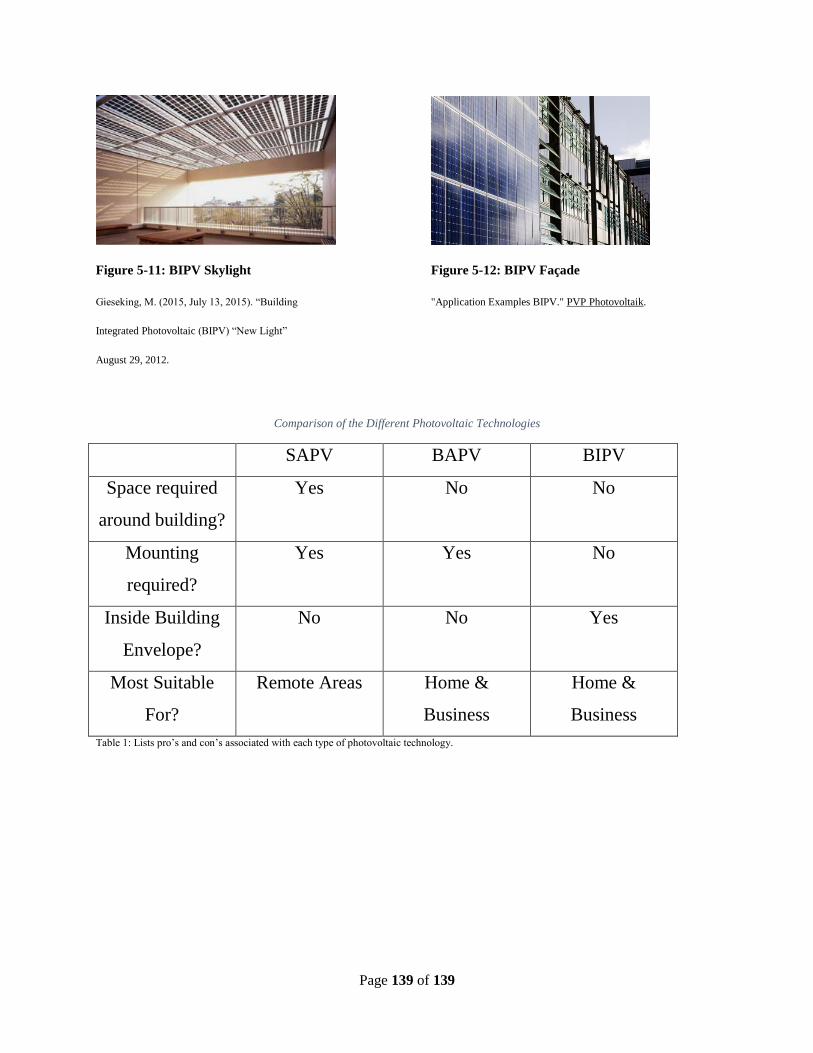
Page 139 of 139
Figure 5-11: BIPV Skylight Figure 5-12: BIPV Façade
Gieseking, M. (2015, July 13, 2015). “Building "Application Examples BIPV." PVP Photovoltaik.
Integrated Photovoltaic (BIPV) “New Light”
August 29, 2012.
Comparison of the Different Photovoltaic Technologies
SAPV BAPV BIPV
Space required
around building?
Yes No No
Mounting
required?
Yes Yes No
Inside Building
Envelope?
No No Yes
Most Suitable
For?
Remote Areas Home &
Business
Home &
Business
Table 1: Lists pro’s and con’s associated with each type of photovoltaic technology.