
Assessment of the European potential for pumped hydropower ...
74
Report EUR 25940 EN 2013 Marcos Gimeno-Gutiérrez Roberto Lacal-Arántegui A GIS-based assessment of pumped hydropower storage potential Assessment of the European potential for pumped hydropower energy storage
Transcript of Assessment of the European potential for pumped hydropower ...
Report EUR 25940 EN
2 0 1 3
Marcos Gimeno-Gutiérrez Roberto Lacal-Arántegui
A GIS-based assessment of
pumped hydropower
storage potential
Assessment of the European potential for pumped hydropower energy storage

European Commission
Joint Research Centre
Institute for Energy and Transport
Contact information
Roberto Lacal Arántegui
Address: Joint Research Centre, Institute for Energy and Transport. Westerduinweg 3, NL-1755 LE Petten,
The Netherlands
E-mail: [email protected]
Tel.: +31 224 56 53 90
Fax: +31 224 56 56 16
http://iet.jrc.ec.europa.eu
http://www.jrc.ec.europa.eu
This publication is a Scientific and Policy Report by the Joint Research Centre of the European Commission.
Legal Notice
Neither the European Commission nor any person acting on behalf of the Commission is responsible for the use which
might be made of this publication.
Europe Direct is a service to help you find answers to your questions about the European Union
Freephone number (*): 00 800 6 7 8 9 10 11
(*) Certain mobile telephone operators do not allow access to 00 800 numbers or these calls may be billed.
A great deal of additional information on the European Union is available on the Internet. It can be accessed through
the Europa server http://europa.eu/
JRC81226
EUR 25940 EN
ISBN 978-92-79-29511-9 (pdf)
ISBN 978-92-79-29512-6 (print)
ISSN 1831-9424 (online)
ISSN 1018-5593 (print)
doi:10.2790/86815
Luxembourg: Publications Office of the European Union, 2013
© European Union, 2013
Reproduction is authorised provided the source is acknowledged.
Cover picture: Ibon de Plan. © Rafael Parrilla Camara.
Printed in the Netherlands
Joint Research Centre Assessment of the European potential for PHS
3
Table of content
Abstract .......................................................................................................................................................... 5
1. Introduction ......................................................................................................................................... 7
2. Methodology application .................................................................................................................. 10
2.1. Methodology definition ........................................................................................................... 10
2.2. Data and software limitations ................................................................................................. 12
2.2.1. Political borders ............................................................................................................... 12
2.2.2. Dams and reservoirs data ............................................................................................... 12
2.2.3. Digital elevation model (DEM) ................................................................................... 14
2.2.4. Inhabited sites, rivers, lakes and transport infrastructure.......................................... 14
2.2.5. Environmental protection: Natura 2000...................................................................... 15
2.2.6. UNESCO World Heritage sites .................................................................................... 15
2.2.7. Grid infrastructure .......................................................................................................... 15
2.3. Other limitations of the model ............................................................................................... 15
2.4. Solutions applied ...................................................................................................................... 16
2.4.1. Modified assumptions .................................................................................................... 16
2.4.2. Other methodological remarks ..................................................................................... 17
2.5. Validation and comparison with existing PHS capacity ..................................................... 17
2.5.1. Maximum energy storage capacity ................................................................................ 17
2.5.1. Calculated storage capacity versus existing PHS facilities ......................................... 17
2.5.2. Energy storage capacity versus installed electrical capacity ...................................... 19
2.5.3. T2 results vs. T1 results and existing schemes. ........................................................... 19
3. Results: the European PHS potential ............................................................................................. 20
3.1. Potential under topology 1 ...................................................................................................... 20
3.1.1. T1 theoretical potential .................................................................................................. 20
3.1.2. T1 realisable potential ..................................................................................................... 22
3.2. Potential under topology 2 ...................................................................................................... 24
3.2.1. T2 theoretical potential .................................................................................................. 24
3.2.2. T2 realisable potential ..................................................................................................... 26
3.2.3. Comparison with the existing capacity......................................................................... 28
3.3. Summary of potentials ............................................................................................................. 29
3.4. Results per country .................................................................................................................. 30
3.5. Sensitivity analysis: the impact of head ................................................................................. 31
4. Conclusions and recommendations ................................................................................................ 33
4.1. Conclusions ............................................................................................................................... 33
4.2. Suggestions for future model development ......................................................................... 33
References:................................................................................................................................................... 35
Abbreviations and acronyms: ................................................................................................................... 38
Annex I: calculation of energy storage for a prospective PHS site. .................................................... 40
Annex II: country files ............................................................................................................................... 41

Joint Research Centre Assessment of the European potential for PHS
4
Acknowledgements
The authors would like to acknowledge the contribution of the ‘Sherpas’ of the European Strategic Energy Technology Plan (SET-Plan) Steering Group.
We would also like to express their high appreciation to the internal and external experts who reviewed the draft report and contributed with comments and ideas for the improvement of this report. They are: Mr Emmanuel Branche and Mr Gregory Fayet from Electricité de France; Mr Alejandro Perea Sánchez, Iberdrola Generación; Dr Atle Harby and Dr Peggy Zinke from SINTEF Energy Research; Mr Erland Eggen from the Research Council of Norway, Dr Paul Leahy from University College Cork, Dr Stefan P. Schmid from Hydroprojekt. Internal reviewers include the members of the Joint Research Centre Dr Alfred de Jager, Dr Efstathios Peteves, Dr Evangelos Tzimas, Dr Arnulf Jæguer-Waldau and Dr Katarin Bodis.
Last but not least we would like to acknowledge the help of the European Environmental Agency, represented in Mr Óscar Gómez Prieto and Dr Philippe Crouzet, which provided us with their database of dams and reservoirs, without which this work would not have been possible.
The European maps in this report were generated using border data from Natural Earth [Naturalearthdata, 2013]
Joint Research Centre Assessment of the European potential for PHS
5
ABSTRACT
The European energy and climate policies have as one of their targets a 20% final energy from renewable origin by 2020. This target entails an even higher penetration of renewable energy in the electricity mix, possibly between 35 and 40%, and a high component of it will be non-dispatchable1 renewables such as wind and solar energy. Moreover, the European Union's (EU) 2050 decarbonisation objectives, with a target of 80 - 95 % reduction in greenhouse gas emissions, will require even higher shares of renewables in the electricity mix.
Electricity systems need to be flexible in order to guarantee at every moment the equilibrium between generation and consumption. To achieve a high penetration of wind and solar energy, one way to introduce this flexibility is through pumped hydropower storage (PHS), currently representing almost 99 % of current worldwide electricity storage capacity. PHS behaves as load when pumping and as generation when it supplies electricity to the system, and can change between both in minutes. There exists no published scientific work, until now, has assessed what the potential for PHS could be in Europe.
This report presents the results of the assessment for PHS in Europe under certain topologies and scenarios. Earlier work by the JRC 2 defined the methodology used in this study which focuses on two topologies: (T1) when two reservoirs exist already with the adequate difference in elevation and which are close enough so that they can be linked by a new penstock and electrical equipment, and (T2) based on one existing reservoir, when there is a suitable site close enough as to build a second reservoir. The scenarios modelled consist of different maximum distances possible between the two reservoirs of a prospective PHS and, in one occasion, of a different minimum head for a similar maximum distance. The former are 1, 2, 3, 5, 10 and 20 km and the latter is 50 metres instead of the standard minimum of 150-metre head.
The results show that the theoretical potential in Europe is significant under both topologies, and that the potential of topology 2 is roughly double that of topology 1. Under T1 the theoretical potential energy stored reaches 54 TWh when a maximum of 20 km between existing reservoirs is considered; of this potential approximately 11 TWh correspond to the EU and 37 TWh to candidate countries, mostly Turkey. When a shorter maximum distance between existing reservoirs is considered, e.g. 5 km, the majority of the 0.83 TWh European theoretical potential is in the EU (85%).
Under T2 the European theoretical potential reaches 123 TWh when the distance between the existing reservoir and the prospective site is up to 20 km. Unlike topology 1, in topology 2 the majority of this potential (50%) lies within the EU. For a distance between reservoirs of 5 km a theoretical potential of 15 TWh -of which 7.4 TWh within the EU- was found.
The theoretical potential is reduced to a realisable potential through the application of constraints such as discounting potential sites close to a centre of population, protected natural areas or transport infrastructure. Under those conditions, the realisable potential for topology 1 and the 20 km distance is halved to 29 TWh, and for the 5 km scenario it is reduced to 0.2 TWh. Topology 2, by contrast, and probably owing to a larger amount of prospective sites available, is less affected by the application of constraints. Under the 20-km scenario the realisable potential in Europe reaches 80 TWh of which 33 TWh in the EU. Under the 5-km scenario those potentials reach 10 TWh for Europe of which 40% in the EU.
1 Dispatchable generation refers to sources of electricity that can be dispatched at the request of power grid operators; that is, generating plants that can be turned on or off, or can adjust their power output on demand. 2 Pumped-hydro energy storage: potential for transformation from single dams [JRC, 2011]

Joint Research Centre Assessment of the European potential for PHS
6
A comparison with the existing PHS reported in 14 countries suggests that the T1 theoretical potential is 3.5 times the existing capacity whereas the T2 realisable potential is 10 times as much the existing capacity.
Further work should aim at facilitating the actual implementation of the potential by, for example, providing stakeholders with more accurate data on the potential sites identified, introducing the potential in grid-development computer models, adding economic parameters, and enabling policy-makers (in particular spatial planning authorities), project developers and engineering companies with the knowledge of the potential sites.
Joint Research Centre Assessment of the European potential for PHS
7
1. INTRODUCTION
The contribution of renewable energies to the world’s total energy demand has increased particularly during the last two decades, and they will continue gaining market share. Because the natural resources that fuel those renewables (e.g. insolation, wind or precipitation) follow their own pattern of availability, the renewable energy produced from them may not be forced to follow energy demand. Therefore, a mismatch occurs between generation (in particular of electricity) from renewables and consumer demand.
The electricity systems offer several alternatives to solve that mismatch, which were originally developed as a response to the fluctuations in demand and to protect against the loss of generation power plant. These alternatives are: interconnections between electricity systems; energy storage; smart networks; and demand-side response (DSR) [DECC, 2012]. Utility-level energy storage for electricity systems include mostly the storage effect of reservoir-based conventional hydropower schemes, and pumped hydropower storage. Compressed air energy storage (CAES) is still a technology under development whereas batteries and other technologies offer smaller capacities.
The European energy and climate policies have as one of their targets 20% of final energy from renewable origin by 2020 [EC, 2007]. This target entails an even higher penetration of renewable energy in the electricity mix, possibly between 35 and 40%, and a high component of this will be made of non-dispatchable renewables such as wind and solar. Moreover, the EU's 2050 decarbonisation objectives, with a target of 80 - 95 % reduction in greenhouse gas emissions [European Council, 2009], will require even higher share of renewables in the electricity mix.
In its recent Communication Renewable Energy: a major player in the European energy market [EC, 2012], the European Commission points out the need for storage facilities to contribute to the flexibility encouraged in the electricity market. As part of its review of this Communication, the (Energy) Council of the European Union required that consideration is given “on ways and means to strengthen the potential for development of RES3 in an integrated, secure and cost-efficient and effective way, in relation to grid infrastructure (e.g. addressing loop flows), storage, back-up capacity and better operational solutions” [Council, 2012].
Different studies suggest that energy demand in Europe could double by 2025 and still increase afterwards, and a storage capacity of 40 TWh will be necessary by 2040 for periods from days to weeks, and sometimes months in the EU [Auer and Keil, 2012].
A gross total of 567 TWh of electricity was generated from non-biomass RES in the EU during 2011. Of this, hydropower excluding PHS contributed with 335 TWh from 104 GW of installed capacity [Eurostat, 2013].
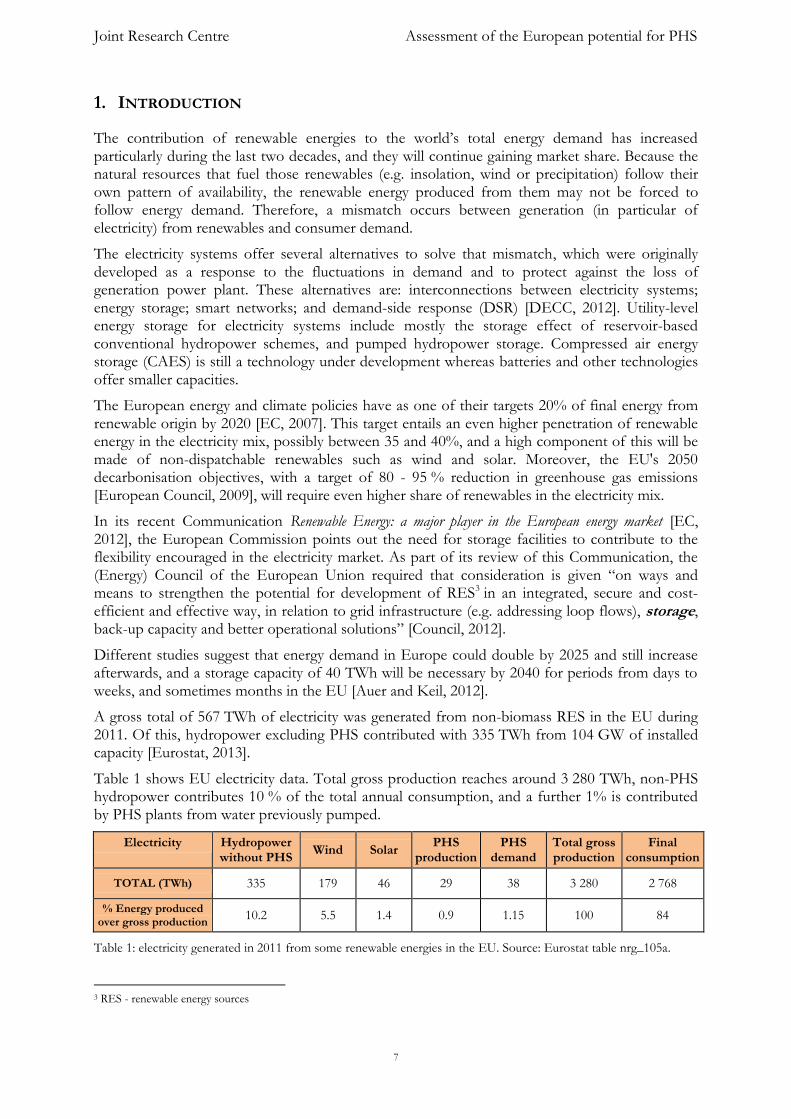
Table 1 shows EU electricity data. Total gross production reaches around 3 280 TWh, non-PHS hydropower contributes 10 % of the total annual consumption, and a further 1% is contributed by PHS plants from water previously pumped.
Electricity Hydropower without PHS
Wind Solar PHS
production PHS
demand Total gross production
Final consumption
TOTAL (TWh) 335 179 46 29 38 3 280 2 768
% Energy produced over gross production
10.2 5.5 1.4 0.9 1.15 100 84
Table 1: electricity generated in 2011 from some renewable energies in the EU. Source: Eurostat table nrg_105a.
3 RES - renewable energy sources
Joint Research Centre Assessment of the European potential for PHS
8
Conventional hydropower is one of the means of using stored energy. When not based on an existing lake, it is based on creating a reservoir by closing a valley with a dam and allowing the corresponding river to fill up the reservoir, then generating renewable energy by releasing the water through a turbine. The unwanted by-products of this approach include river disruption and other environmental issues, e.g. when the river natural distribution and timing of stream flow is altered, affecting riparian areas, altering the geomorphological process and thus dramatically disturbing the aquatic biodiversity by preventing free migration of many aquatic species including fish. Another undesirable effect is, in some cases, forced relocation of people or important landscape changes caused by filling up the entire valley with water [Dameffects, 2013; WCD, 2000]. Finally, conventional reservoir hydropower is not capable of storing excess electricity when it occurs in the system, e.g. when wind electricity is abundant and demand is low.
An alternative or complement to conventional hydropower is pumped hydropower storage (PHS), which is the most established technology for utility-scale electricity storage. By pumping water to the upper reservoir, PHS schemes allow the storage of surplus electricity in the form of the potential energy of water; by releasing it through a turbine, they allow the transformation back to electricity. This supports the integration of electricity from non-flexible power plant (such as nuclear and baseload coal plant), and, lately, of variable renewable energies.
When analysing the potential for new PHS, several topologies are possible.
Topology Assessment based on:
1 Linking two existing reservoirs with one or several penstock(s), and adding a powerhouse to transform them to a PHS scheme
2 Transformation of one existing lake or reservoir to PHS by detecting a suitable site for a second reservoir. The second reservoir could be on a flat or non-sloping area, by digging or building shallow dams, on a depression or in a valley4
3 A greenfield PHS based on a suitable topographical context: either valleys which can be closed with a dam, depressions, hill tops which could be slashed, etc. This topology is broader i.e. neither based on existing lakes or reservoirs nor assuming a flat area for building the second reservoir
4 Sea-based PHS: a greenfield PHS that uses the sea as the lower reservoir and a new nearby reservoir, or the sea as upper basin and a cavern as lower reservoir5
5 Multi-reservoir systems including both PHS and conventional hydropower
6 The lower reservoir is basically a large river providing sufficient inflow into the PHS system. An example is the Jochenstein-Riedl PHS where the Danube acts as lower reservoir6
7 Use of an abandoned mine pit as the basis for the PHS. The methodology to be used would be similar to the topology 2 one. An example is the old coal mine of As Pontes, in Spain7
Table 2: brief description of the different PHS topologies from the point of view of assessing PHS potential. Source: SETIS expert workshop on the assessment of the potential of pumped hydropower storage [JRC, 2012].
Even when there are no official figures for storage capacity in PHS in Europe or the EU, there are figures for PHS electricity installed generation capacity: around 42.6 GW in the EU [Eurostat, 2013]. In terms of electricity generation and consumption, in total in Europe, Platts [2012] gives the figures of 40 TWh generated per year consuming 54 TWh in pumping, these from 232
4 In this study we do not consider valleys due to the environmental issues. 5 For an example of the former see the Okinawa Yanbaru PHS at http://en.wikipedia.org/wiki/Okinawa_Yanbaru_Seawater_Pumped_Storage_Power_Station. For the details of the latter option see http://www.psh-offshore.com/en/concept/? 6 See the web of Verbund where a clear scheme shows this topology: http://www.verbund.com/pp/en/pumped-storage-power-plant/riedl 7 For more information see http://www.lagodeaspontes.com/
Joint Research Centre Assessment of the European potential for PHS
9
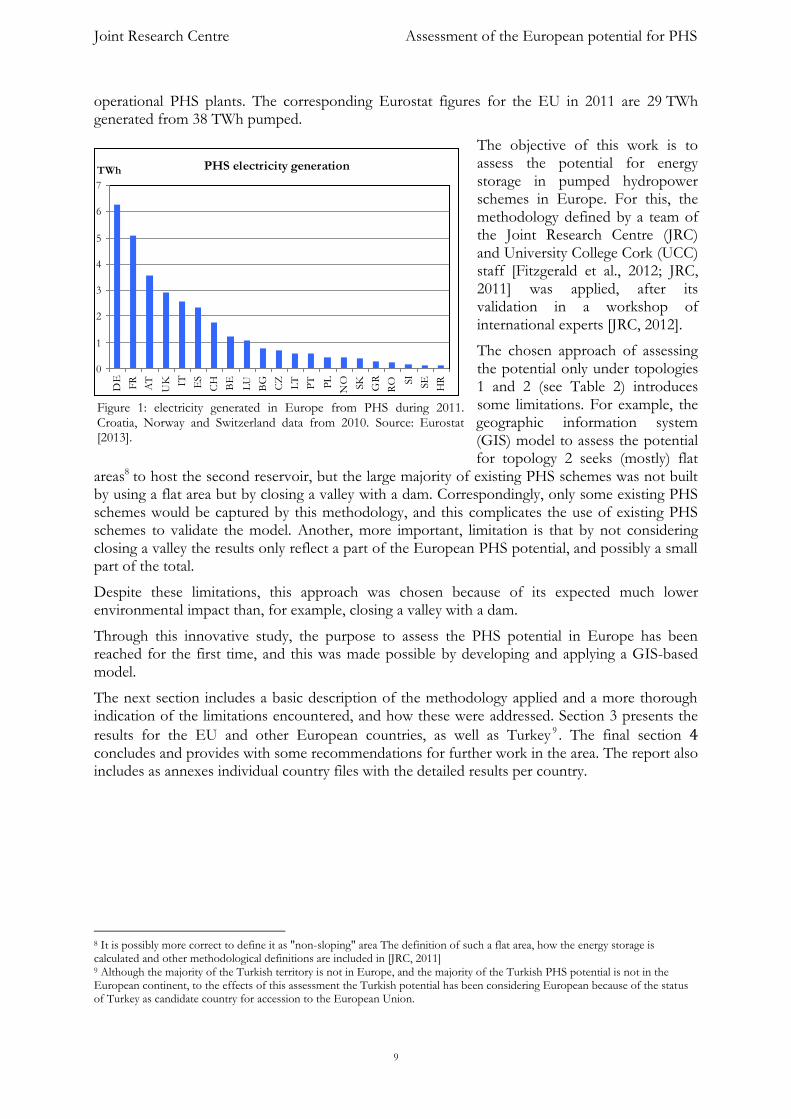
operational PHS plants. The corresponding Eurostat figures for the EU in 2011 are 29 TWh generated from 38 TWh pumped.
The objective of this work is to assess the potential for energy storage in pumped hydropower schemes in Europe. For this, the methodology defined by a team of the Joint Research Centre (JRC) and University College Cork (UCC) staff [Fitzgerald et al., 2012; JRC, 2011] was applied, after its validation in a workshop of international experts [JRC, 2012].
The chosen approach of assessing the potential only under topologies 1 and 2 (see Table 2) introduces some limitations. For example, the geographic information system (GIS) model to assess the potential for topology 2 seeks (mostly) flat
areas8 to host the second reservoir, but the large majority of existing PHS schemes was not built by using a flat area but by closing a valley with a dam. Correspondingly, only some existing PHS schemes would be captured by this methodology, and this complicates the use of existing PHS schemes to validate the model. Another, more important, limitation is that by not considering closing a valley the results only reflect a part of the European PHS potential, and possibly a small part of the total.
Despite these limitations, this approach was chosen because of its expected much lower environmental impact than, for example, closing a valley with a dam.
Through this innovative study, the purpose to assess the PHS potential in Europe has been reached for the first time, and this was made possible by developing and applying a GIS-based model.
The next section includes a basic description of the methodology applied and a more thorough indication of the limitations encountered, and how these were addressed. Section 3 presents the
results for the EU and other European countries, as well as Turkey 9 . The final section 4 concludes and provides with some recommendations for further work in the area. The report also includes as annexes individual country files with the detailed results per country.
8 It is possibly more correct to define it as "non-sloping" area The definition of such a flat area, how the energy storage is calculated and other methodological definitions are included in [JRC, 2011] 9 Although the majority of the Turkish territory is not in Europe, and the majority of the Turkish PHS potential is not in the European continent, to the effects of this assessment the Turkish potential has been considering European because of the status of Turkey as candidate country for accession to the European Union.
PHS electricity generation
0
1
2
3
4
5
6
7
DE
FR
AT
UK IT ES
CH
BE
LU
BG
CZ
LT
PT PL
NO SK GR
RO SI SE HR
TWh
Figure 1: electricity generated in Europe from PHS during 2011. Croatia, Norway and Switzerland data from 2010. Source: Eurostat [2013].
Joint Research Centre Assessment of the European potential for PHS
10
2. METHODOLOGY APPLICATION
2.1. Methodology definition
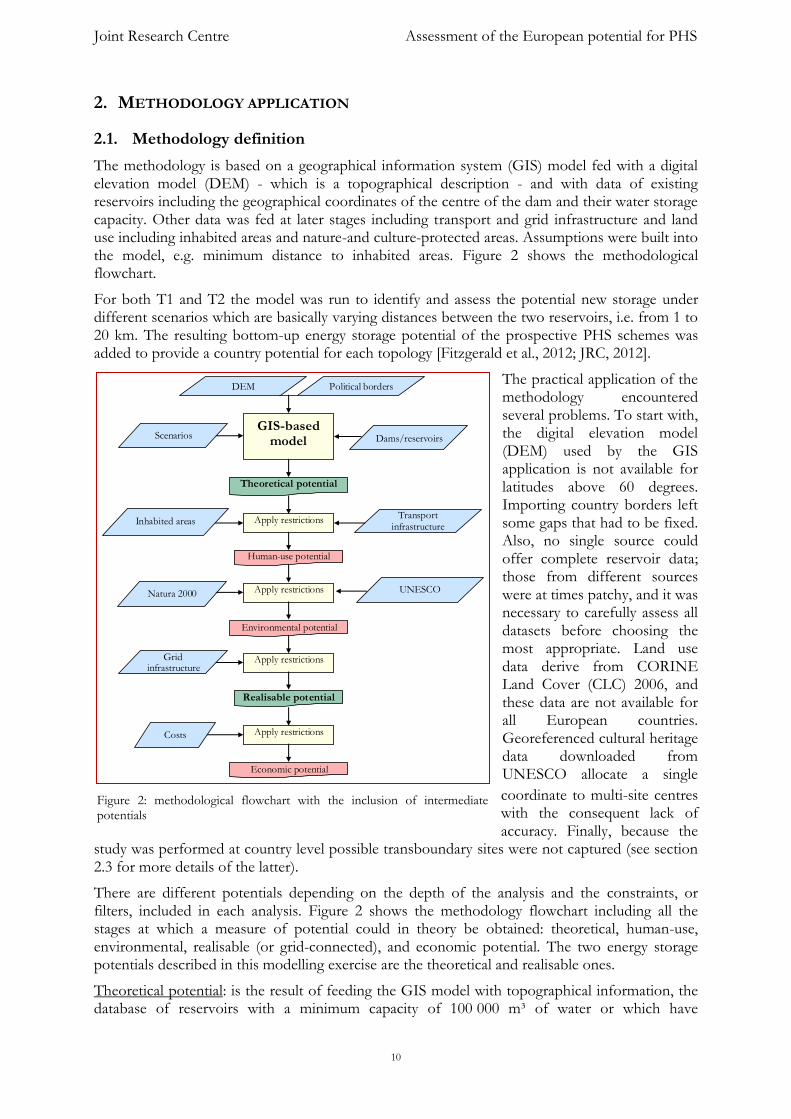
The methodology is based on a geographical information system (GIS) model fed with a digital elevation model (DEM) - which is a topographical description - and with data of existing reservoirs including the geographical coordinates of the centre of the dam and their water storage capacity. Other data was fed at later stages including transport and grid infrastructure and land use including inhabited areas and nature-and culture-protected areas. Assumptions were built into the model, e.g. minimum distance to inhabited areas. Figure 2 shows the methodological flowchart.
For both T1 and T2 the model was run to identify and assess the potential new storage under different scenarios which are basically varying distances between the two reservoirs, i.e. from 1 to 20 km. The resulting bottom-up energy storage potential of the prospective PHS schemes was added to provide a country potential for each topology [Fitzgerald et al., 2012; JRC, 2012].
The practical application of the methodology encountered several problems. To start with, the digital elevation model (DEM) used by the GIS application is not available for latitudes above 60 degrees. Importing country borders left some gaps that had to be fixed. Also, no single source could offer complete reservoir data; those from different sources were at times patchy, and it was necessary to carefully assess all datasets before choosing the most appropriate. Land use data derive from CORINE Land Cover (CLC) 2006, and these data are not available for all European countries. Georeferenced cultural heritage data downloaded from UNESCO allocate a single
coordinate to multi-site centres with the consequent lack of accuracy. Finally, because the
study was performed at country level possible transboundary sites were not captured (see section 2.3 for more details of the latter).
There are different potentials depending on the depth of the analysis and the constraints, or filters, included in each analysis. Figure 2 shows the methodology flowchart including all the stages at which a measure of potential could in theory be obtained: theoretical, human-use, environmental, realisable (or grid-connected), and economic potential. The two energy storage potentials described in this modelling exercise are the theoretical and realisable ones.
Theoretical potential: is the result of feeding the GIS model with topographical information, the database of reservoirs with a minimum capacity of 100 000 m³ of water or which have
Dams/reservoirs Scenarios
DEM
Political borders
Inhabited areas
GIS-based model
Apply restrictions
Natura 2000
Grid infrastructure
Costs
Theoretical potential
Human-use potential
Environmental potential
Realisable potential
Economic potential
Apply restrictions
Apply restrictions
Apply restrictions
Transport infrastructure
UNESCO
Figure 2: methodological flowchart with the inclusion of intermediate potentials
Joint Research Centre Assessment of the European potential for PHS
11
hydroelectricity production rated 1 MW or more10, and scenarios for the parameters head and maximum distance between reservoirs. Several scenarios were evaluated and the corresponding energy storage potentials were estimated for each topology, six for T1 and seven for T2.
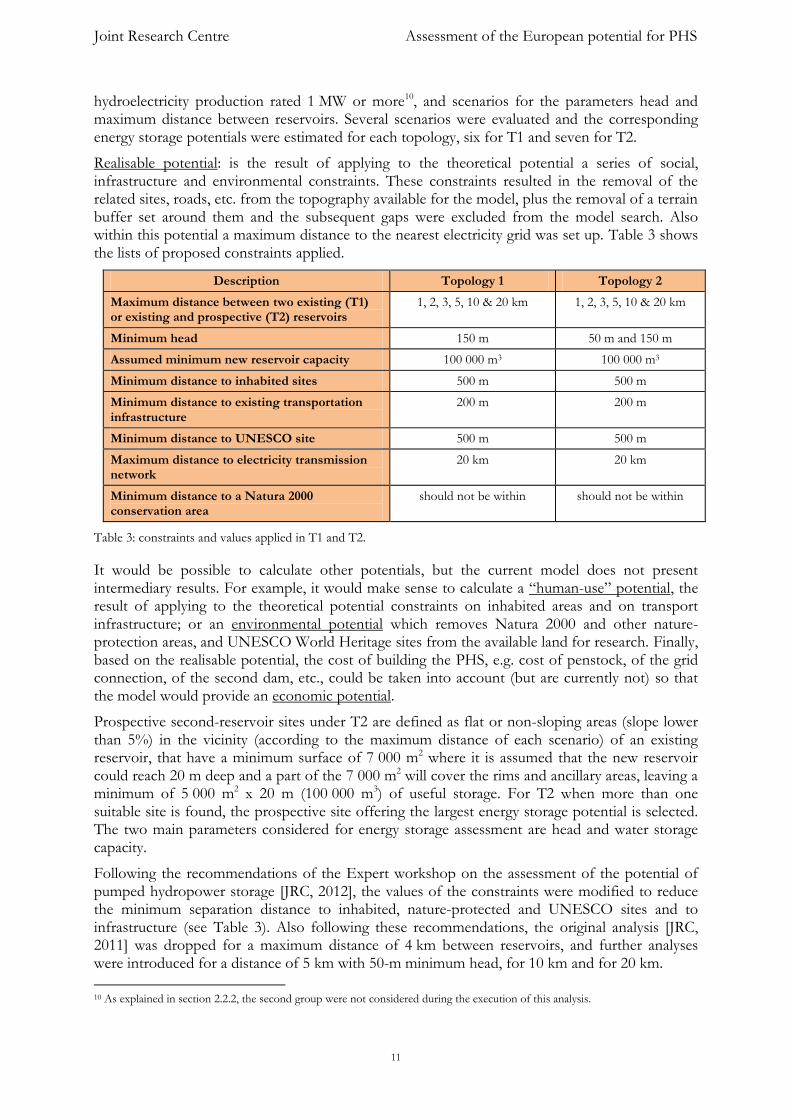
Realisable potential: is the result of applying to the theoretical potential a series of social, infrastructure and environmental constraints. These constraints resulted in the removal of the related sites, roads, etc. from the topography available for the model, plus the removal of a terrain buffer set around them and the subsequent gaps were excluded from the model search. Also within this potential a maximum distance to the nearest electricity grid was set up. Table 3 shows the lists of proposed constraints applied.
Description Topology 1 Topology 2
Maximum distance between two existing (T1) or existing and prospective (T2) reservoirs
1, 2, 3, 5, 10 & 20 km 1, 2, 3, 5, 10 & 20 km
Minimum head 150 m 50 m and 150 m
Assumed minimum new reservoir capacity 100 000 m3 100 000 m3
Minimum distance to inhabited sites 500 m 500 m
Minimum distance to existing transportation infrastructure
200 m 200 m
Minimum distance to UNESCO site 500 m 500 m
Maximum distance to electricity transmission network
20 km 20 km
Minimum distance to a Natura 2000 conservation area
should not be within should not be within
Table 3: constraints and values applied in T1 and T2.
It would be possible to calculate other potentials, but the current model does not present intermediary results. For example, it would make sense to calculate a “human-use” potential, the result of applying to the theoretical potential constraints on inhabited areas and on transport infrastructure; or an environmental potential which removes Natura 2000 and other nature-protection areas, and UNESCO World Heritage sites from the available land for research. Finally, based on the realisable potential, the cost of building the PHS, e.g. cost of penstock, of the grid connection, of the second dam, etc., could be taken into account (but are currently not) so that the model would provide an economic potential.
Prospective second-reservoir sites under T2 are defined as flat or non-sloping areas (slope lower than 5%) in the vicinity (according to the maximum distance of each scenario) of an existing reservoir, that have a minimum surface of 7 000 m2 where it is assumed that the new reservoir could reach 20 m deep and a part of the 7 000 m2 will cover the rims and ancillary areas, leaving a minimum of 5 000 m2 x 20 m (100 000 m3) of useful storage. For T2 when more than one suitable site is found, the prospective site offering the largest energy storage potential is selected. The two main parameters considered for energy storage assessment are head and water storage capacity.
Following the recommendations of the Expert workshop on the assessment of the potential of pumped hydropower storage [JRC, 2012], the values of the constraints were modified to reduce the minimum separation distance to inhabited, nature-protected and UNESCO sites and to infrastructure (see Table 3). Also following these recommendations, the original analysis [JRC, 2011] was dropped for a maximum distance of 4 km between reservoirs, and further analyses were introduced for a distance of 5 km with 50-m minimum head, for 10 km and for 20 km.
10 As explained in section 2.2.2, the second group were not considered during the execution of this analysis.

Joint Research Centre Assessment of the European potential for PHS
12
2.2. Data and software limitations
2.2.1. Political borders
With the purpose of extracting the information needed for a country-based assessment, political borders were downloaded from the DIVA-GIS website, where country-level, free spatial data are provided. This is considered to be a reliable, accurate and ready-to-use source [JRC, 2011].
The list of countries for which PHS potential was analysed comprises most of the European countries as listed in Table 4.
Countries included in the analysis[2]
EU Member States (EU)
Austria (AT) Belgium (BE) Bulgaria (BG) Cyprus (CY) Sweden (SE) Czech Republic (CZ) Spain (ES)
France (FR) Ireland (IE) Romania (RO) Poland (PL) Germany (DE) Hungary (HU) Italy (IT)
Portugal (PT) Greece (GR) Slovakia (SK) Slovenia (SI) Finland (FI) United Kingdom (UK)
Acceding country (AC)
Croatia (HR)
EFTA Members
Norway (NO) Switzerland (CH) (Iceland was included as part of the candidate countries group)
Candidate countries (CC)
Iceland (IS) Serbia (RS) Turkey (TR) FYROM (MK) Montenegro (ME)
Potential candidates (PC)
Albania (AL) Bosnia and Herzegovina (BA) Kosovo* (XK)
Table 4: list of countries assessed for PHS potential. Source: http://europa.eu/about-eu/countries/index_en.htm *(Kosovo does not have official ISO code).
Several EU Member States have not been analysed because of different reasons. In some cases no reservoir data were available e.g. Estonia, Latvia, Lithuania, Luxemburg and Malta; or by physical limitations in some cases, as it occurs with very flat countries, e.g. the Netherlands and Denmark. Candidate countries (CC), Iceland, Montenegro, Serbia, the Former Yugoslav Republic of Macedonia and Turkey were also analysed, along with the potential candidates (PC) Albania, Bosnia and Herzegovina and Kosovo. Three of countries in the European Free Trade Association (EFTA) 11 , Norway, and Switzerland were analysed, Iceland was analysed and included in the CC country group and Liechtenstein was not analysed.
2.2.2. Dams and reservoirs data
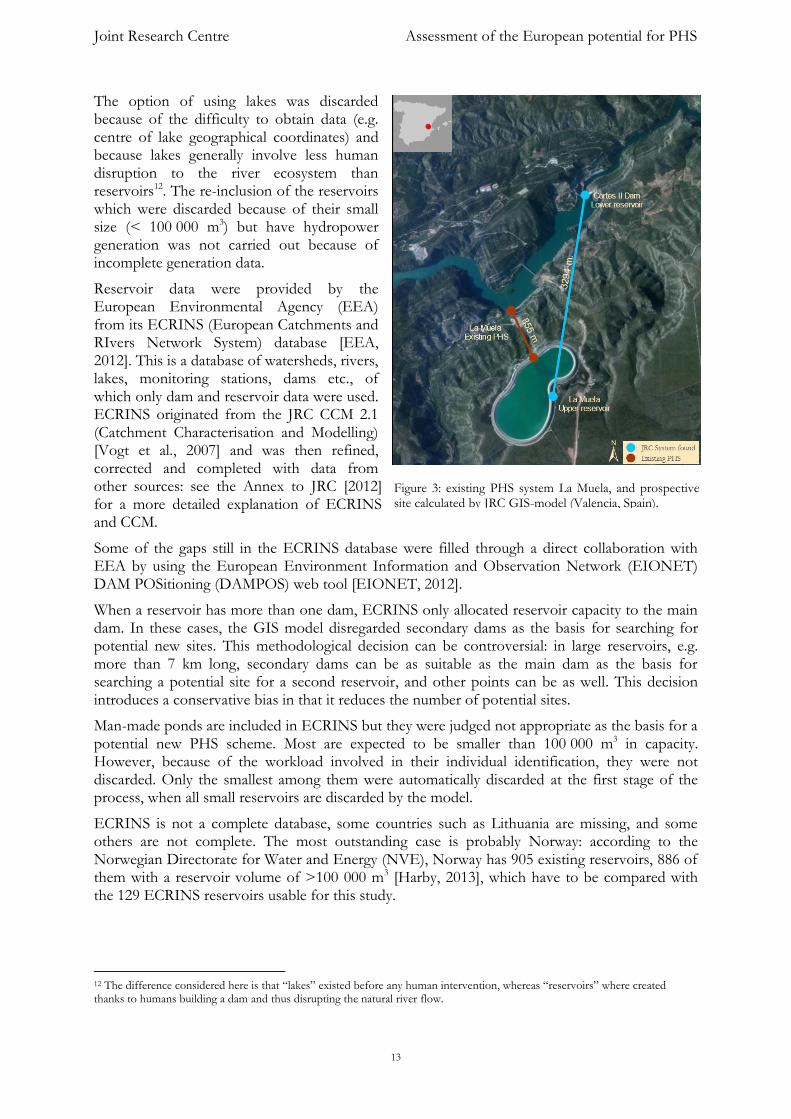
The data needed on existing reservoirs include the reservoir name and geographical location, its water storage capacity and whether it has hydropower exploitation, in which case the generation capacity is also needed. The model searches for potential new sites referred to a single point, and with existing reservoirs sized from several thousand square meters to several square kilometres, it was necessary to choose the “single point” between, e.g. the centre of the reservoir or the centre of the dam. The latter was chosen primarily because databases generally provide dam locations, and because it tends to be the point where the reservoir is deeper and the hydropower water intakes are installed.
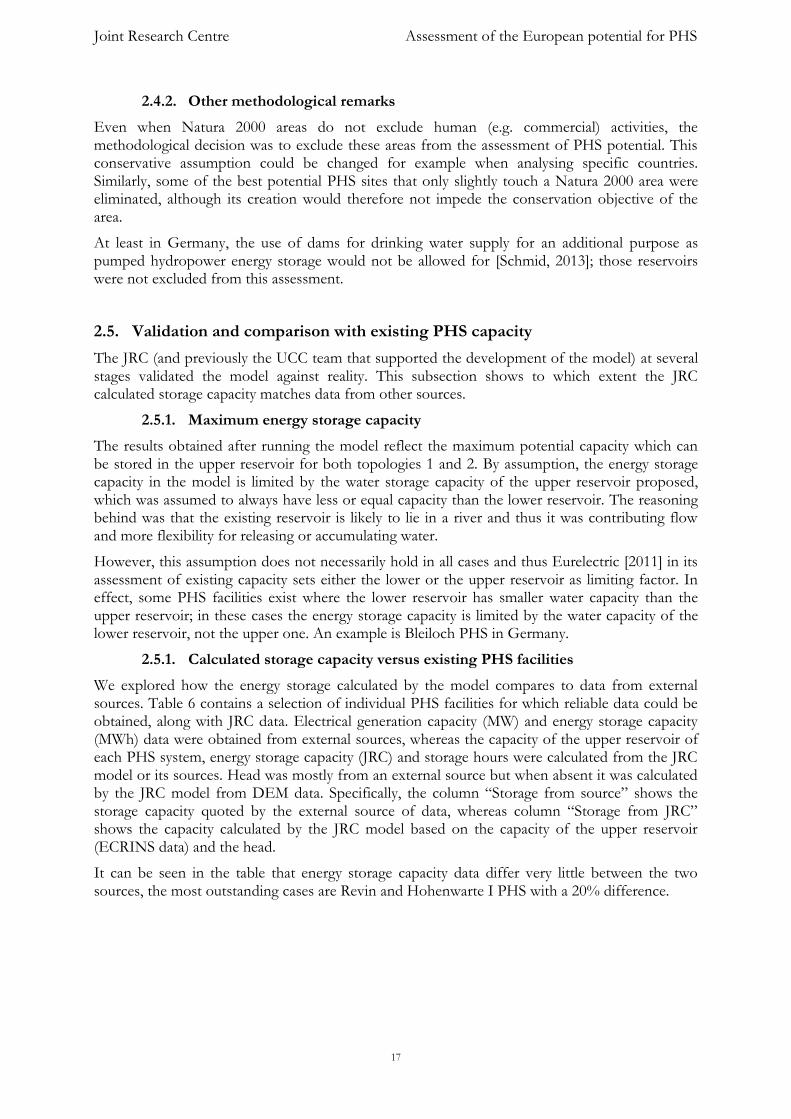
However, this is not always the case. Figure 3 shows the PHS La Muela, where the water intakes are placed at a distance of less than one kilometre whereas following the procedure above, the model assumes the distance between dams, 3.2 km. As a consequence, the potential identified is included under the 5-km scenario and not under the 1-km scenario.
2 European Free Trade Association members can be found on: http://www.efta.int/
Joint Research Centre Assessment of the European potential for PHS
13
The option of using lakes was discarded because of the difficulty to obtain data (e.g. centre of lake geographical coordinates) and because lakes generally involve less human disruption to the river ecosystem than reservoirs12. The re-inclusion of the reservoirs which were discarded because of their small size (< 100 000 m3) but have hydropower generation was not carried out because of incomplete generation data.
Reservoir data were provided by the European Environmental Agency (EEA) from its ECRINS (European Catchments and RIvers Network System) database [EEA, 2012]. This is a database of watersheds, rivers, lakes, monitoring stations, dams etc., of which only dam and reservoir data were used. ECRINS originated from the JRC CCM 2.1 (Catchment Characterisation and Modelling) [Vogt et al., 2007] and was then refined, corrected and completed with data from other sources: see the Annex to JRC [2012] for a more detailed explanation of ECRINS and CCM.
Some of the gaps still in the ECRINS database were filled through a direct collaboration with EEA by using the European Environment Information and Observation Network (EIONET) DAM POSitioning (DAMPOS) web tool [EIONET, 2012].
When a reservoir has more than one dam, ECRINS only allocated reservoir capacity to the main dam. In these cases, the GIS model disregarded secondary dams as the basis for searching for potential new sites. This methodological decision can be controversial: in large reservoirs, e.g. more than 7 km long, secondary dams can be as suitable as the main dam as the basis for searching a potential site for a second reservoir, and other points can be as well. This decision introduces a conservative bias in that it reduces the number of potential sites.
Man-made ponds are included in ECRINS but they were judged not appropriate as the basis for a potential new PHS scheme. Most are expected to be smaller than 100 000 m3 in capacity. However, because of the workload involved in their individual identification, they were not discarded. Only the smallest among them were automatically discarded at the first stage of the process, when all small reservoirs are discarded by the model.
ECRINS is not a complete database, some countries such as Lithuania are missing, and some others are not complete. The most outstanding case is probably Norway: according to the Norwegian Directorate for Water and Energy (NVE), Norway has 905 existing reservoirs, 886 of them with a reservoir volume of >100 000 m3 [Harby, 2013], which have to be compared with the 129 ECRINS reservoirs usable for this study.
12 The difference considered here is that “lakes” existed before any human intervention, whereas “reservoirs” where created thanks to humans building a dam and thus disrupting the natural river flow.
Figure 3: existing PHS system La Muela, and prospective site calculated by JRC GIS-model (Valencia, Spain).
Joint Research Centre Assessment of the European potential for PHS
14
2.2.3. Digital elevation model (DEM)
The elevation information of the dams was extracted using the digital elevation model from Shuttle Radar Topography Mission (SRTM) data. The main reasons for using SRTM include its ease of use, a 90-m resolution, coverage of the whole of Europe up to 60ºN, easy access by download in 5º by 5º blocks, broad acceptance in the scientific community and among the industry. The scope of this study permits the consideration of 90-meters resolution as a good balance between accuracy and computation speed.
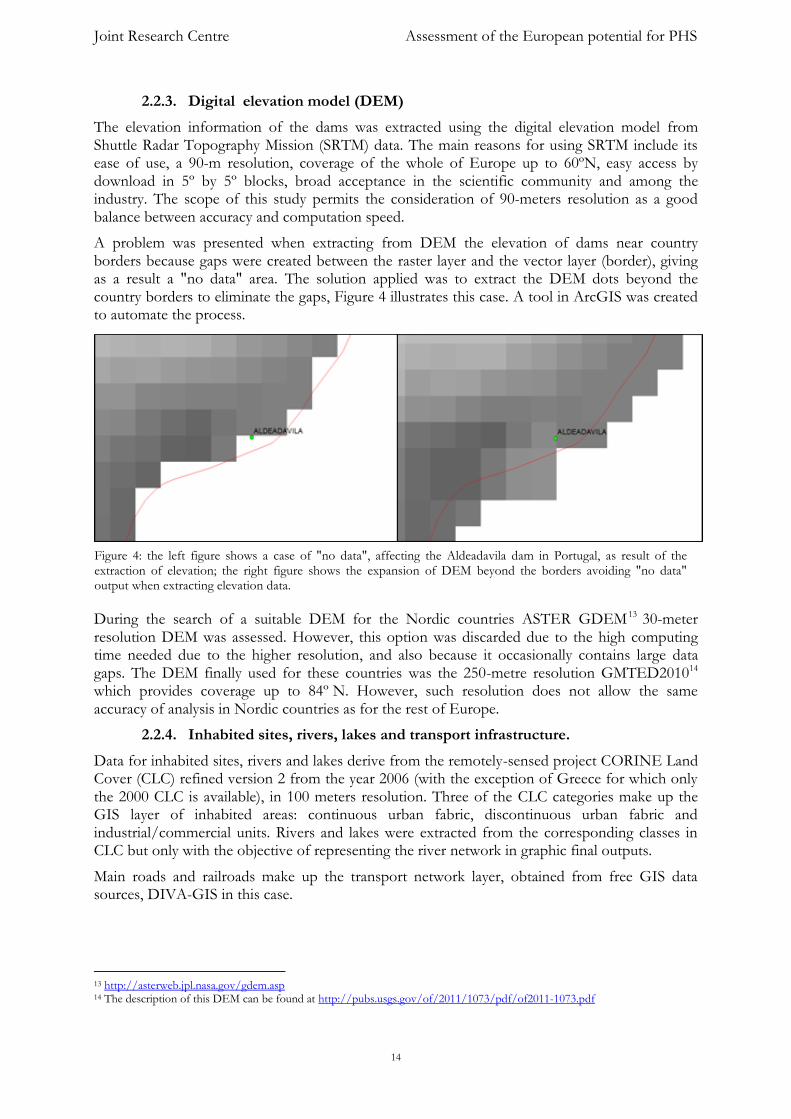
A problem was presented when extracting from DEM the elevation of dams near country borders because gaps were created between the raster layer and the vector layer (border), giving as a result a "no data" area. The solution applied was to extract the DEM dots beyond the country borders to eliminate the gaps, Figure 4 illustrates this case. A tool in ArcGIS was created to automate the process.
During the search of a suitable DEM for the Nordic countries ASTER GDEM 13 30-meter resolution DEM was assessed. However, this option was discarded due to the high computing time needed due to the higher resolution, and also because it occasionally contains large data gaps. The DEM finally used for these countries was the 250-metre resolution GMTED201014 which provides coverage up to 84º N. However, such resolution does not allow the same accuracy of analysis in Nordic countries as for the rest of Europe.
2.2.4. Inhabited sites, rivers, lakes and transport infrastructure.
Data for inhabited sites, rivers and lakes derive from the remotely-sensed project CORINE Land Cover (CLC) refined version 2 from the year 2006 (with the exception of Greece for which only the 2000 CLC is available), in 100 meters resolution. Three of the CLC categories make up the GIS layer of inhabited areas: continuous urban fabric, discontinuous urban fabric and industrial/commercial units. Rivers and lakes were extracted from the corresponding classes in CLC but only with the objective of representing the river network in graphic final outputs.
Main roads and railroads make up the transport network layer, obtained from free GIS data sources, DIVA-GIS in this case.
13 http://asterweb.jpl.nasa.gov/gdem.asp 14 The description of this DEM can be found at http://pubs.usgs.gov/of/2011/1073/pdf/of2011-1073.pdf
Figure 4: the left figure shows a case of "no data", affecting the Aldeadavila dam in Portugal, as result of the extraction of elevation; the right figure shows the expansion of DEM beyond the borders avoiding "no data" output when extracting elevation data.
Joint Research Centre Assessment of the European potential for PHS
15
2.2.5. Environmental protection: Natura 2000
The environmental constraint layer is based on Natura 2000 data from the EEA database. It is comprised of Special Areas of Conservation (SAC) and Special Protection Areas (SPAs). It was assumed that all the key conservation areas, e.g. all national parks as named by the authorities of each country studied, are included there but this point was not verified.
The absence of Natura 2000 areas in Turkey was partly covered with the inclusion Turkey’s 13 Ramsar areas, available from the Ramsar Sites Information Service (RSIS) web site15.
2.2.6. UNESCO World Heritage sites
Cultural aspects were also taken into consideration and are part, with Natura 2000, of the named “Environmental potential” 16 . The United Nations Educational, Scientific and Cultural Organization (UNESCO) was considered the best source of information and the official list was downloaded from UNESCO World Heritage Centre website 17 . This list includes the corresponding geographical coordinates for each Human Heritage site.
However, multi-location World Heritage sites such as a set of caves are defined by a single point, with the consequent risk, for this project, that not all of these sites are taken into account. The impact of this limitation was evaluated and the final decision was to accept the official list because for the purpose of this assessment this is accurate enough. If necessary for a more detailed study, coordinates for multi-location cases could be added in the future.
2.2.7. Grid infrastructure
Electricity grid infrastructure is the last constraint implemented in the GIS model and the results obtained after applying it are considered the “realisable potential”, the final output presented by the model.
The information, sourced from Platts [2006], permits the model to calculate the distance between the PHS scheme proposed and the nearest grid transmission infrastructure. Details on whether the grid can accommodate the additional PHS capacity are not considered by the model.
2.3. Other limitations of the model
In the search for topology 1 potential the model builds a circle around each existing reservoir which is half the size of the maximum distance, i.e. a 10-km radius for the 20-km scenario. When two such circles have some overlapping surface, whichever its extent, the model records a “hit” and the two reservoirs are considered the basis of a potential PHS (theoretical potential): the connection between them is less than the 20 km of the example.
When the environmental restrictions are applied, sometimes a Natura 2000 area touches the intersection between both circles, and the model then eliminates the potential PHS. Although this should not be the case -the connection needed between two existing reservoirs under topology 1 is merely the space of the penstock, and this can be underground thus having no impact on the protected area- this characteristic of the model was maintained.
In the 20-km (and perhaps the 10-km) scenario it could happen that the connection between the two reservoirs stretch over deep valleys, fjords or large natural lakes, which in some cases would render the construction of the penstock(s) unpractical. The likelihood of this case was not explored.
15 http://www.ramsar.wetlands.org 16 Environmental potential is not an output in this study but it could eventually be obtained by modifying the model 17 http://whc.unesco.org/en/list
Joint Research Centre Assessment of the European potential for PHS
16
The inflow and outflow rates of other reservoir users, e.g. drinking water or irrigation, or existing power plants were not included into the model calculations.
Because the assessment was made at country level, when an existing reservoir is close to the border the model did not search for potential sites beyond the border. To alleviate this problem a different unit could have been used, whether this is the river basin district (as defined in the EU Water Framework Directive18), or the mountain range, i.e. treating the Pyrenees as one single system. However, the problem would still exist although slightly changed, borders would be replaced by river basin or mountain range limits. The only solution for this problem is to treat the whole continent as a single unit in ArcGIS, but one drawback is that we could not dispose of enough computing power.
2.4. Solutions applied
2.4.1. Modified assumptions
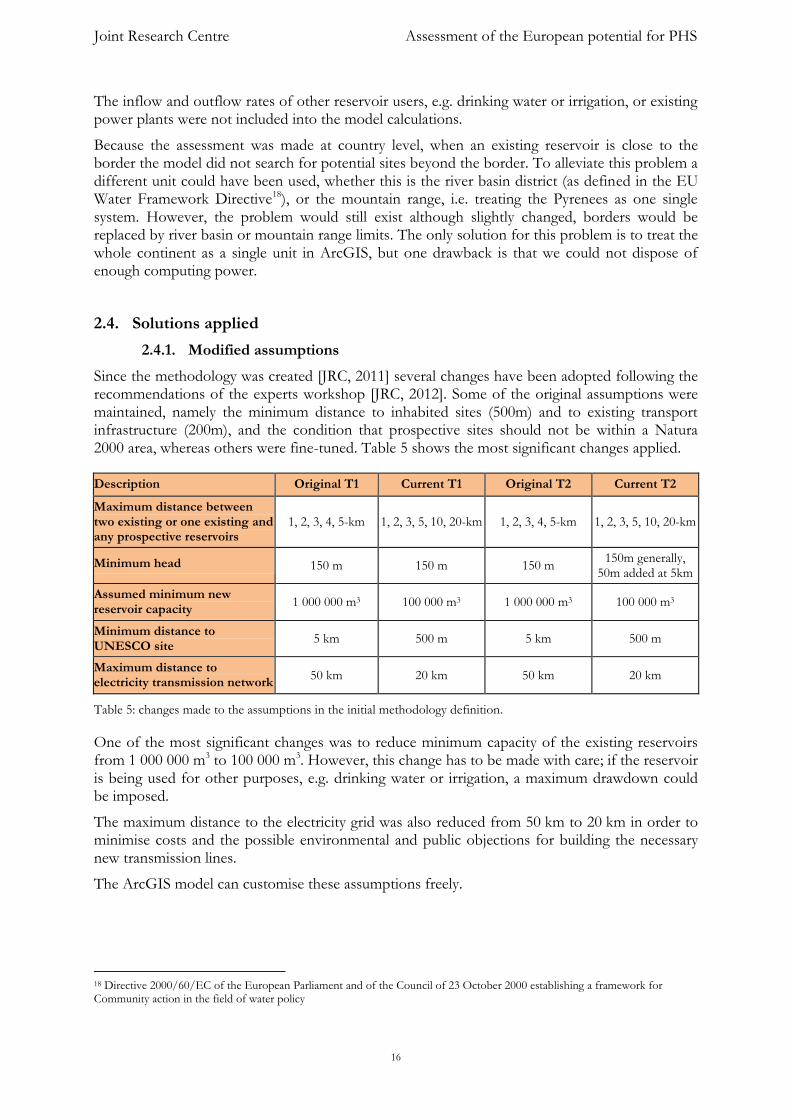
Since the methodology was created [JRC, 2011] several changes have been adopted following the recommendations of the experts workshop [JRC, 2012]. Some of the original assumptions were maintained, namely the minimum distance to inhabited sites (500m) and to existing transport infrastructure (200m), and the condition that prospective sites should not be within a Natura 2000 area, whereas others were fine-tuned. Table 5 shows the most significant changes applied.
Description Original T1 Current T1 Original T2 Current T2
Maximum distance between two existing or one existing and any prospective reservoirs
1, 2, 3, 4, 5-km 1, 2, 3, 5, 10, 20-km 1, 2, 3, 4, 5-km 1, 2, 3, 5, 10, 20-km
Minimum head 150 m 150 m 150 m 150m generally,
50m added at 5km
Assumed minimum new reservoir capacity
1 000 000 m3 100 000 m3 1 000 000 m3 100 000 m3
Minimum distance to UNESCO site
5 km 500 m 5 km 500 m
Maximum distance to electricity transmission network
50 km 20 km 50 km 20 km
Table 5: changes made to the assumptions in the initial methodology definition.
One of the most significant changes was to reduce minimum capacity of the existing reservoirs from 1 000 000 m3 to 100 000 m3. However, this change has to be made with care; if the reservoir is being used for other purposes, e.g. drinking water or irrigation, a maximum drawdown could be imposed.
The maximum distance to the electricity grid was also reduced from 50 km to 20 km in order to minimise costs and the possible environmental and public objections for building the necessary new transmission lines.
The ArcGIS model can customise these assumptions freely.
18 Directive 2000/60/EC of the European Parliament and of the Council of 23 October 2000 establishing a framework for Community action in the field of water policy
Joint Research Centre Assessment of the European potential for PHS
17
2.4.2. Other methodological remarks
Even when Natura 2000 areas do not exclude human (e.g. commercial) activities, the methodological decision was to exclude these areas from the assessment of PHS potential. This conservative assumption could be changed for example when analysing specific countries. Similarly, some of the best potential PHS sites that only slightly touch a Natura 2000 area were eliminated, although its creation would therefore not impede the conservation objective of the area.
At least in Germany, the use of dams for drinking water supply for an additional purpose as pumped hydropower energy storage would not be allowed for [Schmid, 2013]; those reservoirs were not excluded from this assessment.
2.5. Validation and comparison with existing PHS capacity
The JRC (and previously the UCC team that supported the development of the model) at several stages validated the model against reality. This subsection shows to which extent the JRC calculated storage capacity matches data from other sources.
2.5.1. Maximum energy storage capacity
The results obtained after running the model reflect the maximum potential capacity which can be stored in the upper reservoir for both topologies 1 and 2. By assumption, the energy storage capacity in the model is limited by the water storage capacity of the upper reservoir proposed, which was assumed to always have less or equal capacity than the lower reservoir. The reasoning behind was that the existing reservoir is likely to lie in a river and thus it was contributing flow and more flexibility for releasing or accumulating water.
However, this assumption does not necessarily hold in all cases and thus Eurelectric [2011] in its assessment of existing capacity sets either the lower or the upper reservoir as limiting factor. In effect, some PHS facilities exist where the lower reservoir has smaller water capacity than the upper reservoir; in these cases the energy storage capacity is limited by the water capacity of the lower reservoir, not the upper one. An example is Bleiloch PHS in Germany.
2.5.1. Calculated storage capacity versus existing PHS facilities
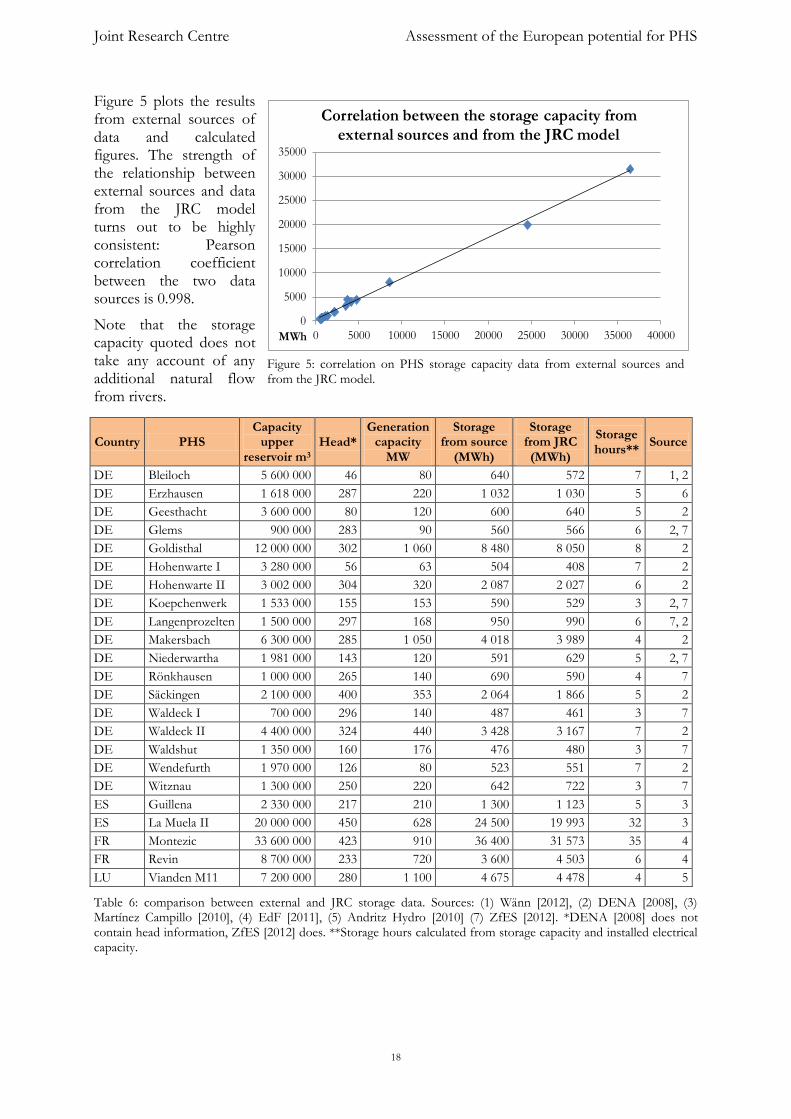
We explored how the energy storage calculated by the model compares to data from external sources. Table 6 contains a selection of individual PHS facilities for which reliable data could be obtained, along with JRC data. Electrical generation capacity (MW) and energy storage capacity (MWh) data were obtained from external sources, whereas the capacity of the upper reservoir of each PHS system, energy storage capacity (JRC) and storage hours were calculated from the JRC model or its sources. Head was mostly from an external source but when absent it was calculated by the JRC model from DEM data. Specifically, the column “Storage from source” shows the storage capacity quoted by the external source of data, whereas column “Storage from JRC” shows the capacity calculated by the JRC model based on the capacity of the upper reservoir (ECRINS data) and the head.
It can be seen in the table that energy storage capacity data differ very little between the two sources, the most outstanding cases are Revin and Hohenwarte I PHS with a 20% difference.
Joint Research Centre Assessment of the European potential for PHS
18
Figure 5 plots the results from external sources of data and calculated figures. The strength of the relationship between external sources and data from the JRC model turns out to be highly consistent: Pearson correlation coefficient between the two data sources is 0.998.
Note that the storage capacity quoted does not take any account of any additional natural flow from rivers.
Table 6: comparison between external and JRC storage data. Sources: (1) Wänn [2012], (2) DENA [2008], (3) Martínez Campillo [2010], (4) EdF [2011], (5) Andritz Hydro [2010] (7) ZfES [2012]. *DENA [2008] does not contain head information, ZfES [2012] does. **Storage hours calculated from storage capacity and installed electrical capacity.
Country PHS Capacity
upper reservoir m3
Head* Generation
capacity MW
Storage from source
(MWh)
Storage from JRC (MWh)
Storage hours**
Source
DE Bleiloch 5 600 000 46 80 640 572 7 1, 2
DE Erzhausen 1 618 000 287 220 1 032 1 030 5 6
DE Geesthacht 3 600 000 80 120 600 640 5 2
DE Glems 900 000 283 90 560 566 6 2, 7
DE Goldisthal 12 000 000 302 1 060 8 480 8 050 8 2
DE Hohenwarte I 3 280 000 56 63 504 408 7 2
DE Hohenwarte II 3 002 000 304 320 2 087 2 027 6 2
DE Koepchenwerk 1 533 000 155 153 590 529 3 2, 7
DE Langenprozelten 1 500 000 297 168 950 990 6 7, 2
DE Makersbach 6 300 000 285 1 050 4 018 3 989 4 2
DE Niederwartha 1 981 000 143 120 591 629 5 2, 7
DE Rönkhausen 1 000 000 265 140 690 590 4 7
DE Säckingen 2 100 000 400 353 2 064 1 866 5 2
DE Waldeck I 700 000 296 140 487 461 3 7
DE Waldeck II 4 400 000 324 440 3 428 3 167 7 2
DE Waldshut 1 350 000 160 176 476 480 3 7
DE Wendefurth 1 970 000 126 80 523 551 7 2
DE Witznau 1 300 000 250 220 642 722 3 7
ES Guillena 2 330 000 217 210 1 300 1 123 5 3
ES La Muela II 20 000 000 450 628 24 500 19 993 32 3
FR Montezic 33 600 000 423 910 36 400 31 573 35 4
FR Revin 8 700 000 233 720 3 600 4 503 6 4
LU Vianden M11 7 200 000 280 1 100 4 675 4 478 4 5
0
5000
10000
15000
20000
25000
30000
35000
0 5000 10000 15000 20000 25000 30000 35000 40000MWh
Correlation between the storage capacity from external sources and from the JRC model
Figure 5: correlation on PHS storage capacity data from external sources and from the JRC model.
Joint Research Centre Assessment of the European potential for PHS
19
2.5.2. Energy storage capacity versus installed electrical capacity
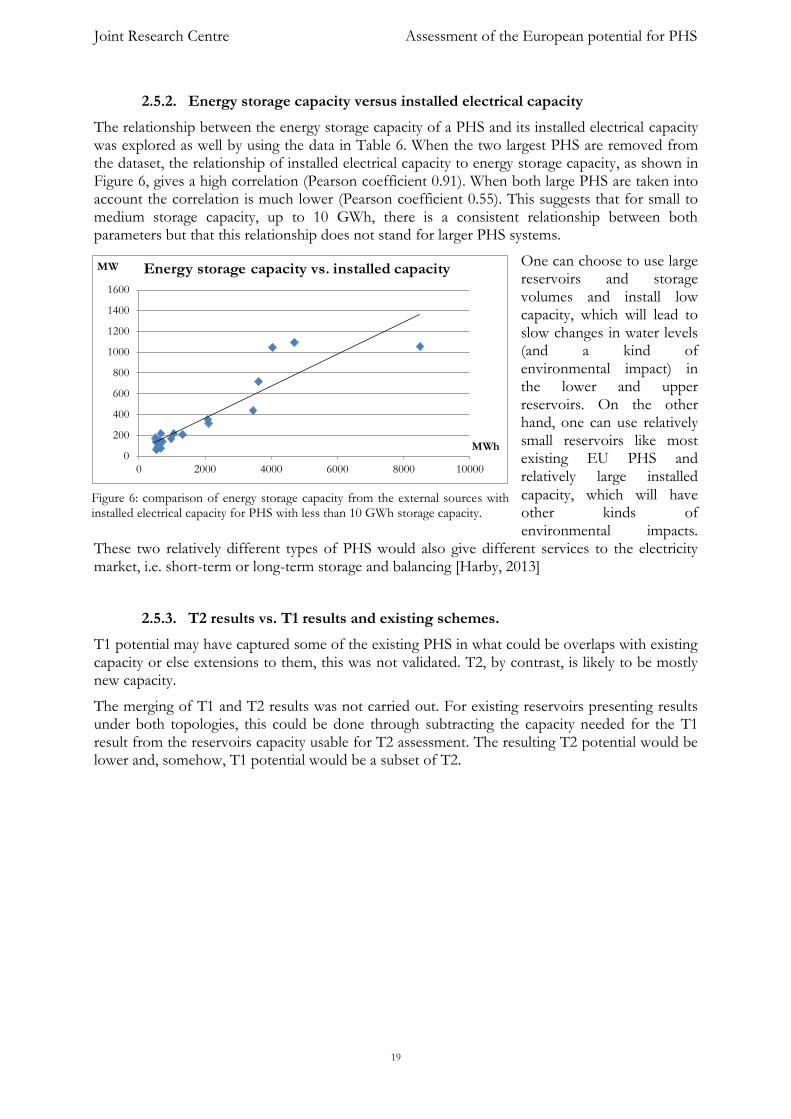
The relationship between the energy storage capacity of a PHS and its installed electrical capacity was explored as well by using the data in Table 6. When the two largest PHS are removed from the dataset, the relationship of installed electrical capacity to energy storage capacity, as shown in Figure 6, gives a high correlation (Pearson coefficient 0.91). When both large PHS are taken into account the correlation is much lower (Pearson coefficient 0.55). This suggests that for small to medium storage capacity, up to 10 GWh, there is a consistent relationship between both parameters but that this relationship does not stand for larger PHS systems.
One can choose to use large reservoirs and storage volumes and install low capacity, which will lead to slow changes in water levels (and a kind of environmental impact) in the lower and upper reservoirs. On the other hand, one can use relatively small reservoirs like most existing EU PHS and relatively large installed
capacity, which will have other kinds of environmental impacts.
These two relatively different types of PHS would also give different services to the electricity market, i.e. short-term or long-term storage and balancing [Harby, 2013]
2.5.3. T2 results vs. T1 results and existing schemes.
T1 potential may have captured some of the existing PHS in what could be overlaps with existing capacity or else extensions to them, this was not validated. T2, by contrast, is likely to be mostly new capacity.
The merging of T1 and T2 results was not carried out. For existing reservoirs presenting results under both topologies, this could be done through subtracting the capacity needed for the T1 result from the reservoirs capacity usable for T2 assessment. The resulting T2 potential would be lower and, somehow, T1 potential would be a subset of T2.
0
200
400
600
800
1000
1200
1400
1600
0 2000 4000 6000 8000 10000
MW
MWh
Energy storage capacity vs. installed capacity
Figure 6: comparison of energy storage capacity from the external sources with installed electrical capacity for PHS with less than 10 GWh storage capacity.
Joint Research Centre Assessment of the European potential for PHS
20
3. RESULTS: THE EUROPEAN PHS POTENTIAL19
3.1. Potential under topology 1
The overall European theoretical potential under topology 1 and a maximum distance of 20 km between the two reservoirs is 54.3 TWh. This figure is reduced to a realisable potential of 28.7 TWh when the constraints described in previous sections are taken into account. The results obtained for this topology are presented in the graphics and tables below, differentiated by scenarios.
3.1.1. T1 theoretical potential
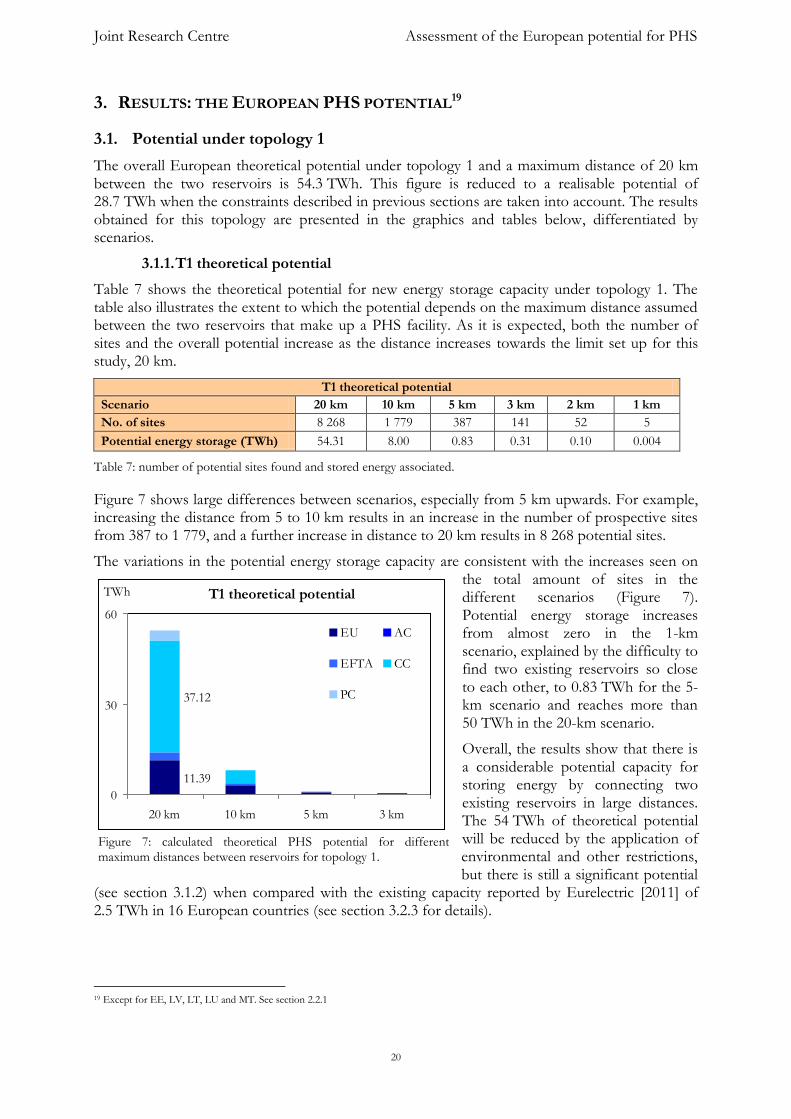
Table 7 shows the theoretical potential for new energy storage capacity under topology 1. The table also illustrates the extent to which the potential depends on the maximum distance assumed between the two reservoirs that make up a PHS facility. As it is expected, both the number of sites and the overall potential increase as the distance increases towards the limit set up for this study, 20 km.
T1 theoretical potential
Scenario 20 km 10 km 5 km 3 km 2 km 1 km
No. of sites 8 268 1 779 387 141 52 5
Potential energy storage (TWh) 54.31 8.00 0.83 0.31 0.10 0.004
Table 7: number of potential sites found and stored energy associated.
Figure 7 shows large differences between scenarios, especially from 5 km upwards. For example, increasing the distance from 5 to 10 km results in an increase in the number of prospective sites from 387 to 1 779, and a further increase in distance to 20 km results in 8 268 potential sites.
The variations in the potential energy storage capacity are consistent with the increases seen on the total amount of sites in the different scenarios (Figure 7). Potential energy storage increases from almost zero in the 1-km scenario, explained by the difficulty to find two existing reservoirs so close to each other, to 0.83 TWh for the 5-km scenario and reaches more than 50 TWh in the 20-km scenario.
Overall, the results show that there is a considerable potential capacity for storing energy by connecting two existing reservoirs in large distances. The 54 TWh of theoretical potential will be reduced by the application of environmental and other restrictions, but there is still a significant potential
(see section 3.1.2) when compared with the existing capacity reported by Eurelectric [2011] of 2.5 TWh in 16 European countries (see section 3.2.3 for details).
19 Except for EE, LV, LT, LU and MT. See section 2.2.1
T1 theoretical potential
11.39
37.12
0
30
60
20 km 10 km 5 km 3 km
TWh
EU AC
EFTA CC
PC
Figure 7: calculated theoretical PHS potential for different maximum distances between reservoirs for topology 1.
Joint Research Centre Assessment of the European potential for PHS
21
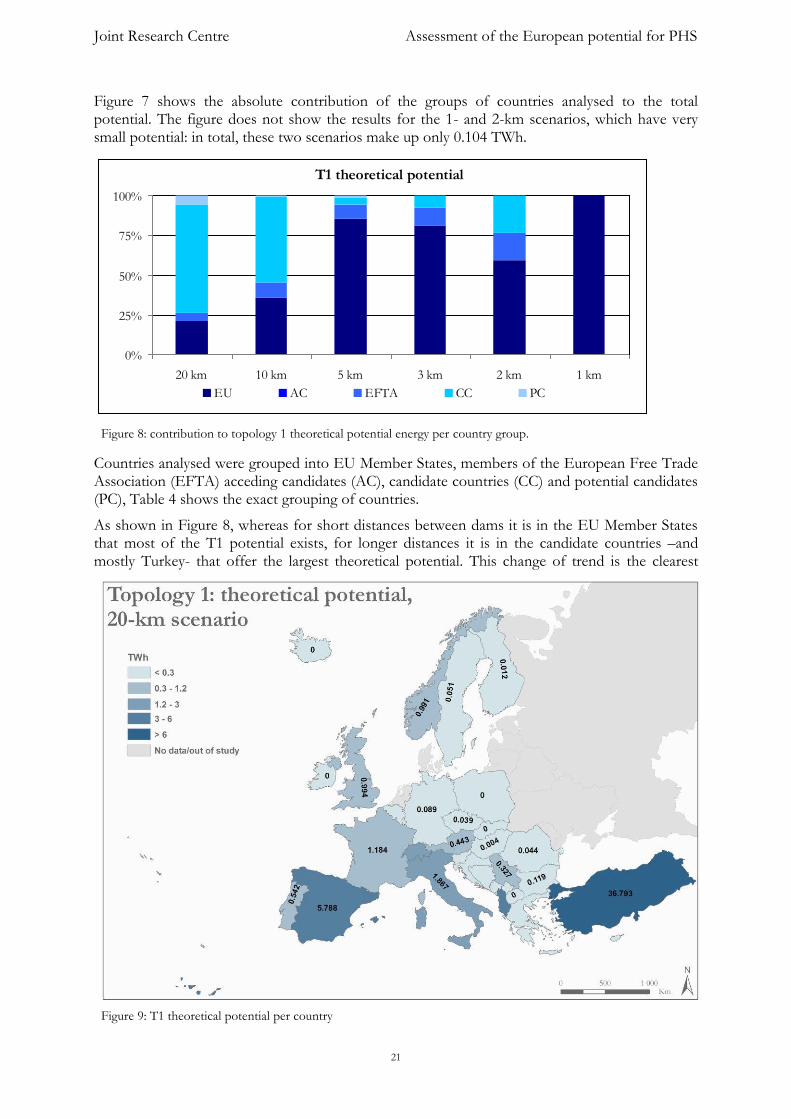
Figure 7 shows the absolute contribution of the groups of countries analysed to the total potential. The figure does not show the results for the 1- and 2-km scenarios, which have very small potential: in total, these two scenarios make up only 0.104 TWh.
Countries analysed were grouped into EU Member States, members of the European Free Trade Association (EFTA) acceding candidates (AC), candidate countries (CC) and potential candidates (PC), Table 4 shows the exact grouping of countries.
As shown in Figure 8, whereas for short distances between dams it is in the EU Member States that most of the T1 potential exists, for longer distances it is in the candidate countries –and mostly Turkey- that offer the largest theoretical potential. This change of trend is the clearest
T1 theoretical potential
0%
25%
50%
75%
100%
20 km 10 km 5 km 3 km 2 km 1 km
EU AC EFTA CC PC
Figure 8: contribution to topology 1 theoretical potential energy per country group.
Figure 9: T1 theoretical potential per country
Joint Research Centre Assessment of the European potential for PHS
22
between 5 and 10 km: whereas at 5 km 85% of the potential is in the EU and only 4% in candidate countries, at 10 km 54% of the potential (4.32 TWh) is in candidate countries and 36% in the EU (2.87 TWh). At 20 km the potential in candidate countries reaches 37 TWh (overwhelmingly in Turkey), well above the potential in the EU in second position with less than 25% (11.4 TWh), then potential candidates, (3.1 TWh) and countries from EFTA (2.65 TWh).
Figure 9 shows the country potential within a maximum of 20 km between existing reservoirs. At a first sight the most surprising item is the relatively low potential of Norway, the country which possesses by far the highest hydropower installed capacity in Europe, 30 GW. There are two main causes for this: a gap in the reservoir data available (see section 2.2.2), and the large distance between reservoirs in that country. After Turkey, Spain, Italy, United Kingdom, France, Switzerland, and Albania are the next countries with high T1 theoretical potential, details are given in Table 13 in section 3.4 below.
As for the other scenarios, Figure 8 shows that in the 1-km scenario only the EU country group is contributing. The EU also contributes most to the 2-km scenario with more than 50%; candidate countries, having more than 25% of the total amount; and EFTA members follow.
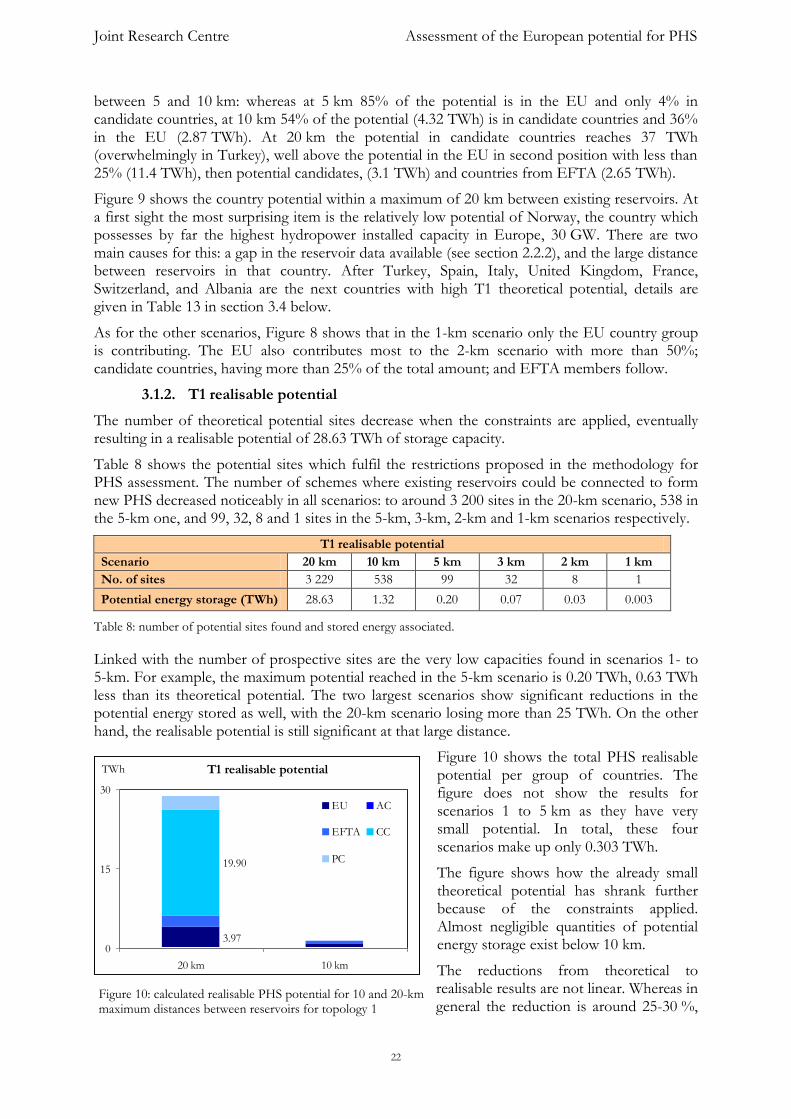
3.1.2. T1 realisable potential
The number of theoretical potential sites decrease when the constraints are applied, eventually resulting in a realisable potential of 28.63 TWh of storage capacity.
Table 8 shows the potential sites which fulfil the restrictions proposed in the methodology for PHS assessment. The number of schemes where existing reservoirs could be connected to form new PHS decreased noticeably in all scenarios: to around 3 200 sites in the 20-km scenario, 538 in the 5-km one, and 99, 32, 8 and 1 sites in the 5-km, 3-km, 2-km and 1-km scenarios respectively.
T1 realisable potential
Scenario 20 km 10 km 5 km 3 km 2 km 1 km
No. of sites 3 229 538 99 32 8 1
Potential energy storage (TWh) 28.63 1.32 0.20 0.07 0.03 0.003
Table 8: number of potential sites found and stored energy associated.
Linked with the number of prospective sites are the very low capacities found in scenarios 1- to 5-km. For example, the maximum potential reached in the 5-km scenario is 0.20 TWh, 0.63 TWh less than its theoretical potential. The two largest scenarios show significant reductions in the potential energy stored as well, with the 20-km scenario losing more than 25 TWh. On the other hand, the realisable potential is still significant at that large distance.
Figure 10 shows the total PHS realisable potential per group of countries. The figure does not show the results for scenarios 1 to 5 km as they have very small potential. In total, these four scenarios make up only 0.303 TWh.
The figure shows how the already small theoretical potential has shrank further because of the constraints applied. Almost negligible quantities of potential energy storage exist below 10 km.
The reductions from theoretical to realisable results are not linear. Whereas in general the reduction is around 25-30 %,
T1 realisable potential
3.97
19.90
0
15
30
20 km 10 km
TWh
EU AC
EFTA CC
PC
Figure 10: calculated realisable PHS potential for 10 and 20-km maximum distances between reservoirs for topology 1
Joint Research Centre Assessment of the European potential for PHS
23
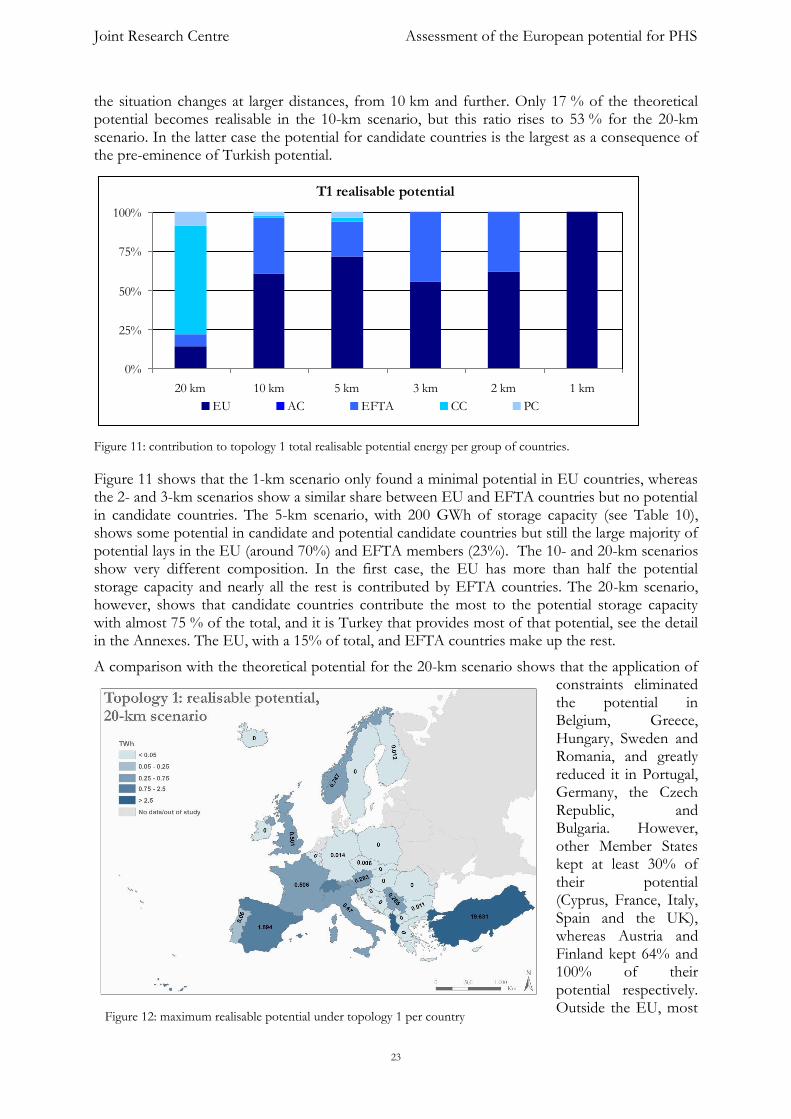
the situation changes at larger distances, from 10 km and further. Only 17 % of the theoretical potential becomes realisable in the 10-km scenario, but this ratio rises to 53 % for the 20-km scenario. In the latter case the potential for candidate countries is the largest as a consequence of the pre-eminence of Turkish potential.
Figure 11: contribution to topology 1 total realisable potential energy per group of countries.
Figure 11 shows that the 1-km scenario only found a minimal potential in EU countries, whereas the 2- and 3-km scenarios show a similar share between EU and EFTA countries but no potential in candidate countries. The 5-km scenario, with 200 GWh of storage capacity (see Table 10), shows some potential in candidate and potential candidate countries but still the large majority of potential lays in the EU (around 70%) and EFTA members (23%). The 10- and 20-km scenarios show very different composition. In the first case, the EU has more than half the potential storage capacity and nearly all the rest is contributed by EFTA countries. The 20-km scenario, however, shows that candidate countries contribute the most to the potential storage capacity with almost 75 % of the total, and it is Turkey that provides most of that potential, see the detail in the Annexes. The EU, with a 15% of total, and EFTA countries make up the rest.
A comparison with the theoretical potential for the 20-km scenario shows that the application of constraints eliminated the potential in Belgium, Greece, Hungary, Sweden and Romania, and greatly reduced it in Portugal, Germany, the Czech Republic, and Bulgaria. However, other Member States kept at least 30% of their potential (Cyprus, France, Italy, Spain and the UK), whereas Austria and Finland kept 64% and 100% of their potential respectively. Outside the EU, most
T1 realisable potential
0%
25%
50%
75%
100%
20 km 10 km 5 km 3 km 2 km 1 km
EU AC EFTA CC PC
Figure 12: maximum realisable potential under topology 1 per country
Joint Research Centre Assessment of the European potential for PHS
24
countries with significant theoretical potential (Norway, Switzerland, Albania and Turkey) kept a good part of it throughout the filtering process.
As it is the case for the theoretical potential, Spain, France, Italy and the United Kingdom provide the highest contributors to the total realisable potential in the EU, and Switzerland, Albania and specially Turkey, which has the higher potential, are the best contributors outside the EU. This is shown in Table 13 in section 3.4 below. It has to be noted the issue of the lack of full reservoir data from Norway, see section 2.2.2.
3.2. Potential under topology 2
Topology 2 presents significantly higher potential than topology 1, both theoretical and realisable, and a more balanced spread among groups of countries and among scenarios. The overall European theoretical potential under topology 2 and a maximum of 20 km between the existing and the best site for a prospective reservoir is 123 TWh. This figure is reduced to realisable potential of 80 TWh when constraints are taken into account.
In general, increasing the distance of search (following the scenarios) for any given existing reservoir resulted in a “best site” with increasing potential and thus the best site found for one given scenario was superseded by that one found in the next scenario. Table 9 shows the potential “best site” found for the Chandreja reservoir in Spain at the different scenarios
Scenario 20 km 10 km 5 km 3 km 2 km 1 km
Head (m) 435 266 263 203 220 167
Surface available (m2) 1 053 425 443 186 253 211 223 003 161 546 89 392
Potential energy storage (GWh) 22.90 5.89 3.33 2.26 1.78 0.75
Table 9: different "best sites" for a second reservoir and corresponding head and prospective energy storage for the Chandreja reservoir in Spain.
The table shows the key elements of the prospective PHS: the head regarding the prospective site for a second reservoir, the surface available for this second reservoir and the storage potential of the new PHS, which assumes a second-reservoir depth of 20 metres.
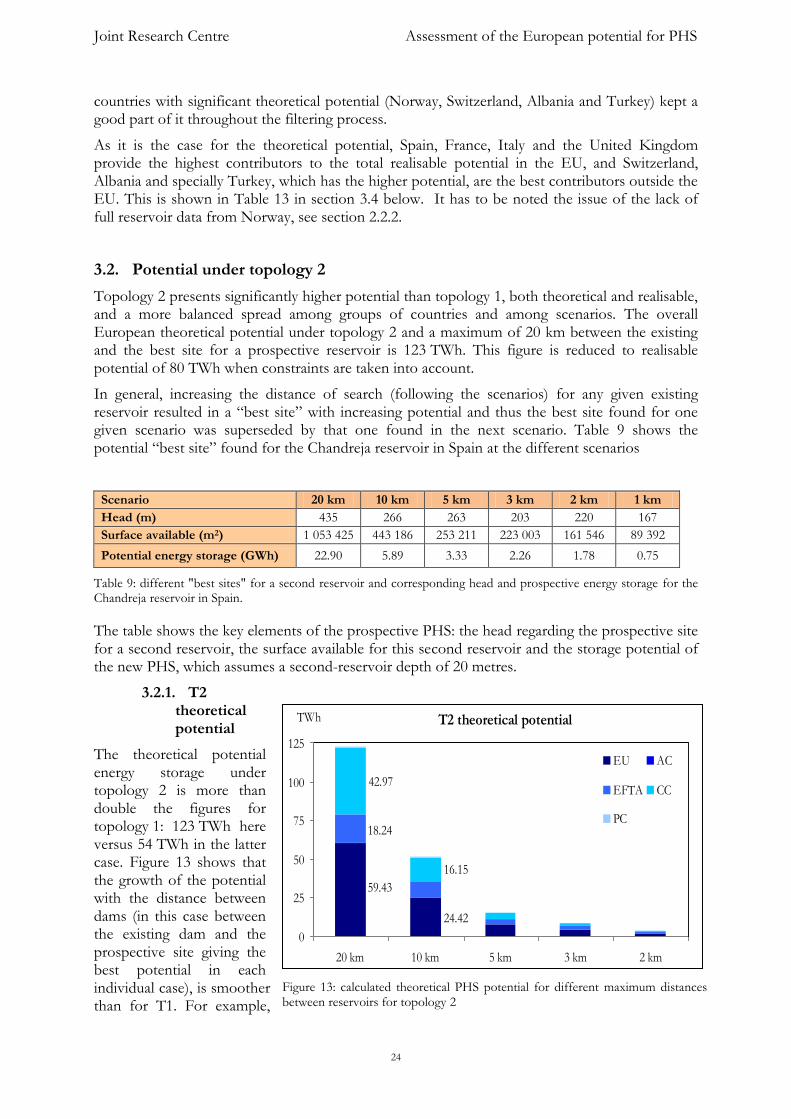
3.2.1. T2 theoretical potential
The theoretical potential energy storage under topology 2 is more than double the figures for topology 1: 123 TWh here versus 54 TWh in the latter case. Figure 13 shows that the growth of the potential with the distance between dams (in this case between the existing dam and the prospective site giving the best potential in each individual case), is smoother than for T1. For example,
T2 theoretical potential
24.42
59.43
18.24
16.15
42.97
0
25
50
75
100
125
20 km 10 km 5 km 3 km 2 km
TWh
EU AC
EFTA CC
PC
Figure 13: calculated theoretical PHS potential for different maximum distances between reservoirs for topology 2
Joint Research Centre Assessment of the European potential for PHS
25
the 20-km scenario under T1 offers nearly seven times the potential under the 10-km scenario there, whereas for T2 the 20-km scenario offers only 2.5 times the potential under the 10-km scenario. The same order the magnitude is found when comparing the 10-km and the 5-km scenarios in each case: nearly ten times for T1 versus only three times for T2.
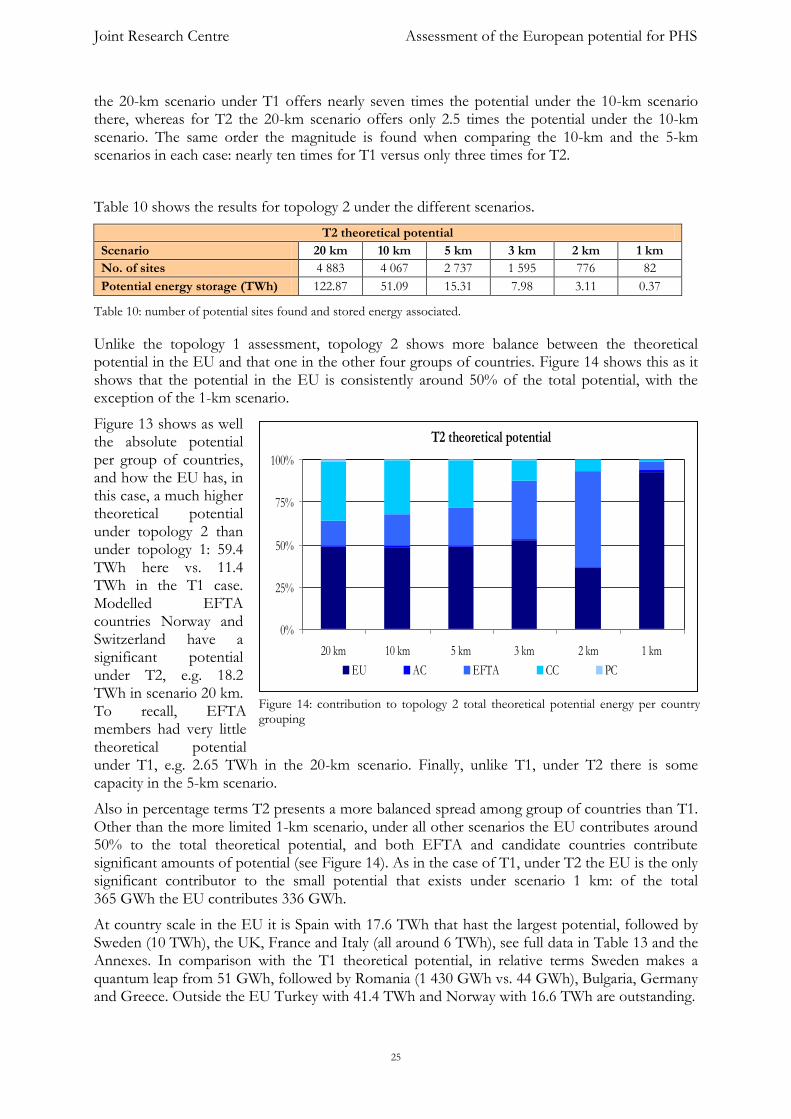
Table 10 shows the results for topology 2 under the different scenarios.
T2 theoretical potential
Scenario 20 km 10 km 5 km 3 km 2 km 1 km
No. of sites 4 883 4 067 2 737 1 595 776 82
Potential energy storage (TWh) 122.87 51.09 15.31 7.98 3.11 0.37
Table 10: number of potential sites found and stored energy associated.
Unlike the topology 1 assessment, topology 2 shows more balance between the theoretical potential in the EU and that one in the other four groups of countries. Figure 14 shows this as it shows that the potential in the EU is consistently around 50% of the total potential, with the exception of the 1-km scenario.
Figure 13 shows as well the absolute potential per group of countries, and how the EU has, in this case, a much higher theoretical potential under topology 2 than under topology 1: 59.4 TWh here vs. 11.4 TWh in the T1 case. Modelled EFTA countries Norway and Switzerland have a significant potential under T2, e.g. 18.2 TWh in scenario 20 km. To recall, EFTA members had very little theoretical potential under T1, e.g. 2.65 TWh in the 20-km scenario. Finally, unlike T1, under T2 there is some capacity in the 5-km scenario.
Also in percentage terms T2 presents a more balanced spread among group of countries than T1. Other than the more limited 1-km scenario, under all other scenarios the EU contributes around 50% to the total theoretical potential, and both EFTA and candidate countries contribute significant amounts of potential (see Figure 14). As in the case of T1, under T2 the EU is the only significant contributor to the small potential that exists under scenario 1 km: of the total 365 GWh the EU contributes 336 GWh.
At country scale in the EU it is Spain with 17.6 TWh that hast the largest potential, followed by Sweden (10 TWh), the UK, France and Italy (all around 6 TWh), see full data in Table 13 and the Annexes. In comparison with the T1 theoretical potential, in relative terms Sweden makes a quantum leap from 51 GWh, followed by Romania (1 430 GWh vs. 44 GWh), Bulgaria, Germany and Greece. Outside the EU Turkey with 41.4 TWh and Norway with 16.6 TWh are outstanding.
T2 theoretical potential
0%
25%
50%
75%
100%
20 km 10 km 5 km 3 km 2 km 1 km
EU AC EFTA CC PC
Figure 14: contribution to topology 2 total theoretical potential energy per country grouping
Joint Research Centre Assessment of the European potential for PHS
26
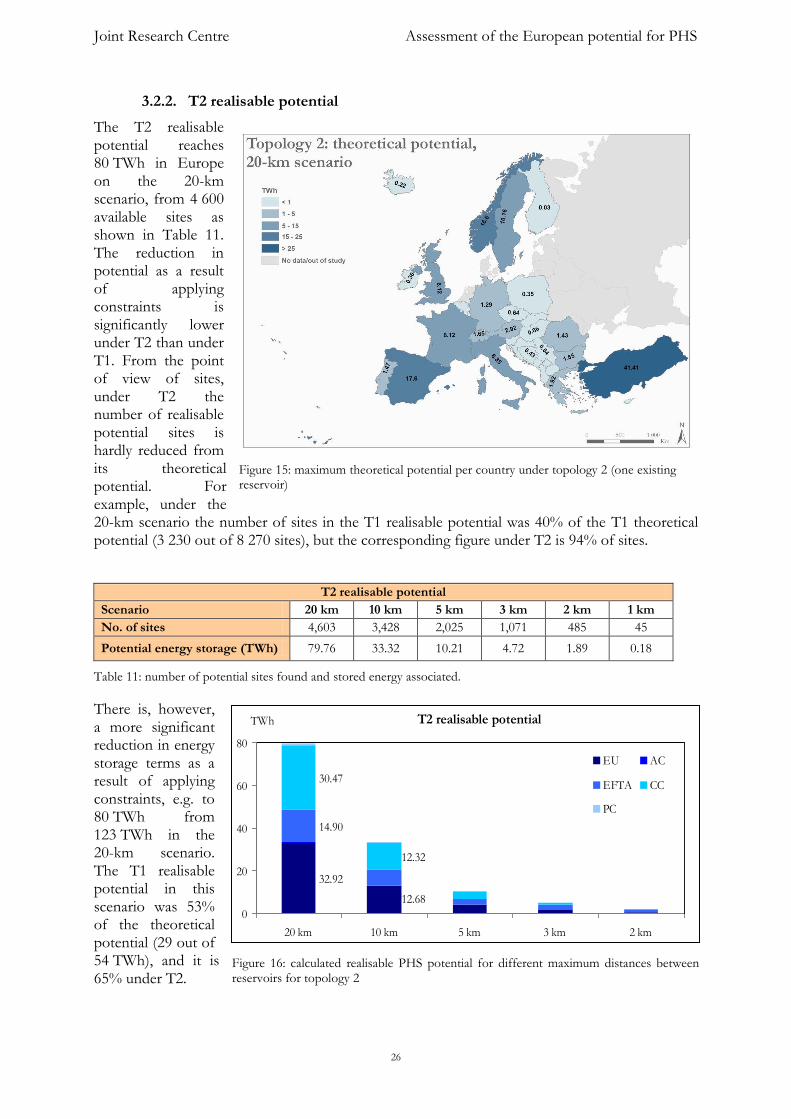
3.2.2. T2 realisable potential
The T2 realisable potential reaches 80 TWh in Europe on the 20-km scenario, from 4 600 available sites as shown in Table 11. The reduction in potential as a result of applying constraints is significantly lower under T2 than under T1. From the point of view of sites, under T2 the number of realisable potential sites is hardly reduced from its theoretical potential. For example, under the 20-km scenario the number of sites in the T1 realisable potential was 40% of the T1 theoretical potential (3 230 out of 8 270 sites), but the corresponding figure under T2 is 94% of sites.
T2 realisable potential
Scenario 20 km 10 km 5 km 3 km 2 km 1 km
No. of sites 4,603 3,428 2,025 1,071 485 45
Potential energy storage (TWh) 79.76 33.32 10.21 4.72 1.89 0.18
Table 11: number of potential sites found and stored energy associated.
There is, however, a more significant reduction in energy storage terms as a result of applying constraints, e.g. to 80 TWh from 123 TWh in the 20-km scenario. The T1 realisable potential in this scenario was 53% of the theoretical potential (29 out of 54 TWh), and it is 65% under T2.
T2 realisable potential
12.68
32.92
14.90
12.32
30.47
0
20
40
60
80
20 km 10 km 5 km 3 km 2 km
TWh
EU AC
EFTA CC
PC
Figure 15: maximum theoretical potential per country under topology 2 (one existing reservoir)
Figure 16: calculated realisable PHS potential for different maximum distances between reservoirs for topology 2
Joint Research Centre Assessment of the European potential for PHS
27
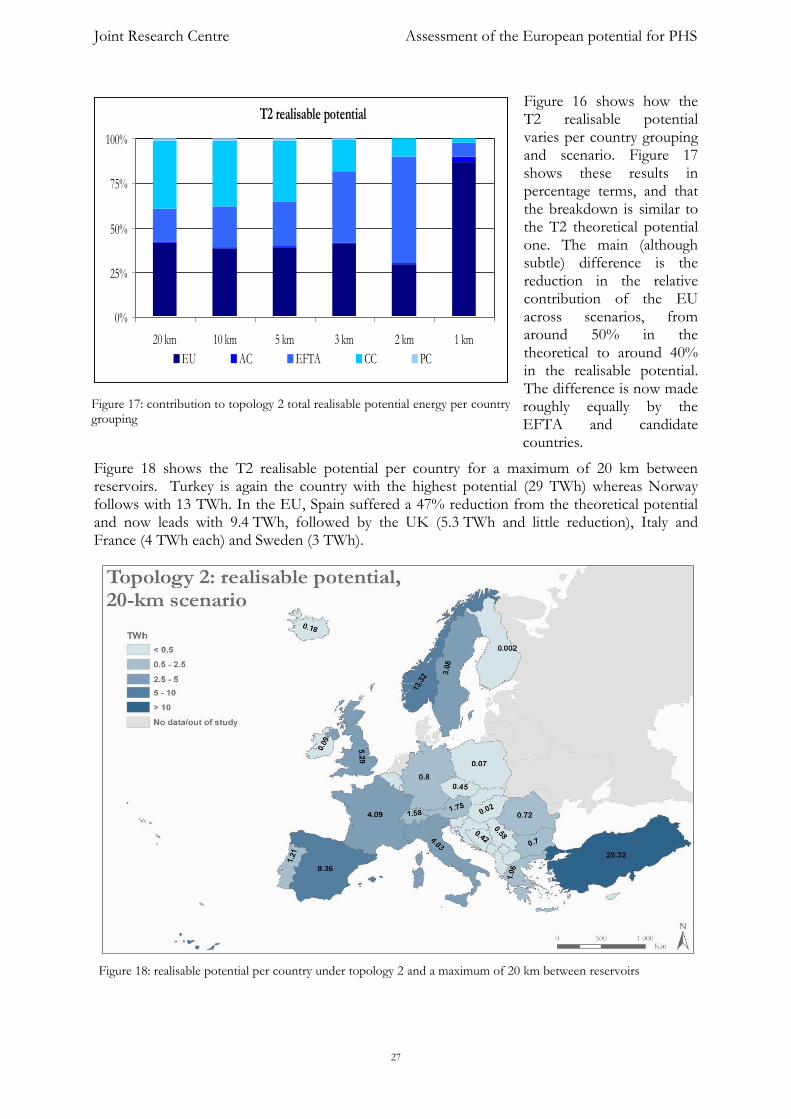
Figure 16 shows how the T2 realisable potential varies per country grouping and scenario. Figure 17 shows these results in percentage terms, and that the breakdown is similar to the T2 theoretical potential one. The main (although subtle) difference is the reduction in the relative contribution of the EU across scenarios, from around 50% in the theoretical to around 40% in the realisable potential. The difference is now made roughly equally by the EFTA and candidate countries.
Figure 18 shows the T2 realisable potential per country for a maximum of 20 km between reservoirs. Turkey is again the country with the highest potential (29 TWh) whereas Norway follows with 13 TWh. In the EU, Spain suffered a 47% reduction from the theoretical potential and now leads with 9.4 TWh, followed by the UK (5.3 TWh and little reduction), Italy and France (4 TWh each) and Sweden (3 TWh).
T2 realisable potential
0%
25%
50%
75%
100%
20 km 10 km 5 km 3 km 2 km 1 km
EU AC EFTA CC PC
Figure 17: contribution to topology 2 total realisable potential energy per country grouping
Figure 18: realisable potential per country under topology 2 and a maximum of 20 km between reservoirs
Joint Research Centre Assessment of the European potential for PHS
28
3.2.3. Comparison with the existing capacity
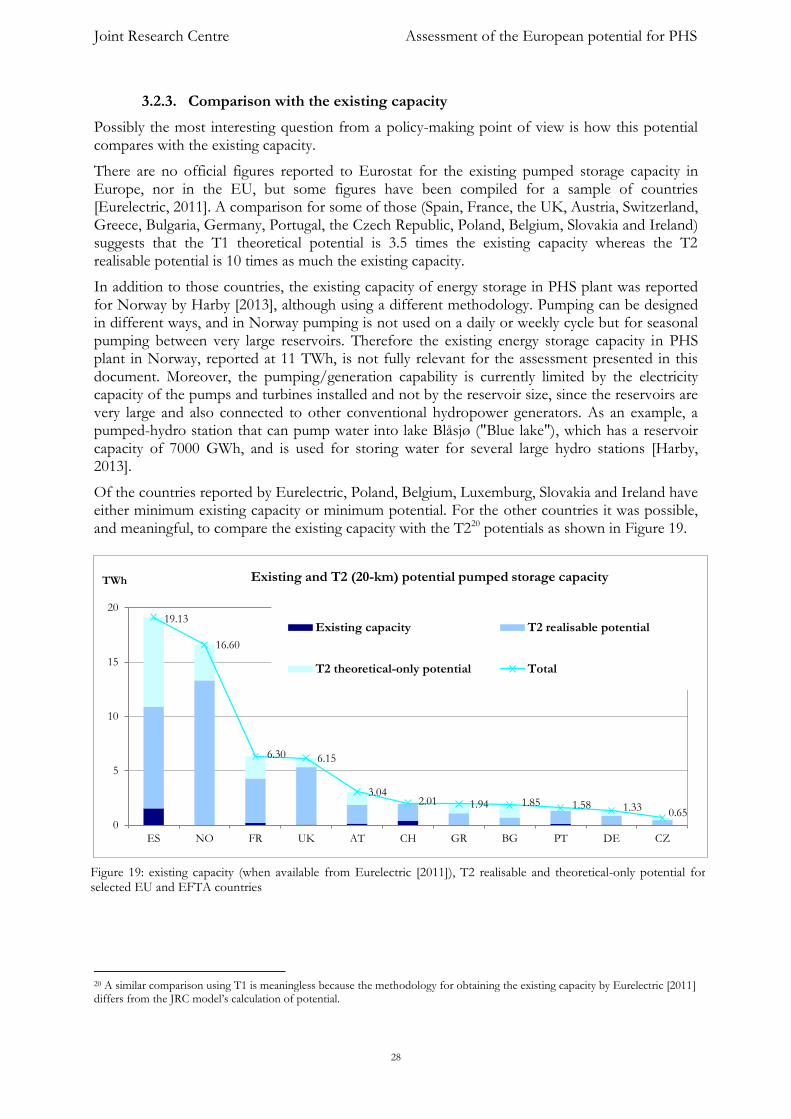
Possibly the most interesting question from a policy-making point of view is how this potential compares with the existing capacity.
There are no official figures reported to Eurostat for the existing pumped storage capacity in Europe, nor in the EU, but some figures have been compiled for a sample of countries [Eurelectric, 2011]. A comparison for some of those (Spain, France, the UK, Austria, Switzerland, Greece, Bulgaria, Germany, Portugal, the Czech Republic, Poland, Belgium, Slovakia and Ireland) suggests that the T1 theoretical potential is 3.5 times the existing capacity whereas the T2 realisable potential is 10 times as much the existing capacity.
In addition to those countries, the existing capacity of energy storage in PHS plant was reported for Norway by Harby [2013], although using a different methodology. Pumping can be designed in different ways, and in Norway pumping is not used on a daily or weekly cycle but for seasonal pumping between very large reservoirs. Therefore the existing energy storage capacity in PHS plant in Norway, reported at 11 TWh, is not fully relevant for the assessment presented in this document. Moreover, the pumping/generation capability is currently limited by the electricity capacity of the pumps and turbines installed and not by the reservoir size, since the reservoirs are very large and also connected to other conventional hydropower generators. As an example, a pumped-hydro station that can pump water into lake Blåsjø ("Blue lake"), which has a reservoir capacity of 7000 GWh, and is used for storing water for several large hydro stations [Harby, 2013].
Of the countries reported by Eurelectric, Poland, Belgium, Luxemburg, Slovakia and Ireland have either minimum existing capacity or minimum potential. For the other countries it was possible, and meaningful, to compare the existing capacity with the T220 potentials as shown in Figure 19.
20 A similar comparison using T1 is meaningless because the methodology for obtaining the existing capacity by Eurelectric [2011] differs from the JRC model’s calculation of potential.
19.13
16.60
6.30 6.15
3.042.01 1.94 1.85 1.58 1.33
0.650
5
10
15
20
ES NO FR UK AT CH GR BG PT DE CZ
TWh Existing and T2 (20-km) potential pumped storage capacity
Existing capacity T2 realisable potential
T2 theoretical-only potential Total
Figure 19: existing capacity (when available from Eurelectric [2011]), T2 realisable and theoretical-only potential for selected EU and EFTA countries

Joint Research Centre Assessment of the European potential for PHS
29
Considering only the sum of existing plus realisable potential, most of the potential is in four countries: Norway, Spain, France and the UK. These are followed by Sweden (no reported existing capacity), Austria, Switzerland and Portugal.
3.3. Summary of potentials
Table 12 allows a quick overview of potentials by showing both theoretical and realisable potentials under both topologies and the six scenarios21.
Potential storage (TWh) per scenario
Topology 20 km 10 km 5 km 3 km 2 km 1 km
T1 theoretical 54.31 8.00 0.83 0.31 0.10 0.004
T1 realisable 28.63 1.32 0.20 0.07 0.03 0.003
T2 theoretical 122.87 51.09 15.31 7.98 3.11 0.37
T2 realisable 79.76 33.32 10.21 4.72 1.89 0.18
Table 12: summary of potentials under the different scenarios and topologies
21 The seventh scenario, the 50-m head and 5-km distance between reservoirs, only applies to T2 and it is, anyway, aimed at sensitivity analysis and not a general scenario.
Joint Research Centre Assessment of the European potential for PHS
30
3.4. Results per country
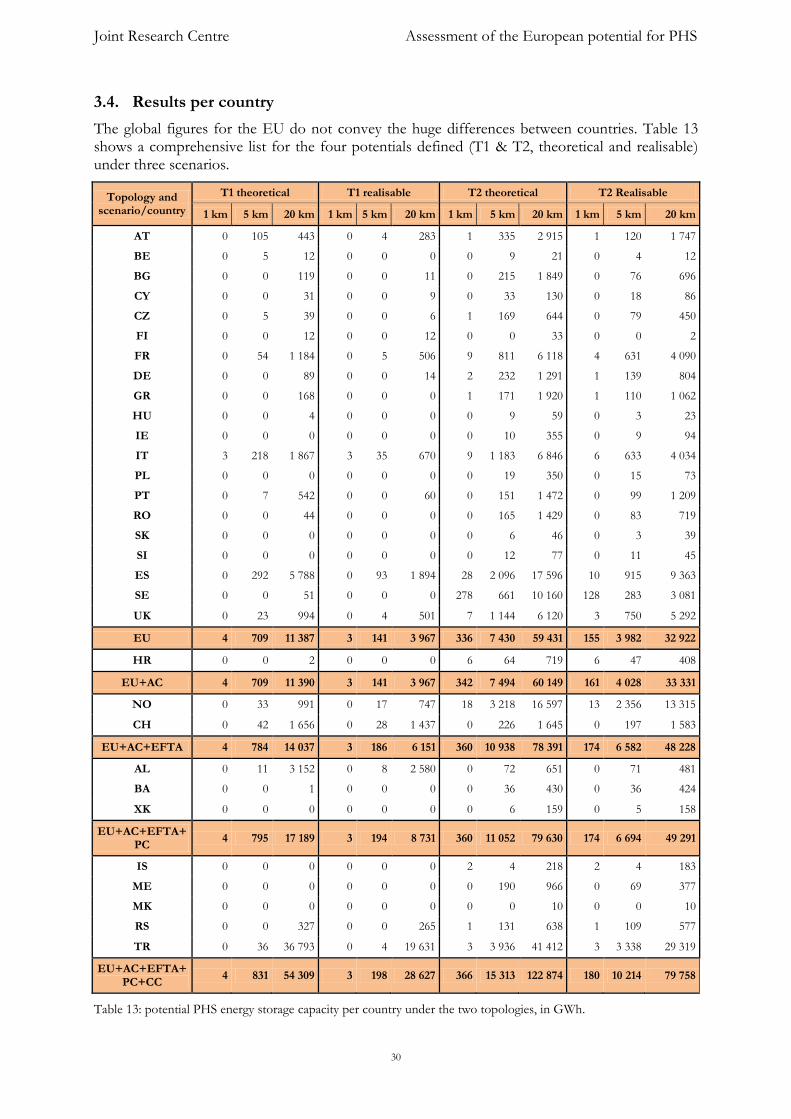
The global figures for the EU do not convey the huge differences between countries. Table 13 shows a comprehensive list for the four potentials defined (T1 & T2, theoretical and realisable) under three scenarios.
Topology and scenario/country
T1 theoretical T1 realisable T2 theoretical T2 Realisable
1 km 5 km 20 km 1 km 5 km 20 km 1 km 5 km 20 km 1 km 5 km 20 km
AT 0 105 443 0 4 283 1 335 2 915 1 120 1 747
BE 0 5 12 0 0 0 0 9 21 0 4 12
BG 0 0 119 0 0 11 0 215 1 849 0 76 696
CY 0 0 31 0 0 9 0 33 130 0 18 86
CZ 0 5 39 0 0 6 1 169 644 0 79 450
FI 0 0 12 0 0 12 0 0 33 0 0 2
FR 0 54 1 184 0 5 506 9 811 6 118 4 631 4 090
DE 0 0 89 0 0 14 2 232 1 291 1 139 804
GR 0 0 168 0 0 0 1 171 1 920 1 110 1 062
HU 0 0 4 0 0 0 0 9 59 0 3 23
IE 0 0 0 0 0 0 0 10 355 0 9 94
IT 3 218 1 867 3 35 670 9 1 183 6 846 6 633 4 034
PL 0 0 0 0 0 0 0 19 350 0 15 73
PT 0 7 542 0 0 60 0 151 1 472 0 99 1 209
RO 0 0 44 0 0 0 0 165 1 429 0 83 719
SK 0 0 0 0 0 0 0 6 46 0 3 39
SI 0 0 0 0 0 0 0 12 77 0 11 45
ES 0 292 5 788 0 93 1 894 28 2 096 17 596 10 915 9 363
SE 0 0 51 0 0 0 278 661 10 160 128 283 3 081
UK 0 23 994 0 4 501 7 1 144 6 120 3 750 5 292
EU 4 709 11 387 3 141 3 967 336 7 430 59 431 155 3 982 32 922
HR 0 0 2 0 0 0 6 64 719 6 47 408
EU+AC 4 709 11 390 3 141 3 967 342 7 494 60 149 161 4 028 33 331
NO 0 33 991 0 17 747 18 3 218 16 597 13 2 356 13 315
CH 0 42 1 656 0 28 1 437 0 226 1 645 0 197 1 583
EU+AC+EFTA 4 784 14 037 3 186 6 151 360 10 938 78 391 174 6 582 48 228
AL 0 11 3 152 0 8 2 580 0 72 651 0 71 481
BA 0 0 1 0 0 0 0 36 430 0 36 424
XK 0 0 0 0 0 0 0 6 159 0 5 158
EU+AC+EFTA+PC
4 795 17 189 3 194 8 731 360 11 052 79 630 174 6 694 49 291
IS 0 0 0 0 0 0 2 4 218 2 4 183
ME 0 0 0 0 0 0 0 190 966 0 69 377
MK 0 0 0 0 0 0 0 0 10 0 0 10
RS 0 0 327 0 0 265 1 131 638 1 109 577
TR 0 36 36 793 0 4 19 631 3 3 936 41 412 3 3 338 29 319
EU+AC+EFTA+PC+CC
4 831 54 309 3 198 28 627 366 15 313 122 874 180 10 214 79 758
Table 13: potential PHS energy storage capacity per country under the two topologies, in GWh.
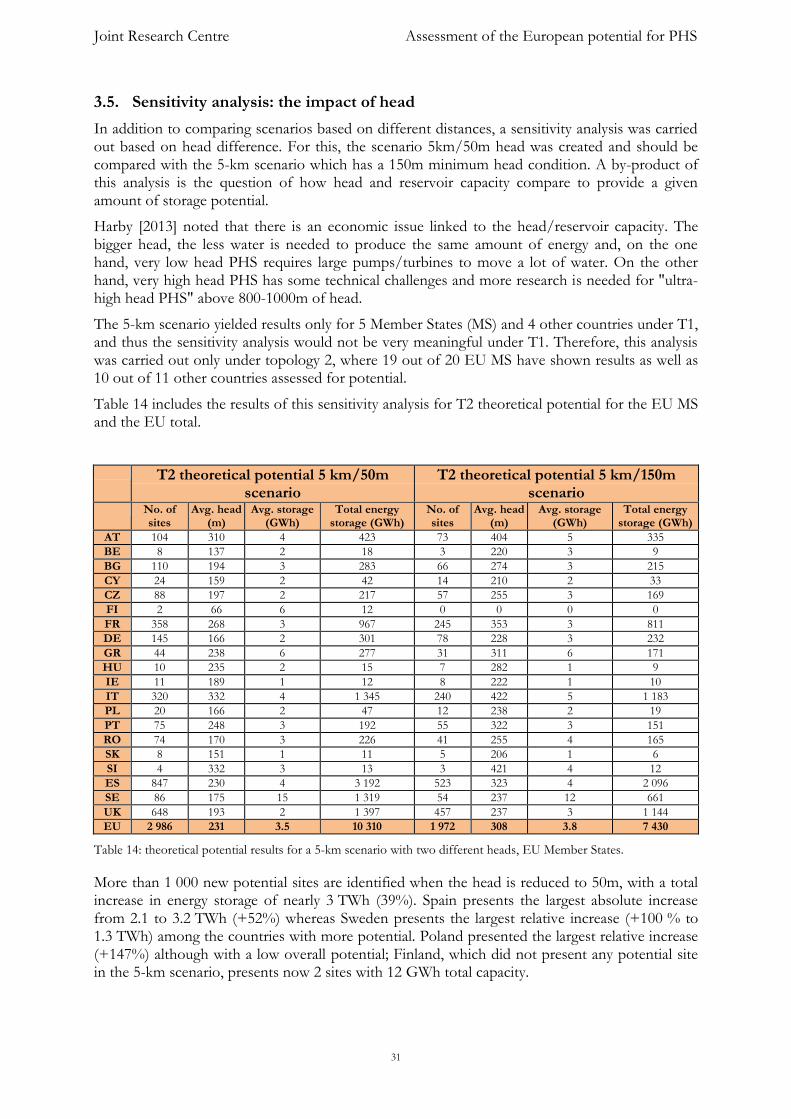
Joint Research Centre Assessment of the European potential for PHS
31
3.5. Sensitivity analysis: the impact of head
In addition to comparing scenarios based on different distances, a sensitivity analysis was carried out based on head difference. For this, the scenario 5km/50m head was created and should be compared with the 5-km scenario which has a 150m minimum head condition. A by-product of this analysis is the question of how head and reservoir capacity compare to provide a given amount of storage potential.
Harby [2013] noted that there is an economic issue linked to the head/reservoir capacity. The bigger head, the less water is needed to produce the same amount of energy and, on the one hand, very low head PHS requires large pumps/turbines to move a lot of water. On the other hand, very high head PHS has some technical challenges and more research is needed for "ultra-high head PHS" above 800-1000m of head.
The 5-km scenario yielded results only for 5 Member States (MS) and 4 other countries under T1, and thus the sensitivity analysis would not be very meaningful under T1. Therefore, this analysis was carried out only under topology 2, where 19 out of 20 EU MS have shown results as well as 10 out of 11 other countries assessed for potential.
Table 14 includes the results of this sensitivity analysis for T2 theoretical potential for the EU MS and the EU total.
T2 theoretical potential 5 km/50m scenario
T2 theoretical potential 5 km/150m scenario
No. of sites
Avg. head (m)
Avg. storage (GWh)
Total energy storage (GWh)
No. of sites
Avg. head (m)
Avg. storage (GWh)
Total energy storage (GWh)
AT 104 310 4 423 73 404 5 335
BE 8 137 2 18 3 220 3 9
BG 110 194 3 283 66 274 3 215
CY 24 159 2 42 14 210 2 33
CZ 88 197 2 217 57 255 3 169
FI 2 66 6 12 0 0 0 0
FR 358 268 3 967 245 353 3 811
DE 145 166 2 301 78 228 3 232
GR 44 238 6 277 31 311 6 171
HU 10 235 2 15 7 282 1 9
IE 11 189 1 12 8 222 1 10
IT 320 332 4 1 345 240 422 5 1 183
PL 20 166 2 47 12 238 2 19
PT 75 248 3 192 55 322 3 151
RO 74 170 3 226 41 255 4 165
SK 8 151 1 11 5 206 1 6
SI 4 332 3 13 3 421 4 12
ES 847 230 4 3 192 523 323 4 2 096
SE 86 175 15 1 319 54 237 12 661
UK 648 193 2 1 397 457 237 3 1 144
EU 2 986 231 3.5 10 310 1 972 308 3.8 7 430
Table 14: theoretical potential results for a 5-km scenario with two different heads, EU Member States.
More than 1 000 new potential sites are identified when the head is reduced to 50m, with a total increase in energy storage of nearly 3 TWh (39%). Spain presents the largest absolute increase from 2.1 to 3.2 TWh (+52%) whereas Sweden presents the largest relative increase (+100 % to 1.3 TWh) among the countries with more potential. Poland presented the largest relative increase (+147%) although with a low overall potential; Finland, which did not present any potential site in the 5-km scenario, presents now 2 sites with 12 GWh total capacity.
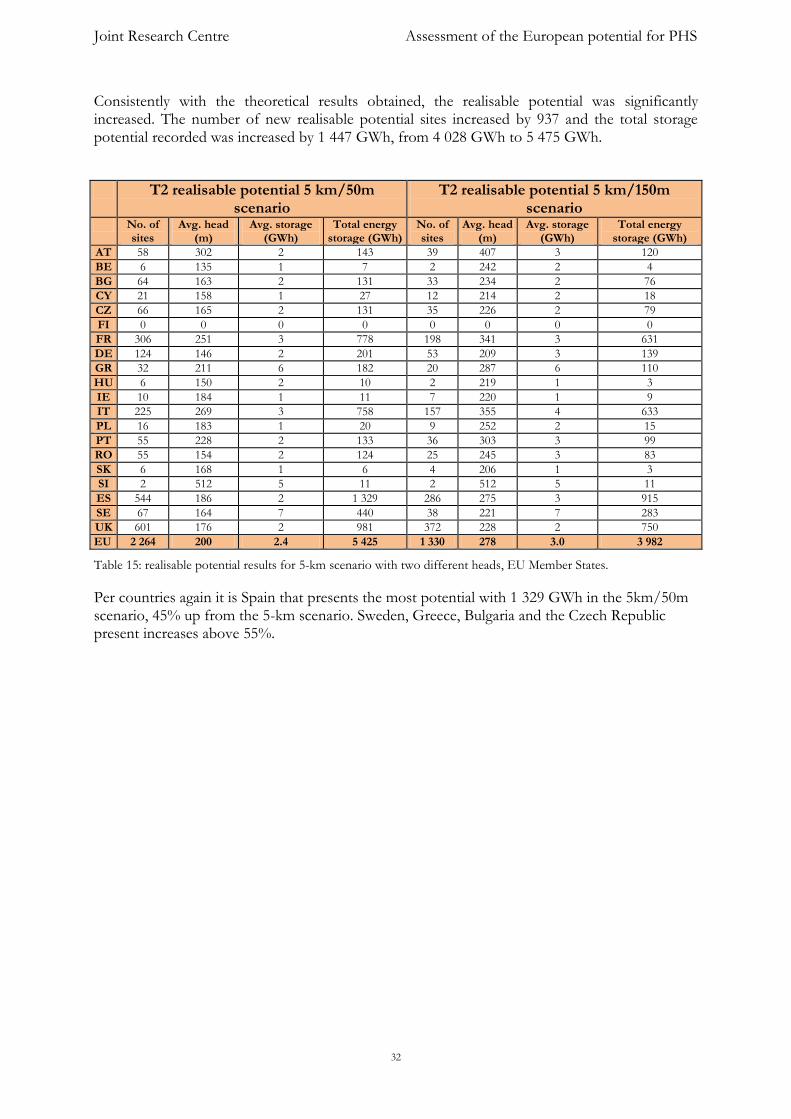
Joint Research Centre Assessment of the European potential for PHS
32
Consistently with the theoretical results obtained, the realisable potential was significantly increased. The number of new realisable potential sites increased by 937 and the total storage potential recorded was increased by 1 447 GWh, from 4 028 GWh to 5 475 GWh.
T2 realisable potential 5 km/50m scenario
T2 realisable potential 5 km/150m scenario
No. of sites
Avg. head (m)
Avg. storage (GWh)
Total energy storage (GWh)
No. of sites
Avg. head (m)
Avg. storage (GWh)
Total energy storage (GWh)
AT 58 302 2 143 39 407 3 120
BE 6 135 1 7 2 242 2 4
BG 64 163 2 131 33 234 2 76
CY 21 158 1 27 12 214 2 18
CZ 66 165 2 131 35 226 2 79
FI 0 0 0 0 0 0 0 0
FR 306 251 3 778 198 341 3 631
DE 124 146 2 201 53 209 3 139
GR 32 211 6 182 20 287 6 110
HU 6 150 2 10 2 219 1 3
IE 10 184 1 11 7 220 1 9
IT 225 269 3 758 157 355 4 633
PL 16 183 1 20 9 252 2 15
PT 55 228 2 133 36 303 3 99
RO 55 154 2 124 25 245 3 83
SK 6 168 1 6 4 206 1 3
SI 2 512 5 11 2 512 5 11
ES 544 186 2 1 329 286 275 3 915
SE 67 164 7 440 38 221 7 283
UK 601 176 2 981 372 228 2 750
EU 2 264 200 2.4 5 425 1 330 278 3.0 3 982
Table 15: realisable potential results for 5-km scenario with two different heads, EU Member States.
Per countries again it is Spain that presents the most potential with 1 329 GWh in the 5km/50m scenario, 45% up from the 5-km scenario. Sweden, Greece, Bulgaria and the Czech Republic present increases above 55%.
Joint Research Centre Assessment of the European potential for PHS
33
4. CONCLUSIONS AND RECOMMENDATIONS
4.1. Conclusions
This assessment, for the first time in scientific/technical literature, estimates the potential for pumped storage capacity in Europe under the assumptions and topologies considered. This work does not attempt to assess the related potential electricity installed capacity, it only makes a suggestion, in section 2.5.2, on a procedure to match both parameters.
In the cases where a PHS can be built based on linking two existing reservoirs (topology 1), the European theoretical potential is 54 TWh (11.4 TWh in the EU) when a maximum distance of 20 km between reservoirs is considered. This potential is drastically reduced for lower distances: 0.83 TWh for 5 km, of which 0.71 in the EU, and 4 GWh for 1 km, mostly in Italy. When restrictions on the use of land are applied the theoretical potential is reduced to a realisable potential of 29 TWh in Europe of which 4 TWh in the EU.
When a PHS is built based on one existing reservoir and on a nearby, appropriately non-sloping site for a second existing reservoir, the theoretical potential at a maximum of 20 km reaches 123 TWh in Europe of which 60 TWh in the EU. The corresponding realisable potential is 80 TWh in Europe of which 33 TWh in the EU. For shorter distances between the existing dam and the best potential site the realisable potential is reduced to 10 TWh (5 km, Europe) of which 4 TWh in the EU, and 180 GWh (1 km, Europe), most of which in the EU (155 GWh).
This study has taken due considerations of environmental as well as energy issues. This was one of the reasons why only topologies 1 and 2 were analysed: in neither case there is a need, for example, to close a valley with a dam and thus cause a possible significant disruption to the ecology of the river.
In the choice between theoretical and realisable potentials, it was considered more realistic to take the theoretical potential as best representative for topology 1 and the realisable potential for topology 2. This is because for topology 1 the environmental impact of building a new penstock and powerhouse (the latter is nowadays built underground) can be very small whereas for topology 2 a new dam has to be built and thus the impact of environmental restrictions can be considerable. In addition, the “realisable potential” is based on a set of assumptions about what is somehow politically possible and what is not. The assumptions that building new reservoirs is not possible may for instance not always be the case. Adding new tunnels “under” protected areas may also not be possible in some cases or countries.
Overall it is believed that the order of magnitude of these potentials is correct for Europe as a whole and the EU in particular. Still, this does not preclude that the findings can be fine-tuned and the inclusion in T2 assessment of all the Norwegian reservoirs is an outstanding case. In another example, some discrepancies were detected in the reservoir data from ECRINS when compared with other sources. Similarly, the representation in the model of an existing reservoir as a point instead of as an area reduces the zone explored for a second reservoir site.
This work and its related model could prove useful to the agencies in charge of planning future electricity system development, to authorities in charge of spatial planning and to developers of hydropower schemes.
4.2. Suggestions for future model development
As a result of the experience gained during this work, and of the opinion of external and internal reviewers, the following items are suggested for future improvements:
To improve the database of reservoirs and to take into account a typology of lakes. One option could be to improve ECRINS, e.g. by adding Norwegian reservoirs, and then use its new dataset. Some validation is also possible through the updated GRanD database.
Joint Research Centre Assessment of the European potential for PHS
34
To include existing reservoirs smaller than 100 000 m3 which have hydropower exploitation above 1 MW.
To change the basis on which the model searches for a suitable site from the current “single point” to an area. This would require an update of the reservoir database from points to polygons.
For T1, to extend to the lower reservoir the current assumption that the size of the upper reservoir is what limits the potential energy storage in a new prospective T1.
For each prospective site, to change the ranking of second-reservoir site options to facilitate fine-tuning. The existing ranking is currently automatic and based on energy storage potential, but there are suggestions that prospective second-reservoir sites with higher head and lower prospective storage potential can be preferred to others with slightly higher prospective storage potential.
To include the inflow and outflow rates of other reservoir users or existing power plants to deduce them from the existing reservoir capacity so as to assign existing reservoirs a maximum water volume available for calculating the energy storage capacity of a prospective PHS.
To include maximum and minimum water levels and water level change speeds and to use them to calculate the maximum installed power capacity at each prospective PHS.
To compile DEM and reservoir data of areas across country borders and to model cross-boundary potential.
To explore an alternative for the “flatness” criterion for second reservoir site identification. This could be based on some measure of concavity within the search buffer. This would also be a first step towards estimating costs associated with building the impoundment.
To carry out the assessment of topology 6.
In addition to the environmental protection constraints already taken into account, the maximum water level change rate in reservoirs is regarded as important criterion for environmental impact of PHS in some countries, due to its effect on erosion processes and habitat (e.g. fish stranding) [Zinke, 2013]. An environmental filter could be added to reflect this criterion.
An environmental aspect that has an economic impact is the geology of the area having a potential for dam and reservoir construction, and for the underground penstock. The difference in cost of constructing dams in granite or schist is considerable and in the Mediterranean basin earthquake risks and flash flood occurrence can add up to additional construction constraints and therefore additional costs. Fortunately the available digital data describing these aspects on the subcontinent is considerably and can be taken into account in order to estimate with more precision the future cost of PHS investments.
This issue, costs, could be more developed. For example, it is claimed that for Norway the challenges are not the lack of storage volume but relate more to the total costs and the business model for developing pumped storage hydro, and in particular for increasing turbine capacity. In addition to the costs of building new reservoirs other aspects such as penstock sizing, could be incorporated to the model.
If electricity grid data on the capacity available at each substation can be sourced, the model could be improved to take this capacity into account, although those data might not be public.
It was suggested as well that analyses that would further enrich knowledge include country potential storage versus (a) population density; (b) country surface; (c) solar and wind resources (d) projections of electricity consumption and RES generation by, e.g., 2030. The country potentials could also be compared with country annual rainfall distribution. Furthermore, the main islands not connected to the continent could be analysed separately.
Joint Research Centre Assessment of the European potential for PHS
35
REFERENCES:
Auer, J. and Keil, J. (2012), “State of the art electricity storage systems. Indispensable elements of the energy revolution”. Available at http://www.dbresearch.com/PROD/DBR_INTERNET_EN-PROD/PROD0000000000286166/State-of-the-%20art+electricity+storage+systems%3A+Indispensable+elements+of+the+energy+r%20evolution.pdf . Accessed 10/01/2013.
Andritz Hydro (2010): Recent Developments in Pump Turbines. Presentation at HydroVision 2010, accessed 18/03/2013, available at http://tm-info.no/getfile.php/tm-info.no/Presentasjoner/TM12052011/06_Ole%20Johnny%20Winther%20Andritz.pdf
Council (Council of the European Union), 2012: Council conclusions on Renewable Energy. 3204th TRANSPORT, TELECOMMUNICATIONS and ENERGY Council meeting. Brussels, 3 December 2012. Consulted on 18/03/13. Available at http://www.consilium.europa.eu/uedocs/cms_data/docs/pressdata/en/trans/133950.pdf
Dameffects – http://www.dameffects.org Accessed 11.01.2013
DENA (2008): Untersuchung der elektrizitätswirtschaftlichen und energiepolitischen Auswirkungen der Erhebung von Netznutzungsentgelten für den Speicherstrombezug von Pumpspeicherwerken. Deutsche Energie-Agentur GMBH, Bereich Regenerative Energien, Berlin.
DECC (UK Department of Energy & Climate Change, 2012): Electricity System: Assessment of Future Challenges – Summary. London. Available at: http://www.decc.gov.uk/assets/decc/11/meeting-energy-demand/future-elec-network/6098-electricity-system-assessment-future-chall.pdf
DIVA-GIS: http://www.diva-gis.org/Data
ESRI (Environmental Systems Research Institute): www.esri.com
EdF (Electricité de France, 2011). Experience of EDF in the field of pumped-storage power plants. Presented at the conference Pumped storage Powerplants, Lyon, 23-24 November 2011.
Eurelectric (2011): Hydro in Europe: Powering renewables. Full report. http://www.eurelectric.org/media/26690/hydro_report_final-2011-160-0011-01-e.pdf
EC (European Commission, 2007): Communication from the Commission to the European Parliament, the Council, the European Economic and Social Committee and the Committee of the Regions. An Energy policy for Europe (COM/2007/1 final). Available at http://ec.europa.eu/energy/energy_policy/doc/01_energy_policy_for_europe_en.pdf
EC (European Commission, 2012): Communication from the Commission to the European Parliament, the Council, the European Economic and Social Committee and the Committee of the Regions. Renewable Energy: a major player in the European energy market (COM/2012/0271 final). Available at http://eur-lex.europa.eu/LexUriServ/LexUriServ.do?uri=CELEX:52012DC0271:EN:NOT
EC (European Commission, 2013): Europe 2020 http://ec.europa.eu/europe2020/index_en.htm Accessed: 11.01.2013
EEA (European Environmental Agency, 2012) European Catchments and RIvers Network System (ECRINS) —. [online] Available at: http://www.eea.europa.eu/data-and-maps/data/european-catchments-and-rivers-network [Accessed: 16 Apr 2013].
EIONET (2013) Dampos.eionet.europa.eu (2005) DAM Positioning - Eionet. [online] Available at: http://dampos.eionet.europa.eu [Accessed: 16 Apr 2013].
European Council (2009): Presidency conclusions to the European Council of 29/30 October 2009. Available at
Joint Research Centre Assessment of the European potential for PHS
36
http://www.consilium.europa.eu/uedocs/cms_data/docs/pressdata/en/ec/110889.pdf, accessed 25.03.2013
European Free Trade Association (EFTA): http://www.efta.int Accessed: 04.02.2013
Eurostat, European office of statistics: http://ec.europa.eu/eurostat. Accessed 20.02.2013
EU (European Union, 2013): How the EU works. List of countries. Available at http://europa.eu/about-eu/countries/index_en.htm. Accessed 04.02.2013
Fitzgerald, N., Lacal Arántegui, R., McKeogh, E., and Leahy, P., 2012: A GIS-based model to calculate the potential for transforming conventional hydropower schemes and non-hydro reservoirs to pumped hydropower schemes, Energy, Volume 41, Issue 1, May 2012, Pages 483-490. Available at http://www.sciencedirect.com/science/article/pii/S0360544212001399
GRanD (2011) Dams, v1.01: Global Reservoir and Dam (GRanD), v1 | SEDAC. [online] Available at: http://sedac.ciesin.columbia.edu/data/set/grand-v1-dams-rev01 [Accessed: 16 Apr 2013].
Harby, Atle (2013), Director, Centre for Environmental Design of Renewable Energy, SINTEF Energy Research, Norway. Personal communications.
IEA & IRENA, 2012: Energy supply technologies. Electricity Storage. Available at: http://www.iea-etsap.org/web/Supply.asp
JRC (Joint Research Centre) of the European Commission, 2011: Pumped-hydro energy storage: Potential for transformation from single dams. Lacal Arántegui, R., Fitzgerald, N., and Leahy, P. (2011). Joint Research Centre – Institute for Energy and Transport; Petten, The Netherlands. Available at http://setis.ec.europa.eu/setis-deliverables/studies-and-reports/report-pumped-hydro-energy-storage-potential-transformation
JRC (Joint Research Centre) of the European Commission, 2012: SETIS Expert workshop on the assessment of the potential of pumped hydropower storage. Lacal Arántegui, R., Tzimas, E., Bocin-Dumitriu, A., Zubyareva, A. (2012). Joint Research Centre – Institute for Energy and Transport; Petten, The Netherlands. Available at http://setis.ec.europa.eu/setis-deliverables/setis-workshops-hearings/setis-expert-workshop-assessment-of-potential-of-pumped
Martínez Campillo, R. (2010), Iberdrola Generación: El almacenamiento de energía en sistemas eléctricos de potencia: centrales hidroeléctricas reversibles. Presentation at the Universidad Pontificia de Comillas, 18/05/2010. Accessed 18/03/2013, available at http://www.upcomillas.es/catedras/crm/descargas/2009-2010/seminario%2018.05.2010.pdf
Naturalearthdata.com (2013) 1:50m Cultural Vectors | Natural Earth. [online] Available at: http://www.naturalearthdata.com/downloads/50m-cultural-vectors/ [Accessed: 16 Apr 2013].
PLATTS (2006): European Transmission Lines. Vector digital data. Boulder, CO. Platts. Online_Linkage: http://www.gisdata.platts.com/
PLATTS (2012): Platts Power Plant Database, retrieved September 2012.
Schmid, S. (2013). Hydroprojekt, Germany. Personal communication in the process of the review of this paper.
UNESCO World Heritage Centre: http://whc.unesco.org/en/list/
Vogt, J. V., Soille, P., de Jager, A., Rimavičiūtė, E., Mehl, W., Foisneau, S., Bódis, K., Dusart,J., Paracchini, M.L., Haastrup, P., Bamps, C. (2007): A Pan-European River and Catchment Database, European Commission, Directorate-General Joint Research Centre, Institute for Environment and Sustainability, Ispra, Italy, p. 119., JRC Reference Reports, EUR 22920 EN

Joint Research Centre Assessment of the European potential for PHS
37
Wänn, A (2012): database of European PHS plants used in the stoRE project, personal communication.
WCD (World Commission on Dams, 2000): Dams and developments: A new framework for decision-making – The report of the World Commission on Dams. Earthscan Publications. Available at: http://awsassets.panda.org/downloads/wcd_dams_final_report.pdf
ZfES Zentrum für Energieforschung Stuttgart(2012). Stromspeicherpotenziale für Deutschland. Hartmann, N., Eltrop, L., Bauer, N., Salzer, J., Schwarz, S., and Schmidt, M. Stuttgart, Germany, July 2012.
Zinke, P. (2013). SINTEF Energy Research, Trondheim, Norway. Personal communication in the process of the review of this paper.

Joint Research Centre Assessment of the European potential for PHS
38
ABBREVIATIONS AND ACRONYMS:
Throughout this report 2-letter country codes are used as for the International Organisation for Standardization: http://www.iso.org/iso/country_names_and_code_elements. Other abbreviations and acronyms are:
AC Acceding countries to the European Union CAES Compressed air energy storage CC Candidate countries to the European Union CCM Catchment Characterisation and Modelling CLC CORINE Land Cover CORINE Coordination of Information on the Environment DAMPOS DAM POSitioning – Eionet DECC Department of Energy & Climate Change, United Kingdom DEM Digital elevation model DSR Demand side response ECRINS European Catchments and RIvers Network System EEA European Environment Agency EFTA European Free Trade Association EIONET European Environment Information and Observation Network ESRI Environmental Systems Research Institute EU European Union GIS Geographic information system GRanD Global Reservoir and Dam JRC Joint Research Centre, a directorate general of the European Commission GW Gigawatt (= 1 000 000 000 Watts) GWh Gigawatt hour METI Ministry of Economy, Trade, and Industry of Japan MS Member State MW Megawatt NASA United States National Aeronautics and Space Administration NVE Norwegian Directorate for Water and Energy PC Potential candidate country/countries to the European Union PHS Pumped hydropower storage RE Renewable energy RES Renewable energy sources RSIS Ramsar Sites Information Service: http://www.ramsar.wetlands.org SAC Special areas of conservation SPA Special protection areas SRTM Shuttle Radar Topography Mission TWh Terawatts hour UCC University College Cork, in Ireland UNESCO The United Nations Educational, Scientific and Cultural Organization

Joint Research Centre Assessment of the European potential for PHS
39
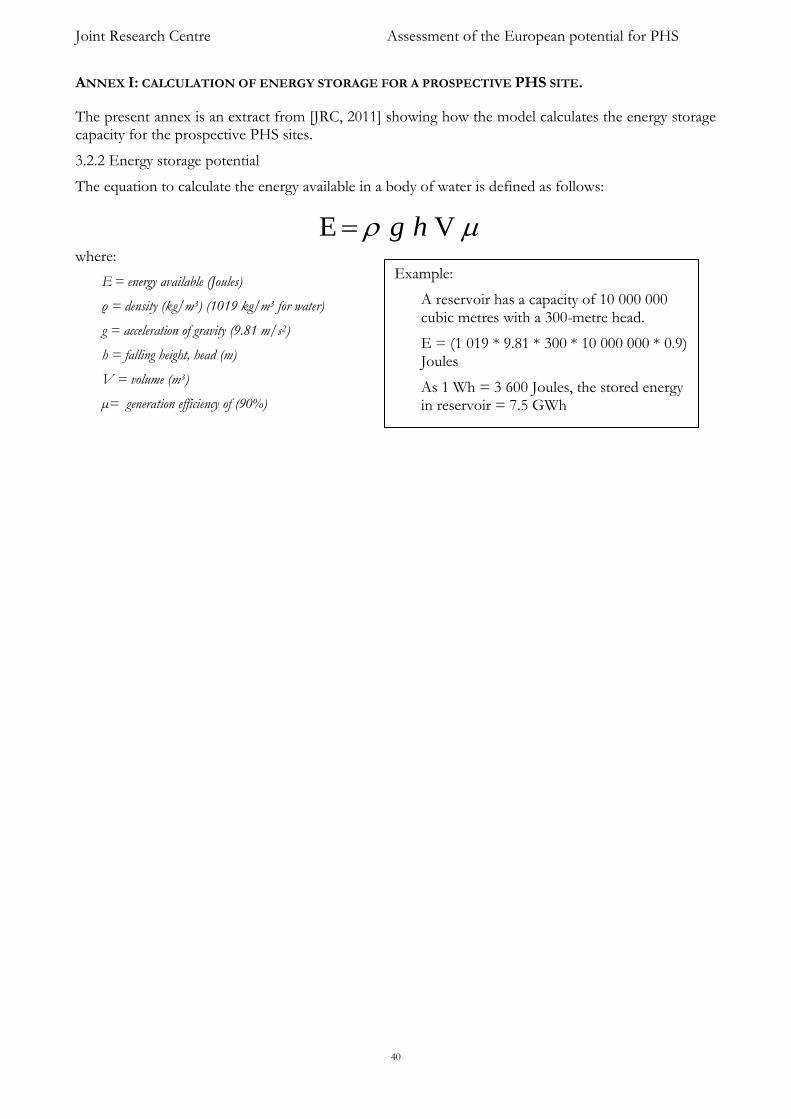
Joint Research Centre Assessment of the European potential for PHS
40
ANNEX I: CALCULATION OF ENERGY STORAGE FOR A PROSPECTIVE PHS SITE.
The present annex is an extract from [JRC, 2011] showing how the model calculates the energy storage capacity for the prospective PHS sites.
3.2.2 Energy storage potential
The equation to calculate the energy available in a body of water is defined as follows:
where:
E = energy available (Joules)
ρ = density (kg/m3) (1019 kg/m3 for water)
g = acceleration of gravity (9.81 m/s2)
h = falling height, head (m)
V = volume (m3)
µ= generation efficiency of (90%)
V E hg
Example:
A reservoir has a capacity of 10 000 000 cubic metres with a 300-metre head.
E = (1 019 * 9.81 * 300 * 10 000 000 * 0.9) Joules
As 1 Wh = 3 600 Joules, the stored energy in reservoir = 7.5 GWh
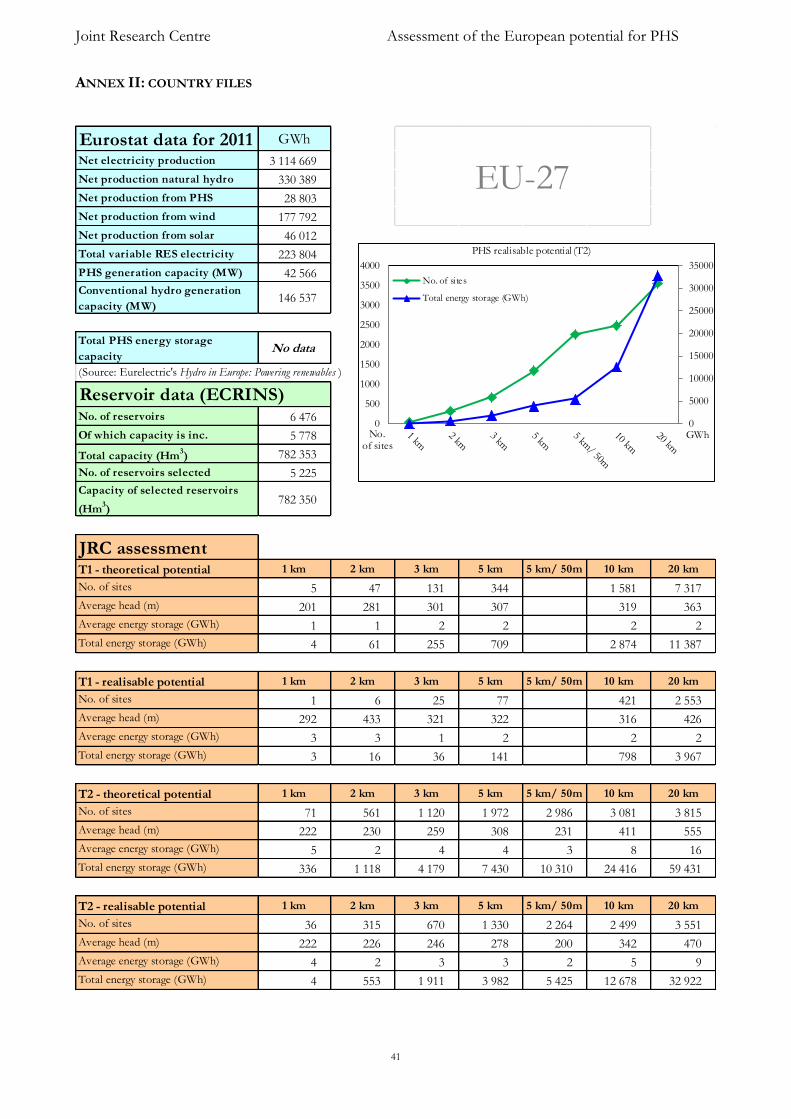
Joint Research Centre Assessment of the European potential for PHS
41
ANNEX II: COUNTRY FILES
Eurostat data for 2011 GWh
Net electricity production 3 114 669
Net production natural hydro 330 389
Net production from PHS 28 803
Net production from wind 177 792
Net production from solar 46 012
Total variable RES electricity 223 804
PHS generation capacity (MW) 42 566
Conventional hydro generation
capacity (MW)146 537
Total PHS energy storage
capacityNo data
(Source: Eurelectric's Hydro in Europe: Powering renewables )
No. of reservoirs 6 476
Of which capacity is inc. 5 778
Total capacity (Hm3) 782 353
No. of reservoirs selected 5 225
Capacity of selected reservoirs
(Hm3)
782 350
JRC assessmentT1 - theoretical potential 1 km 2 km 3 km 5 km 5 km/ 50m 10 km 20 km
No. of sites 5 47 131 344 1 581 7 317
Average head (m) 201 281 301 307 319 363
Average energy storage (GWh) 1 1 2 2 2 2
Total energy storage (GWh) 4 61 255 709 2 874 11 387
T1 - realisable potential 1 km 2 km 3 km 5 km 5 km/ 50m 10 km 20 km
No. of sites 1 6 25 77 421 2 553
Average head (m) 292 433 321 322 316 426
Average energy storage (GWh) 3 3 1 2 2 2
Total energy storage (GWh) 3 16 36 141 798 3 967
T2 - theoretical potential 1 km 2 km 3 km 5 km 5 km/ 50m 10 km 20 km
No. of sites 71 561 1 120 1 972 2 986 3 081 3 815
Average head (m) 222 230 259 308 231 411 555
Average energy storage (GWh) 5 2 4 4 3 8 16
Total energy storage (GWh) 336 1 118 4 179 7 430 10 310 24 416 59 431
T2 - realisable potential 1 km 2 km 3 km 5 km 5 km/ 50m 10 km 20 km
No. of sites 36 315 670 1 330 2 264 2 499 3 551
Average head (m) 222 226 246 278 200 342 470
Average energy storage (GWh) 4 2 3 3 2 5 9
Total energy storage (GWh) 4 553 1 911 3 982 5 425 12 678 32 922
EU-27
Reservoir data (ECRINS)
0
5000
10000
15000
20000
25000
30000
35000
0
500
1000
1500
2000
2500
3000
3500
4000
GWhNo.of sites
PHS realisable potential (T2)
No. of sites
Total energy storage (GWh)

Joint Research Centre Assessment of the European potential for PHS
42
Eurostat data for 2011 GWh
Net electricity production 63 319
Net production natural hydro 36 399
Net production from PHS 3 504
Net production from wind 1 934
Net production from solar 174
Total variable RES electricity 2 108
PHS generation capacity (MW) 3 365
Conventional hydro generation
capacity (MW)12 980
Total PHS energy storage
capacity125
(Source: Eurelectric's Hydro in Europe: Powering renewables )
No. of reservoirs 167
Of which capacity is inc. 155
Total capacity (Hm3) 7 766
No. of reservoirs selected 145
Capacity of selected reservoirs
(Hm3)
7 766
JRC assessmentT1 - theoretical potential 1 km 2 km 3 km 5 km 5 km/ 50m 10 km 20 km
No. of sites 0 2 4 15 40 98
Average head (m) 0 498 477 460 557 607
Average energy storage (GWh) 0 1 1 7 5 5
Total energy storage (GWh) 0 2 6 105 199 443
T1 - realisable potential 1 km 2 km 3 km 5 km 5 km/ 50m 10 km 20 km
No. of sites 0 0 2 3 13 45
Average head (m) 0 0 457 462 578 703
Average energy storage (GWh) 0 0 2 1 8 6
Total energy storage (GWh) 0 0 3 4 102 283
T2 - theoretical potential 1 km 2 km 3 km 5 km 5 km/ 50m 10 km 20 km
No. of sites 2 19 46 73 104 128 142
Average head (m) 202 315 305 404 310 638 869
Average energy storage (GWh) 0 2 3 5 4 9 21
Total energy storage (GWh) 1 44 147 335 423 1 143 2 915
T2 - realisable potential 1 km 2 km 3 km 5 km 5 km/ 50m 10 km 20 km
No. of sites 1 8 22 39 58 79 114
Average head (m) 161 302 302 407 302 539 758
Average energy storage (GWh) 1 2 2 3 2 6 15
Total energy storage (GWh) 1 14 52 120 143 439 1 747
Reservoir data (ECRINS)
Austria
0
200
400
600
800
1000
1200
1400
1600
1800
2000
0
20
40
60
80
100
120
GWhNo.of sites
PHS realisable potential (T2)
No. of sites
Total energy storage (GWh)

Joint Research Centre Assessment of the European potential for PHS
43
Eurostat data for 2011 GWh
Net electricity production 86 663
Net production natural hydro 1 410
Net production from PHS 1 217
Net production from wind 2 285
Net production from solar 1 169
Total variable RES electricity 3 454
PHS generation capacity (MW) 1 307
Conventional hydro generation
capacity (MW)1 426
Total PHS energy storage
capacity8
(Source: Eurelectric's Hydro in Europe: Powering renewables )
No. of reservoirs 15
Of which capacity is inc. 12
Total capacity (Hm3) 177
No. of reservoirs selected 12
Capacity of selected reservoirs
(Hm3)
177
JRC assessmentT1 - theoretical potential 1 km 2 km 3 km 5 km 5 km/ 50m 10 km 20 km
No. of sites 0 1 2 2 2 4
Average head (m) 0 252 252 252 252 247
Average energy storage (GWh) 0 3 3 3 3 3
Total energy storage (GWh) 0 3 5 5 5 12
T1 - realisable potential 1 km 2 km 3 km 5 km 5 km/ 50m 10 km 20 km
No. of sites 0 0 0 0 0 0
Average head (m) 0 0 0 0 0 0
Average energy storage (GWh) 0 0 0 0 0 0
Total energy storage (GWh) 0 0 0 0 0 0
T2 - theoretical potential 1 km 2 km 3 km 5 km 5 km/ 50m 10 km 20 km
No. of sites 0 1 3 3 8 5 8
Average head (m) 0 241 224 220 137 270 225
Average energy storage (GWh) 0 1 2 3 2 4 3
Total energy storage (GWh) 0 1 6 9 18 20 21
T2 - realisable potential 1 km 2 km 3 km 5 km 5 km/ 50m 10 km 20 km
No. of sites 0 1 1 2 6 4 6
Average head (m) 0 241 157 242 135 202 216
Average energy storage (GWh) 0 1 1 2 1 1 2
Total energy storage (GWh) 0 1 1 4 7 6 12
Reservoir data (ECRINS)
Belgium
0
2
4
6
8
10
12
14
0
1
2
3
4
5
6
7
GWhNo.of sites
PHS realisable potential (T2)
No. of sites
Total energy storage (GWh)

Joint Research Centre Assessment of the European potential for PHS
44
Eurostat data for 2011 GWh
Net electricity production 45 844
Net production natural hydro 3 641
Net production from PHS 765
Net production from wind 861
Net production from solar 101
Total variable RES electricity 962
PHS generation capacity (MW) 864
Conventional hydro generation
capacity (MW)3 108
Total PHS energy storage
capacity2
(Source: Eurelectric's Hydro in Europe: Powering renewables )
No. of reservoirs 163
Of which capacity is inc. 158
Total capacity (Hm3) 7 524
No. of reservoirs selected 158
Capacity of selected reservoirs
(Hm3)
7 524
JRC assessmentT1 - theoretical potential 1 km 2 km 3 km 5 km 5 km/ 50m 10 km 20 km
No. of sites 0 0 0 0 2 27
Average head (m) 0 0 0 0 404 252
Average energy storage (GWh) 0 0 0 0 4 4
Total energy storage (GWh) 0 0 0 0 8 119
T1 - realisable potential 1 km 2 km 3 km 5 km 5 km/ 50m 10 km 20 km
No. of sites 0 0 0 0 0 6
Average head (m) 0 0 0 0 0 206
Average energy storage (GWh) 0 0 0 0 0 2
Total energy storage (GWh) 0 0 0 0 0 11
T2 - theoretical potential 1 km 2 km 3 km 5 km 5 km/ 50m 10 km 20 km
No. of sites 0 13 33 66 110 110 146
Average head (m) 0 225 238 274 194 386 507
Average energy storage (GWh) 0 2 2 3 3 8 13
Total energy storage (GWh) 0 22 69 215 283 926 1 849
T2 - realisable potential 1 km 2 km 3 km 5 km 5 km/ 50m 10 km 20 km
No. of sites 0 6 14 33 64 67 118
Average head (m) 0 232 216 234 163 332 386
Average energy storage (GWh) 0 2 3 2 2 6 6
Total energy storage (GWh) 0 14 38 76 131 398 696
Reservoir data (ECRINS)
Bulgaria
0
100
200
300
400
500
600
700
800
0
20
40
60
80
100
120
140
GWhNo.of sites
PHS realisable potential (T2)
No. of sites
Total energy storage (GWh)

Joint Research Centre Assessment of the European potential for PHS
45
Eurostat data for 2011 GWh
Net electricity production 4 760
Net production natural hydro 0
Net production from PHS 0
Net production from wind 114
Net production from solar 12
Total variable RES electricity 126
PHS generation capacity (MW) 0
Conventional hydro generation
capacity (MW)0
Total PHS energy storage
capacity0
(Source: Eurelectric's Hydro in Europe: Powering renewables )
No. of reservoirs 52
Of which capacity is inc. 52
Total capacity (Hm3) 286
No. of reservoirs selected 38
Capacity of selected reservoirs
(Hm3)
285
JRC assessmentT1 - theoretical potential 1 km 2 km 3 km 5 km 5 km/ 50m 10 km 20 km
No. of sites 0 0 0 1 11 57
Average head (m) 0 0 0 252 314 370
Average energy storage (GWh) 0 0 0 0 1 1
Total energy storage (GWh) 0 0 0 0 8 31
T1 - realisable potential 1 km 2 km 3 km 5 km 5 km/ 50m 10 km 20 km
No. of sites 0 0 0 0 0 16
Average head (m) 0 0 0 0 0 358
Average energy storage (GWh) 0 0 0 0 0 1
Total energy storage (GWh) 0 0 0 0 0 9
T2 - theoretical potential 1 km 2 km 3 km 5 km 5 km/ 50m 10 km 20 km
No. of sites 0 1 3 14 24 33 37
Average head (m) 0 188 229 210 159 406 667
Average energy storage (GWh) 0 2 2 2 2 2 4
Total energy storage (GWh) 0 2 7 33 42 74 130
T2 - realisable potential 1 km 2 km 3 km 5 km 5 km/ 50m 10 km 20 km
No. of sites 0 1 3 12 21 31 36
Average head (m) 0 188 229 214 158 308 451
Average energy storage (GWh) 0 2 2 2 1 2 2
Total energy storage (GWh) 0 2 7 18 27 51 86
Reservoir data (ECRINS)
Cyprus
0
10
20
30
40
50
60
70
80
90
100
0
5
10
15
20
25
30
35
40
GWhNo.of sites
PHS realisable potential (T2)
No. of sites
Total energy storage (GWh)

Joint Research Centre Assessment of the European potential for PHS
46
Eurostat data for 2011 GWh
Net electricity production 80 921
Net production natural hydro 2 651
Net production from PHS 701
Net production from wind 395
Net production from solar 2 169
Total variable RES electricity 2 564
PHS generation capacity (MW) 1 147
Conventional hydro generation
capacity (MW)2 197
Total PHS energy storage
capacity7
(Source: Eurelectric's Hydro in Europe: Powering renewables )
No. of reservoirs 118
Of which capacity is inc. 117
Total capacity (Hm3) 3 454
No. of reservoirs selected 116
Capacity of selected reservoirs
(Hm3)
3 454
JRC assessmentT1 - theoretical potential 1 km 2 km 3 km 5 km 5 km/ 50m 10 km 20 km
No. of sites 1 2 3 5 12 39
Average head (m) 193 360 291 253 278 266
Average energy storage (GWh) 0 2 1 1 1 1
Total energy storage (GWh) 0 4 4 5 12 39
T1 - realisable potential 1 km 2 km 3 km 5 km 5 km/ 50m 10 km 20 km
No. of sites 0 0 2 0 3 8
Average head (m) 0 0 174 0 339 306
Average energy storage (GWh) 0 0 0 0 1 1
Total energy storage (GWh) 0 0 0 0 3 6
T2 - theoretical potential 1 km 2 km 3 km 5 km 5 km/ 50m 10 km 20 km
No. of sites 1 13 26 57 88 85 112
Average head (m) 167 209 236 255 197 298 338
Average energy storage (GWh) 1 1 2 3 2 3 6
Total energy storage (GWh) 1 15 41 169 217 289 644
T2 - realisable potential 1 km 2 km 3 km 5 km 5 km/ 50m 10 km 20 km
No. of sites 0 6 13 35 66 68 100
Average head (m) 0 189 221 226 165 266 302
Average energy storage (GWh) 0 1 1 2 2 3 5
Total energy storage (GWh) 0 5 10 79 131 191 450
Reservoir data (ECRINS)
Czech Republic
0
50
100
150
200
250
300
350
400
450
500
0
20
40
60
80
100
120
GWhNo.of sites
PHS realisable potential (T2)
No. of sites
Total energy storage (GWh)
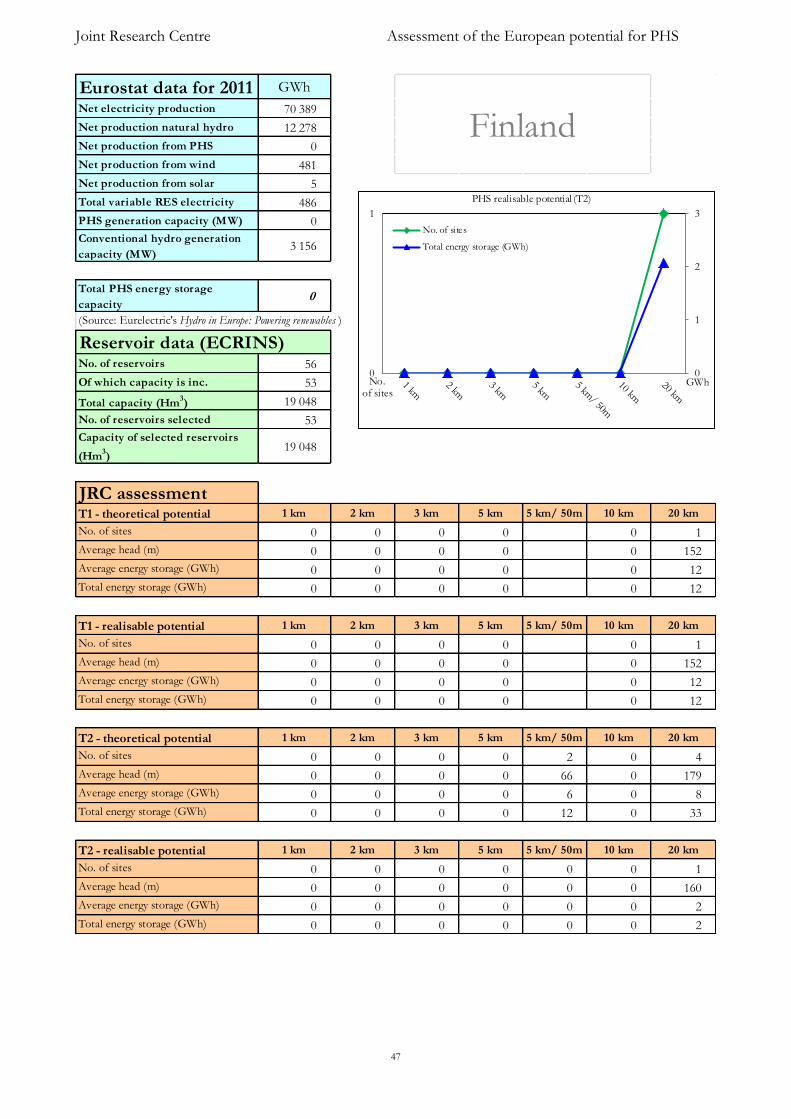
Joint Research Centre Assessment of the European potential for PHS
47
Eurostat data for 2011 GWh
Net electricity production 70 389
Net production natural hydro 12 278
Net production from PHS 0
Net production from wind 481
Net production from solar 5
Total variable RES electricity 486
PHS generation capacity (MW) 0
Conventional hydro generation
capacity (MW)3 156
Total PHS energy storage
capacity0
(Source: Eurelectric's Hydro in Europe: Powering renewables )
No. of reservoirs 56
Of which capacity is inc. 53
Total capacity (Hm3) 19 048
No. of reservoirs selected 53
Capacity of selected reservoirs
(Hm3)
19 048
JRC assessmentT1 - theoretical potential 1 km 2 km 3 km 5 km 5 km/ 50m 10 km 20 km
No. of sites 0 0 0 0 0 1
Average head (m) 0 0 0 0 0 152
Average energy storage (GWh) 0 0 0 0 0 12
Total energy storage (GWh) 0 0 0 0 0 12
T1 - realisable potential 1 km 2 km 3 km 5 km 5 km/ 50m 10 km 20 km
No. of sites 0 0 0 0 0 1
Average head (m) 0 0 0 0 0 152
Average energy storage (GWh) 0 0 0 0 0 12
Total energy storage (GWh) 0 0 0 0 0 12
T2 - theoretical potential 1 km 2 km 3 km 5 km 5 km/ 50m 10 km 20 km
No. of sites 0 0 0 0 2 0 4
Average head (m) 0 0 0 0 66 0 179
Average energy storage (GWh) 0 0 0 0 6 0 8
Total energy storage (GWh) 0 0 0 0 12 0 33
T2 - realisable potential 1 km 2 km 3 km 5 km 5 km/ 50m 10 km 20 km
No. of sites 0 0 0 0 0 0 1
Average head (m) 0 0 0 0 0 0 160
Average energy storage (GWh) 0 0 0 0 0 0 2
Total energy storage (GWh) 0 0 0 0 0 0 2
Reservoir data (ECRINS)
Finland
0
1
2
3
0
1
GWhNo.of sites
PHS realisable potential (T2)
No. of sites
Total energy storage (GWh)

Joint Research Centre Assessment of the European potential for PHS
48
Eurostat data for 2011 GWh
Net electricity production 537 510
Net production natural hydro 49 671
Net production from PHS 5 074
Net production from wind 12 235
Net production from solar 2 050
Total variable RES electricity 14 285
PHS generation capacity (MW) 6 985
Conventional hydro generation
capacity (MW)25 332
Total PHS energy storage
capacity184
(Source: Eurelectric's Hydro in Europe: Powering renewables )
No. of reservoirs 715
Of which capacity is inc. 567
Total capacity (Hm3) 24 531
No. of reservoirs selected 550
Capacity of selected reservoirs
(Hm3)
24 530
JRC assessmentT1 - theoretical potential 1 km 2 km 3 km 5 km 5 km/ 50m 10 km 20 km
No. of sites 0 3 9 20 91 298
Average head (m) 0 308 332 425 384 414
Average energy storage (GWh) 0 2 2 3 4 4
Total energy storage (GWh) 0 6 20 54 409 1 184
T1 - realisable potential 1 km 2 km 3 km 5 km 5 km/ 50m 10 km 20 km
No. of sites 0 0 2 4 20 124
Average head (m) 0 0 514 373 382 435
Average energy storage (GWh) 0 0 2 1 5 4
Total energy storage (GWh) 0 0 4 5 93 506
T2 - theoretical potential 1 km 2 km 3 km 5 km 5 km/ 50m 10 km 20 km
No. of sites 6 72 135 245 358 371 427
Average head (m) 180 239 277 353 268 464 614
Average energy storage (GWh) 1 3 3 3 3 7 14
Total energy storage (GWh) 9 180 374 811 967 2 591 6 118
T2 - realisable potential 1 km 2 km 3 km 5 km 5 km/ 50m 10 km 20 km
No. of sites 5 47 98 198 306 334 413
Average head (m) 183 230 268 341 251 430 571
Average energy storage (GWh) 1 2 2 3 3 6 10
Total energy storage (GWh) 1 90 242 631 778 1 984 4 090
Reservoir data (ECRINS)
France
0
500
1000
1500
2000
2500
3000
3500
4000
4500
0
50
100
150
200
250
300
350
400
450
GWhNo.of sites
PHS realisable potential (T2)
No. of sites
Total energy storage (GWh)

Joint Research Centre Assessment of the European potential for PHS
49
Eurostat data for 2011 GWh
Net electricity production 572 887
Net production natural hydro 23 038
Net production from PHS 6 099
Net production from wind 48 883
Net production from solar 19 340
Total variable RES electricity 68 223
PHS generation capacity (MW) 6 777
Conventional hydro generation
capacity (MW)11 562
Total PHS energy storage
capacity39
(Source: Eurelectric's Hydro in Europe: Powering renewables )
No. of reservoirs 246
Of which capacity is inc. 236
Total capacity (Hm3) 3 658
No. of reservoirs selected 235
Capacity of selected reservoirs
(Hm3)
3 658
JRC assessmentT1 - theoretical potential 1 km 2 km 3 km 5 km 5 km/ 50m 10 km 20 km
No. of sites 0 0 0 0 9 51
Average head (m) 0 0 0 0 190 201
Average energy storage (GWh) 0 0 0 0 2 2
Total energy storage (GWh) 0 0 0 0 19 89
T1 - realisable potential 1 km 2 km 3 km 5 km 5 km/ 50m 10 km 20 km
No. of sites 0 0 0 0 1 5
Average head (m) 0 0 0 0 153 189
Average energy storage (GWh) 0 0 0 0 5 3
Total energy storage (GWh) 0 0 0 0 5 14
T2 - theoretical potential 1 km 2 km 3 km 5 km 5 km/ 50m 10 km 20 km
No. of sites 3 30 43 78 145 138 189
Average head (m) 159 200 217 228 166 271 317
Average energy storage (GWh) 1 1 3 3 2 4 7
Total energy storage (GWh) 2 43 113 232 301 566 1 291
T2 - realisable potential 1 km 2 km 3 km 5 km 5 km/ 50m 10 km 20 km
No. of sites 1 16 31 53 124 122 180
Average head (m) 161 190 205 209 146 247 276
Average energy storage (GWh) 1 1 2 3 2 3 4
Total energy storage (GWh) 1 23 71 139 201 320 804
Reservoir data (ECRINS)
Germany
0
200
400
600
800
1000
1200
1400
1600
1800
2000
0
20
40
60
80
100
120
GWhNo.of sites
PHS realisable potential (T2)
No. of sites
Total energy storage (GWh)
0
100
200
300
400
500
600
700
800
900
0
20
40
60
80
100
120
140
160
180
200
GWhNo.of sites
PHS realisable potential (T2)
No. of sites
Total energy storage (GWh)

Joint Research Centre Assessment of the European potential for PHS
50
Eurostat data for 2011 GWh
Net electricity production 53 913
Net production natural hydro 4 262
Net production from PHS 264
Net production from wind 3 315
Net production from solar 610
Total variable RES electricity 3 925
PHS generation capacity (MW) 699
Conventional hydro generation
capacity (MW)3 224
Total PHS energy storage
capacity21
(Source: Eurelectric's Hydro in Europe: Powering renewables )
No. of reservoirs 59
Of which capacity is inc. 51
Total capacity (Hm3) 13 347
No. of reservoirs selected 51
Capacity of selected reservoirs
(Hm3)
13 347
JRC assessmentT1 - theoretical potential 1 km 2 km 3 km 5 km 5 km/ 50m 10 km 20 km
No. of sites 0 0 0 0 1 3
Average head (m) 0 0 0 0 151 442
Average energy storage (GWh) 0 0 0 0 28 56
Total energy storage (GWh) 0 0 0 0 28 168
T1 - realisable potential 1 km 2 km 3 km 5 km 5 km/ 50m 10 km 20 km
No. of sites 0 0 0 0 0 0
Average head (m) 0 0 0 0 0 0
Average energy storage (GWh) 0 0 0 0 0 0
Total energy storage (GWh) 0 0 0 0 0 0
T2 - theoretical potential 1 km 2 km 3 km 5 km 5 km/ 50m 10 km 20 km
No. of sites 1 7 18 31 44 46 47
Average head (m) 256 248 259 311 238 465 668
Average energy storage (GWh) 1 4 5 6 6 11 41
Total energy storage (GWh) 1 26 84 171 277 519 1 920
T2 - realisable potential 1 km 2 km 3 km 5 km 5 km/ 50m 10 km 20 km
No. of sites 1 5 12 20 32 38 42
Average head (m) 256 280 265 287 211 421 613
Average energy storage (GWh) 1 5 5 6 6 8 25
Total energy storage (GWh) 1 24 59 110 182 318 1 062
Reservoir data (ECRINS)
Greece
0
200
400
600
800
1000
1200
0
5
10
15
20
25
30
35
40
45
GWhNo.of sites
PHS realisable potential (T2)
No. of sites
Total energy storage (GWh)

Joint Research Centre Assessment of the European potential for PHS
51
Eurostat data for 2011 GWh
Net electricity production 33 500
Net production natural hydro 216
Net production from PHS 0
Net production from wind 610
Net production from solar 1
Total variable RES electricity 611
PHS generation capacity (MW) 0
Conventional hydro generation
capacity (MW)55
Total PHS energy storage
capacity0
(Source: Eurelectric's Hydro in Europe: Powering renewables )
No. of reservoirs 15
Of which capacity is inc. 15
Total capacity (Hm3) 62
No. of reservoirs selected 15
Capacity of selected reservoirs
(Hm3)
62
JRC assessmentT1 - theoretical potential 1 km 2 km 3 km 5 km 5 km/ 50m 10 km 20 km
No. of sites 0 0 0 1 3 9
Average head (m) 0 0 0 181 192 243
Average energy storage (GWh) 0 0 0 0 0 0
Total energy storage (GWh) 0 0 0 0 0 4
T1 - realisable potential 1 km 2 km 3 km 5 km 5 km/ 50m 10 km 20 km
No. of sites 0 0 0 0 0 0
Average head (m) 0 0 0 0 0 0
Average energy storage (GWh) 0 0 0 0 0 0
Total energy storage (GWh) 0 0 0 0 0 0
T2 - theoretical potential 1 km 2 km 3 km 5 km 5 km/ 50m 10 km 20 km
No. of sites 0 2 2 7 10 13 15
Average head (m) 0 219 291 282 235 362 433
Average energy storage (GWh) 0 1 2 1 2 2 4
Total energy storage (GWh) 0 1 3 9 15 30 59
T2 - realisable potential 1 km 2 km 3 km 5 km 5 km/ 50m 10 km 20 km
No. of sites 0 0 0 2 6 3 12
Average head (m) 0 0 0 219 150 181 243
Average energy storage (GWh) 0 0 0 1 2 1 2
Total energy storage (GWh) 0 0 0 3 10 3 23
Reservoir data (ECRINS)
Hungary
0
5
10
15
20
25
0
2
4
6
8
10
12
14
GWhNo.of sites
PHS realisable potential (T2)
No. of sites
Total energy storage (GWh)

Joint Research Centre Assessment of the European potential for PHS
52
22
22 The only PHS in Ireland was down for refurbishment during the entire year 2011, therefore the lack of 2011 generation
Eurostat data for 2011 GWh
Net electricity production 26 369
Net production natural hydro 699
Net production from PHS 0
Net production from wind 4 380
Net production from solar 0
Total variable RES electricity 4 380
PHS generation capacity (MW) 292
Conventional hydro generation
capacity (MW)529
Total PHS energy storage
capacity2
(Source: Eurelectric's Hydro in Europe: Powering renewables )
No. of reservoirs 16
Of which capacity is inc. 16
Total capacity (Hm3) 970
No. of reservoirs selected 16
Capacity of selected reservoirs
(Hm3)
970
JRC assessmentT1 - theoretical potential 1 km 2 km 3 km 5 km 5 km/ 50m 10 km 20 km
No. of sites 0 0 0 0 0 0
Average head (m) 0 0 0 0 0 0
Average energy storage (GWh) 0 0 0 0 0 0
Total energy storage (GWh) 0 0 0 0 0 0
T1 - realisable potential 1 km 2 km 3 km 5 km 5 km/ 50m 10 km 20 km
No. of sites 0 0 0 0 0 0
Average head (m) 0 0 0 0 0 0
Average energy storage (GWh) 0 0 0 0 0 0
Total energy storage (GWh) 0 0 0 0 0 0
T2 - theoretical potential 1 km 2 km 3 km 5 km 5 km/ 50m 10 km 20 km
No. of sites 0 2 3 8 11 12 15
Average head (m) 0 194 249 222 189 369 407
Average energy storage (GWh) 0 1 1 1 1 4 24
Total energy storage (GWh) 0 3 3 10 12 52 355
T2 - realisable potential 1 km 2 km 3 km 5 km 5 km/ 50m 10 km 20 km
No. of sites 0 1 2 7 10 11 14
Average head (m) 0 173 255 220 184 303 280
Average energy storage (GWh) 0 1 1 1 1 3 7
Total energy storage (GWh) 0 1 1 9 11 31 94
Reservoir data (ECRINS)
Ireland
0
200
400
600
800
1000
1200
1400
1600
1800
2000
0
20
40
60
80
100
120
GWhNo.of sites
PHS realisable potential (T2)
No. of sites
Total energy storage (GWh)
0
10
20
30
40
50
60
70
80
90
100
0
2
4
6
8
10
12
14
16
GWhNo.of sites
PHS realisable potential (T2)
No. of sites
Total energy storage (GWh)
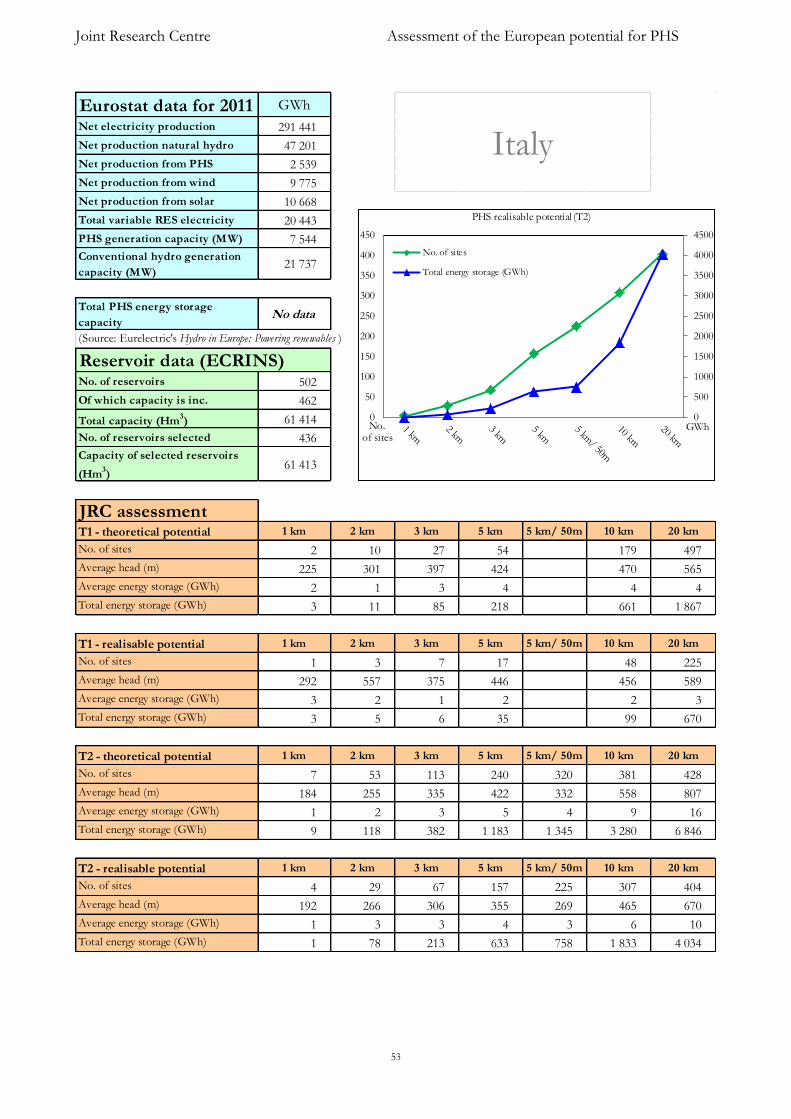
Joint Research Centre Assessment of the European potential for PHS
53
Eurostat data for 2011 GWh
Net electricity production 291 441
Net production natural hydro 47 201
Net production from PHS 2 539
Net production from wind 9 775
Net production from solar 10 668
Total variable RES electricity 20 443
PHS generation capacity (MW) 7 544
Conventional hydro generation
capacity (MW)21 737
Total PHS energy storage
capacityNo data
(Source: Eurelectric's Hydro in Europe: Powering renewables )
No. of reservoirs 502
Of which capacity is inc. 462
Total capacity (Hm3) 61 414
No. of reservoirs selected 436
Capacity of selected reservoirs
(Hm3)
61 413
JRC assessmentT1 - theoretical potential 1 km 2 km 3 km 5 km 5 km/ 50m 10 km 20 km
No. of sites 2 10 27 54 179 497
Average head (m) 225 301 397 424 470 565
Average energy storage (GWh) 2 1 3 4 4 4
Total energy storage (GWh) 3 11 85 218 661 1 867
T1 - realisable potential 1 km 2 km 3 km 5 km 5 km/ 50m 10 km 20 km
No. of sites 1 3 7 17 48 225
Average head (m) 292 557 375 446 456 589
Average energy storage (GWh) 3 2 1 2 2 3
Total energy storage (GWh) 3 5 6 35 99 670
T2 - theoretical potential 1 km 2 km 3 km 5 km 5 km/ 50m 10 km 20 km
No. of sites 7 53 113 240 320 381 428
Average head (m) 184 255 335 422 332 558 807
Average energy storage (GWh) 1 2 3 5 4 9 16
Total energy storage (GWh) 9 118 382 1 183 1 345 3 280 6 846
T2 - realisable potential 1 km 2 km 3 km 5 km 5 km/ 50m 10 km 20 km
No. of sites 4 29 67 157 225 307 404
Average head (m) 192 266 306 355 269 465 670
Average energy storage (GWh) 1 3 3 4 3 6 10
Total energy storage (GWh) 1 78 213 633 758 1 833 4 034
Reservoir data (ECRINS)
Italy
0
200
400
600
800
1000
1200
1400
1600
1800
2000
0
20
40
60
80
100
120
GWhNo.of sites
PHS realisable potential (T2)
No. of sites
Total energy storage (GWh)
0
500
1000
1500
2000
2500
3000
3500
4000
4500
0
50
100
150
200
250
300
350
400
450
GWhNo.of sites
PHS realisable potential (T2)
No. of sites
Total energy storage (GWh)

Joint Research Centre Assessment of the European potential for PHS
54
Eurostat data for 2011 GWh
Net electricity production 148 891
Net production natural hydro 2 735
Net production from PHS 422
Net production from wind 3 205
Net production from solar 0
Total variable RES electricity 3 205
PHS generation capacity (MW) 1 406
Conventional hydro generation
capacity (MW)2 346
Total PHS energy storage
capacity11
(Source: Eurelectric's Hydro in Europe: Powering renewables )
No. of reservoirs 41
Of which capacity is inc. 41
Total capacity (Hm3) 2 980
No. of reservoirs selected 41
Capacity of selected reservoirs
(Hm3)
2 980
JRC assessmentT1 - theoretical potential 1 km 2 km 3 km 5 km 5 km/ 50m 10 km 20 km
No. of sites 0 0 0 0 0 0
Average head (m) 0 0 0 0 0 0
Average energy storage (GWh) 0 0 0 0 0 0
Total energy storage (GWh) 0 0 0 0 0 0
T1 - realisable potential 1 km 2 km 3 km 5 km 5 km/ 50m 10 km 20 km
No. of sites 0 0 0 0 0 0
Average head (m) 0 0 0 0 0 0
Average energy storage (GWh) 0 0 0 0 0 0
Total energy storage (GWh) 0 0 0 0 0 0
T2 - theoretical potential 1 km 2 km 3 km 5 km 5 km/ 50m 10 km 20 km
No. of sites 0 2 5 12 20 20 28
Average head (m) 0 173 191 238 166 251 415
Average energy storage (GWh) 0 1 1 2 2 6 13
Total energy storage (GWh) 0 2 6 19 47 111 350
T2 - realisable potential 1 km 2 km 3 km 5 km 5 km/ 50m 10 km 20 km
No. of sites 0 1 1 9 16 14 20
Average head (m) 0 175 153 252 183 238 240
Average energy storage (GWh) 0 1 1 2 1 3 4
Total energy storage (GWh) 0 1 1 15 20 48 73
Reservoir data (ECRINS)
Poland
0
10
20
30
40
50
60
70
80
0
5
10
15
20
25
GWhNo.of sites
PHS realisable potential (T2)
No. of sites
Total energy storage (GWh)

Joint Research Centre Assessment of the European potential for PHS
55
Eurostat data for 2011 GWh
Net electricity production 51 124
Net production natural hydro 11 987
Net production from PHS 564
Net production from wind 9 102
Net production from solar 277
Total variable RES electricity 9 379
PHS generation capacity (MW) 1 029
Conventional hydro generation
capacity (MW)5 551
Total PHS energy storage
capacity107
(Source: Eurelectric's Hydro in Europe: Powering renewables )
No. of reservoirs 107
Of which capacity is inc. 103
Total capacity (Hm3) 11 885
No. of reservoirs selected 102
Capacity of selected reservoirs
(Hm3)
11 885
JRC assessmentT1 - theoretical potential 1 km 2 km 3 km 5 km 5 km/ 50m 10 km 20 km
No. of sites 0 0 0 3 15 40
Average head (m) 0 0 0 258 260 365
Average energy storage (GWh) 0 0 0 2 8 14
Total energy storage (GWh) 0 0 0 7 118 542
T1 - realisable potential 1 km 2 km 3 km 5 km 5 km/ 50m 10 km 20 km
No. of sites 0 0 0 0 5 12
Average head (m) 0 0 0 0 214 302
Average energy storage (GWh) 0 0 0 0 6 5
Total energy storage (GWh) 0 0 0 0 29 60
T2 - theoretical potential 1 km 2 km 3 km 5 km 5 km/ 50m 10 km 20 km
No. of sites 0 16 33 55 75 68 87
Average head (m) 0 244 263 322 248 397 492
Average energy storage (GWh) 0 3 5 3 3 9 17
Total energy storage (GWh) 0 54 173 151 192 594 1 472
T2 - realisable potential 1 km 2 km 3 km 5 km 5 km/ 50m 10 km 20 km
No. of sites 0 5 18 36 55 56 83
Average head (m) 0 218 250 303 228 372 438
Average energy storage (GWh) 0 2 2 3 2 7 15
Total energy storage (GWh) 0 8 43 99 133 372 1 209
Reservoir data (ECRINS)
Portugal
0
200
400
600
800
1000
1200
1400
0
10
20
30
40
50
60
70
80
90
GWhNo.of sites
PHS realisable potential (T2)
No. of sites
Total energy storage (GWh)

Joint Research Centre Assessment of the European potential for PHS
56
Eurostat data for 2011 GWh
Net electricity production 56 491
Net production natural hydro 14 788
Net production from PHS 218
Net production from wind 1 390
Net production from solar 0
Total variable RES electricity 1 390
PHS generation capacity (MW) 92
Conventional hydro generation
capacity (MW)6 483
Total PHS energy storage
capacityNo data
(Source: Eurelectric's Hydro in Europe: Powering renewables )
No. of reservoirs 126
Of which capacity is inc. 126
Total capacity (Hm3) 7 264
No. of reservoirs selected 125
Capacity of selected reservoirs
(Hm3)
7 264
JRC assessmentT1 - theoretical potential 1 km 2 km 3 km 5 km 5 km/ 50m 10 km 20 km
No. of sites 0 0 0 0 2 11
Average head (m) 0 0 0 0 226 331
Average energy storage (GWh) 0 0 0 0 2 4
Total energy storage (GWh) 0 0 0 0 3 44
T1 - realisable potential 1 km 2 km 3 km 5 km 5 km/ 50m 10 km 20 km
No. of sites 0 0 0 0 0 0
Average head (m) 0 0 0 0 0 0
Average energy storage (GWh) 0 0 0 0 0 0
Total energy storage (GWh) 0 0 0 0 0 0
T2 - theoretical potential 1 km 2 km 3 km 5 km 5 km/ 50m 10 km 20 km
No. of sites 0 4 13 41 74 73 103
Average head (m) 0 225 245 255 170 318 426
Average energy storage (GWh) 0 3 3 4 3 8 14
Total energy storage (GWh) 0 11 38 165 226 556 1 429
T2 - realisable potential 1 km 2 km 3 km 5 km 5 km/ 50m 10 km 20 km
No. of sites 0 2 7 25 55 54 91
Average head (m) 0 295 217 245 154 258 327
Average energy storage (GWh) 0 3 3 3 2 5 8
Total energy storage (GWh) 0 7 18 83 124 286 719
Reservoir data (ECRINS)
Romania
0
100
200
300
400
500
600
700
800
0
10
20
30
40
50
60
70
80
90
100
GWhNo.of sites
PHS realisable potential (T2)
No. of sites
Total energy storage (GWh)
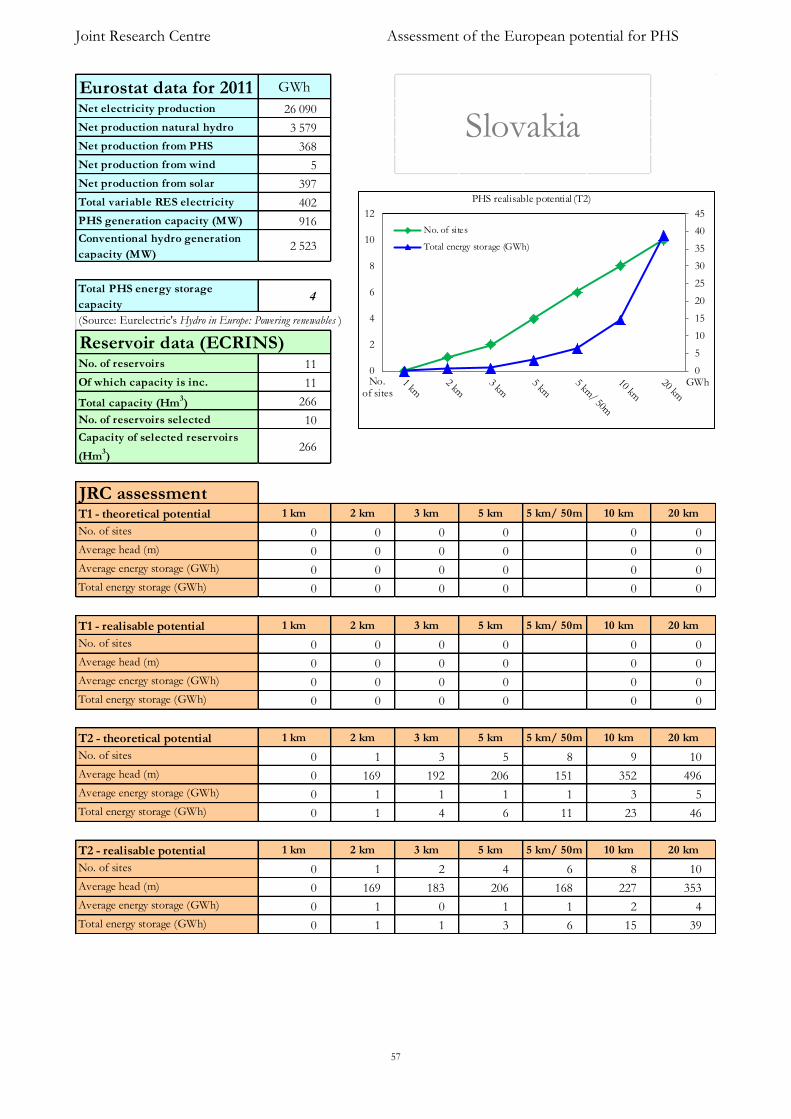
Joint Research Centre Assessment of the European potential for PHS
57
Eurostat data for 2011 GWh
Net electricity production 26 090
Net production natural hydro 3 579
Net production from PHS 368
Net production from wind 5
Net production from solar 397
Total variable RES electricity 402
PHS generation capacity (MW) 916
Conventional hydro generation
capacity (MW)2 523
Total PHS energy storage
capacity4
(Source: Eurelectric's Hydro in Europe: Powering renewables )
No. of reservoirs 11
Of which capacity is inc. 11
Total capacity (Hm3) 266
No. of reservoirs selected 10
Capacity of selected reservoirs
(Hm3)
266
JRC assessmentT1 - theoretical potential 1 km 2 km 3 km 5 km 5 km/ 50m 10 km 20 km
No. of sites 0 0 0 0 0 0
Average head (m) 0 0 0 0 0 0
Average energy storage (GWh) 0 0 0 0 0 0
Total energy storage (GWh) 0 0 0 0 0 0
T1 - realisable potential 1 km 2 km 3 km 5 km 5 km/ 50m 10 km 20 km
No. of sites 0 0 0 0 0 0
Average head (m) 0 0 0 0 0 0
Average energy storage (GWh) 0 0 0 0 0 0
Total energy storage (GWh) 0 0 0 0 0 0
T2 - theoretical potential 1 km 2 km 3 km 5 km 5 km/ 50m 10 km 20 km
No. of sites 0 1 3 5 8 9 10
Average head (m) 0 169 192 206 151 352 496
Average energy storage (GWh) 0 1 1 1 1 3 5
Total energy storage (GWh) 0 1 4 6 11 23 46
T2 - realisable potential 1 km 2 km 3 km 5 km 5 km/ 50m 10 km 20 km
No. of sites 0 1 2 4 6 8 10
Average head (m) 0 169 183 206 168 227 353
Average energy storage (GWh) 0 1 0 1 1 2 4
Total energy storage (GWh) 0 1 1 3 6 15 39
Reservoir data (ECRINS)
Slovakia
0
5
10
15
20
25
30
35
40
45
0
2
4
6
8
10
12
GWhNo.of sites
PHS realisable potential (T2)
No. of sites
Total energy storage (GWh)

Joint Research Centre Assessment of the European potential for PHS
58
Eurostat data for 2011 GWh
Net electricity production 14 998
Net production natural hydro 3 646
Net production from PHS 143
Net production from wind 0
Net production from solar 66
Total variable RES electricity 66
PHS generation capacity (MW) 180
Conventional hydro generation
capacity (MW)1 253
Total PHS energy storage
capacityNo data
(Source: Eurelectric's Hydro in Europe: Powering renewables )
No. of reservoirs 7
Of which capacity is inc. 6
Total capacity (Hm3) 33
No. of reservoirs selected 6
Capacity of selected reservoirs
(Hm3)
33
JRC assessmentT1 - theoretical potential 1 km 2 km 3 km 5 km 5 km/ 50m 10 km 20 km
No. of sites 0 0 0 0 0 0
Average head (m) 0 0 0 0 0 0
Average energy storage (GWh) 0 0 0 0 0 0
Total energy storage (GWh) 0 0 0 0 0 0
T1 - realisable potential 1 km 2 km 3 km 5 km 5 km/ 50m 10 km 20 km
No. of sites 0 0 0 0 0 0
Average head (m) 0 0 0 0 0 0
Average energy storage (GWh) 0 0 0 0 0 0
Total energy storage (GWh) 0 0 0 0 0 0
T2 - theoretical potential 1 km 2 km 3 km 5 km 5 km/ 50m 10 km 20 km
No. of sites 0 0 2 3 4 5 6
Average head (m) 0 0 361 421 332 788 988
Average energy storage (GWh) 0 0 2 4 3 9 13
Total energy storage (GWh) 0 0 5 12 13 47 77
T2 - realisable potential 1 km 2 km 3 km 5 km 5 km/ 50m 10 km 20 km
No. of sites 0 0 2 2 2 5 5
Average head (m) 0 0 361 512 512 575 642
Average energy storage (GWh) 0 0 2 5 5 5 9
Total energy storage (GWh) 0 0 5 11 11 25 45
Reservoir data (ECRINS)
Slovenia
0
5
10
15
20
25
30
35
40
45
50
0
1
2
3
4
5
6
GWhNo.of sites
PHS realisable potential (T2)
No. of sites
Total energy storage (GWh)

Joint Research Centre Assessment of the European potential for PHS
59
Eurostat data for 2011 GWh
Net electricity production 281 304
Net production natural hydro 32 345
Net production from PHS 2 275
Net production from wind 41 398
Net production from solar 8 561
Total variable RES electricity 49 959
PHS generation capacity (MW) 5 260
Conventional hydro generation
capacity (MW)18 540
Total PHS energy storage
capacity1 530
(Source: Eurelectric's Hydro in Europe: Powering renewables )
No. of reservoirs 1 425
Of which capacity is inc. 1 320
Total capacity (Hm3) 64 718
No. of reservoirs selected 1 230
Capacity of selected reservoirs
(Hm3)
64 715
JRC assessmentT1 - theoretical potential 1 km 2 km 3 km 5 km 5 km/ 50m 10 km 20 km
No. of sites 2 24 70 175 652 2 912
Average head (m) 181 263 276 293 371 513
Average energy storage (GWh) 0 1 2 2 2 2
Total energy storage (GWh) 0 34 132 292 1 182 5 788
T1 - realisable potential 1 km 2 km 3 km 5 km 5 km/ 50m 10 km 20 km
No. of sites 0 3 9 32 165 1 305
Average head (m) 0 310 271 323 370 531
Average energy storage (GWh) 0 4 3 3 2 1
Total energy storage (GWh) 0 12 23 93 362 1 894
T2 - theoretical potential 1 km 2 km 3 km 5 km 5 km/ 50m 10 km 20 km
No. of sites 21 122 256 523 847 865 1 080
Average head (m) 204 256 271 323 230 435 618
Average energy storage (GWh) 1 2 3 4 4 8 16
Total energy storage (GWh) 28 264 676 2 096 3 192 7 235 17 596
T2 - realisable potential 1 km 2 km 3 km 5 km 5 km/ 50m 10 km 20 km
No. of sites 11 54 121 286 544 639 1 005
Average head (m) 221 260 251 275 186 330 456
Average energy storage (GWh) 1 2 2 3 2 5 9
Total energy storage (GWh) 1 96 263 915 1 329 3 507 9 363
Reservoir data (ECRINS)
Spain
0
200
400
600
800
1000
1200
1400
1600
1800
2000
0
20
40
60
80
100
120
GWhNo.of sites
PHS realisable potential (T2)
No. of sites
Total energy storage (GWh)
0
1000
2000
3000
4000
5000
6000
7000
8000
9000
10000
0
200
400
600
800
1000
1200
GWhNo.of sites
PHS realisable potential (T2)
No. of sites
Total energy storage (GWh)

Joint Research Centre Assessment of the European potential for PHS
60
Eurostat data for 2011 GWh
Net electricity production 146 936
Net production natural hydro 66 169
Net production from PHS 122
Net production from wind 6 078
Net production from solar 11
Total variable RES electricity 6 089
PHS generation capacity (MW) 99
Conventional hydro generation
capacity (MW)16 478
Total PHS energy storage
capacityNo data
(Source: Eurelectric's Hydro in Europe: Powering renewables )
No. of reservoirs 193
Of which capacity is inc. 182
Total capacity (Hm3) 40 518
No. of reservoirs selected 148
Capacity of selected reservoirs
(Hm3)
40 518
JRC assessmentT1 - theoretical potential 1 km 2 km 3 km 5 km 5 km/ 50m 10 km 20 km
No. of sites 0 0 0 0 1 6
Average head (m) 0 0 0 0 222 209
Average energy storage (GWh) 0 0 0 0 22 8
Total energy storage (GWh) 0 0 0 0 22 51
T1 - realisable potential 1 km 2 km 3 km 5 km 5 km/ 50m 10 km 20 km
No. of sites 0 0 0 0 0 1
Average head (m) 0 0 0 0 0 188
Average energy storage (GWh) 0 0 0 0 0 0
Total energy storage (GWh) 0 0 0 0 0 0
T2 - theoretical potential 1 km 2 km 3 km 5 km 5 km/ 50m 10 km 20 km
No. of sites 20 18 53 54 86 86 127
Average head (m) 301 199 292 237 175 317 493
Average energy storage (GWh) 14 5 28 12 15 46 80
Total energy storage (GWh) 278 84 1 468 661 1 319 3 963 10 160
T2 - realisable potential 1 km 2 km 3 km 5 km 5 km/ 50m 10 km 20 km
No. of sites 8 11 28 38 67 69 116
Average head (m) 294 200 289 221 164 316 493
Average energy storage (GWh) 16 4 20 7 7 16 27
Total energy storage (GWh) 16 47 557 283 440 1 102 3 081
Reservoir data (ECRINS)
Sweden
0
500
1000
1500
2000
2500
3000
3500
0
20
40
60
80
100
120
140
GWhNo.of sites
PHS realisable potential (T2)
No. of sites
Total energy storage (GWh)

Joint Research Centre Assessment of the European potential for PHS
61
Eurostat data for 2011 GWh
Net electricity production 351 347
Net production natural hydro 8 545
Net production from PHS 2 895
Net production from wind 15 497
Net production from solar 252
Total variable RES electricity 15 749
PHS generation capacity (MW) 2 744
Conventional hydro generation
capacity (MW)4 420
Total PHS energy storage
capacity33
(Source: Eurelectric's Hydro in Europe: Powering renewables )
No. of reservoirs 1 528
Of which capacity is inc. 1 236
Total capacity (Hm3) 8 256
No. of reservoirs selected 915
Capacity of selected reservoirs
(Hm3)
8 238
JRC assessmentT1 - theoretical potential 1 km 2 km 3 km 5 km 5 km/ 50m 10 km 20 km
No. of sites 0 5 16 68 561 3 264
Average head (m) 0 205 199 195 189 193
Average energy storage (GWh) 0 0 0 0 0 0
Total energy storage (GWh) 0 2 4 23 199 994
T1 - realisable potential 1 km 2 km 3 km 5 km 5 km/ 50m 10 km 20 km
No. of sites 0 0 3 21 166 805
Average head (m) 0 0 226 192 197 201
Average energy storage (GWh) 0 0 0 0 1 1
Total energy storage (GWh) 0 0 0 4 106 501
T2 - theoretical potential 1 km 2 km 3 km 5 km 5 km/ 50m 10 km 20 km
No. of sites 10 185 330 457 648 633 804
Average head (m) 181 203 215 237 193 290 377
Average energy storage (GWh) 1 1 2 3 2 4 8
Total energy storage (GWh) 7 248 580 1 144 1 397 2 399 6 120
T2 - realisable potential 1 km 2 km 3 km 5 km 5 km/ 50m 10 km 20 km
No. of sites 5 121 228 372 601 590 781
Average head (m) 186 201 213 228 176 255 391
Average energy storage (GWh) 1 1 1 2 2 3 7
Total energy storage (GWh) 1 141 330 750 981 1 749 5 292
Reservoir data (ECRINS)
United Kingdom
0
1000
2000
3000
4000
5000
6000
0
100
200
300
400
500
600
700
800
900
GWhNo.of sites
PHS realisable potential (T2)
No. of sites
Total energy storage (GWh)

Joint Research Centre Assessment of the European potential for PHS
62
Eurostat data for 2010 GWh
Net electricity production 13 635
Net production natural hydro 8 325
Net production from PHS 106
Net production from wind 139
Net production from solar 0
Total variable RES electricity 139
PHS generation capacity (MW) 293
Conventional hydro generation
capacity (MW)2 141
Total PHS energy storage
capacityNo data
(Source: Eurelectric's Hydro in Europe: Powering renewables )
No. of reservoirs 29
Of which capacity is inc. 26
Total capacity (Hm3) 1 014
No. of reservoirs selected 26
Capacity of selected reservoirs
(Hm3)
1 014
JRC assessmentT1 - theoretical potential 1 km 2 km 3 km 5 km 5 km/ 50m 10 km 20 km
No. of sites 0 0 0 0 0 1
Average head (m) 0 0 0 0 0 543
Average energy storage (GWh) 0 0 0 0 0 2
Total energy storage (GWh) 0 0 0 0 0 2
T1 - realisable potential 1 km 2 km 3 km 5 km 5 km/ 50m 10 km 20 km
No. of sites 0 0 0 0 0 0
Average head (m) 0 0 0 0 0 0
Average energy storage (GWh) 0 0 0 0 0 0
Total energy storage (GWh) 0 0 0 0 0 0
T2 - theoretical potential 1 km 2 km 3 km 5 km 5 km/ 50m 10 km 20 km
No. of sites 1 6 13 16 21 21 29
Average head (m) 159 188 222 310 241 452 581
Average energy storage (GWh) 6 3 3 4 8 23 25
Total energy storage (GWh) 6 18 42 64 160 486 719
T2 - realisable potential 1 km 2 km 3 km 5 km 5 km/ 50m 10 km 20 km
No. of sites 1 2 7 12 15 15 27
Average head (m) 159 183 240 273 220 332 465
Average energy storage (GWh) 6 8 5 4 3 20 15
Total energy storage (GWh) 6 15 34 47 50 294 408
Reservoir data (ECRINS)
Croatia
0
50
100
150
200
250
300
350
400
450
0
5
10
15
20
25
30
GWhNo.of sites
PHS realisable potential (T2)
No. of sites
Total energy storage (GWh)
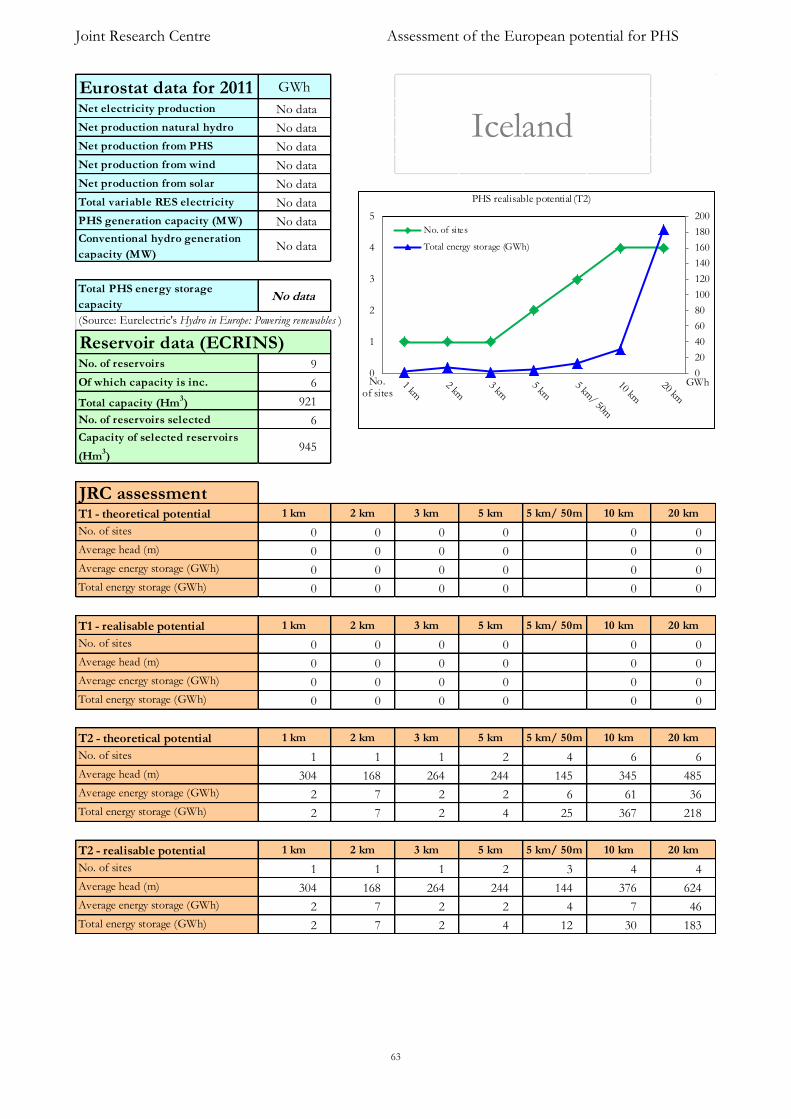
Joint Research Centre Assessment of the European potential for PHS
63
Eurostat data for 2011 GWh
Net electricity production No data
Net production natural hydro No data
Net production from PHS No data
Net production from wind No data
Net production from solar No data
Total variable RES electricity No data
PHS generation capacity (MW) No data
Conventional hydro generation
capacity (MW)No data
Total PHS energy storage
capacityNo data
(Source: Eurelectric's Hydro in Europe: Powering renewables )
No. of reservoirs 9
Of which capacity is inc. 6
Total capacity (Hm3) 921
No. of reservoirs selected 6
Capacity of selected reservoirs
(Hm3)
945
JRC assessmentT1 - theoretical potential 1 km 2 km 3 km 5 km 5 km/ 50m 10 km 20 km
No. of sites 0 0 0 0 0 0
Average head (m) 0 0 0 0 0 0
Average energy storage (GWh) 0 0 0 0 0 0
Total energy storage (GWh) 0 0 0 0 0 0
T1 - realisable potential 1 km 2 km 3 km 5 km 5 km/ 50m 10 km 20 km
No. of sites 0 0 0 0 0 0
Average head (m) 0 0 0 0 0 0
Average energy storage (GWh) 0 0 0 0 0 0
Total energy storage (GWh) 0 0 0 0 0 0
T2 - theoretical potential 1 km 2 km 3 km 5 km 5 km/ 50m 10 km 20 km
No. of sites 1 1 1 2 4 6 6
Average head (m) 304 168 264 244 145 345 485
Average energy storage (GWh) 2 7 2 2 6 61 36
Total energy storage (GWh) 2 7 2 4 25 367 218
T2 - realisable potential 1 km 2 km 3 km 5 km 5 km/ 50m 10 km 20 km
No. of sites 1 1 1 2 3 4 4
Average head (m) 304 168 264 244 144 376 624
Average energy storage (GWh) 2 7 2 2 4 7 46
Total energy storage (GWh) 2 7 2 4 12 30 183
Reservoir data (ECRINS)
Iceland
0
20
40
60
80
100
120
140
160
180
200
0
1
2
3
4
5
GWhNo.of sites
PHS realisable potential (T2)
No. of sites
Total energy storage (GWh)

Joint Research Centre Assessment of the European potential for PHS
64
Eurostat data for 2011 GWh
Net electricity production No data
Net production natural hydro No data
Net production from PHS No data
Net production from wind No data
Net production from solar No data
Total variable RES electricity No data
PHS generation capacity (MW) No data
Conventional hydro generation
capacity (MW)No data
Total PHS energy storage
capacityNo data
(Source: Eurelectric's Hydro in Europe: Powering renewables )
No. of reservoirs 6
Of which capacity is inc. 6
Total capacity (Hm3) 1 052
No. of reservoirs selected 6
Capacity of selected reservoirs
(Hm3)
1 052
JRC assessmentT1 - theoretical potential 1 km 2 km 3 km 5 km 5 km/ 50m 10 km 20 km
No. of sites 0 0 0 0 0 0
Average head (m) 0 0 0 0 0 0
Average energy storage (GWh) 0 0 0 0 0 0
Total energy storage (GWh) 0 0 0 0 0 0
T1 - realisable potential 1 km 2 km 3 km 5 km 5 km/ 50m 10 km 20 km
No. of sites 0 0 0 0 0 0
Average head (m) 0 0 0 0 0 0
Average energy storage (GWh) 0 0 0 0 0 0
Total energy storage (GWh) 0 0 0 0 0 0
T2 - theoretical potential 1 km 2 km 3 km 5 km 5 km/ 50m 10 km 20 km
No. of sites 0 2 4 6 6 6 6
Average head (m) 0 552 338 428 428 558 734
Average energy storage (GWh) 0 10 6 32 32 105 161
Total energy storage (GWh) 0 20 25 190 190 633 966
T2 - realisable potential 1 km 2 km 3 km 5 km 5 km/ 50m 10 km 20 km
No. of sites 0 2 4 6 6 6 6
Average head (m) 0 552 403 439 439 563 715
Average energy storage (GWh) 0 10 5 11 11 33 63
Total energy storage (GWh) 0 20 21 69 69 196 377
Reservoir data (ECRINS)
Montenegro
0
50
100
150
200
250
300
350
400
0
1
2
3
4
5
6
7
GWhNo.of sites
PHS realisable potential (T2)
No. of sites
Total energy storage (GWh)

Joint Research Centre Assessment of the European potential for PHS
65
Eurostat data for 2011 GWh
Net electricity production No data
Net production natural hydro No data
Net production from PHS No data
Net production from wind No data
Net production from solar No data
Total variable RES electricity No data
PHS generation capacity (MW) No data
Conventional hydro generation
capacity (MW)No data
Total PHS energy storage
capacityNo data
(Source: Eurelectric's Hydro in Europe: Powering renewables )
No. of reservoirs 69
Of which capacity is inc. 68
Total capacity (Hm3) 7 778
No. of reservoirs selected 67
Capacity of selected reservoirs
(Hm3)
7 778
JRC assessmentT1 - theoretical potential 1 km 2 km 3 km 5 km 5 km/ 50m 10 km 20 km
No. of sites 0 0 0 0 1 15
Average head (m) 0 0 0 0 645 344
Average energy storage (GWh) 0 0 0 0 1 22
Total energy storage (GWh) 0 0 0 0 1 327
T1 - realisable potential 1 km 2 km 3 km 5 km 5 km/ 50m 10 km 20 km
No. of sites 0 0 0 0 0 4
Average head (m) 0 0 0 0 0 414
Average energy storage (GWh) 0 0 0 0 0 66
Total energy storage (GWh) 0 0 0 0 0 265
T2 - theoretical potential 1 km 2 km 3 km 5 km 5 km/ 50m 10 km 20 km
No. of sites 1 7 17 26 39 46 51
Average head (m) 181 302 296 335 245 416 500
Average energy storage (GWh) 1 5 3 5 4 7 13
Total energy storage (GWh) 1 32 50 131 157 323 638
T2 - realisable potential 1 km 2 km 3 km 5 km 5 km/ 50m 10 km 20 km
No. of sites 1 5 13 22 35 42 47
Average head (m) 181 309 299 352 247 405 486
Average energy storage (GWh) 1 6 3 5 4 7 12
Total energy storage (GWh) 1 29 37 109 125 274 577
Reservoir data (ECRINS)
Serbia
0
100
200
300
400
500
600
700
0
5
10
15
20
25
30
35
40
45
50
GWhNo.of sites
PHS realisable potential (T2)
No. of sites
Total energy storage (GWh)
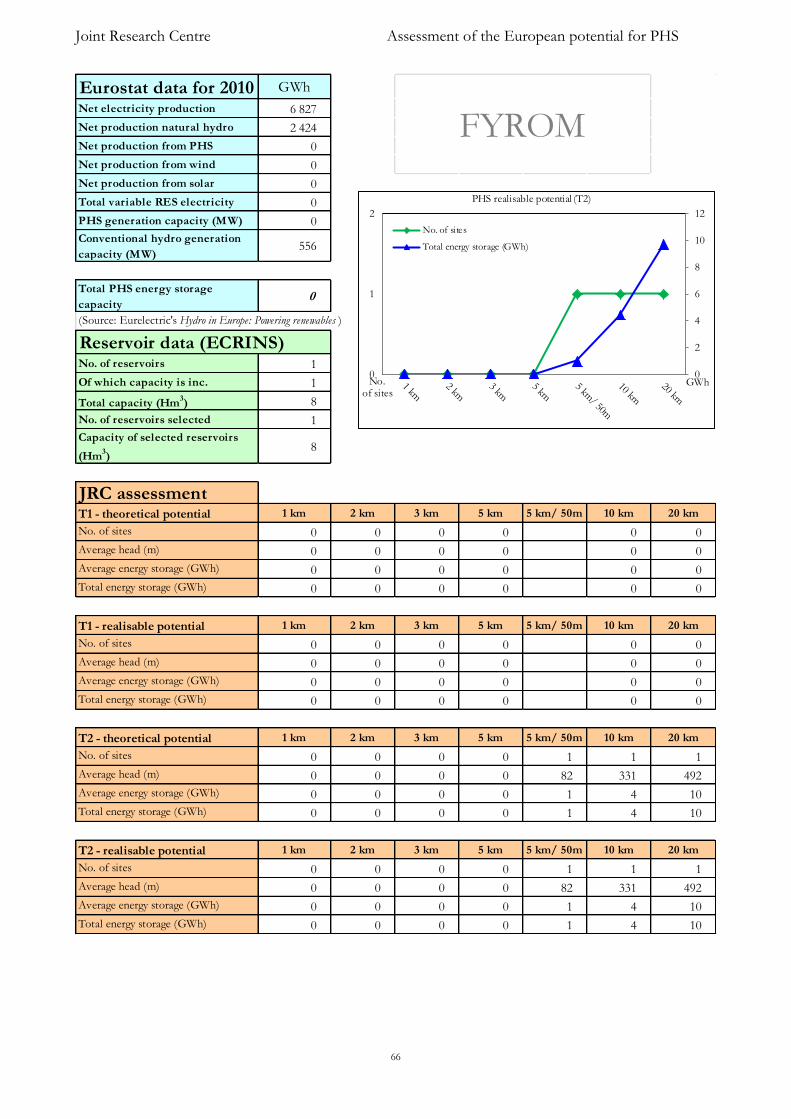
Joint Research Centre Assessment of the European potential for PHS
66
Eurostat data for 2010 GWh
Net electricity production 6 827
Net production natural hydro 2 424
Net production from PHS 0
Net production from wind 0
Net production from solar 0
Total variable RES electricity 0
PHS generation capacity (MW) 0
Conventional hydro generation
capacity (MW)556
Total PHS energy storage
capacity0
(Source: Eurelectric's Hydro in Europe: Powering renewables )
No. of reservoirs 1
Of which capacity is inc. 1
Total capacity (Hm3) 8
No. of reservoirs selected 1
Capacity of selected reservoirs
(Hm3)
8
JRC assessmentT1 - theoretical potential 1 km 2 km 3 km 5 km 5 km/ 50m 10 km 20 km
No. of sites 0 0 0 0 0 0
Average head (m) 0 0 0 0 0 0
Average energy storage (GWh) 0 0 0 0 0 0
Total energy storage (GWh) 0 0 0 0 0 0
T1 - realisable potential 1 km 2 km 3 km 5 km 5 km/ 50m 10 km 20 km
No. of sites 0 0 0 0 0 0
Average head (m) 0 0 0 0 0 0
Average energy storage (GWh) 0 0 0 0 0 0
Total energy storage (GWh) 0 0 0 0 0 0
T2 - theoretical potential 1 km 2 km 3 km 5 km 5 km/ 50m 10 km 20 km
No. of sites 0 0 0 0 1 1 1
Average head (m) 0 0 0 0 82 331 492
Average energy storage (GWh) 0 0 0 0 1 4 10
Total energy storage (GWh) 0 0 0 0 1 4 10
T2 - realisable potential 1 km 2 km 3 km 5 km 5 km/ 50m 10 km 20 km
No. of sites 0 0 0 0 1 1 1
Average head (m) 0 0 0 0 82 331 492
Average energy storage (GWh) 0 0 0 0 1 4 10
Total energy storage (GWh) 0 0 0 0 1 4 10
Reservoir data (ECRINS)
FYROM
0
2
4
6
8
10
12
0
1
2
GWhNo.of sites
PHS realisable potential (T2)
No. of sites
Total energy storage (GWh)
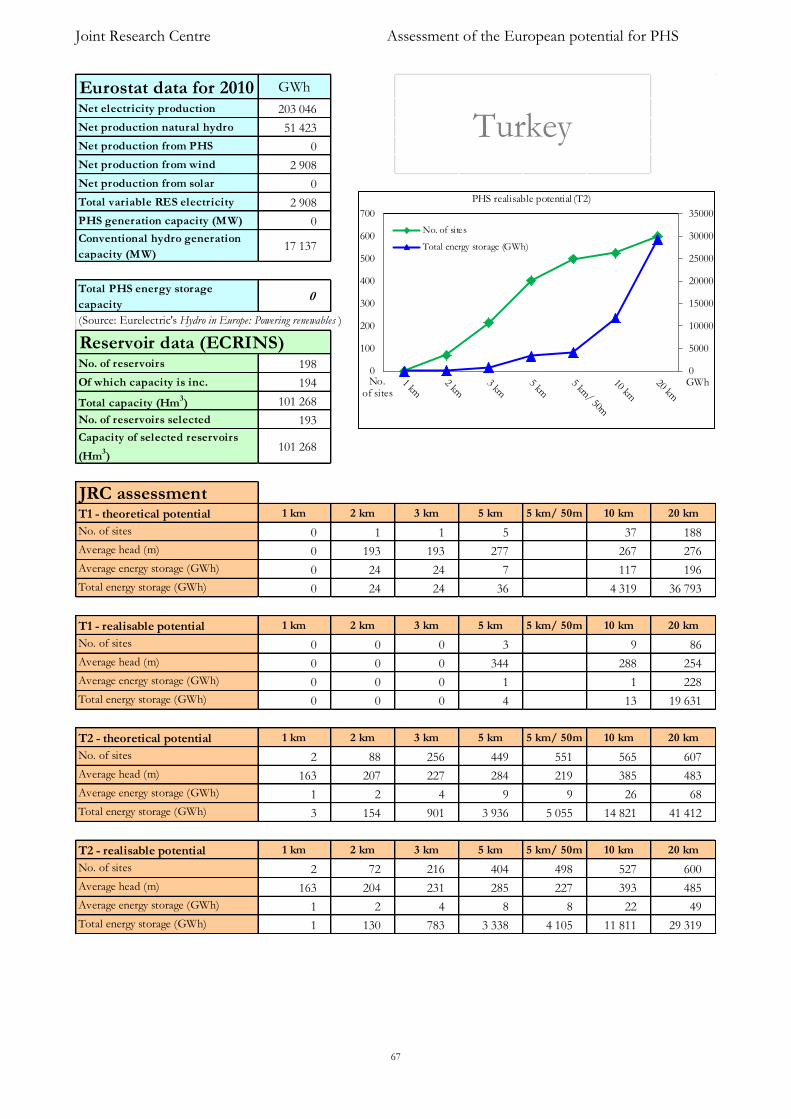
Joint Research Centre Assessment of the European potential for PHS
67
Eurostat data for 2010 GWh
Net electricity production 203 046
Net production natural hydro 51 423
Net production from PHS 0
Net production from wind 2 908
Net production from solar 0
Total variable RES electricity 2 908
PHS generation capacity (MW) 0
Conventional hydro generation
capacity (MW)17 137
Total PHS energy storage
capacity0
(Source: Eurelectric's Hydro in Europe: Powering renewables )
No. of reservoirs 198
Of which capacity is inc. 194
Total capacity (Hm3) 101 268
No. of reservoirs selected 193
Capacity of selected reservoirs
(Hm3)
101 268
JRC assessmentT1 - theoretical potential 1 km 2 km 3 km 5 km 5 km/ 50m 10 km 20 km
No. of sites 0 1 1 5 37 188
Average head (m) 0 193 193 277 267 276
Average energy storage (GWh) 0 24 24 7 117 196
Total energy storage (GWh) 0 24 24 36 4 319 36 793
T1 - realisable potential 1 km 2 km 3 km 5 km 5 km/ 50m 10 km 20 km
No. of sites 0 0 0 3 9 86
Average head (m) 0 0 0 344 288 254
Average energy storage (GWh) 0 0 0 1 1 228
Total energy storage (GWh) 0 0 0 4 13 19 631
T2 - theoretical potential 1 km 2 km 3 km 5 km 5 km/ 50m 10 km 20 km
No. of sites 2 88 256 449 551 565 607
Average head (m) 163 207 227 284 219 385 483
Average energy storage (GWh) 1 2 4 9 9 26 68
Total energy storage (GWh) 3 154 901 3 936 5 055 14 821 41 412
T2 - realisable potential 1 km 2 km 3 km 5 km 5 km/ 50m 10 km 20 km
No. of sites 2 72 216 404 498 527 600
Average head (m) 163 204 231 285 227 393 485
Average energy storage (GWh) 1 2 4 8 8 22 49
Total energy storage (GWh) 1 130 783 3 338 4 105 11 811 29 319
Reservoir data (ECRINS)
Turkey
0
5000
10000
15000
20000
25000
30000
35000
0
100
200
300
400
500
600
700
GWhNo.of sites
PHS realisable potential (T2)
No. of sites
Total energy storage (GWh)
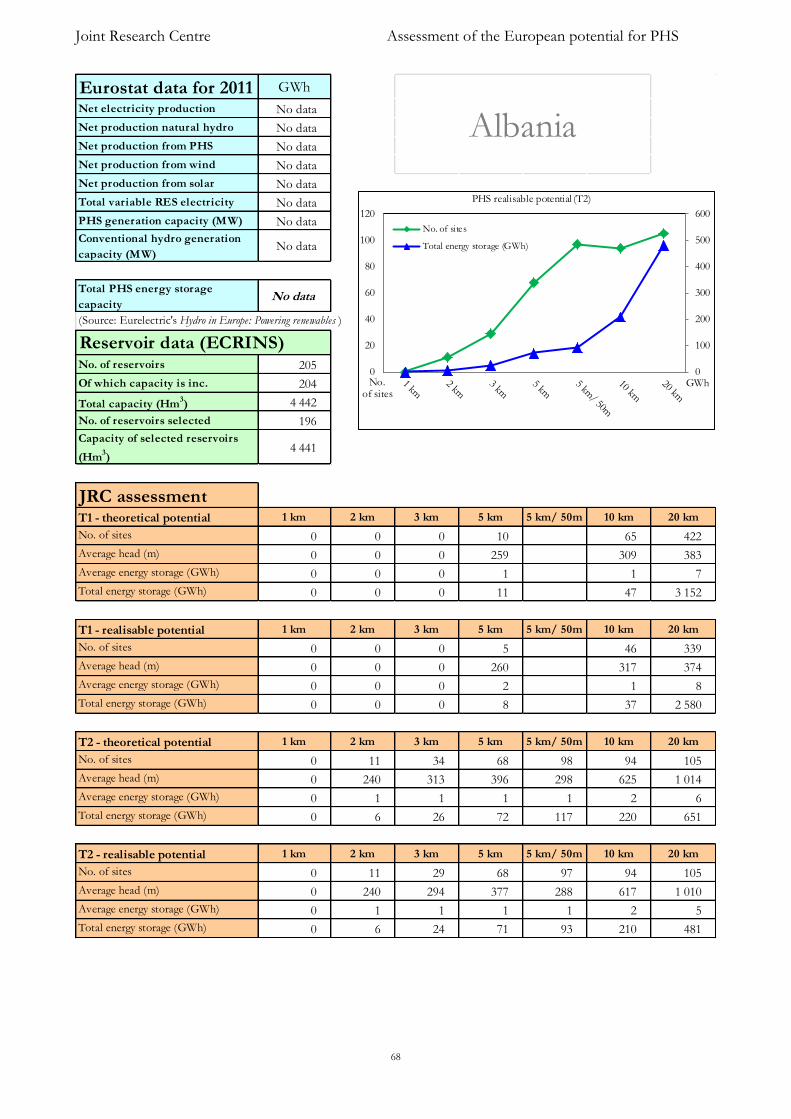
Joint Research Centre Assessment of the European potential for PHS
68
Eurostat data for 2011 GWh
Net electricity production No data
Net production natural hydro No data
Net production from PHS No data
Net production from wind No data
Net production from solar No data
Total variable RES electricity No data
PHS generation capacity (MW) No data
Conventional hydro generation
capacity (MW)No data
Total PHS energy storage
capacityNo data
(Source: Eurelectric's Hydro in Europe: Powering renewables )
No. of reservoirs 205
Of which capacity is inc. 204
Total capacity (Hm3) 4 442
No. of reservoirs selected 196
Capacity of selected reservoirs
(Hm3)
4 441
JRC assessmentT1 - theoretical potential 1 km 2 km 3 km 5 km 5 km/ 50m 10 km 20 km
No. of sites 0 0 0 10 65 422
Average head (m) 0 0 0 259 309 383
Average energy storage (GWh) 0 0 0 1 1 7
Total energy storage (GWh) 0 0 0 11 47 3 152
T1 - realisable potential 1 km 2 km 3 km 5 km 5 km/ 50m 10 km 20 km
No. of sites 0 0 0 5 46 339
Average head (m) 0 0 0 260 317 374
Average energy storage (GWh) 0 0 0 2 1 8
Total energy storage (GWh) 0 0 0 8 37 2 580
T2 - theoretical potential 1 km 2 km 3 km 5 km 5 km/ 50m 10 km 20 km
No. of sites 0 11 34 68 98 94 105
Average head (m) 0 240 313 396 298 625 1 014
Average energy storage (GWh) 0 1 1 1 1 2 6
Total energy storage (GWh) 0 6 26 72 117 220 651
T2 - realisable potential 1 km 2 km 3 km 5 km 5 km/ 50m 10 km 20 km
No. of sites 0 11 29 68 97 94 105
Average head (m) 0 240 294 377 288 617 1 010
Average energy storage (GWh) 0 1 1 1 1 2 5
Total energy storage (GWh) 0 6 24 71 93 210 481
Reservoir data (ECRINS)
Albania
0
100
200
300
400
500
600
0
20
40
60
80
100
120
GWhNo.of sites
PHS realisable potential (T2)
No. of sites
Total energy storage (GWh)
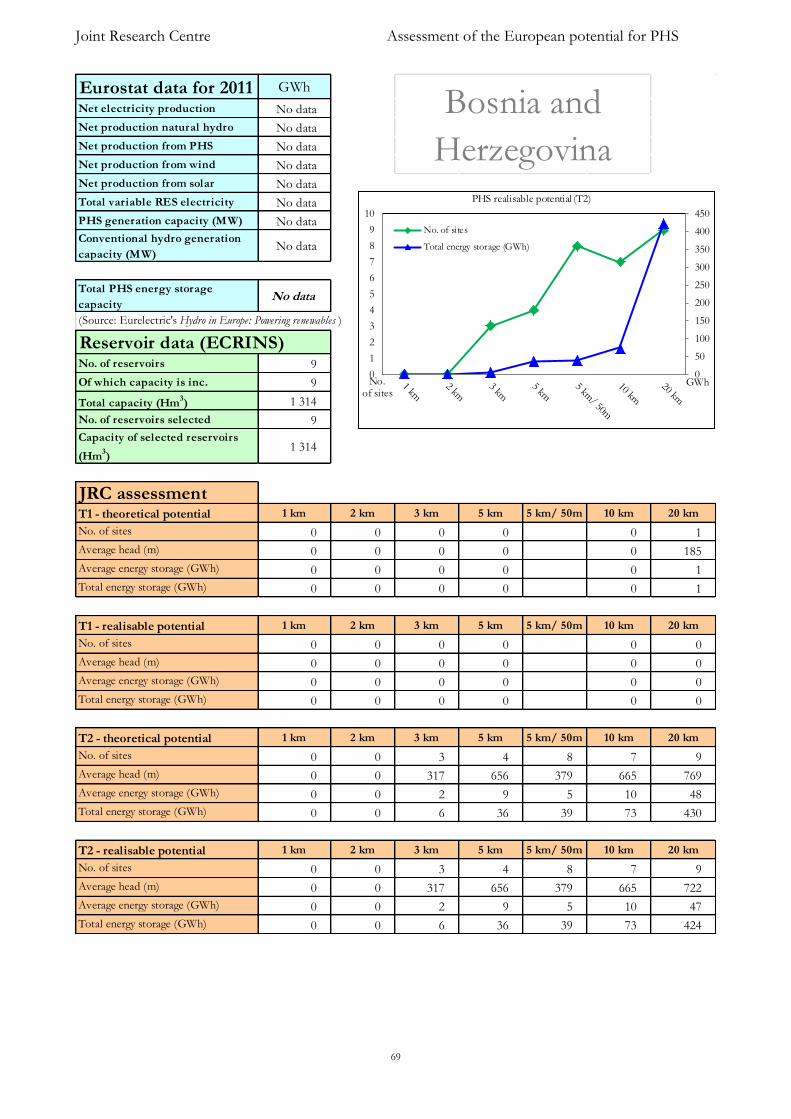
Joint Research Centre Assessment of the European potential for PHS
69
Eurostat data for 2011 GWh
Net electricity production No data
Net production natural hydro No data
Net production from PHS No data
Net production from wind No data
Net production from solar No data
Total variable RES electricity No data
PHS generation capacity (MW) No data
Conventional hydro generation
capacity (MW)No data
Total PHS energy storage
capacityNo data
(Source: Eurelectric's Hydro in Europe: Powering renewables )
No. of reservoirs 9
Of which capacity is inc. 9
Total capacity (Hm3) 1 314
No. of reservoirs selected 9
Capacity of selected reservoirs
(Hm3)
1 314
JRC assessmentT1 - theoretical potential 1 km 2 km 3 km 5 km 5 km/ 50m 10 km 20 km
No. of sites 0 0 0 0 0 1
Average head (m) 0 0 0 0 0 185
Average energy storage (GWh) 0 0 0 0 0 1
Total energy storage (GWh) 0 0 0 0 0 1
T1 - realisable potential 1 km 2 km 3 km 5 km 5 km/ 50m 10 km 20 km
No. of sites 0 0 0 0 0 0
Average head (m) 0 0 0 0 0 0
Average energy storage (GWh) 0 0 0 0 0 0
Total energy storage (GWh) 0 0 0 0 0 0
T2 - theoretical potential 1 km 2 km 3 km 5 km 5 km/ 50m 10 km 20 km
No. of sites 0 0 3 4 8 7 9
Average head (m) 0 0 317 656 379 665 769
Average energy storage (GWh) 0 0 2 9 5 10 48
Total energy storage (GWh) 0 0 6 36 39 73 430
T2 - realisable potential 1 km 2 km 3 km 5 km 5 km/ 50m 10 km 20 km
No. of sites 0 0 3 4 8 7 9
Average head (m) 0 0 317 656 379 665 722
Average energy storage (GWh) 0 0 2 9 5 10 47
Total energy storage (GWh) 0 0 6 36 39 73 424
Reservoir data (ECRINS)
Bosnia and
Herzegovina
0
200
400
600
800
1000
1200
1400
1600
1800
2000
0
20
40
60
80
100
120
GWhNo.of sites
PHS realisable potential (T2)
No. of sites
Total energy storage (GWh)
0
50
100
150
200
250
300
350
400
450
0
1
2
3
4
5
6
7
8
9
10
GWhNo.of sites
PHS realisable potential (T2)
No. of sites
Total energy storage (GWh)
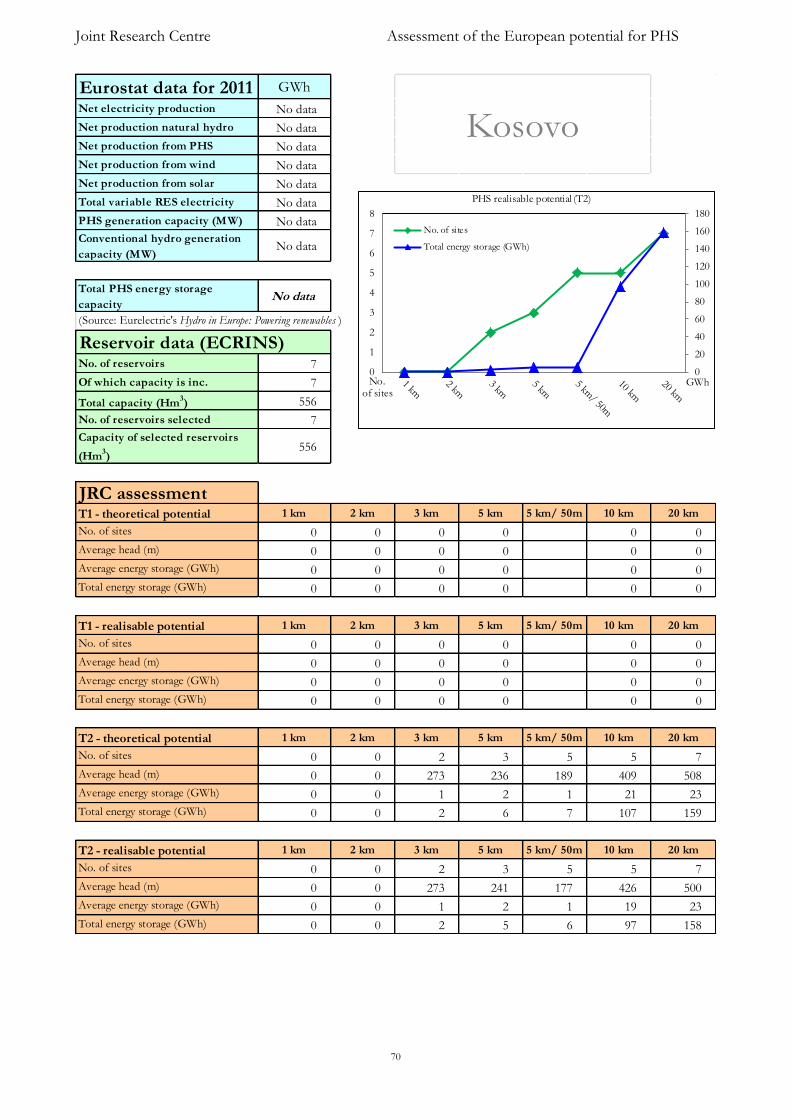
Joint Research Centre Assessment of the European potential for PHS
70
Eurostat data for 2011 GWh
Net electricity production No data
Net production natural hydro No data
Net production from PHS No data
Net production from wind No data
Net production from solar No data
Total variable RES electricity No data
PHS generation capacity (MW) No data
Conventional hydro generation
capacity (MW)No data
Total PHS energy storage
capacityNo data
(Source: Eurelectric's Hydro in Europe: Powering renewables )
No. of reservoirs 7
Of which capacity is inc. 7
Total capacity (Hm3) 556
No. of reservoirs selected 7
Capacity of selected reservoirs
(Hm3)
556
JRC assessmentT1 - theoretical potential 1 km 2 km 3 km 5 km 5 km/ 50m 10 km 20 km
No. of sites 0 0 0 0 0 0
Average head (m) 0 0 0 0 0 0
Average energy storage (GWh) 0 0 0 0 0 0
Total energy storage (GWh) 0 0 0 0 0 0
T1 - realisable potential 1 km 2 km 3 km 5 km 5 km/ 50m 10 km 20 km
No. of sites 0 0 0 0 0 0
Average head (m) 0 0 0 0 0 0
Average energy storage (GWh) 0 0 0 0 0 0
Total energy storage (GWh) 0 0 0 0 0 0
T2 - theoretical potential 1 km 2 km 3 km 5 km 5 km/ 50m 10 km 20 km
No. of sites 0 0 2 3 5 5 7
Average head (m) 0 0 273 236 189 409 508
Average energy storage (GWh) 0 0 1 2 1 21 23
Total energy storage (GWh) 0 0 2 6 7 107 159
T2 - realisable potential 1 km 2 km 3 km 5 km 5 km/ 50m 10 km 20 km
No. of sites 0 0 2 3 5 5 7
Average head (m) 0 0 273 241 177 426 500
Average energy storage (GWh) 0 0 1 2 1 19 23
Total energy storage (GWh) 0 0 2 5 6 97 158
Reservoir data (ECRINS)
Kosovo
0
20
40
60
80
100
120
140
160
180
0
1
2
3
4
5
6
7
8
GWhNo.of sites
PHS realisable potential (T2)
No. of sites
Total energy storage (GWh)
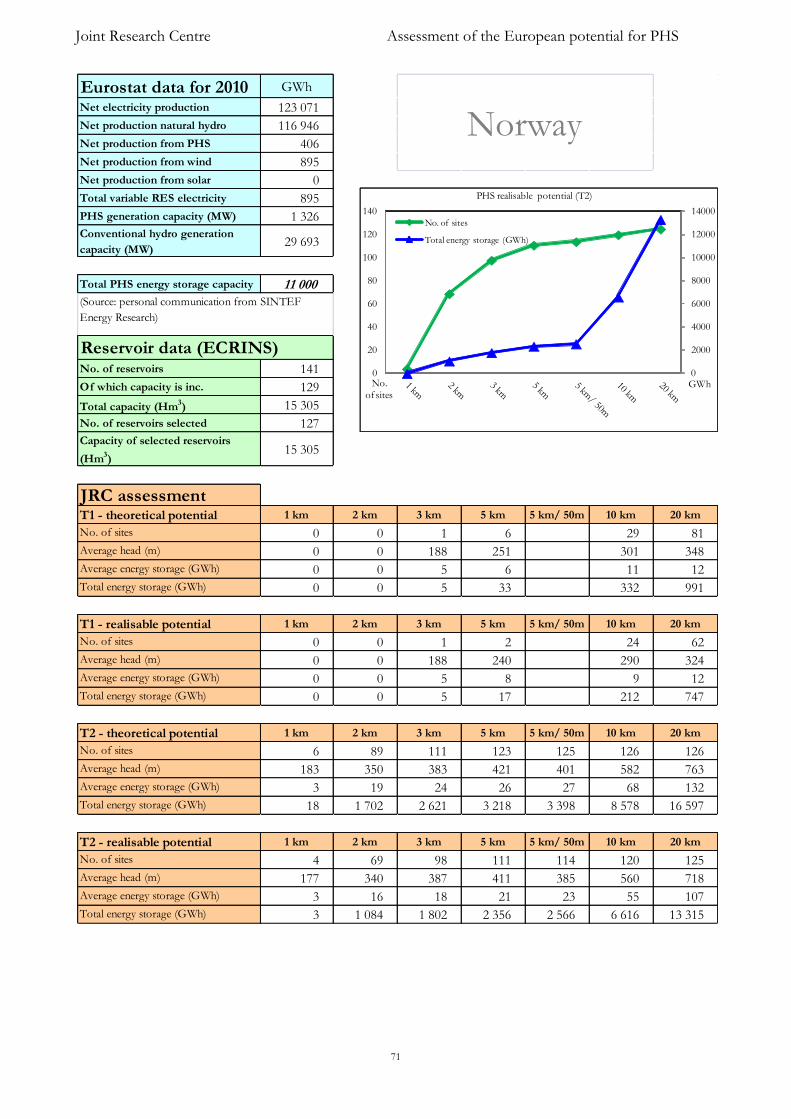
Joint Research Centre Assessment of the European potential for PHS
71
Eurostat data for 2010 GWh
Net electricity production 123 071
Net production natural hydro 116 946
Net production from PHS 406
Net production from wind 895
Net production from solar 0
Total variable RES electricity 895
PHS generation capacity (MW) 1 326
Conventional hydro generation
capacity (MW)29 693
Total PHS energy storage capacity 11 000
No. of reservoirs 141
Of which capacity is inc. 129
Total capacity (Hm3) 15 305
No. of reservoirs selected 127
Capacity of selected reservoirs
(Hm3)
15 305
JRC assessmentT1 - theoretical potential 1 km 2 km 3 km 5 km 5 km/ 50m 10 km 20 km
No. of sites 0 0 1 6 29 81
Average head (m) 0 0 188 251 301 348
Average energy storage (GWh) 0 0 5 6 11 12
Total energy storage (GWh) 0 0 5 33 332 991
T1 - realisable potential 1 km 2 km 3 km 5 km 5 km/ 50m 10 km 20 km
No. of sites 0 0 1 2 24 62
Average head (m) 0 0 188 240 290 324
Average energy storage (GWh) 0 0 5 8 9 12
Total energy storage (GWh) 0 0 5 17 212 747
T2 - theoretical potential 1 km 2 km 3 km 5 km 5 km/ 50m 10 km 20 km
No. of sites 6 89 111 123 125 126 126
Average head (m) 183 350 383 421 401 582 763
Average energy storage (GWh) 3 19 24 26 27 68 132
Total energy storage (GWh) 18 1 702 2 621 3 218 3 398 8 578 16 597
T2 - realisable potential 1 km 2 km 3 km 5 km 5 km/ 50m 10 km 20 km
No. of sites 4 69 98 111 114 120 125
Average head (m) 177 340 387 411 385 560 718
Average energy storage (GWh) 3 16 18 21 23 55 107
Total energy storage (GWh) 3 1 084 1 802 2 356 2 566 6 616 13 315
Reservoir data (ECRINS)
Norway
(Source: personal communication from SINTEF
Energy Research)
0
200
400
600
800
1000
1200
1400
1600
1800
2000
0
20
40
60
80
100
120
GWhNo.
of sites
PHS realisable potential (T2)
No. of sites
Total energy storage (GWh)
0
2000
4000
6000
8000
10000
12000
14000
0
20
40
60
80
100
120
140
GWhNo.
of sites
PHS realisable potential (T2)
No. of sites
Total energy storage (GWh)

Joint Research Centre Assessment of the European potential for PHS
72
Eurostat data for 2010 GWh
Net electricity production 66 137
Net production natural hydro 37 450
Net production from PHS 1 746
Net production from wind 37
Net production from solar 83
Total variable RES electricity 120
PHS generation capacity (MW) 1 817
Conventional hydro generation
capacity (MW)13 720
Total PHS energy storage
capacity369
(Source: Eurelectric's Hydro in Europe: Powering renewables )
No. of reservoirs 159
Of which capacity is inc. 148
Total capacity (Hm3) 3 738
No. of reservoirs selected 124
Capacity of selected reservoirs
(Hm3)
3 737
JRC assessmentT1 - theoretical potential 1 km 2 km 3 km 5 km 5 km/ 50m 10 km 20 km
No. of sites 0 4 8 22 66 243
Average head (m) 0 331 379 498 502 521
Average energy storage (GWh) 0 5 4 2 7 7
Total energy storage (GWh) 0 18 31 42 431 1 656
T1 - realisable potential 1 km 2 km 3 km 5 km 5 km/ 50m 10 km 20 km
No. of sites 0 2 6 12 38 185
Average head (m) 0 340 398 536 515 536
Average energy storage (GWh) 0 5 4 2 7 8
Total energy storage (GWh) 0 10 23 28 256 1 437
T2 - theoretical potential 1 km 2 km 3 km 5 km 5 km/ 50m 10 km 20 km
No. of sites 0 11 34 68 76 109 121
Average head (m) 0 340 428 583 526 806 1 024
Average energy storage (GWh) 0 4 4 3 3 10 14
Total energy storage (GWh) 0 48 128 226 232 1 060 1 645
T2 - realisable potential 1 km 2 km 3 km 5 km 5 km/ 50m 10 km 20 km
No. of sites 0 8 28 63 70 108 121
Average head (m) 0 344 418 581 529 796 1 009
Average energy storage (GWh) 0 5 3 3 3 10 13
Total energy storage (GWh) 0 42 94 197 202 1 034 1 583
Reservoir data (ECRINS)
Switzerland
0
200
400
600
800
1000
1200
1400
1600
1800
0
20
40
60
80
100
120
140
GWhNo.of sites
PHS realisable potential (T2)
No. of sites
Total energy storage (GWh)

European Commission
EUR 25940 – Joint Research Centre – Institute for Energy and Transport
Title: Assessment of the potential for European pumped hydropower storage
Authors: Marcos Gimeno Gutiérrez and Roberto Lacal Arántegui
Luxembourg: Publications Office of the European Union
2013 – 74 pp. – 21.0 x 29.7 cm
EUR – Scientific and Policy Reports series - ISSN 1831-9424 (online), ISSN 1018-5593 (print)
ISBN 978-92-79-29511-9 (pdf)
ISBN 978-92-79-29512-6 (print)
doi:10.2790/86815
Abstract
This report presents the results of the assessment for PHS in Europe under certain topologies and scenarios. The results
show that the theoretical potential in Europe is significant. We studied two different topologies. Under topology 1 the
theoretical potential energy stored reaches 54 TWh for a maximum of 20 km between existing reservoirs; of this
potential approximately 11 TWh correspond to the EU and 37 TWh to candidate countries. Under topology 2 the
European theoretical potential reaches 123 TWh when the distance between the existing reservoir and the prospective
site is up to 20 km. Unlike topology 1, in topology 2 the majority of this potential (50%) lays within the EU.
The realisable potential accounts for reduced potential sites too close to a centre of population, protected natural areas
or transport infrastructure. For topology 1 and scenario 20 km the realisable potential is halved to 29 TWh, whereas
topology 2 is slightly less affected and still reaches 80 TWh of which 33 TWh in the EU.

z
As the Commission’s in-house science service, the Joint Research Centre’s mission is to provide
EU policies with independent, evidence-based scientific and technical support throughout the
whole policy cycle.
Working in close cooperation with policy Directorates-General, the JRC addresses key societal
challenges while stimulating innovation through developing new standards, methods and tools,
and sharing and transferring its know-how to the Member States and international community.
Key policy areas include: environment and climate change; energy and transport; agriculture
and food security; health and consumer protection; information society and digital agenda;
safety and security including nuclear; all supported through a cross-cutting and multi-
disciplinary approach.
LD
-NA
-25940-E
N-N
As the Commission’s in-house science service, the Joint Research Centre’s mission is to provide
EU policies with independent, evidence-based scientific and technical support throughout the
whole policy cycle.
Working in close cooperation with policy Directorates-General, the JRC addresses key societal
challenges while stimulating innovation through developing new standards, methods and tools,
and sharing and transferring its know-how to the Member States and international community.
Key policy areas include: environment and climate change; energy and transport; agriculture
and food security; health and consumer protection; information society and digital agenda;
safety and security including nuclear; all supported through a cross-cutting and multi-
disciplinary approach.


![Wind power pumped storage system for hydropower plants › bitstream › 1946 › 4367 › 1 › lmason_fixed[1].pdf · hydropower plant with an added wind pumped storage system and](https://static.fdocuments.in/doc/165x107/5f03d2d17e708231d40af1f3/wind-power-pumped-storage-system-for-hydropower-plants-a-bitstream-a-1946-a.jpg)


