Assessment of the Environmental and Economic Impact of...
66
i Assessment of the Environmental and Economic Impact of Air Changes in a Hospital Operating Room By Thomas Gormley Dissertation Submitted to the Faculty of the Graduate School of Vanderbilt University in partial fulfillment of the requirements for the degree of DOCTOR OF PHILOSOPHY in Interdisciplinary Studies: Environmental Management December, 2016 Nashville, Tennessee Approved: James C. Clarke, Ph.D. Mark J. Abkowitz, Ph.D. Sanjiv Gokhale, Ph.D. Kenneth Debelak, Ph.D. Don Guan, Ph.D. Steve M. Hayes, P.E. , CIH, FACEC
Transcript of Assessment of the Environmental and Economic Impact of...

i
Assessment of the Environmental and Economic Impact of Air Changes in a Hospital Operating Room
By
Thomas Gormley
Dissertation
Submitted to the Faculty of the
Graduate School of Vanderbilt University
in partial fulfillment of the requirements
for the degree of
DOCTOR OF PHILOSOPHY
in
Interdisciplinary Studies: Environmental Management
December, 2016
Nashville, Tennessee
Approved:
James C. Clarke, Ph.D.
Mark J. Abkowitz, Ph.D.
Sanjiv Gokhale, Ph.D.
Kenneth Debelak, Ph.D.
Don Guan, Ph.D.
Steve M. Hayes, P.E. , CIH, FACEC

ii
TABLE OF CONTENTS
Page
LIST OF FIGURES ................................................................................................................................ iv
LIST OF TABLES .................................................................................................................................. v
Chapter
I. Introduction .......................................................................................................................... 1
Background ........................................................................................................................... 1 Problem Statement ................................................................................................................ 2 Hypothesis ............................................................................................................................. 3 Means and Methods .............................................................................................................. 3 Comparison of Actual Findings ............................................................................................... 5 References ............................................................................................................................. 6
II. Methodology for Analyzing Environmental Quality Indicators (EQIs) in a Dynamic Operating Room Environment ................................................................................................................ 7
Abstract ................................................................................................................................. 7 Background ........................................................................................................................... 8 Means and Methods .............................................................................................................. 9 Locations ......................................................................................................................... 9 Mock Surgery Procedure ................................................................................................ 10 Implementation ............................................................................................................. 12 Statistical Analysis ......................................................................................................... 12 Results ................................................................................................................................. 12 Air Velocity .................................................................................................................... 12 Temperature, Humidity and Pressurization ..................................................................... 13 Particle Counts ............................................................................................................... 14 Discussion ............................................................................................................................ 14 Limitations........................................................................................................................... 16 Conclusion ........................................................................................................................... 17 Figures ................................................................................................................................. 18 Tables .................................................................................................................................. 21 References ........................................................................................................................... 22 Acknowledgements.............................................................................................................. 23
III. Cost-Benefit Analysis of Different Air Change Rates in an Operating Room Environment ....... 24
Abstract ............................................................................................................................... 24 Background ......................................................................................................................... 24 Means and Methods ............................................................................................................ 26 Environmental Quality Indicator Testing ......................................................................... 26 Cost Analysis .................................................................................................................. 28

iii
Results ................................................................................................................................. 29 Environmental Quality Indicators ................................................................................... 29 Particles................................................................................................................... 29 Microbial Contaminants ........................................................................................... 30 Velocity ................................................................................................................... 31 Cost ............................................................................................................................... 31 Discussion ............................................................................................................................ 31 Conclusions ......................................................................................................................... 34 Figures ................................................................................................................................ 35 Tables ................................................................................................................................ 39 References ........................................................................................................................... 41 Acknowledgements.............................................................................................................. 42
IV. Construction Management of Healthcare Projects ................................................................ 43
V. Summary ............................................................................................................................. 45
Overview ............................................................................................................................. 45 Conclusions ......................................................................................................................... 47 Recommendations for Research ........................................................................................... 47
Appendix A. Examples of Microbial Test Results ....................................................................................... 47

iv
LIST OF FIGURES
Figure Page
1. Mock Surgical Procedure ............................................................................................................... 18
2. Testing in Operating Room ............................................................................................................ 19
3. Test Locations ................................................................................................................................ 20
4. Anemometer to Measure Air Velocities ........................................................................................ 21
1. Energy Use per Square Foot of Building Space .............................................................................. 35
2. European Operating Room Classification Parameters and Ventilation Requirements ................. 36
3. Operating Room Mounting ............................................................................................................ 37
4. Operating Room Air ....................................................................................................................... 38
5A. Velocity and Temperature at the Sterile Field ............................................................................... 39
5B. Velocity and Temperature at the Back Table................................................................................. 40

v
LIST OF TABLES
Table Page
1. Air Velocities and Temperatures at 20 ACH ................................................................................... 21
2. Microbial Data for Operating and Back Tables and 0.05 Micron Particle Data at 20 ACH ............ 21
1. Sample OR Air Change Calculation ................................................................................................ 39
2A. Site A Cost ...................................................................................................................................... 41
2B Site B Cost ...................................................................................................................................... 41
1
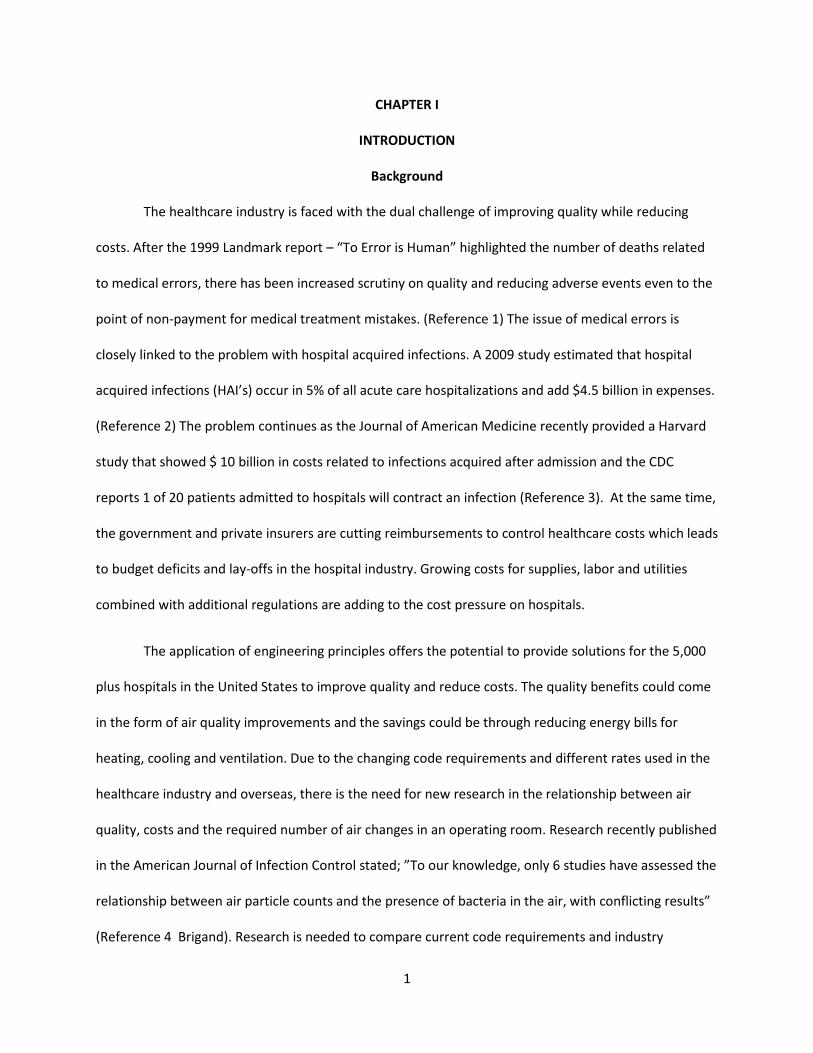
CHAPTER I
INTRODUCTION
Background
The healthcare industry is faced with the dual challenge of improving quality while reducing
costs. After the 1999 Landmark report – “To Error is Human” highlighted the number of deaths related
to medical errors, there has been increased scrutiny on quality and reducing adverse events even to the
point of non-payment for medical treatment mistakes. (Reference 1) The issue of medical errors is
closely linked to the problem with hospital acquired infections. A 2009 study estimated that hospital
acquired infections (HAI’s) occur in 5% of all acute care hospitalizations and add $4.5 billion in expenses.
(Reference 2) The problem continues as the Journal of American Medicine recently provided a Harvard
study that showed $ 10 billion in costs related to infections acquired after admission and the CDC
reports 1 of 20 patients admitted to hospitals will contract an infection (Reference 3). At the same time,
the government and private insurers are cutting reimbursements to control healthcare costs which leads
to budget deficits and lay-offs in the hospital industry. Growing costs for supplies, labor and utilities
combined with additional regulations are adding to the cost pressure on hospitals.
The application of engineering principles offers the potential to provide solutions for the 5,000
plus hospitals in the United States to improve quality and reduce costs. The quality benefits could come
in the form of air quality improvements and the savings could be through reducing energy bills for
heating, cooling and ventilation. Due to the changing code requirements and different rates used in the
healthcare industry and overseas, there is the need for new research in the relationship between air
quality, costs and the required number of air changes in an operating room. Research recently published
in the American Journal of Infection Control stated; ”To our knowledge, only 6 studies have assessed the
relationship between air particle counts and the presence of bacteria in the air, with conflicting results”
(Reference 4 Brigand). Research is needed to compare current code requirements and industry

2
practices, which are often not always the same, to provide pathways for improving or confirming the
adequacy of the air quality and potentially reducing capital and operating costs. While indoor air quality
is one of many factors that can impact hospital acquired infections, there are too many variables, both
clinical and engineering, to make a direct correlation between air changes and specific infection rates. A
healthy balance between air quality and cost is desirable and this research will provide data to help
define the costs and benefits.
The requirements for air changes and outside air in a hospital operating rooms are primarily
defined in the Guidelines for the Design and Construction of Healthcare Facilities and ASHRAE 170
(American Society of Heating, Refrigeration and Air Conditioning Engineers) (Reference 5 FGI)
(Reference 6 ASHRAE 170). In the 2010 Edition of the Guidelines, these standards were combined. This
resulted in a significant increase (33%) in the number of air changes required in operating rooms in
many states in the US. The requirements went from 15 to 20 air changes per hour (ACH) and from 3 to 4
of these air changes being fresh or outside air. These are minimum standards and in practice most
hospitals, including Vanderbilt Medical Center, use 25 to 30 ACH for their operating rooms. Little data is
available to document the benefits from this change or the cost of the additional air changes.
Problem Statement
The industry would benefit from a study on the cost and benefits of different air change rates
to provide research based data to inform operating practices and regulatory requirements for
operating room environments.
One of the challenges with this research is obtaining the data from hospitals on the number of
air changes being used and the quality indicators for the air. In many cases, the hospitals do not gather
specific data relating air quality and surgical site infections on a regular basis. In other cases, there is a

3
concern about sharing this data from a risk management standpoint for the facility as it may indicate the
potential for hospital acquired infections or quality issues.
To address this issue, the research team developed a testing methodology that measures air
quality in tangible, quantifiable metrics other than the number of surgical site infections. This is also
more realistic approach to isolate air quality as there are many other factors involved with surgical site
infections beyond the potential for contamination by airborne bacteria. These quantifiable metrics of air
quality are temperature, relative humidity, particle counts, number of microbial contaminants,
pressurization and airflow which we defined as Environmental Quality Indicators or EQI’s.
Hypotheses
Based on these observations and my background with the cost-benefit analysis for the Facility
Guidelines Institute, I developed the following hypotheses:
• There is and imperceptible difference in air quality between 15 and 20 ACH.
• There is a significant difference in air quality from 5 ACH to 15 or 20 ACH.
• There are no additional benefits at 25 ACH and maybe higher particulate count.
• The use of HEPA filters and the diffuser configuration may allow for fewer ACH and improved air
quality.
• The cost of additional air changes can be calculated for evaluation and could provide meaningful
savings.
Means and Methods
With the quality indicators defined, the team developed a process to test the indicators in a
dynamic operating room environment. We used air samplers to test for microbial contaminants and a
modified ISO process from other industries to measure the number of particles. We used anemometers

4
to measure the air speeds and flow. The building automation system was used to control outside air
quantities, temperature, pressure relationships and relative humidity.
Due to the clinical risks and difficulty of obtaining approval, we chose not to test during actual
surgery and developed a mock surgical procedure. A script of activities typically occurring in an
operating room was developed on 4 minute period. The surgeon read from this from the overhead
monitor and directed all of the clinical activities, while the technicians used this to time the test cycles.
This allowed us to repeat the procedure as closely as possible for the three different sites.
The tests were completed at three sites and the data was accurate and provided statistically
significant information on which to base our conclusions. Statistical analysis was completed and verified
by a third party to provide meaningful and verifiable information.
The microbial testing confirmed the presence of airborne contaminants. The independent
testing lab identified human derived Micrococcus and Staphylococcus and environmentally derived
Bacillus. There were also Coryneform bacteria. These are all potentially opportunistic pathogens. While
they are typically not threatening to a general, healthy population, they are potentially dangerous to
hospital patients, who are sick or immunosuppressed. These airborne contaminants would be
particularly risky with invasive surgical procedures which could provide a direct transmission path into
the body.
The particle testing identified varying number of particles of different sizes in different locations
in the operating rooms. The testing used a modified ISO process as there is not a code defined
methodology for testing particles in operating rooms. The results showed the OR’s to be typically at an
ISO 6 to 8 classification levels. There were measurably higher levels in the OR that did not have the HEPA
(high efficiency particulate air) filters.

5
The mechanical engineer on our team estimated the cost of 5 air changes per hour in the
hospitals in our study and had the results verified by a third party. The costs are approximately $4800
per year per operating room. There would also be increased “first” or capital costs for construction of
new operating rooms with higher air change rates.
Comparison of Actual Findings
• Imperceptible difference in air quality between 15 and 20 ACH
o 20 Ach is significantly better than 15 ACH
• Significant difference in air quality from 5 ACH to 15 or 20 ACH
o There is a significant difference so ventilation rate is clearly a factor in air quality
• No additional benefits at 25 ACH and maybe higher particulate count
o The air at 25 ACH was not significantly better than at 20 ACH so 20 ACH seems to be the
“sweet spot”
• HEPA filters and diffuser configuration may allow for fewer ACH and improved air quality
o The OR’s with HEPA filters had lower particle counts than the one without; the
configuration of the diffusers was so different in each room that we could not make any
correlations
• Cost of additional air changes can be calculated for evaluation
o It does cost more to provide more air changes- approximately $5000 per OR/year/5
ACH, but this is a small number relative to the overall revenue from surgery and the
hospitals will typically continue using higher than required air change rates as a risk
management measure

6
References
1. “To Err in Human” Institute of Medicine November 1999
2. Deioen Reed PhD and Sandra Kennedy MD : The Ochsner Journal October 2009
3. R. Douglas Scott The 2nd CDC March 2009 ; “Direct Costs of Healthcare-Associated Infections in US Hospitals and the Benefits of Prevention”
4. Birgand G. American Journal of Infection Control 2015 1-6 “Air Contamination for Predicting Wound Contamination in clean Surgery: A Large Multicenter Study”
5. Facility Guidelines Institute – Guidelines for the Design and Construction of Healthcare Facilities
6. American Society of Heating Refrigeration and Air Conditioning Engineers –ASHRAE 170

7
CHAPTER 2
METHODOLOGY FOR ANALYZING ENVIRONMENTAL QUALITY INDICATORS (EQIs) IN A DYNAMIC
OPERATING ROOM ENVIRONMENT
Abstract
Innovative and potentially high risk medical procedures are performed in hospital operating
rooms across the country on a daily basis. As a result, there are detailed and stringent procedures in
place for routine clinical practices, such as handwashing and instrument sterilization, and for the HVAC
(heating, ventilation and air conditioning) systems, such as relative humidity and ventilation rates. In an
attempt to make operating rooms as clean as possible, operating room ventilation, which is measured in
air changes per hour (ACH), is understandably higher than any other space in a hospital. While the
highest air change rates may be required to provide a quality indoor environment to help minimize the
risk of surgical site infections (SSI), there are significant capital and operating costs associated with
meeting these requirements.
The purpose of this applied research project was to develop a reproducible and verifiable
method to compare the air quality in operating rooms under conditions currently being used in the
healthcare industry. The testing protocol was developed by an interdisciplinary team which included
medical clinicians, air quality experts, engineers and industrial hygienists experienced in operating room
proceedings. The process for the research testing included a “mock’ surgical procedure that was
directed by a Board certified surgeon in real operating rooms. The procedure used industry standard
gowning and sterilization practices, and was supported by experienced operating room staff in order to
simulate actual conditions during a routine surgical procedure.
The results after testing at three different hospitals showed that meaningful and statistically
relevant data could be obtained for use in evaluating the quality of the air in actual operating room
conditions. The testing protocol developed was measurable and repeatable, and thus, provides an

8
effective method to measure air quality in operating rooms and potentially other critical spaces in a
hospital environment.
Background
The healthcare industry is consistently faced with the dual challenge of improving the quality of
care while simultaneously reducing costs. A recent study in the Journal of American Medicine reported
the health care industry sustains $10 billion in annual costs related to infections acquired after
admission. (Reference 1 JAMA) Similarly, the CDC reported that 1 in 20 patients admitted to hospitals
will contract a hospital-acquired infection (Reference 2 CDC/ASTHO). Medical insurance companies and
government payers have taken note of these costs and are reducing reimbursement for hospital
acquired infections. Reductions in reimbursements put pressure on providers to reduce hospital
acquired infections including surgical site infections while simultaneously reducing operating costs to
remain financially sound.
Due to the many confounding variables and factors, it is not feasible to make a direct connection
from poor air quality to surgical site infections (Reference 3 Memarazadeh). However, it is generally
accepted that poor air quality and airborne contaminates can be a cause of increased rates of surgical
site infections. Studies suggest that over a third of all hospital acquired infections could be a result of
airborne transmissions (Reference 4 Kowalski). In another study reported in the American Journal of
Infection Control, the authors concluded that the air in the operating room is considered a route for
microbes to enter the surgical wound (Reference 5 Brigand).
The ventilation rates, as measured in air changes per hour, vary in the different state regulations
and in actual practice. These air change rates are often “based on tradition rather than science”
(Reference 6 English). Therefore, there is notable variety in hospitals across the country with regards to
air changes per hour, use of high-efficiency particulate air (HEPA) filters, UV or ozone systems and the
overhead diffuser layouts. There is often a sense of “more is better” and while this philosophy may not

9
always lead to cleaner operating rooms and better outcomes, it will typically increase the operating
costs of the hospital. Given the variation in these parameters, research in this field could provide more
scientific evidence to optimize clean space guidelines while simultaneously minimizing costs and
increasing positive clinical outcomes.
We aimed to design a methodology for assessment of dynamic operating room quantifiable
Environmental Quality Indicators that offered measurable, repeatable and verifiable results. The
specific purposes of this methodology were to: 1) develop a reproducible testing model using a “mock”
surgical procedure that could be utilized for clinical assessment of clean spaces, and 2) evaluate
quantifiable EQIs with measurable criteria which were defined as microbial contaminants measured in
colony forming units CFU/ m3 and particle counts in particles/m3.
Means and Methods
Locations
Three different operating rooms in three different hospitals in two different states were chosen
for experimentation. The ORs in two hospitals were associated with academic medical schools (OR’s A
and B), both had HEPA filtered air supplies to the rooms and were 638 and 554 square feet, respectively.
The third OR (OR C) was located in a private community hospital, had MERV 14 filters and was 505
square feet. Studies took place from the summer of 2015 to the spring of 2016.
Instrumentation Setup
In order to detect microbial contamination, the operating table and the back table, where the
surgical instruments are opened and prepared, were selected as the critical locations in the operating
rooms at which to measure the microbial contamination (Reference 7 Memarazadeh). Bioscience viable
surface air samplers (SAS180) were placed at both locations to detect the contaminants. Petri plates
with Tryptic Soy Agar (TSA) media were used in the samplers and were changed in regular cycles to
collect microbial data during the entire mock procedure. The samplers were factory calibrated and set

10
to collect 1000 liters of air over a five and a half minute period of time. Each set of three samples were
run eight times for a total of twenty-four samples per sampling location- the operating table or sterile
field and the back table. The viable microbial samples were sent under chain of custody to a third-party
microbiology laboratory for qualitative and quantitative analysis of bacteria. Bacterial genus and species
were identified and quantified as colony forming units per cubic meter. Since there are no current
guidelines for airborne microbial sampling in operating rooms, sample collection procedures and data
analysis followed the recommendations set forth for the Pharmaceutical Industry by the United States
Pharmacopeia Society (USP 797).
Particle contamination was measured using a Climet Model CJ-750T 75 LPM counter or
Lighthouse World Wide Solutions (LWS) handheld 3016-IAQ particle meters. ISO 14644 standards were
utilized which required measuring the number of particles at 9 points based on the size of the space.
The particle sizes recorded were 0.3, 0.5, 1.0, and 5.0 microns in particles per cubic meter.
To verify that the operating rooms were functioning in compliance with industry standards and to
provide more data on the actual airflow patterns, the velocity of the air was measured at the face of
ceiling mounted diffusers, at the operating table, at the back table and at one return grill using a TSI
Velocicak air velocity meter Model 9565. The pressure relationships with the adjacent spaces were also
monitored to verify compliance with the regulations using a Shortridge Digital Multimeter Model ADM –
860C. The temperature was monitored and held at consistent levels using the building automation
system.
Mock Surgery Procedure
In order to provide consistent execution of the mock procedure and to ensure repeatability at
each location, a detailed, timed process was developed. This “script” defined the physical actions for
each of the research team members to perform in four minute increments during the one hour mock
surgical procedure to simulate as many actual operating room conditions as practical (Excerpt of script

11
in Figure 1). The research team consulted with two Board certified surgeons to develop the mock
procedure. The script simulates the actual steps undertaken by an operating room staff and includes
gowning and gloving, passing instruments, personnel entering and leaving the room, and use of
electrocautery on an uncooked steak to generate particulate tissue matter (Figure 2).
Personnel
As this research involved different perspectives on the operating room systems and functions, a
multidisciplinary team was developed for the project to provide a comprehensive approach. The clinical
practices were an important factor to ensure the EQIs could be sampled in a setting that closely
resembled a real surgical procedure. The team included members of the health care profession to
provide the practical clinical input. The same practicing surgeon led the mock procedure at all sites to
provide consistency. A practicing operating room nurse from each hospital participated in each mock
procedure to provide direction on the specific equipment, supplies and practices at their facility. Each
OR nurse also assisted the team with scrubbing and gowning to closely simulate actual procedures.
An understanding of the engineering aspects of the OR HVAC system was also crucial, and
therefore an experienced healthcare mechanical engineer was included. This individual determined the
steps needed to adjust the HVAC systems to maintain the proper pressure relationships, velocities,
temperatures and relative humidity levels. Determining air quality was another critical factor in the
research and there were two team members who added this expertise, an air quality expert and
microbiologist, and an industrial hygienist. They worked with the entire team to develop practical
methods to measure the air quality in terms of microbial and particle load. As there is no standard in
the current building codes related to airborne colony forming units or particle counts in an operating
rooms, USP and ISO standards were adapted to this application to compare the ORs and design a
method to test and develop quantifiable EQIs for healthcare spaces. The air sampling locations were
well defined and repeated exactly at each site (Figure 3).

12
Implementation
The testing was completed over a weekend so it did not impact the use of the operating rooms
as it was essential to make sure the room was ready for use again on the following Monday morning.
This required developing a process that could be completed in one day, did not require any physical or
hardwired modifications of the HVAC system, did not impact the adjacent spaces in the surgical suite,
and did not introduce any additional contaminants into the room. Coordination with the hospital
cleaning staff was required to arrange for routine cleaning between tests and “terminal” cleaning on
Sunday so the operating rooms were ready and safe for use after the testing.
Statistical Analysis
Skewness and kurtosis statistics were used to test the assumption of normality for microbial
values. Levene’s Test of Equality of Variances was used to test the assumption of homogeneity of
variance. Given the meeting of statistical assumptions, one-way ANOVA were used for between-
subjects comparisons. For continuous outcomes, Scheffe’s test was used for pairwise comparisons in a
post hoc fashion. Medians and interquartile ranges (IQR) were reported. An alpha value of .001
assumed statistical significance. All analyses were conducted using SPSS Version 21 (Armonk, NY: IBM
Corp.).
Results
Air Velocity
The air velocity was measured at the face of one of the ceiling mounted diffusers, directly below
at 6 inches above the surface of the operating table, at the back table and at one low-wall return grille
(Figure 4). The mean air velocities at the face of the diffuser were consistent at the academic medical
centers at 29 and 30 Ft/minute while it was 50 Ft/minute at the 3rd site. The results were similar at the
operating table at 30.59 and 30.85 Ft/minute for the academic medical centers and different at the 3rd

13
site. The mean velocities at the back table were more consistent at the 3 sites with a range of 9.5 to 13.9
Ft/minute (Table 1).
Temperature, Humidity and Pressurization
The goal of the testing process was to hold the temperature and relative humidity constant at
68 F and 50% and to maintain the code required minimum positive pressure of .01 in. The building
automation systems were used to measure these factors. The room temperature results at the sampling
points were consistent at all 3 sites being within 5% of the target during the procedures. The pressure
relationships to the adjacent spaces were maintained during the testing and all the humidity ranges
were held within the ASHRAE guidelines of 30 to 60%.
Microbial data
At 20 ACH, the microbial loads at the operating tables, in the sterile field, were comparable and
had a range of 0 to 41 CFU/m3 with medians ranging from 3 to 22 CFU/m3 (OR A, 1-10 CFU/m3, median
3.0, IQR 2.5; OR B, 14-41 CFU/m3, median 22.0 and IQR 12.0; OR C, 0-13 CFU/m3, median 6.0 and IQR
4.0). The upper limit CFU/m3 counts place the ORs A, B and C into extrapolated USP ISO classes of 7, 8
and 8, respectively (Table 2). The air in the sterile filed in OR A had statistically significantly fewer
microbes than the air in OR C, which had significantly fewer microbes than OR B (p<0.001).
At 20 ACH, the microbial loads at the back table, outside the sterile field, were also comparable
and had a range from 2 to 51 CFU/m3 with medians ranging from 5 to 27 CFU/m3 (OR A, 16-51 CFU/m3,
median 27.0, IQR 10.5; OR B, 10-24 CFU/m3, median 16.0, IQR 6.3; OR C, 2-15 CFU/m3, median 5.0, IQR
3.8). The upper limit CFU/m3 counts placed the ORs A, B and C into extrapolated USP ISO class 8 for all
three ORs (Table 2) and the air at the back table in OR C had statistically significantly fewer microbes
than the air in both OR A and B (p<.001). The air at the back table in OR B had significantly fewer
microbes than the air in OR A (p<0.001). In one of the three sites, OR A, the back table had statistically
significantly higher levels of microbial contaminants than the air at the sterile field (sterile field median
14
3.0 CFU/m3, back table median 27.0; p<0.001). However, in both OR B and OR C, the air in the sterile
field as compared to the air at the back table was not significantly different (p=0.10 and p=0.35,
respectively).
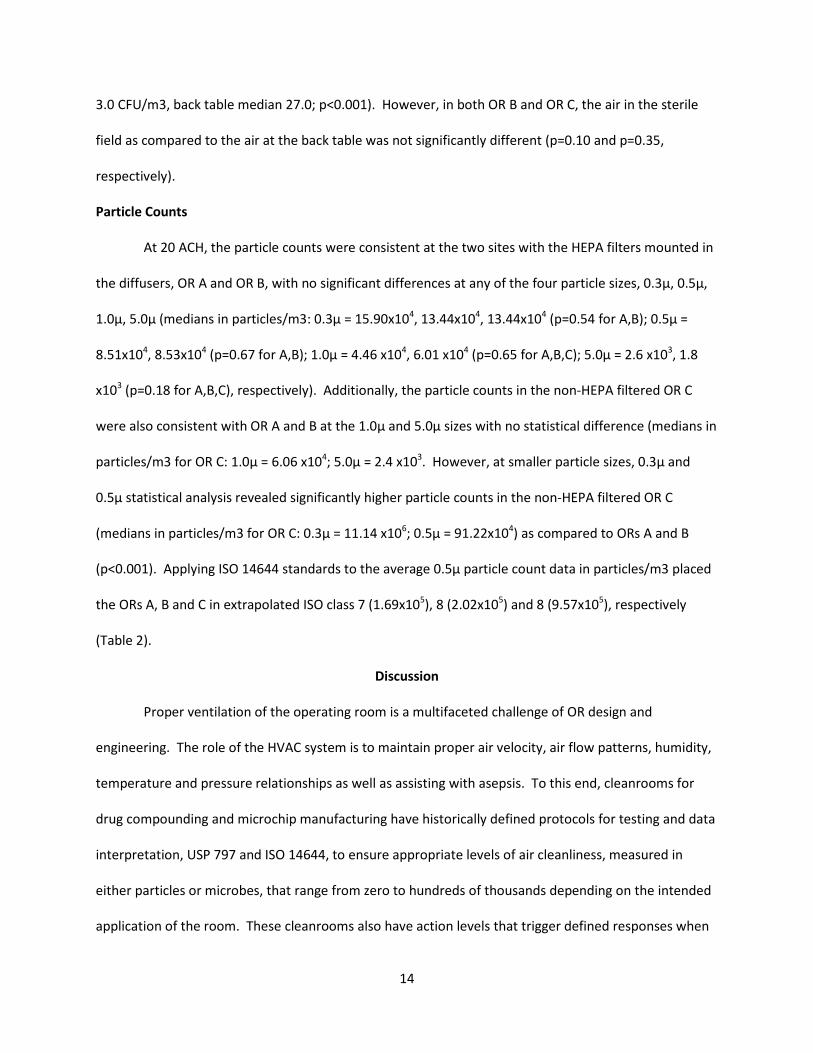
Particle Counts
At 20 ACH, the particle counts were consistent at the two sites with the HEPA filters mounted in
the diffusers, OR A and OR B, with no significant differences at any of the four particle sizes, 0.3µ, 0.5µ,
1.0µ, 5.0µ (medians in particles/m3: 0.3µ = 15.90x10⁴, 13.44x10⁴, 13.44x10⁴ (p=0.54 for A,B); 0.5µ =
8.51x10⁴, 8.53x10⁴ (p=0.67 for A,B); 1.0µ = 4.46 x10⁴, 6.01 x10⁴ (p=0.65 for A,B,C); 5.0µ = 2.6 x10³, 1.8
x103 (p=0.18 for A,B,C), respectively). Additionally, the particle counts in the non-HEPA filtered OR C
were also consistent with OR A and B at the 1.0µ and 5.0µ sizes with no statistical difference (medians in
particles/m3 for OR C: 1.0µ = 6.06 x10⁴; 5.0µ = 2.4 x10³. However, at smaller particle sizes, 0.3µ and
0.5µ statistical analysis revealed significantly higher particle counts in the non-HEPA filtered OR C
(medians in particles/m3 for OR C: 0.3µ = 11.14 x10⁶; 0.5µ = 91.22x10⁴) as compared to ORs A and B
(p<0.001). Applying ISO 14644 standards to the average 0.5µ particle count data in particles/m3 placed
the ORs A, B and C in extrapolated ISO class 7 (1.69x10⁵), 8 (2.02x10⁵) and 8 (9.57x10⁵), respectively
(Table 2).
Discussion
Proper ventilation of the operating room is a multifaceted challenge of OR design and
engineering. The role of the HVAC system is to maintain proper air velocity, air flow patterns, humidity,
temperature and pressure relationships as well as assisting with asepsis. To this end, cleanrooms for
drug compounding and microchip manufacturing have historically defined protocols for testing and data
interpretation, USP 797 and ISO 14644, to ensure appropriate levels of air cleanliness, measured in
either particles or microbes, that range from zero to hundreds of thousands depending on the intended
application of the room. These cleanrooms also have action levels that trigger defined responses when

15
the data exceeds a target quantifiable numerical level. These protocols are standardized across the
industry and adhered to by successful manufactures. The development of these protocols was driven, in
part by the ability to define a connection between airborne contamination and product end quality, as
well as by the negative financial impact of contaminated pharmaceuticals or microchip defects
(Reference 8 Wagner). The variation in state codes and practical applications for operating rooms,
which ranges from 15 to 30 ACH and sometimes even higher, indicate the need to define appropriate,
evidence based protocols and action levels for healthcare settings.
In this study, a method was designed to test the Environmental Quality Indicators in a working,
dynamic, operating room suite. Air velocity and temperature, as well as microbial and particle
contamination were able to be consistently and repeatedly measured in operating rooms at three
different institutions during the mock procedures. This method can therefore be utilized to study
multiple different aspects of a functional OR, including alteration of air exchange rates, use of
specialized air scrubbers or filtration devices, use of microbial sterilizers, as well as aspects of staff
workflow.
Although the connection between surgical site infections and airborne contaminants has not yet
been defined, it stands to reason that if the contaminant is not present in the air, it does not have the
opportunity to land on surgical instruments, staff hands or the patient. However, achieving zero
contaminants in a healthcare setting or operating room, as is required in some cleanrooms, is not
practical and is likely unnecessary. Therefore, determining the point of diminishing returns or a practical
level of cleanliness for operating rooms and other healthcare settings is essential. In essence, what is
clean enough and how will it be defined and measured?
This research suggests that the application of a performance basis, such as EQIs, may be more
effective for operating rooms and other healthcare spaces. The study also suggests defining an evidence
based best practice may be readily achievable rather than following the “more is better” concept for
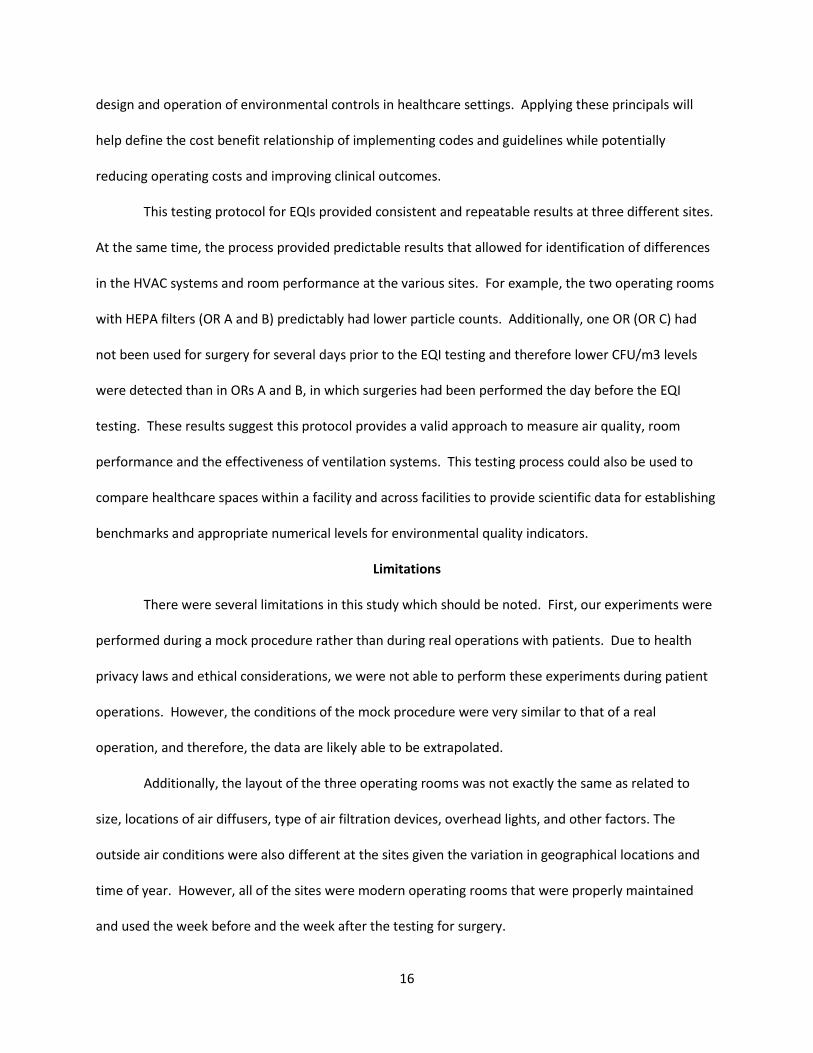
16
design and operation of environmental controls in healthcare settings. Applying these principals will
help define the cost benefit relationship of implementing codes and guidelines while potentially
reducing operating costs and improving clinical outcomes.
This testing protocol for EQIs provided consistent and repeatable results at three different sites.
At the same time, the process provided predictable results that allowed for identification of differences
in the HVAC systems and room performance at the various sites. For example, the two operating rooms
with HEPA filters (OR A and B) predictably had lower particle counts. Additionally, one OR (OR C) had
not been used for surgery for several days prior to the EQI testing and therefore lower CFU/m3 levels
were detected than in ORs A and B, in which surgeries had been performed the day before the EQI
testing. These results suggest this protocol provides a valid approach to measure air quality, room
performance and the effectiveness of ventilation systems. This testing process could also be used to
compare healthcare spaces within a facility and across facilities to provide scientific data for establishing
benchmarks and appropriate numerical levels for environmental quality indicators.
Limitations
There were several limitations in this study which should be noted. First, our experiments were
performed during a mock procedure rather than during real operations with patients. Due to health
privacy laws and ethical considerations, we were not able to perform these experiments during patient
operations. However, the conditions of the mock procedure were very similar to that of a real
operation, and therefore, the data are likely able to be extrapolated.
Additionally, the layout of the three operating rooms was not exactly the same as related to
size, locations of air diffusers, type of air filtration devices, overhead lights, and other factors. The
outside air conditions were also different at the sites given the variation in geographical locations and
time of year. However, all of the sites were modern operating rooms that were properly maintained
and used the week before and the week after the testing for surgery.

17
Conclusion
This interdisciplinary team developed and implemented protocols to measure quantifiable
Environmental Quality Indicators (EQIs) for this study. The process employed proven techniques and
benchmarks used in pharmaceutical and semiconductor industries to measure airborne contamination
in these operating rooms and to compare them based on numerical classification schemes used in
cleanrooms. This simulated surgical procedure and testing tool was implemented accurately at three
different operating room testing sites. Meticulous, detailed scripting and testing protocols yielded
predictable microbial and particle trends across sites, consistently classifying these ORs into numerical
ISO classes extrapolated from cleanrooms. This application of employing quantifiable EQIs to operating
room contamination control can be utilized in other healthcare spaces, as well as to address the efficacy
of air change rates and velocity guidance, staff movement, room set up and other variables. Lastly,
applying these principals will assist with development of future evidence based guidelines and codes
and could help define the cost benefit relationship of implementing these guidelines with the potential
to reduce operating cost and energy consumption while increasing environmental stewardship and
positive clinical outcomes.

18
Figures
Figure 1 – Mock Surgical Procedure
The research team followed a detailed script that provided specific direction of actions every 4 minutes
to closely simulate an actual surgery. This allowed for consistent, repeatable action patterns at all three
hospitals.

19
Figure 2 – Testing in Operating Room
The multidisciplinary team consisted of a surgeon, nurse, engineers, industrial hygienist and
microbiologist to provide input on the different perspectives of the research project. The same core
team performed the mock surgical procedure and testing at all sites and used a steak to cut with an
electro cauterization device to simulate the particles generated in actual cases.
20
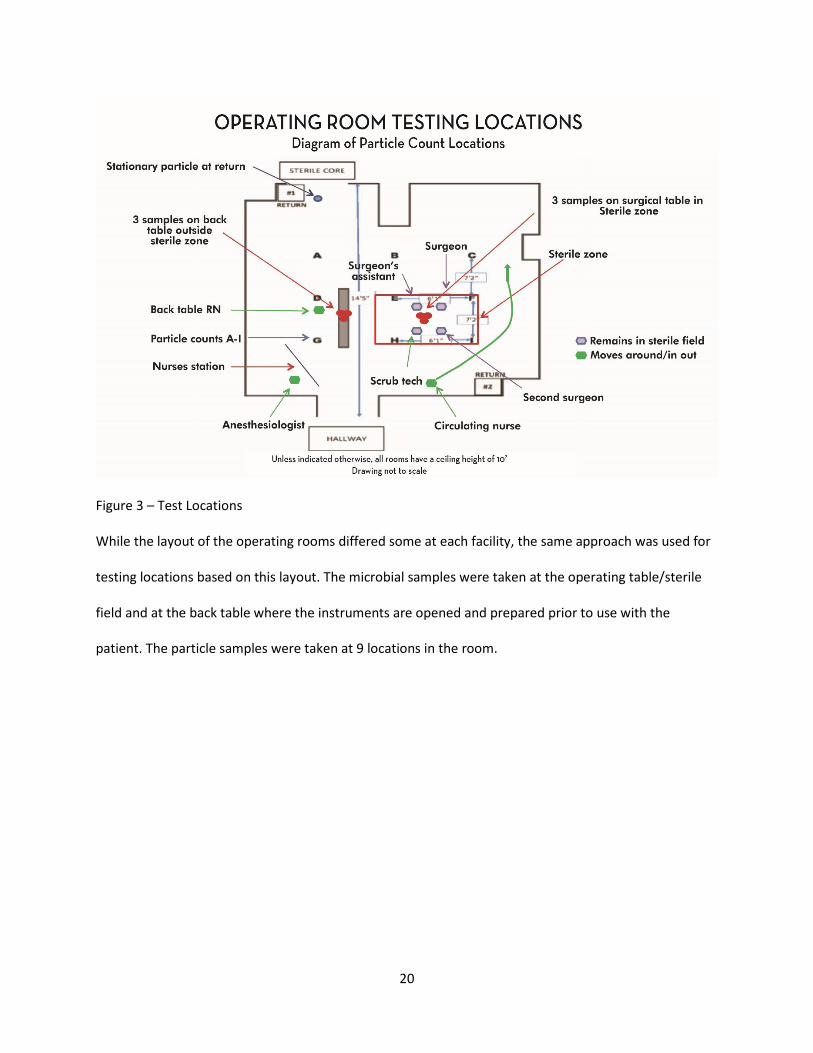
Figure 3 – Test Locations
While the layout of the operating rooms differed some at each facility, the same approach was used for
testing locations based on this layout. The microbial samples were taken at the operating table/sterile
field and at the back table where the instruments are opened and prepared prior to use with the
patient. The particle samples were taken at 9 locations in the room.

21
Figure 4 – Anemometer to Measure Air Velocities
In addition to microbial contaminants and number of particles, the EQI testing process measured the
velocity of the air at different points in the room to understand the air flow patterns. The direction and
speed of the air over the sterile field and back table are also factors in proper air management to
provide clean conditions for surgery.

22
Tables
20 Air Changes Per Hour Velocity at
Surgical Table Upper
Supply (Feet per Minute)
Velocity at Surgical
Table Lower Supply
(Feet per Minute)
Velocity at Back Table (Feet per Minute)
Temperature at Surgical
Table Upper Supply (Deg. F)
Temperature at Surgical
Table Lower Supply (Deg. F)
Temperature at Back Table
(Deg. F)
Mean Std. Dev.
Mean Std. Dev.
Mean Std. Dev.
Mean Std. Dev.
Mean Std. Dev.
Mean Std. Dev.
Site A 29.22 1.17 30.59 8.16 13.89 4.76 64.49 0.72 66.47 0.40 68.81 0.38
Site B 31.04 2.43 30.85 5.15 13.30 5.15 64.65 0.24 66.89 0.23 67.60 0.19
Site C 50.81 8.86 13.63 7.18 9.52 5.24 70.37 0.31 65.55 1.65 65.47 1.64
Table 1 – Air Velocities and Temperatures at 20 ACH
OR A OR B OR C MICROBIAL CFU/M3
Median Range ISO Median Range ISO Median Range ISO SF 3.0 1-10 7 22.0 14-41 8 6.0 0-13 8 BT 27.0 16-51 8 16.0 10-24 8 5.0 2-15 8 PARTICLES/m3
0.5
Median Average ISO Median Average ISO Median Average ISO 8.51x10⁴ 1.69x10⁵ 7 8.53x10⁴ 2.02x10⁵ 8 9.12x10⁵ 9.57x10⁵ 8
Table 2 – Microbial Data for Operating and Back Tables and 0.05 Micron Particle Data at 20 ACH
References
1. Zimlichman E. JAMA Internal Medicine September 2 , 2013 “ Health Care-Associated Infections A Meta-analysis of Costs and Financial Impacts on the US Health Care System”
2. CDC and ASTHO Association of State and Territorial Health Officials March 2011 “ Eliminating Healthcare-Associated Infections”
3. Memarzadeh F. and Weiren X. U Building Simulation March 2012 Volume 5 pp 15 to 28 “Role of Air Changes per hour (ACH) in Possible Transmission of Airborne Infections”
4. Kowalski,WJ (2007) “Air-treatment Systems for Controlling Hospital Acquired Infections” HPAC Engineering 79: pp. 24-48

23
5. Birgand G. American Journal of Infection Control 2015 1-6 “Air Contamination for Predicting Wound Contamination in clean Surgery: A Large Multicenter Study”
6. English, Travis HPAC Engineering 5/16/16
7. Memarzadeh F. and Manning A. ASHRAE Transactions 2002 V.108, Pt. 2 “Comparison of Operating Room Ventilation in the Protection of the Surgical Site”
8. Wagner, JA. Schreiber, KJ., Cohen, R. “ Improving Operating Room Contamination Control” ASHRAE Journal, February 2014
Acknowledgements
Eric Heidel, Ph.D. Owner and Operator of Scalë, LLC , Knoxville, TN
Statistics Department, Middle Tennessee State University, Murfreesboro, TN
Aerobiology Laboratory, Phoenix, AZ

24
CHAPTER 3
COST-BENEFIT ANALYSIS OF DIFFERENT AIR CHANGE RATES IN AN OPERATING ROOM ENVIRONMENT
Abstract
Lean measures within the healthcare industry are designed to control costs while maintaining
high quality. Evidence-based information is paramount in order to guide professionals and to achieve
optimum balance for best hospital practices. In this regard, hospital ventilation systems are important to
insure clean air within sterile environments, but also require abundant resources to operate and
maintain. The required ventilation rates for operating rooms have increased over the years with
minimal data to suggest that more ventilation provides cleaner conditions. We hypothesized that a test
of the Environmental Quality Indicators (EQI’s) utilizing a mock surgical procedure would provide
evidence that increased ventilation rates would not necessarily provide cleaner air conditions.
The purpose of this study was to evaluate the costs and benefits of different air change rates in an
operating room environment. The operating costs were estimated for the different facilities based on
actual energy usage, while the air quality was measured using environmental quality indicators. The cost
and quality data provided a comparative basis to assist in defining the optimum air change rates for
operating rooms. This information can guide policy makers who define the codes and the practical
applications for the estimated 38,000 operating rooms in the US. (Reference 1 AHA)
Background
Energy consumption for buildings is the highest category in the United States with heating,
ventilation and air-conditioning (HVAC) being the largest use (Figure 1). Hospital buildings, in particular,
have one of the highest energy demands due to their stringent heating and air conditioning
requirements, the significant amount of diagnostic and therapeutic equipment available, and the need
for 24 hour availability. Within the hospital, the operating room suites are the most expensive to heat,

25
cool and ventilate (Reference 2 Montanya). This cost is associated with stringent need for climate
control, as well as vigorous rates of air changes to help maintain sterile spaces.
Operating rooms have stringent requirements for the design, construction and operation of the
space and the systems serving the area. These are necessary to protect the patients and staff with one
of the primary goals being to provide a clean environment to help minimize the risk of surgical site
infections (SSI’s). In operating rooms, two primary methods to reduce airborne transmission of
contaminants are through proper ventilation of the physical space and filtration of the air. Ventilation is
accomplished by systematically changing the air in the operating room on a regular timetable. The
“new” air is typically a mixture of fresh air (approximately 20%) from the outside environment and air
recycled from the operating room space that has been filtered to remove particles and contaminants
(approximately 80%). The introduction of large quantities of conditioned and filtered air helps to dilute
the number of contaminants within the room and the proper placement of the supply and return air
devices directs the contaminants away from the sterile field.
There are many factors that can impact infection rates in surgical patients. Operating room air
quality is only part of a complex list of factors that can contribute to SSI’s, but direct connections
between air quality and surgical infections are difficult to prove (Reference 3 Memarazadeh). However,
it is intuitive that “dirtier” air can contribute to infections in the operating room and there is ample
evidence to suggest that the air can carry harmful pathogens (Reference 4 Kowalski and Reference 5
Schal).
The requirements for air changes in hospital operating rooms are primarily defined in the
Guidelines for the Design and Construction of Healthcare Facilities (Reference 6 FGI) and ASHRAE 170
(American Society of Heating, Refrigeration and Air Conditioning Engineers) (Reference 7 ASHRAE). In
the 2010 Edition of the Guidelines, these standards were combined which resulted in a significant
increase in the number of air changes required in new operating rooms built in many states in the U.S.

26
The minimum requirements went from 15 to 20 air changes per hour (ACH) and from 3 to 4 of these air
changes being fresh, outside air. While these are the minimum standards, in practice, most hospitals
use 20 to 30 ACH for their operating rooms, despite minimal evidence to suggest that a greater number
of air changes will provide cleaner air.
Air change rates also vary internationally (Figure 2). Different countries require different
number of air changes per hour, and some use other standards, such as ISO. In spite of these significant
variations in operating room ventilation rates, surgical site infection rates remain similar between these
countries. Surgical infection rates averaged 1.9% in the United States, 2.2% in Europe, 1.6% in Germany,
1.4% in England, 1.6% in France, and 2.0% in Portugal (Reference 8 Yunzhou).
Given the variation in required air change rates in hospital operating rooms and the high energy
costs of providing more air changes per hour, research in this field could help clarify the appropriate
balance between the costs and benefits of different ventilation rates. We therefore hypothesized that a
test of the Environmental Quality Indicators (EQI’s) utilizing a mock surgical procedure that has been
previously identified could provide measurable, repeatable and verifiable results for analysis of
operating room air quality. (Reference 9 Gormley et al) This coupled with an analysis of the energy costs
for different air change rates could provide the basis for a realistic cost-benefit analysis to provide
guidance on hospital practices and code requirements.
Means and Methods
Environmental Quality Indicator Testing
This method of testing dynamic operating room EQI’s was utilized at three different hospital
operating rooms. A one hour scripted simulated medical procedure was enacted to mimic the dynamic
conditions seen during actual surgery in an operating room. Air velocities at key locations in the rooms
provided insight into the flow of the air used for ventilation to provide “clean” conditions for surgery.

27
The velocities were measured at the face of the supply grilles and the return grilles, as well as at two
critical locations-the operating room table (sterile field) and at the back instrument table.
Three different operating rooms in three different hospitals in two different states were chosen
for experimentation. The ORs in two hospitals were associated with academic medical schools (OR’s A
and B), both had HEPA filtered air supplied to the rooms and were 638 and 554 square feet,
respectively. The third OR (OR C) was located in a private community hospital, had MERV 14 filters and
was 505 square feet. The layout of the operating rooms was generally the same, but the actual number
and location of the supply air diffusers varied along with the location of overhead lights and equipment
booms. Studies took place from the summer of 2015 to the spring of 2016.
Bioscience viable surface air samplers (SAS180) were placed at both the surgical operating field
and at the back instrument table to detect the contaminants. Petri plates with Tryptic Soy Agar (TSA)
media were used in the samplers and were changed in regular cycles to collect microbial data during the
entire mock procedure. The viable microbial samples were sent under chain of custody to a third-party
microbiology laboratory for qualitative and quantitative analysis of bacteria. Bacterial genus and species
were identified and quantified as colony forming units per cubic meter. Particle contamination was
measured using a Climet Model CJ-750T 75 LPM counter or Lighthouse World Wide Solutions (LWS)
handheld 3016-IAQ particle meters. ISO 14644 standards were utilized which required measuring the
number of particles at 9 points based on the size of the space. The particle sizes recorded were 0.3, 0.5,
1.0, and 5.0 microns in particles per cubic meter.
Testing was performed at 15, 20 and 25 air changes per hour (ACH) during the mock surgical
procedure. The air change rates were measured using standard HVAC test and balance hoods
manufactured by Shortridge Model number 9565-P. In addition, the building automation systems (BAS)
were used the set and monitor the ventilation rates and temperatures in the operating rooms. The
measurements were taken at each supply and return grill in cubic feet per minute (CFM) and the air

28
change rates in ACH were calculated based on the actual size of each individual operating room (Table 1-
sample OR air change calculation). While the layout of supply grilles varied some in each operating
room, all three of them had two low wall returns grilles (Figure 3-picture of supply grilles).
Cost Analysis
The higher air change rates require a significant amount of additional air to be conditioned,
filtered and supplied to the operating room. For example, in a typical 600 ft.² OR with a 10 foot ceiling
25 ACH requires 60,000 more total cubic feet of air per hour than 15 ACH. This increases the capital or
construction costs as a result of incrementally larger fans, duct work and heating/cooling capacity
required. It also significantly increases the operating or energy cost as a result of conditioning, filtering
and moving the additional air.
This applied research project focused on the operating costs, which varied by hospital as result
of the variations in the cost of energy and the type of systems in the different locations. The mechanical
engineer on the research team worked with the facility managers at the 3 sites to estimate the cost for
one air change per OR per year. The three primary elements included in the pricing are the fan power
(supply and return), cooling (chillers, pumps and cooling tower fans) and the preheat/reheat/humidity
control.
The cost per kilowatt hour (kW) for the energy was determined along with the number of kW
per ton. With this information and the cost per therm, the estimated energy cost for 5 ACH per year per
OR was developed (Table 2A & 2B- cost estimates).
Statistical Analysis
Skewness and kurtosis statistics were run on continuous distributions to test for the assumption
of normality. All distributions in the study were assumed to be non-normal with skewness and kurtosis
statistics above an absolute value of 2.0. Due to this violation of normality, only non-parametric
statistics were used to answer research questions in this study. Kruskal-Wallis tests were used to assess

29
main effects when comparing three or more groups. In the event of a significant main effect, Mann-
Whitney U tests were used in a post hoc fashion to explain pairwise differences. When comparing two
groups on outcomes, Mann-Whitney U tests were used. Medians and interquartile ranges were
reported to give context to all inferential findings. All analyses were conducted using SPSS Version 21
(Armonk, NY: IBM Corp.).
Results
Environmental Quality Indicators
Particles
The particle counts at Sites A and B were very close, but there was a nonsignificant difference,
p=.08. At the same time, the relationship between average particle counts at the different air change
rates stayed the same with 20 ACH better than 15 ACH, but 25 ACH being no better than 20 (Figure 4 –
graph of particle counts at different air changes). Both of the sites had high-efficiency particulate air
filters (HEPA). Site C did not have HEPA filters and the particle counts were significantly higher although
the relationships at different air change rates were similar at 15 and 20 ACH , but not at 25 ACH. The
particle counts were 10 times higher than the other sites without HEPA filters which indicate a benefit
with these filters in spite of the higher costs.
The larger particles (1.0 and 5.0 µm) were significantly lower and much more consistent at all
three sites which could indicate that the filters perform better on these sizes as opposed to the smaller
ones. There are studies that suggest many viruses and bacteria are carried on squamous cells which are
typically in this larger range. This could bring into question the benefits of using the more expensive
HEPA filters if they are just removing very fine particles which may not be the primary source of surgical
site infections.

30
The particle counts were compared to ISO classifications, which is used for the pharmaceutical
and computer chip industries. All three sites were within ISO class 7 or 8 which might typically be used
for a sub-sterile area in a pharmacy compounding facility.
Microbial Contaminants
The level of microbial contaminants were consistent at the two academic medical centers with a
non-significant difference p=.21. There was a significant difference in the microbial levels between the
two academic medical centers and the community hospital with a p-value of <.001. As with the particles,
there was a measurable increase in the quality of the air from 15 to 20 ACH but it did not improve
significantly from 20 to 25 ACH. At 15 ACH the Median was 17.000 and the Interquartile Range (IR) was
33.0, while at 20 ACH the Median was 11.000 and the IR was 15.0 which are very close to 25 ACH with a
Median of 10.000 and IR of 12.5.
Surprisingly, the colony forming unit (CFU) count at Site C, which was a community hospital, was
lower even though the particle count was higher. After further research, we found that the OR at Site C
had not been used the day before the test and was lightly loaded even earlier that week. The OR’s at
Site A and B were used for full caseloads on Friday before the tests were done on Saturday. We
theorized that the lack of clinical activity could have reduced the microbial load in the room with the
absence of patients and staff. This is consistent with another study of microbiological contaminants in a
new hospital before and after it was opened which showed no difference in the nosocomial infection
rates from the old hospital. This suggested that it was the organisms generated from the activity in the
hospital not the unoccupied space that contributed to the microbiological contaminants and resulting
infection rates (Reference 10 Maki et al).
Although SSIs are the “third most common health care-associated and contribute to 13 to 17%
of all such infections”, there is no industry accepted method to for routine monitoring of airborne
microbial contaminants. This research stated that “appropriate ventilation is critical for SSI prevention”

31
but did not provide a conclusion as to the required number of air changes to effectively control this risk
(Reference 11 Brigand et al).
Velocity
Our testing in all cases showed that the actual air velocity at the sterile field and back table
varied significantly. In some cases, the velocity of the air ranged from high of 30 feet per minute (FPM)
at the diffuser to a low of 3 FPM at the sterile field, while in most cases the velocity at the sterile field
was a third of that at the ceiling level. It appears that the conditioned and filtered air is often flowing
very slowly at the sterile field even though that is a key element in providing safe conditions for surgery
(Figures 5 A and B air velocities at sterile field and back table). Our testing also indicated that the air
flow is very low at the back table where the surgical instruments are opened and prepared. The
velocities there averaged less than 15 FPM which would provide little flow of conditioned and filtered
air.
Cost
The costs to provide ventilation to the three operating rooms varied based on location local utility rates
in the type of HVAC system. Based on analysis of these factors, the estimated costs for five air changes
per OR per year were developed for each of the three sites. They are listed below with additional detail
in Tables 2A and 2B:
• Site A - $ 8,775 / 5 ACH/OR/year
• Site B - $ 4,870 / 5 ACH/OR/year
• Site C - $ 4,870 / 5 ACH/OR/year
Discussion
The common practice with operating room HVAC systems is to supply the air from ceiling
mounted diffusers that directs the flow over the operating room table to low return grilles mounted in
opposing corners of the room. The goal is provide the sterile field and surgical site with conditioned and

32
filtered air to minimize the risk of surgical site infections. The codes require minimum velocity 25 to 35
FPM at the face of the ceiling diffuser. All three sites met this requirement, however the velocity of the
clean air at the sterile field had wide ranges and at the lows was close to or less than 10 FPM. A
consistent and strong supply of clean air may not be reaching the patient area at all times.
In general, the back tables had higher particle counts and microbial contaminants than the
sterile field. There were nearly twice as many microbial contaminants with Median of 10.000 at the
sterile field and 18.000 at the back table. The IR’s were similar with the sterile field at 25.5 and the back
table at 25.5. The velocities were typically less than 5 FPM which provides little flow of clean air. The
supply air diffusers are typically focused on the sterile field/operating table and dedicated supply air is
not directed at the back table. This may not be practical as the table may be in different locations
depending on the type of surgery. Given the fact that the instruments are opened and lying on the back
table, this appears to be a potential risk for the introduction of foreign material into the surgical site
The number of particles and microbial contaminants varied significantly across the three sites.
While there were consistent trends as noted before, there were also wide variances in the sites where
one would have predicted similar results. For example, at the two academic medical centers with
modern, new operating rooms utilizing HEPA filters the particle count averages were 220,000 particles
per cubic meter at one location and 580,000 particles per cubic meter at the other similar operating
room at the same air change rate. The microbial contaminants also varied significantly in a few cases
and at one site the colony forming units were lower than other sites even though the particle counts
were higher as a result of not having HEPA filters in the system. These significant differences in some of
the data show the variations in operating room designs and functionality. Further testing will be
required to establish reasonable and realistic levels of particles and microbial contaminants; however
ISO classifications could be applied in operating room environments as it is done in other industries.

33
The use of ISO standards or environmental quality indicators to define the requirements for
operating room air is another approach to be considered. While ventilation rates as measured in air
changes per hour have been the standard for many years, the amount of air circulated through the
room may not tell the whole story. Through better or different approaches for “air management” in the
operating rooms, cleaner air could be delivered at key points, such as the back table and sterile field, at
no more or maybe even less cost. By using environmental quality indicators, the cleanliness of the air
and proper air flows could be monitored and maintained at the minimum air change rates required
rather than a set standard.
In addition to the humanitarian and clinical reasons for providing proper ventilation in operating
rooms in order to help reduce surgical site infections, in today’s world there is also the practical need to
manage the business risk for the healthcare provider. It appears that providing more air changes per
hour is the safest approach as a national standard- ASHRAE 170 was 12 in 2008 and it has increased to
20 ACH while almost all hospitals in the US provide more than 20 with 25 being common in general ORs
and up to 30 or 40 ACH in neuro or ortho rooms. There is little scientific evidence to support that
increasing the ventilation rates to higher levels actually reduces surgical site infections and one study
using a computational fluid dynamics (CFD) model concluded that “ a lower percentage of particles hit
the site in a case that has an ACH of 20 than one that has an ACH of 150”. It suggested that the design of
the ventilation system was potentially a more significant factor in proper ventilation than the number of
air changes (Reference 12 Memarazadeh). This raises the question as to the appropriate number of air
changes required to provide a safe environment for the patients at a reasonable cost without adding
financial and legal risk for the facility. Can a hospital use the national standard of 20 ACH in lieu of higher
rates without weakening their defense in the event of litigation related to a surgical site infection?

34
Conclusions
20 ACH appears to be the most cost-effective ventilation rate based on the three tested. In all
cases, 25 ACH did not significantly improve the quality of air as compared to 20 ACH. In all cases, 20 ACH
was better than 15 ACH, but more so at the two academic sites than at the third. The cost of higher air
change rates can be a significant expense to the healthcare system when factored over the number of
operating rooms in the US. While the cost differs at each facility, the average cost for the three sites was
almost $ 6,171 per 5 ACH per year per OR. One of the participants in the study has 90 ORs and higher
than typical energy costs, so their estimated system wide cost for 25 versus 20 ACH was over $500,000/
per year.
The question that remains unanswered is if 15 ACH is adequate. 15 ACH had significantly higher
particle counts and microbial contaminants as compared to 20 ACH, but it does not necessarily translate
to higher rates of SSIs. This was the requirement in many states before 2010 and it was 12 ACH before
that. Is this improvement worth the cost? There is the potential for significant cost savings if one could
demonstrate through the analysis of surgical site infections or other methods that the risk is no greater
at 15 ACH than at the higher rates currently being used in hospitals in the US.
The use of environmental quality indicators for the operating room environment may be a
better or even a supplemental standard for air change rates. These indicators, such as level of microbial
contaminants, number of particles and velocity of the air at key points, could provide more accurate
measurements of the actual quality of the air and the potential to minimize the risk of surgical site
infections. As the hospitals face the dual challenge of improving quality while reducing costs, the use of
measurable quality indicators may provide the tool to define the optimum ventilation rate from a cost-
benefit standpoint.

35
Figures
Figure 1 – Energy Use per Square Foot of Building Space - Of the total energy use in the US, buildings
comprises 40%. The largest portion of this cost is for the HVAC which is 17%. Inpatient healthcare is the
second-largest energy use sector for facilities.

36
Figure 2 – European Operating Room Classification Parameters and Ventilation Requirements - The
ventilation rates in other countries vary from each other and from the US standards. In several cases,
the European standards employ not only air change rates but also microbial and particle levels.
37
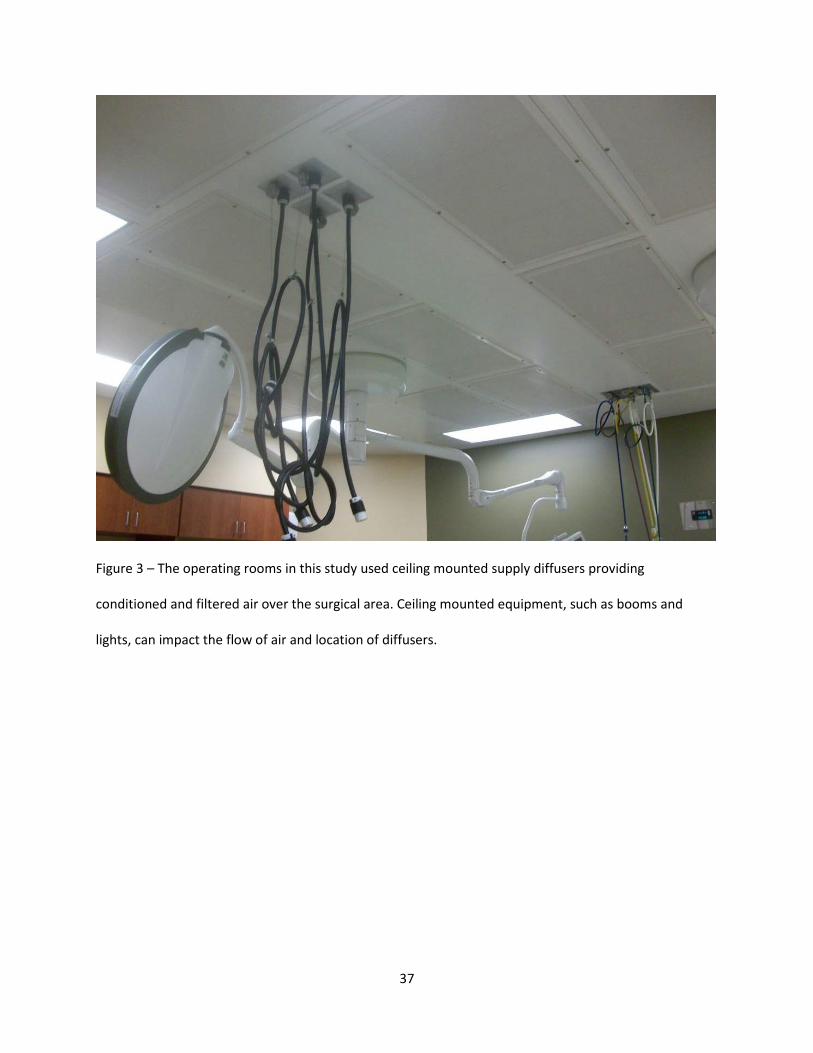
Figure 3 – The operating rooms in this study used ceiling mounted supply diffusers providing
conditioned and filtered air over the surgical area. Ceiling mounted equipment, such as booms and
lights, can impact the flow of air and location of diffusers.

38
Figure 4 – In all cases, the particle levels at 20 ACH were lower than at 15 ACH. In both academic medical
centers, the number of particles at 20 ACH and 25 ACH were very similar. At the community hospital,
the number of particles was actually higher at 25 ACH that at 20 ACH.

39
Figure 5A - The velocity of the air varied significantly at the sterile field and at the back table. In all cases,
the velocity of the air was lower at the back table and in some cases was less than 10 FPM.

40
Figure 5B - The velocity of the air varied significantly at the sterile field and at the back table. In all cases,
the velocity of the air was lower at the back table and in some cases was less than 10 FPM.
Tables
27 x 27 operating room with 10 ft ceiling =7300 CF
20 ACH per hour so 20 x 7300 =146,000 CF/ hour or 2433 CFM
To determine the supply grille face velocity divide CFM by the square feet face of the grille. FGI
Guidelines recommend 25 to 35 CFM/SF
Note: more supply than return is required to maintain positive pressure relative to adjacent spaces.
Table 1 – Sample OR Air Change Calculation

41
HVAC System or Component Per 5 ACH per Year per OR
Fan Power (Supply & Return) $3,880 Cooling $2,585 Steam $2,310 Total* $8,775
Table 2A – Site A estimated utility operating cost per 5 ACH/yr/OR for 730 SF OR @ 22 ACH based upon
average mid-west utility rates with district energy chilled water and steam plant
HVAC System or Component Per 5 ACH per Year per OR
Fan Power (Supply & Return) $3,880 Cooling (Chillers, Pumps, Tower Fans)
$225
Pre Heat/Reheat/Humid. (Reheat Pumping)
$765
Total* $4,870
Table 2B – Site B estimated utility operating cost per 5 ACH/yr/OR for 730 SF OR @ 22 ACH based upon
average mid-west utility rates with onsite chilled water and steam plant
References
1. American Hospital Association – Website - 2016
2. Montanya E. et al HVAC&R Research 2014 20 pp 643 to 654; “Indoor Environmental Quality and Infection Control in Surgery rooms: Code requirements vs Performance Motivation. A Critical Review”
3. Memarzadeh F. and Weiren X. U Building Simulation -March 2012 Volume 5 pp 15 to 28; “Role of Air Changes per hour (ACH) in Possible Transmission of Airborne Infections”
4. Kowalski,WJ (2007) HPAC Engineering 79: pp. 24-48; “Air-treatment Systems for Controlling Hospital Acquired Infections”
5. Schal KP J Hosp Infect. 1991 Jun; 18 Suppl A:451-9; “Medical and microbiological problems arising from airborne infection in hospitals”
6. Facility Guidelines Institute – Guidelines for the Design and Construction of Hospitals
7. ASHRAE 170 –Industry standard for hospital HVAC systems

42
8. Yunzhou F. et al Scientific Reports 2014 ; “The Incidence and Distribution of Surgical Site Infections in Mainland China: A Meta-Analysis of 84 Prospective Observational Studies”
9. Gormley et al Methodology For Analyzing Environmental Quality Indicators (EQIs) in a Dynamic Operating Room Environment” –accepted for publication by the American Journal of Infection Control; 9/2016
10. Maki,D.G. et al The New England Journal of Infection Control ; 1982 ; 307; 1562-1566 “Relation of the inanimate hospital environment to endemic microbial infections”
11. Birgand G. American Journal of Infection Control 2015 1-6 “Air Contamination for Predicting Wound Contamination in clean Surgery: A Large Multicenter Study”
12. Memarzadeh F. and Manning A. ASHRAE Transactions 2002 V.108, Pt. 2 “Comparison of Operating Room Ventilation in the Protection of the Surgical Site”
Acknowledgements
Eric Heidel, Ph.D. Owner and Operator of Scalë, LLC , Knoxville, TN
Aerobiology Laboratory, Phoenix, AZ

43
CHAPTER 4
CONSTRUCTION MANAGEMENT OF HEALTHCARE PROJECTS
• Book on related topic of healthcare construction
• Published by McGraw-Hill in 2013
• Co-written by Thomas C. Gormley
• Forwards provided by Facilities Guidelines Inst., International Building Code Council and
American Society of Healthcare Engineering
A complete, practical guide to managing healthcare facility construction projects. Filled with
best practices and the latest industry trends, Construction Management of Healthcare Projects describes
the unique construction requirements of hospitals, including building components, specialized functions,
codes, and regulations. Detailed case studies offer invaluable insight into the real-world application fo
the concepts presented. This authoritative resource provides in-depth information on how to safely and
successfully deliver high-quality healthcare construction projects on time and within budget. Coverage
includes:
• Regulations and codes impacting hospitals
• Planning and predesign
• Project budgeting
• Business planning and pro formas
• Healthcare project financing
• Traditional delivery methods for healthcare projects
• Modern project delivery methods and alternate approaches
• The challenges of additions and renovations
• Mechanical and electrical systems in hospitals
• Medical technology and information systems

44
• Safety and infection control
• Commissioning of healthcare projects
• Occupying the project
• The future of healthcare construction

45
CHAPTER 5
SUMMARY
Overview
This research project, completed as part of my PhD requirements, has been an incredible
learning experience. The research involved both healthcare and engineering to explore how the
designed indoor environment can potentially contribute to improving clinical outcomes. This work
required learning about operating room practices from scrubbing to prepare for surgery through to
using surgical tools. On the engineering side, I learned how the HVAC system is designed, built and
operated to control the air quantity and quality controls to provide a comfortable and safe environment
for surgery.
Through collaboration, team developed the concept of Environmental Quality Indicators (EQI’s)
which is a measure of the overall air quality considering all of these factors. These are: temperature,
relative humidity, particle load, number of microbial contaminants, ventilation rates, pressurization and
airflow. The multi-disciplined team included a Board certified surgeon to provide clinical input, an air
quality expert to guide the testing procedures, a mechanical engineer to provide design input and an
HVAC testing specialist to take the measurements. With their help, I learned how to measure these
important indicators in a dynamic operating room condition. I was able to organize and find funding for
the testing at three different hospitals to compare the air quality at different ventilation rates. Working
with a PhD statistician, I learned how to analyze a significant amount of data we had gathered at the
three sites with the four different ventilation rates that were tested. From this analysis, the results of
varying the air change rates could be effectively defined.
Executing the mock surgical procedures in the three different operating rooms was the most
interesting and allowed us to take measurements under dynamic, surgery like conditions. The only key
element missing was the patient and this was a conscious decision. The approvals required to test in an

46
operating room during live procedures were going to be difficult, if not impossible to obtain. Not having
an actual patient in the room also gave us much more freedom to test in different ways and at critical
locations. We used a steak to simulate surgery using an electro cauterization tool, called a Bovie, and
other surgical tools. The mock surgical team scrubbed, dressed out and followed standard operating
room cleaning, gowning procedures and instrument preparation.
Working with the energy managers at each of the three facilities, we were able to estimate the
cost of different air change rates. We found that five air changes per hour is equivalent to approximately
$5000 per year per operating room. For large systems with multiple operating rooms, this could amount
to savings in the hundreds of thousands. However, relative to the overall revenues generated by
surgeries this is a very small number. Providing air changes at rates of 25 ACH, when the code only
requires 20 ACH, will probably be perceived as a reasonable investment to minimize the risk of surgical
site infections caused by airborne contaminants. There is however, a point of diminishing returns where
additional air changes are unnecessary and just a waste of money. Hopefully, this research will help
confirm that ventilation rates greater than 25 ACH are not adding value in a typical operating room.
Given the different approaches to maintaining air quality used by other countries and in other
industries, the question remains as to whether requiring minimum air changes per hour is the best
metric. The requirements for minimum air quality may be better expressed as a combination of the
multiple factors impacting cleanliness and particle control. As mentioned before, these are:
temperature, relative humidity, particle load, number of microbial contaminants, pressurization and
airflow which are addressed by the environmental quality indicator concept.
There were several limitations to this research project that should be identified. These items
were evaluated, but could not be changed.
• The OR’s were not the same size and had different configurations for the supply air grilles

47
• One OR was in a community hospital and the other two were in academic centers which
showed different conditions
• The tests were taken at different times of the year in different cities which could have
changed the outdoor air conditions
• Funding was limited so only three sites could be done
Conclusions
There were several conclusions that came from the research project. One of the original thesis
ideas was incorrect as I thought 15 ACH would be just as good as 20 ACH. This is not correct. 20 ACH is
significantly cleaner than 15 ACH, however 25 ACH is not significantly cleaner than 20 ACH. The air flow
at back table is lower than expected and could add risk as the surgical instruments are opened there and
could be exposed to air borne contaminants. The potential cost savings could be hundreds of thousands
of dollars for large system to reduce air change rates from 25 to 20 ACH, however the savings are small
relative to overall revenue compared to perceived risk of impacting SSI’s
Recommendations for Research
Throughout the project, questions rose where additional research could be valuable. We
identified the list below as the best opportunities.
• Utilize EQI air testing protocol for other rooms in healthcare facilities to verify cost-benefits
for code required minimums i.e. patient rooms
• Obtain surgical site infection data and compare those results to different air change rates
and air quality indicators in operating rooms
• Develop for application in the industry a comprehensive air quality metric using multiple
indicators to provide a better view of air quality than just air change rates

48
APPENDIX –EXAMPLES OF MICROBIAL TEST RESULTS
Prism Environmental Health and Safety Solutions, Inc. PO Box 1702
Discovery Bay, California 94505
Attn: Jennifer Wagner
Project: OR Research Project-Vanderbilt (Sample F)
Condition of Sample(s) Upon Receipt: Acceptable
Date Collected: 11/07/2015
Date Received: 11/11/2015
Date Analyzed: 11/20/2015
Date Reported: 11/20/2015
Project ID: 15029369
CLIENT SAMPLE #: 18
Sample Location: 15-1 SF F
Test: 1107, USP 797 Culture, Air, Bacterial Counts with ID: SOP 2.2
Lab Sample #: 15029369-001
Positive Hole: 401
Positive Hole Corrected Result: 35 CFU/m3
Air Volume: 1000 (L)
MRL: 1
Organism Name: Raw Count CFU/m3 % Total Reservoirs Coag-negative Staphylococcus species 10 1
30 Human Micrococcus species 23 2
70 Human 33 3
~100%
CLIENT SAMPLE #: 24
Sample Location: 15-2 SF F

49
Lab Sample #: 15029369-002
Test: 1107, USP 797 Culture, Air, Bacterial Counts with ID: SOP 2.2
Positive Hole: 401
Positive Hole Corrected Result: 62 CFU/m3
Air Volume: 1000 (L)
MRL: 1
Organism Name: Raw Count CFU/m3 % Total Reservoirs Coag-negative Staphylococcus species 23 23 40 Human Micrococcus species 34 34 60 Human
57 57 ~100%
CLIENT SAMPLE #: 30
Sample Location: 15-3 SF F
Lab Sample #:
15029369-003
Test: 1107, USP 797 Culture, Air, Bacterial Counts with ID: SOP 2.2
Positive Hole: 401
Positive Hole Corrected Result: 28 CFU/m3
Air Volume: 1000 (L)
MRL: 1
Test: 1107, USP 797 Culture, Air, Bacterial Counts with ID: SOP 2.2
Positive Hole: 401
Positive Hole Corrected Result: 28 CFU/m3
Air Volume: 1000 (L)
MRL: 1

50
Organism Name: Raw Count CFU/m3 % Total Reservoirs Coag-negative Staphylococcus species 11 11 41 Human Micrococcus species 16 16 59 Human
27 27 ~100%
CLIENT SAMPLE #: 36
Sample Location: 15-4 SF F
Test: 1107, USP 797 Culture, Air, Bacterial Counts with ID: SOP 2.2
Lab Sample #: 15029369-004
Positive Hole: 401
Positive Hole Corrected Result: 50 CFU/m3
Air Volume: 1000 (L)
MRL: 1
Organism Name: Raw Count CFU/m3 % Total Reservoirs Bacillus species 7 7 15 Environment Coag-negative Staphylococcus species 10 10 21 Human Micrococcus species 30 30 64 Human
47 47 ~100%
CLIENT SAMPLE #: 42
Sample Location: 15-5 SF F
Lab Sample #: 15029369-005
Test: 1107, USP 797 Culture, Air, Bacterial Counts with ID: SOP 2.2
Positive Hole: 401
Positive Hole Corrected Result: 66 CFU/m3
Air Volume: 1000 (L)
MRL: 1

51
Organism Name: Raw Count CFU/m3 % Total Reservoirs Bacillus species 3 3 5 Environment Coag-negative Staphylococcus species 23 23 38 Human Micrococcus species 35 35 57 Human
61 61 ~100%
CLIENT SAMPLE #: 48
Sample Location: 15-6 SF F
Lab Sample #: 15029369-006
Test: 1107, USP 797 Culture, Air, Bacterial Counts with ID: SOP 2.2
Positive Hole: 401
Positive Hole Corrected Result: 29 CFU/m3
Air Volume: 1000 (L)
MRL: 1
Organism Name: Raw Count CFU/m3 % Total Reservoirs Coag-negative Staphylococcus species 11 11 39 Human Micrococcus species 17 17 61 Human 28 28 ~100%
CLIENT SAMPLE #: 54
Sample Location: 15-7 SF F
Test: 1107, USP 797 Culture, Air, Bacterial Counts with ID: SOP 2.2
Lab Sample #: 15029369-007
Positive Hole: 401
Positive Hole Corrected Result: 75 CFU/m3
Air Volume: 1000 (L)
MRL: 1

52
Organism Name: Raw Count CFU/m3 % Total Reservoirs Bacillus species 13 13 19 Environment Coag-negative Staphylococcus species 36 36 53 Human Coryneform bacteria group/Corynebacterium group 1 1 1 Human/
Environment Micrococcus species 18 18 26 Human 68 68 ~100%
CLIENT SAMPLE #: 60
Sample Location: 15-8 SF F
Test: 1107, USP 797 Culture, Air, Bacterial Counts with ID: SOP 2.2
Lab Sample #: 15029369-008
Positive Hole: 401
Positive Hole Corrected Result: 41 CFU/m3
Air Volume: 1000 (L)
MRL: 1
Organism Name: Raw Count CFU/m3 % Total Reservoirs Bacillus species 3 3 8 Environment Coag-negative Staphylococcus species 14 14 36 Human Micrococcus species 22 22 56 Human
39 39 ~100%
CLIENT SAMPLE #: 66
Sample Location: 20-1 SF F
Lab Sample #: 15029369-009
Test: 1107, USP 797 Culture, Air, Bacterial Counts with ID: SOP 2.2
Positive Hole: 401
Positive Hole Corrected Result: 23 CFU/m3
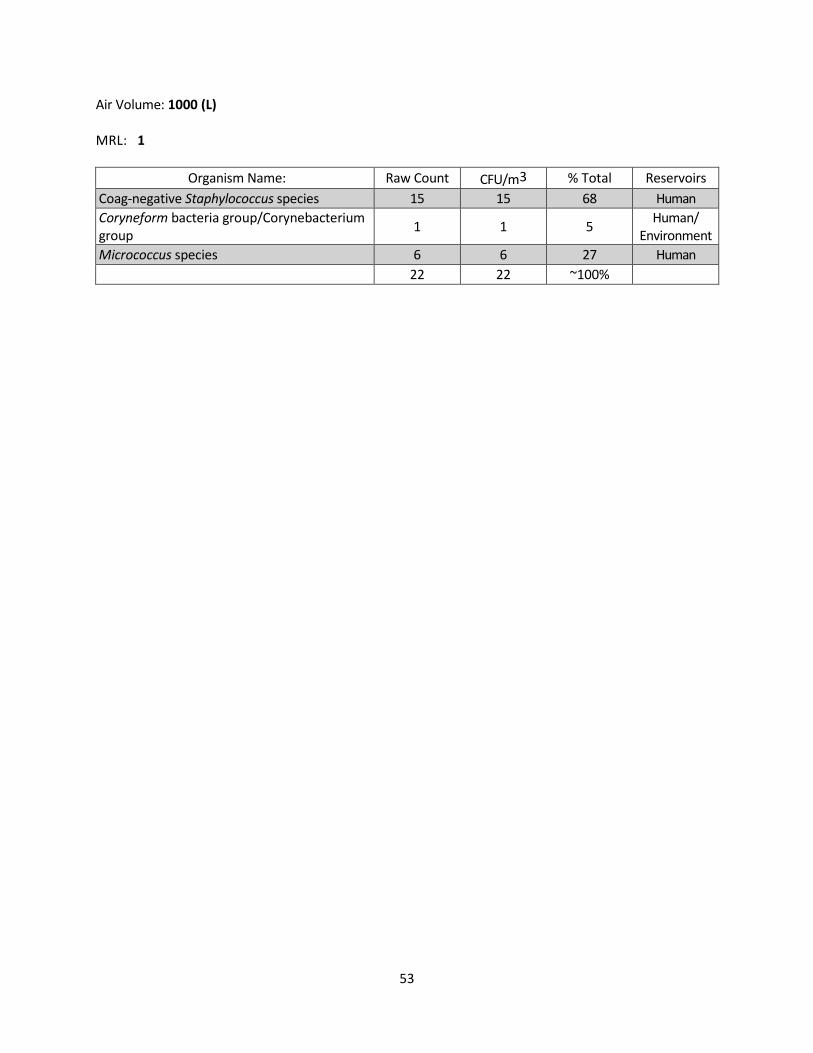
53
Air Volume: 1000 (L)
MRL: 1
Organism Name: Raw Count CFU/m3 % Total Reservoirs Coag-negative Staphylococcus species 15 15 68 Human Coryneform bacteria group/Corynebacterium group 1 1 5 Human/
Environment Micrococcus species 6 6 27 Human
22 22 ~100%

54
CLIENT SAMPLE #: 72
Sample Location: 20-2 SF F
Test: 1107, USP 797 Culture, Air, Bacterial Counts with ID: SOP 2.2
Lab Sample #: 15029369-010
Positive Hole: 401
Positive Hole Corrected Result: 19 CFU/m3
Air Volume: 1000 (L)
MRL: 1
Organism Name: Raw Count CFU/m3 % Total Reservoirs Coag-negative Staphylococcus species 10 10 56 Human Micrococcus species 8 8 44 Human 18 18 ~100%
CLIENT SAMPLE #: 78
Sample Location: 20-3 SF F
Lab Sample #: 15029369-011
Test: 1107, USP 797 Culture, Air, Bacterial Counts with ID: SOP 2.2
Positive Hole: 401
Positive Hole Corrected Result: 14 CFU/m3
Air Volume: 1000 (L)
MRL: 1
Organism Name: Raw Count CFU/m3 % Total Reservoirs Bacillus species 1 1 7 Environment Coag-negative Staphylococcus species 4 4 29 Human Micrococcus species 9 9 64 Human
14 14 ~100%
CLIENT SAMPLE #: 84

55
Sample Location: 20-4 SF F
Lab Sample #: 15029369-012
Test: 1107, USP 797 Culture, Air, Bacterial Counts with ID: SOP 2.2
Positive Hole: 401
Positive Hole Corrected Result: 19 CFU/m3
Air Volume: 1000 (L)
MRL: 1
Organism Name: Raw Count CFU/m3 % Total Reservoirs Coag-negative Staphylococcus species 11 11 61 Human Micrococcus species 7 7 39 Human 18 18 ~100%
CLIENT SAMPLE #: 90
Sample Location: 20-5 SF F
Test: 1107, USP 797 Culture, Air, Bacterial Counts with ID: SOP 2.2
Lab Sample #: 15029369-013
Positive Hole: 401
Positive Hole Corrected Result: 14 CFU/m3
Air Volume: 1000 (L)
MRL: 1
Organism Name: Raw Count CFU/m3 % Total Reservoirs Coag-negative Staphylococcus species 6 6 43 Human Micrococcus species 8 8 57 Human 14 14 ~100%
CLIENT SAMPLE #: 96
Sample Location: 20-6 SF F

56
Lab Sample #: 15029369-014
Test: 1107, USP 797 Culture, Air, Bacterial Counts with ID: SOP 2.2
Positive Hole: 401
Positive Hole Corrected Result: 16 CFU/m3
Air Volume: 1000 (L)
MRL: 1
Organism Name: Raw Count CFU/m3 % Total Reservoirs Coag-negative Staphylococcus species 9 9 56 Human Micrococcus species 7 7 44 Human 16 16 ~100%
CLIENT SAMPLE #: 102
Sample Location: 20-7 SF F
Lab Sample #: 15029369-015
Test: 1107, USP 797 Culture, Air, Bacterial Counts with ID: SOP 2.2
Positive Hole: 401
Positive Hole Corrected Result: 27 CFU/m3
Air Volume: 1000 (L)
MRL: 1
Organism Name: Raw Count CFU/m3 % Total Reservoirs Coag-negative Staphylococcus species 16 16 62 Human Micrococcus species 10 10 38 Human
26 26 ~100%
CLIENT SAMPLE #: 108
Sample Location: 20-8 SF F
Lab Sample #: 15029369-016

57
Test: 1107, USP 797 Culture, Air, Bacterial Counts with ID: SOP 2.2
Positive Hole: 401
Positive Hole Corrected Result: No Growth
Air Volume: 1000 (L)
MRL: 1
Comments: No impaction marks detected on sample. No bacteria detected
CLIENT SAMPLE #: 114
Sample Location: 25-1 SF F
Test: 1107, USP 797 Culture, Air, Bacterial Counts with ID: SOP 2.2
Lab Sample #: 15029369-017
Positive Hole: 401
Positive Hole Corrected Result: 11 CFU/m3
Air Volume: 1000 (L)
MRL: 1
Organism Name: Raw Count CFU/m3 % Total Reservoirs Bacillus species 2 2 18 Environment Coag-negative Staphylococcus species 6 6 55 Human Micrococcus species 3 3 27 Human
11 11 ~100%
CLIENT SAMPLE #: 120
Sample Location: 25-2 SF F
Lab Sample #: 15029369-018
Test: 1107, USP 797 Culture, Air, Bacterial Counts with ID: SOP 2.2
Positive Hole: 401
Positive Hole Corrected Result: 18 CFU/m3

58
Air Volume: 1000 (L)
MRL: 1
Organism Name: Raw Count CFU/m3 % Total Reservoirs Bacillus species 2 2 12 Environment Coag-negative Staphylococcus species 11 11 65 Human Micrococcus species 4 4 24 Human
17 17 ~100%
CLIENT SAMPLE #: 126
Sample Location: 25-3 SF F
Lab Sample #: 15029369-019
Test: 1107, USP 797 Culture, Air, Bacterial Counts with ID: SOP 2.2
Positive Hole: 401
Positive Hole Corrected Result: 9 CFU/m3
Air Volume: 1000 (L)
MRL: 1
Organism Name: Raw Count CFU/m3 % Total Reservoirs Coag-negative Staphylococcus species 4 4 44 Human Micrococcus species 5 5 56 Human
9 9 ~100%
CLIENT SAMPLE #: 132
Sample Location: 25-4 SF F
Test: 1107, USP 797 Culture, Air, Bacterial Counts with ID: SOP 2.2
Lab Sample #: 15029369-020
Positive Hole: 401
Positive Hole Corrected Result: 13 CFU/m3
Air Volume: 1000 (L)

59
MRL: 1
Organism Name: Raw Count CFU/m3 % Total Reservoirs Coag-negative Staphylococcus species 9 9 69 Human Micrococcus species 4 4 31 Human
13 13 ~100%
CLIENT SAMPLE #: 138
Sample Location: 25-5 SF F
Lab Sample #: 15029369-021
Test: 1107, USP 797 Culture, Air, Bacterial Counts with ID: SOP 2.2
Positive Hole: 401
Positive Hole Corrected Result: 10 CFU/m3
Air Volume: 1000 (L)
MRL: 1
Organism Name: Raw Count CFU/m3 % Total Reservoirs Coag-negative Staphylococcus species 5 5 50 Human Coryneform bacteria group/Corynebacterium group 2 2 20 Human/
Environment Micrococcus species 3 3 30 Human
10 10 ~100%
CLIENT SAMPLE #: 144
Sample Location: 25-6 SF F
Test: 1107, USP 797 Culture, Air, Bacterial Counts with ID: SOP 2.2
Lab Sample #: 15029369-022
Positive Hole: 401
Positive Hole Corrected Result: 13 CFU/m3
Air Volume: 1000 (L)
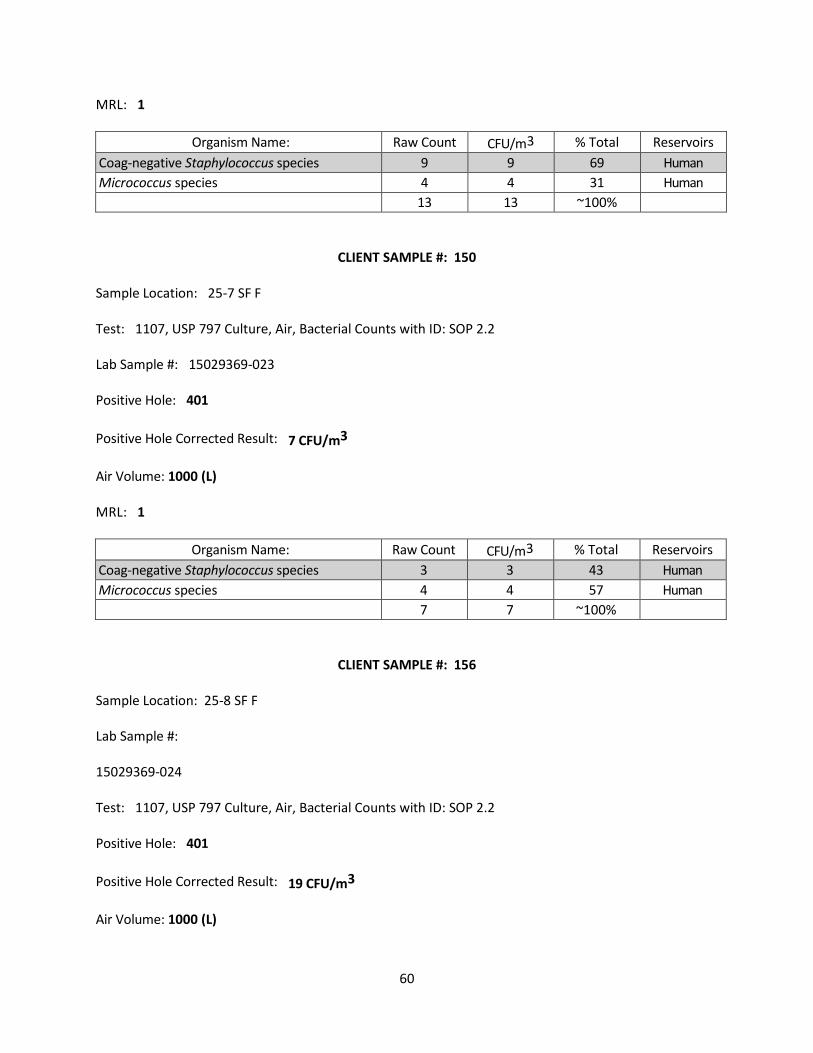
60
MRL: 1
Organism Name: Raw Count CFU/m3 % Total Reservoirs Coag-negative Staphylococcus species 9 9 69 Human Micrococcus species 4 4 31 Human 13 13 ~100%
CLIENT SAMPLE #: 150
Sample Location: 25-7 SF F
Test: 1107, USP 797 Culture, Air, Bacterial Counts with ID: SOP 2.2
Lab Sample #: 15029369-023
Positive Hole: 401
Positive Hole Corrected Result: 7 CFU/m3
Air Volume: 1000 (L)
MRL: 1
Organism Name: Raw Count CFU/m3 % Total Reservoirs Coag-negative Staphylococcus species 3 3 43 Human Micrococcus species 4 4 57 Human
7 7 ~100%
CLIENT SAMPLE #: 156
Sample Location: 25-8 SF F
Lab Sample #:
15029369-024
Test: 1107, USP 797 Culture, Air, Bacterial Counts with ID: SOP 2.2
Positive Hole: 401
Positive Hole Corrected Result: 19 CFU/m3
Air Volume: 1000 (L)

61
MRL: 1
Organism Name: Raw Count CFU/m3 % Total Reservoirs Coag-negative Staphylococcus species 11 11 61 Human Micrococcus species 7 7 39 Human
18 18 ~100%