Assessment of the effectiveness of measures under - UK-Air - Defra
106
Assessment of the effectiveness of measures under the Clean Air Act 1993 Report for Defra AEA/R/ED46626/3289 Issue 1 Date 20/07/2012
Transcript of Assessment of the effectiveness of measures under - UK-Air - Defra
Assessment of the effectiveness of measures under the Clean Air Act 1993
Report for Defra
AEA/R/ED46626/3289 Issue 1 Date 20/07/2012
Assessment of the effectiveness of measures under the Clean Air Act 1993
Ref: AEA/ED46626/3289/Issue 1 ii
Customer: Contact:
Defra Robert Stewart AEA Technology plc Gemini Building, Harwell, Didcot, OX11 0QR t: 0870 190 6575 e: [email protected] AEA is a business name of AEA Technology plc AEA is certificated to ISO9001 and ISO14001
Customer reference:
RMP 5495
Confidentiality, copyright & reproduction:
A report prepared by AEA for the Department for the Environment, Food and Rural Affairs © Crown copyright 2012 Copyright in the typographical arrangement and design rests with the Crown. This publication (excluding the Royal Arms and departmental logos) may be re-used free of charge in any format or medium for research for non-commercial purposes, private study or for internal circulation within an organisation. This is subject to it being re-used accurately and not used in a misleading context. The material must be acknowledged as Crown copyright and the title of the publication specified. For any other use of this material please apply for a Click-Use Licence for Public Sector Information (PSI) or core material at: http://www.opsi.gov.uk/click-use/system/licenceterms/CCWPS03-00.pdf or by writing to: Office of Public Sector Information Information Policy Team St Clements House 2-16 Colegate Norwich NR3 1BQ Fax: 01603 723000 Email: [email protected]
Author:
John Abbott, Christopher Conolly, Sally Cooke, Neil Passant, Robert Stewart, Anne Wagner
Approved By:
Rachel Yardley
Date:
20 July 2012
Signed:
AEA reference:
Ref: ED46626/3289- Issue 1

Assessment of the effectiveness of measures under the Clean Air Act 1993
Ref: AEA/ED46626/3289/Issue 1 ii
Executive summary Defra is considering the consequences of repealing or amending the Clean Air Act 1993 as part of the Government’s Red Tape Challenge. In particular, it is considering the impact on air quality and emission ceilings from the repeal of the Act and associated instruments.
This report considers the consequences of amending or repealing the main provisions of the Clean Air Act (CAA).
The CAA was introduced to address air pollution from smogs caused by widespread burning of coal for residential heating and by industry. The CAA covers England, Wales and Scotland and there is separate legislation for Northern Ireland. The legislation targets smoke emission from chimneys and premises and smoke emissions from residential and non-residential furnaces. Although some activities fall on Defra and the Devolved Administrations, the key CAA measures are applied and supervised by Local Authorities and include the:
• Control of dark smoke; • Prohibition of cable burning except at authorised installations; • Designation and supervision of smoke control areas – control of smoke emission and
constraints on the types of appliances and fuels which can be used in such areas; • Approval of chimney heights for non-residential furnaces; • Control of grit and dust emissions from non-residential furnaces (up to thresholds in
EPR); • Approval of new non-residential furnaces; • Approval of abatement equipment for use on non-residential furnaces.
The CAA regulates combustion and other activities (including domestic combustion) which provide significant contribution to the UK total emission for many pollutants. Consequently they are also important contributors to local air quality.
The recent revision to the Gothenburg Protocol sets new national emission reduction commitments for NOx, SO2, VOC, NH3 and PM2.5 . If there is no change to the contribution of small combustion activities to the UK emissions and the new 2020 targets are met the contribution of SO2, NOx and PM2.5 to the UK total will be about 21 %, 15 % and 20 % respectively. This indicates the importance of these activities when considering measures to address the new targets.
Details of the effects of Air Quality pollutants and the UK Air Quality Strategy can be found on the Defra website1 and the Committee on the Medical Effects of Air Pollutants (COMEAP) website2.
The provisions of the CAA have been reviewed to identify the key measures available for use and hence potential changes. Changes include revocation of measures or changes to provide more focus on air quality and hence impacts on public health. The behavioural changes have been identified and impacts quantified where possible.
Scenarios for changes in emissions in 2020 from CAA-regulated activities were developed based on removal of Smoke Control Areas. In addition, scenarios were developed to assess the potential for improved measures such as replacing the grit and dust regulations and national criteria for domestic and non-domestic combustion appliances.
Credible quantifiable scenarios relating to the dark smoke and cable burning provisions could not be developed. In the absence of CAA controls/supervision, incidents of dark smoke could be expected to increase and this would lead to an increase in loss of amenity, potentially
1 http://www.defra.gov.uk/environment/quality/air/air-quality/ 2 http://www.comeap.org.uk/

Assessment of the effectiveness of measures under the Clean Air Act 1993
Ref: AEA/ED46626/3289/Issue 1 iii
increase emissions of products of incomplete combustion, and/or potentially nuisance situations.
Changes to reduce the emission limits permitted under the Grit and Dust regulations had little effect on emissions. However, this may reflect uncertainty in the National Atmospheric Emission Inventory (NAEI)3 and activity data for the sector.
Removal of constraints in Smoke Control Areas has potential for large increases in emissions from domestic solid fuel combustion including significant impacts on national emissions of Benzo(a)pyrene, PM10 and PM2.5 . Uplift in the use of petroleum coke could also increase Ni, V and SO2 emissions.
There is potential for some benefits to national emissions of PM10, PM2.5 and Benz(a)pyrene from applying national emission controls on solid fuel appliances to match those controls which are applied in Smoke Control Areas. Such benefits mainly arise from improvements to domestic solid fuel heating appliances.
Three scenarios were developed to investigate potential impacts on air quality concentrations of PM2.5, PM10, BaP and NO2
4. These indicate little change in NO2 concentrations and no additional exceedences of NO2 Air Quality limits due to the scenarios. The high PM increase scenario, which included domestic solid fuel use in SCAs switching to wood and additional use of wood in domestic and non-domestic appliances in SCAs is predicted to lead to exceedences of current and future air quality standards for BaP, PM2.5 and PM10. A medium PM increase scenario (based on domestic solid fuel in SCAs switching to coal and additional use of wood in non-domestic appliances in SCAs) is predicted to lead to exceedences of current and future air quality standards for BaP and PM10 but only one additional zone for PM2.5. The scenario does not lead to NO2 exceedences.
There are no exceedences predicted for PM10, PM2.5 and NO2 under the changes to the CAA for the PM emission reduction scenario and there are fewer projected exceedences for BaP.
Although there is provision for control of stack height through Building Regulations, removal of chimney height provisions in the CAA could have a large impact on local air quality (NO2) even for comparatively small boilers (over 200 kW for most fuels but 100 kW for biomass). Note that these sizes are lower than the threshold where CAA currently requires chimney height approval.
In general, use of the Chimney Heights Memorandum is suitable for boiler size up to 1 MW however nomographs developed to model chimney height impacts indicate that current air quality considerations are not addressed for CAA-controlled boilers >1 MW (and CAA-controlled furnaces can be up to 20 MW).
Application of the nomographs indicates that removing the Clean Air Act requirements for approval of stack heights for small boilers (<20 MW thermal input) can potentially lead to high local air quality concentrations in excess of the air quality objectives and EU limit values.
3 http://naei.defra.gov.uk/index.php 4 Note that nitrogen dioxide (NO2) is an air quality pollutant with a concentration limit and is formed from oxides of nitrogen (NOx) emitted from small combustion plant and other activities.

Assessment of the effectiveness of measures under the Clean Air Act 1993
Ref: AEA/ED46626/3289/Issue 1 iv
Table of contents 1 Introduction ................................................................................................................ 1
2 Clean Air Act 1993 ...................................................................................................... 2 2.1 Existing Measures .............................................................................................. 2 2.2 Pollutants affected .............................................................................................. 2 2.3 Contribution of Clean Air Act activities to UK emissions ..................................... 3 2.4 Pollutants and multilateral agreements ............................................................... 5
3 CAA Measures, potential changes and impacts ...................................................... 8 3.1 Control of Dark Smoke ....................................................................................... 8 3.2 Approval of non-domestic furnaces .................................................................... 9 3.3 Non-domestic grit and dust emission limits........................................................10 3.4 Approval of grit and dust abatement equipment ................................................11 3.5 Chimney Height Approval ..................................................................................13 3.6 Smoke control areas .........................................................................................14
4 Modelling scenario development .............................................................................17 4.1 Overview ...........................................................................................................17 4.2 Changes to Grit and Dust Regulations ..............................................................17 4.3 Changes to Smoke Control Areas .....................................................................20 4.4 National smokeless appliance ‘ecodesign’ criteria .............................................20
5 Impacts on national emissions ................................................................................21 5.1 Changes to grit and dust regulations .................................................................21 5.2 Changes to Smoke Control Area provisions ......................................................21 5.3 National emission criteria for small combustion .................................................27 5.4 Scenarios and proposed Gothenburg revision ...................................................27 5.5 Regional emission change ................................................................................28
6 Damage and other costs ...........................................................................................30 6.1 Damage costs ...................................................................................................30 6.2 Other costs........................................................................................................33
7 Impacts on air quality ...............................................................................................34 7.1 Selection of scenarios for assessment ..............................................................34 7.2 Development of background concentrations and air quality exceedences .........35 7.3 High PM emission increase scenario.................................................................37 7.4 Medium PM emission increase scenario ...........................................................39 7.5 PM emission reduction scenario ........................................................................40 7.6 Summary ..........................................................................................................41
8 Removing chimney height controls .........................................................................42 8.1 Chimney height provisions ................................................................................42 8.2 Removal of provisions .......................................................................................43 8.3 Dispersion modelling .........................................................................................43 8.4 Case studies .....................................................................................................43 8.5 Summary ..........................................................................................................54
9 Mitigating Standards and Legislation ......................................................................55 9.1 Legislation .........................................................................................................55 9.2 Product Standards ............................................................................................57

Assessment of the effectiveness of measures under the Clean Air Act 1993
Ref: AEA/ED46626/3289/Issue 1 v
10 Conclusions ...............................................................................................................58
Appendices Appendix 1: Scenario output tables
Appendix 2: Devolved administration disaggregation
Appendix 3: Air quality concentration modelling outputs
Appendix 4: Chimney height assumptions and nomographs
Glossary Abbreviation Meaning AQ Air quality AQM Air quality management As Arsenic BaP Benzo(a)pyrene CAA Clean Air Act (1993) Cd Cadmium CEN European Standards Organisation CLRTAP Convention on Long Range Transboundary Air Pollution CO Carbon monoxide COMEAP Committee on the Medical Effects of Air Pollutants Cr Chromium Cu Copper DA Devolved Administration (Scotland, Wales, Northern Ireland) Defra Department for Environment Food and Rural Affairs EC European Commission EEA European Environment Agency EN European Norm/Standard EPR Environmental Permitting Regulations E-PRTR European Pollutant Release and Transfer Registry EU European Union EuP Energy using Product HCB Hexachlorobenzene HCH Hexachlorocyclohexane HCl Hydrogen chloride HF Hydrogen fluoride Hg Mercury IGCB Interdepartmental Group on Costs and Benefits LA Local Authority MEA Multilateral Environmental Agreement NAEI UK National Atmospheric Emission Inventory NFR Nomenclature For Reporting NH3 Ammonia Ni Nickel NO2 Nitrogen dioxide NOx Oxides of nitrogen

Assessment of the effectiveness of measures under the Clean Air Act 1993
Ref: AEA/ED46626/3289/Issue 1 vi
Abbreviation Meaning PAH Polycyclic Aromatic Hydrocarbons Pb Lead PCB PolyChlorinatedBiphenyls PCDD/F Polychlorinated Dibenzodioxins/furans PIC Products of Incomplete Combustion PM10 Particulate matter smaller than nominally 10µm PM2.5 Particulate matter smaller than nominally 2.5µm POPs Persistent Organic Pollutants RHI Renewable Heat Incentive Se Selenium SO2 Sulphur dioxide TSP Total Suspended Particulate UNECE United Nations Economic Commission for Europe UNFCCC United Nations Framework Convention on Climate Change V Vanadium VOC Volatile Organic Compounds
Assessment of the effectiveness of measures under the Clean Air Act 1993
Ref: AEA/ED46626/3289/Issue 1 1
1 Introduction Defra is considering the consequences of repealing or amending the Clean Air Act 19935 as part of the Government’s Red Tape Challenge6. In particular, it is considering the impact on air quality and emission ceilings from the repeal of the Clean Air Act (CAA) and associated instruments.
A number of Tasks were undertaken :
Task Description Report Section
1 Develop scenarios for CAA repeal or change. Assess the potential for behavioural change, identify the likely impacts and whether quantifiable.
Section 2, 3, 4
2 Quantify impacts on annual emissions of pollutants covered by the UK Air Quality Strategy7 and EC National Emission Ceiling Directive8, damage costs and other impacts.
Section 5, 6
3 Quantify impacts on air quality concentrations of main pollutants from CAA-regulated activities (PM10/2.5, Nitrogen dioxide and Benzo(a)pyrene ).
Section 7
4 Case studies of potential impacts of removal of chimney height approval requirement.
Section 8
5 Qualitative review of other instruments measures to mitigate impacts of removing CAA controls
Section 9
5 Available here : http://www.legislation.gov.uk/ukpga/1993/11/contents 6 Details here : http://www.redtapechallenge.cabinetoffice.gov.uk/about/ 7 See Defra Air Pollution resource here : http://www.defra.gov.uk/environment/quality/air/air-quality/approach/ 8 More information here : http://ec.europa.eu/environment/air/pollutants/ceilings.htm

Assessment of the effectiveness of measures under the Clean Air Act 1993
Ref: AEA/ED46626/3289/Issue 1 2
2 Clean Air Act 1993 2.1 Existing Measures The Clean Air Act (CAA)9 was introduced in 1956 to address air pollution from smogs caused by widespread burning of coal for residential heating and by industry. The CAA covers England, Wales and Scotland and there is separate legislation for Northern Ireland. The legislation targets smoke emission from chimneys and industrial plant and smoke emissions from residential and non-residential furnaces. The CAA was revised in 1968 and the 1956 and 1968 Acts were then consolidated (with some associated instruments) into the 1993 Act. The 1993 CAA updated the provisions to include metrication and also addressed changes in regulation arising from other legislation.
Although some activities fall on Defra and the Devolved Administrations, the key CAA measures are applied and supervised by Local Authorities and include the:
• Control (prohibition) of dark smoke; • Approval of new non-residential furnaces; • Control of grit and dust emissions from non-residential furnaces; • Approval of abatement equipment for use on non-residential furnaces; • Approval of chimney heights for non-residential furnaces; • Designation and supervision of smoke control areas – control of smoke emission and
constraints on the types of appliances and fuels which can be used in such areas; • Prohibition of cable burning except at authorised installations.
There are a number of other provisions which provide powers for information gathering, emission measurement, support mechanisms for adapting fireplaces, quality of motor fuel, quality of fuel oil, colliery spoil heaps, extending controls for grit and dust emission to other pollutants, implementing international agreements and temporary transfer of functions (where a Local Authority is deemed to have failed to perform certain functions under the CAA). Many of these provisions are little used, some provisions required additional enabling regulations which have not been developed. Some measures have been superseded by other regulatory instruments (for example regulation of emissions from larger combustion plant, quality of vehicle fuel and sulphur content of certain liquid fuels).
The measures affect domestic (residential) use of fuels and smaller scale combustion activities up to about 20 MW thermal input (other legislation applies above this threshold).
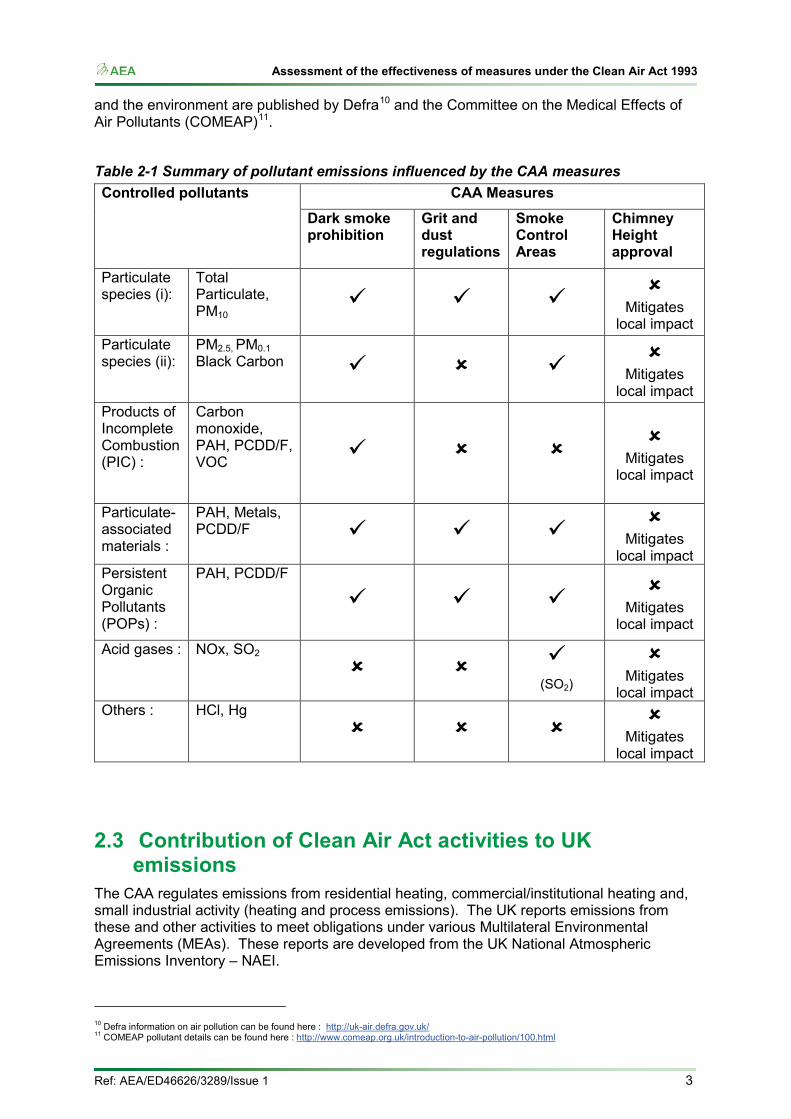
2.2 Pollutants affected The primary focus of the CAA is smoke (particulate) emission but there are provisions for control of sulphur dioxide within the CAA and associated instruments and guidance. The CAA prohibits dark smoke emission which is an indicator for poor combustion and associated emissions of Products of Incomplete Combustion (PIC). The CAA is primarily concerned with supervision of smaller combustion activities. Combustion processes emit a wide range of Air Quality and other pollutants. Table 2-1 summarises the air quality pollutants influenced by selected CAA measures. Details of the main pollutants and their impacts on human health
9 Information on CAA can be found here : http://smokecontrol.defra.gov.uk/
Assessment of the effectiveness of measures under the Clean Air Act 1993
Ref: AEA/ED46626/3289/Issue 1 3
and the environment are published by Defra10 and the Committee on the Medical Effects of Air Pollutants (COMEAP)11.
Table 2-1 Summary of pollutant emissions influenced by the CAA measures Controlled pollutants CAA Measures
Dark smoke prohibition
Grit and dust regulations
Smoke Control Areas
Chimney Height approval
Particulate species (i):
Total Particulate, PM10
Mitigates
local impact Particulate species (ii):
PM2.5, PM0.1 Black Carbon
Mitigates local impact
Products of Incomplete Combustion (PIC) :
Carbon monoxide, PAH, PCDD/F, VOC
Mitigates
local impact Particulate-associated materials :
PAH, Metals, PCDD/F
Mitigates local impact
Persistent Organic Pollutants (POPs) :
PAH, PCDD/F
Mitigates
local impact Acid gases : NOx, SO2
(SO2)
Mitigates
local impact Others : HCl, Hg
Mitigates
local impact
2.3 Contribution of Clean Air Act activities to UK emissions
The CAA regulates emissions from residential heating, commercial/institutional heating and, small industrial activity (heating and process emissions). The UK reports emissions from these and other activities to meet obligations under various Multilateral Environmental Agreements (MEAs). These reports are developed from the UK National Atmospheric Emissions Inventory – NAEI.
10 Defra information on air pollution can be found here : http://uk-air.defra.gov.uk/ 11 COMEAP pollutant details can be found here : http://www.comeap.org.uk/introduction-to-air-pollution/100.html

Assessment of the effectiveness of measures under the Clean Air Act 1993
Ref: AEA/ED46626/3289/Issue 1 4
Unfortunately the NAEI does not separate CAA and non-CAA combustion activity. Within the NAEI, the relevant activities/sources which encompass CAA activities are :
• Domestic combustion • Collieries - combustion • Miscellaneous/commercial combustion • Other industrial combustion • Public sector combustion • Agriculture – stationary combustion
Note that sector emissions include contributions from activities which are either not controlled by the CAA or only partially-controlled (for example, emissions from solid fuel domestic appliances outside smoke control areas, NOx from domestic gas combustion). In addition further NAEI sectors may include activities which are controlled by CAA but the sources listed above are the main CAA sources.
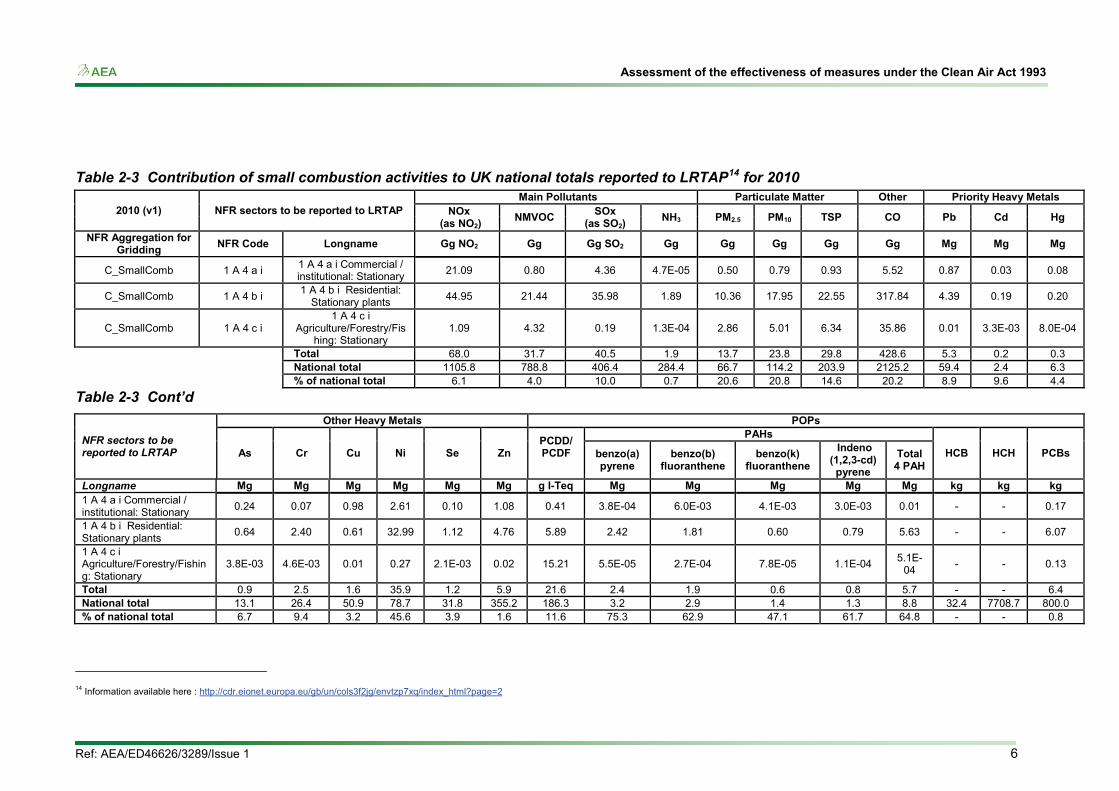
The activity classifications used for International reporting (NFR - nomenclature for reporting) also aggregate CAA and non-CAA activities. Several NFR sectors are relevant for the CAA. The summary data of UK emissions in 2010 (provided in Table 2-3) reported to the UNECE for the Convention on Long Range Transboundary Air Pollution (CLRTAP)12 gives an indication of the contribution of the NFR small combustion activities to UK emissions.
Table 2-2 – Uncertainty of emission inventories for pollutants covered by the NAEI
Note : (a) Hydrogen fluoride uncertainty assumed to be the same as for hydrogen chloride
The overall uncertainty of the national emissions reported by the NAEI is provided in the Informative Inventory Report13. Uncertainties in the NAEI are provided in Table 2-2 but note that the uncertainty of emissions from small combustion is often higher than the overall
12 Convention information here : http://www.unece.org/env/lrtap/ 13 Information available here http://uk-air.defra.gov.uk/reports/cat07/1203221052_UK_IIR_2012_final.pdf
Assessment of the effectiveness of measures under the Clean Air Act 1993
Ref: AEA/ED46626/3289/Issue 1 5
uncertainty because there is relatively high uncertainty in activity and emission factor data for the small combustion sectors.
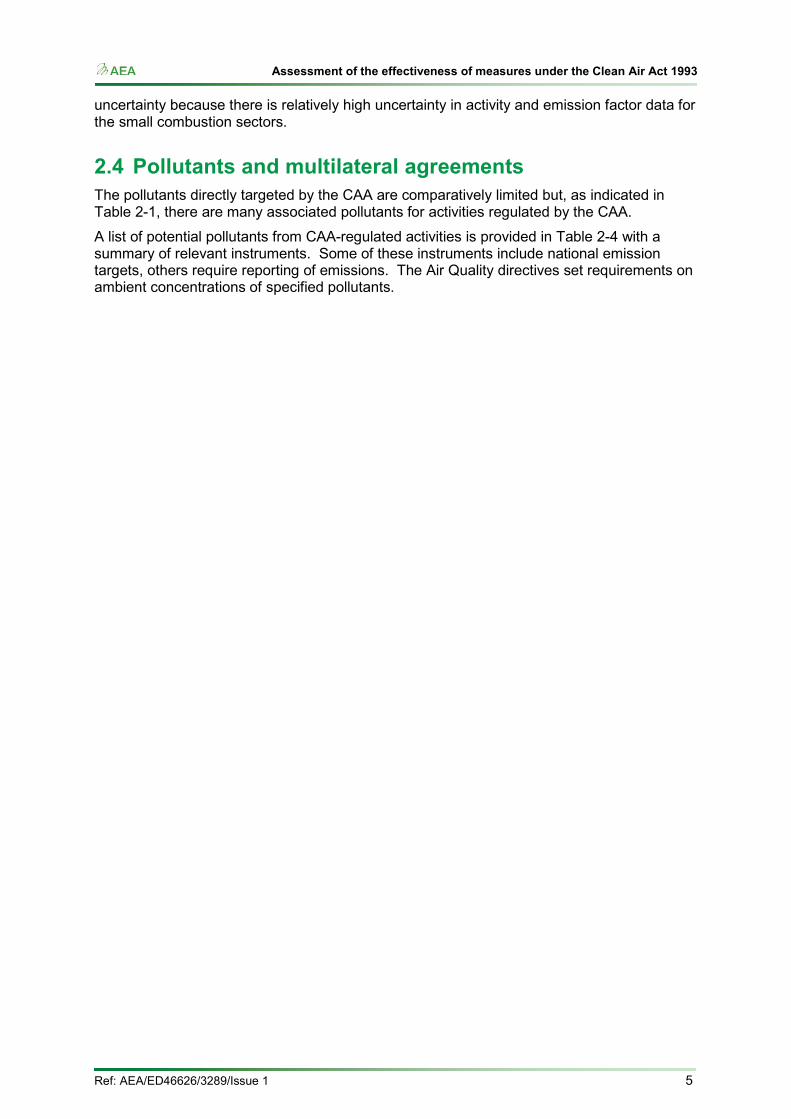
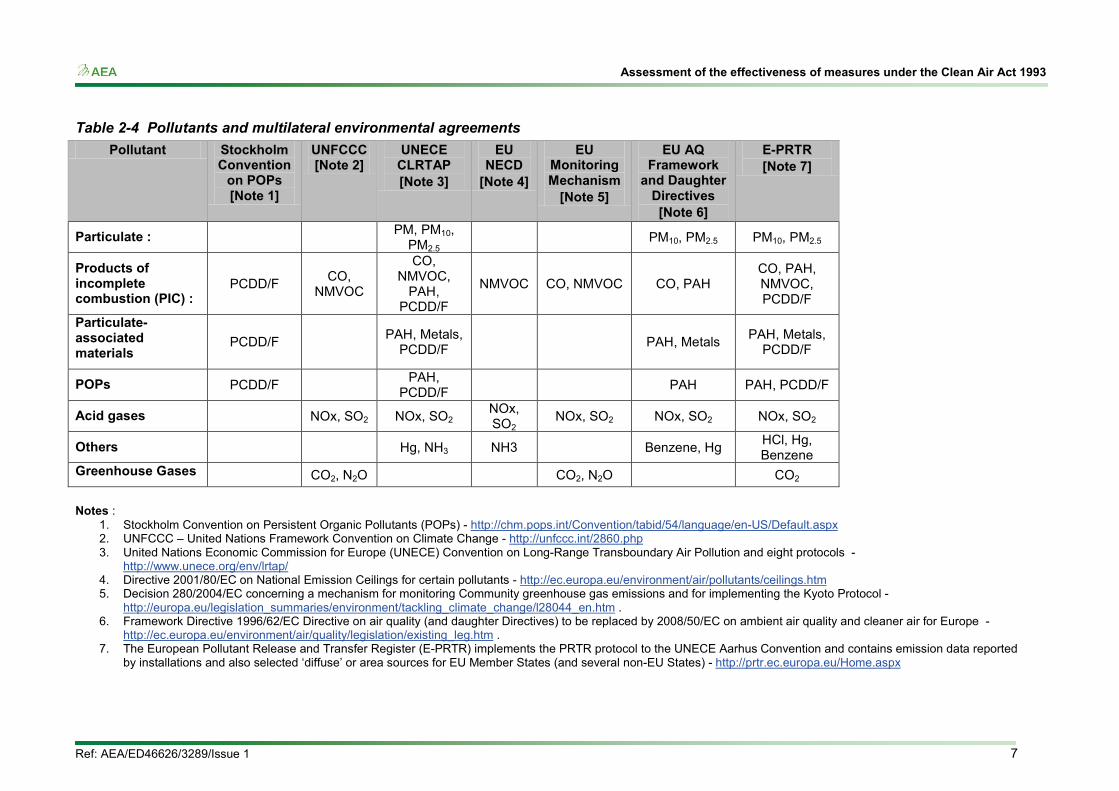
2.4 Pollutants and multilateral agreements The pollutants directly targeted by the CAA are comparatively limited but, as indicated in Table 2-1, there are many associated pollutants for activities regulated by the CAA.
A list of potential pollutants from CAA-regulated activities is provided in Table 2-4 with a summary of relevant instruments. Some of these instruments include national emission targets, others require reporting of emissions. The Air Quality directives set requirements on ambient concentrations of specified pollutants.
Assessment of the effectiveness of measures under the Clean Air Act 1993
Ref: AEA/ED46626/3289/Issue 1 6
Table 2-3 Contribution of small combustion activities to UK national totals reported to LRTAP14 for 2010
2010 (v1) NFR sectors to be reported to LRTAP Main Pollutants Particulate Matter Other Priority Heavy Metals
NOx (as NO2)
NMVOC SOx
(as SO2) NH3 PM2.5 PM10 TSP CO Pb Cd Hg
NFR Aggregation for Gridding NFR Code Longname Gg NO2 Gg Gg SO2 Gg Gg Gg Gg Gg Mg Mg Mg
C_SmallComb 1 A 4 a i 1 A 4 a i Commercial / institutional: Stationary 21.09 0.80 4.36 4.7E-05 0.50 0.79 0.93 5.52 0.87 0.03 0.08
C_SmallComb 1 A 4 b i 1 A 4 b i Residential: Stationary plants 44.95 21.44 35.98 1.89 10.36 17.95 22.55 317.84 4.39 0.19 0.20
C_SmallComb 1 A 4 c i 1 A 4 c i
Agriculture/Forestry/Fishing: Stationary
1.09 4.32 0.19 1.3E-04 2.86 5.01 6.34 35.86 0.01 3.3E-03 8.0E-04
Total 68.0 31.7 40.5 1.9 13.7 23.8 29.8 428.6 5.3 0.2 0.3 National total 1105.8 788.8 406.4 284.4 66.7 114.2 203.9 2125.2 59.4 2.4 6.3 % of national total 6.1 4.0 10.0 0.7 20.6 20.8 14.6 20.2 8.9 9.6 4.4
Table 2-3 Cont’d
NFR sectors to be reported to LRTAP
Other Heavy Metals POPs
As Cr Cu Ni Se Zn PCDD/ PCDF
PAHs
HCB HCH PCBs benzo(a) pyrene
benzo(b) fluoranthene
benzo(k) fluoranthene
Indeno (1,2,3-cd) pyrene
Total 4 PAH
Longname Mg Mg Mg Mg Mg Mg g I-Teq Mg Mg Mg Mg Mg kg kg kg 1 A 4 a i Commercial / institutional: Stationary 0.24 0.07 0.98 2.61 0.10 1.08 0.41 3.8E-04 6.0E-03 4.1E-03 3.0E-03 0.01 - - 0.17
1 A 4 b i Residential: Stationary plants 0.64 2.40 0.61 32.99 1.12 4.76 5.89 2.42 1.81 0.60 0.79 5.63 - - 6.07
1 A 4 c i Agriculture/Forestry/Fishing: Stationary
3.8E-03 4.6E-03 0.01 0.27 2.1E-03 0.02 15.21 5.5E-05 2.7E-04 7.8E-05 1.1E-04 5.1E-04 - - 0.13
Total 0.9 2.5 1.6 35.9 1.2 5.9 21.6 2.4 1.9 0.6 0.8 5.7 - - 6.4 National total 13.1 26.4 50.9 78.7 31.8 355.2 186.3 3.2 2.9 1.4 1.3 8.8 32.4 7708.7 800.0 % of national total 6.7 9.4 3.2 45.6 3.9 1.6 11.6 75.3 62.9 47.1 61.7 64.8 - - 0.8
14 Information available here : http://cdr.eionet.europa.eu/gb/un/cols3f2jg/envtzp7xq/index_html?page=2
Assessment of the effectiveness of measures under the Clean Air Act 1993
Ref: AEA/ED46626/3289/Issue 1 7
Table 2-4 Pollutants and multilateral environmental agreements Pollutant Stockholm
Convention on POPs [Note 1]
UNFCCC [Note 2]
UNECE CLRTAP [Note 3]
EU NECD
[Note 4]
EU Monitoring Mechanism
[Note 5]
EU AQ Framework
and Daughter Directives [Note 6]
E-PRTR [Note 7]
Particulate : PM, PM10, PM2.5
PM10, PM2.5 PM10, PM2.5
Products of incomplete combustion (PIC) :
PCDD/F CO, NMVOC
CO, NMVOC,
PAH, PCDD/F
NMVOC CO, NMVOC CO, PAH CO, PAH, NMVOC, PCDD/F
Particulate-associated materials
PCDD/F PAH, Metals, PCDD/F PAH, Metals PAH, Metals,
PCDD/F
POPs PCDD/F PAH, PCDD/F PAH PAH, PCDD/F
Acid gases NOx, SO2 NOx, SO2 NOx, SO2
NOx, SO2 NOx, SO2 NOx, SO2
Others Hg, NH3 NH3 Benzene, Hg HCl, Hg, Benzene
Greenhouse Gases CO2, N2O CO2, N2O CO2 Notes :
1. Stockholm Convention on Persistent Organic Pollutants (POPs) - http://chm.pops.int/Convention/tabid/54/language/en-US/Default.aspx 2. UNFCCC – United Nations Framework Convention on Climate Change - http://unfccc.int/2860.php 3. United Nations Economic Commission for Europe (UNECE) Convention on Long-Range Transboundary Air Pollution and eight protocols -
http://www.unece.org/env/lrtap/ 4. Directive 2001/80/EC on National Emission Ceilings for certain pollutants - http://ec.europa.eu/environment/air/pollutants/ceilings.htm 5. Decision 280/2004/EC concerning a mechanism for monitoring Community greenhouse gas emissions and for implementing the Kyoto Protocol -
http://europa.eu/legislation_summaries/environment/tackling_climate_change/l28044_en.htm . 6. Framework Directive 1996/62/EC Directive on air quality (and daughter Directives) to be replaced by 2008/50/EC on ambient air quality and cleaner air for Europe -
http://ec.europa.eu/environment/air/quality/legislation/existing_leg.htm . 7. The European Pollutant Release and Transfer Register (E-PRTR) implements the PRTR protocol to the UNECE Aarhus Convention and contains emission data reported
by installations and also selected ‘diffuse’ or area sources for EU Member States (and several non-EU States) - http://prtr.ec.europa.eu/Home.aspx

Assessment of the effectiveness of measures under the Clean Air Act 1993
Ref: AEA/ED46626/3289/Issue 1 8
3 CAA Measures, potential changes and impacts
3.1 Control of Dark Smoke Part I (Articles 1-3) of the CAA prohibits emission of dark smoke from building chimneys and from chimneys serving furnaces of ‘any fixed boiler or industrial plant’. There are derogations permitted within the CAA for lighting from cold, equipment failure and fuel availability. Separate associated Regulations set other specific circumstances when dark smoke emissions are permitted :
• The Dark Smoke (permitted periods) Regulations 195815 essentially permit dark smoke emission from boilers or industrial plant for short periods and during soot blowing but with a cap on the duration of a dark smoke event and also the total period of dark smoke emission in an eight hour period.
• The Dark Smoke (Permitted Periods) (Vessels) Regulations 195816, these permit dark smoke emissions from ships/vessels but with a cap on duration and the total period of dark smoke emission in one hour.
• The Clean Air (Emission of Dark Smoke) (Exemption) Regulations 196917, these provided conditional exemptions from dark smoke requirements for burning specified materials and activities including : - Timber and other waste matter from demolition/site clearance - Waste explosive - Fire research and training - Road resurfacing - Diseased Animal/poultry carcases A further exemption (burning Agricultural/veterinary packaging) was revoked in 200718. The conditions essentially require that there are no other reasonably safe and practicable methods for disposal and that disposal is under continuous supervision.
Part VI of the CAA also applies the dark smoke controls to railway locomotives and vessels but allows derogation for research on air quality. Table 3-1 provides a summary of the provision, the potential for change and, the resulting behavioural change and impacts.
The main behavioural changes which may arise from removal of the prohibition are the potential increase in open burning and relaxation of supervision of combustion activities resulting in poorer combustion efficiency.
The impacts from such activity are difficult to quantify as there are no activity data and limited emission factors to develop a reasonable emission estimate. In the absence of CAA controls/supervision, incidents of dark smoke could be expected to increase and this would lead to an increase in loss of amenity, potentially increase emissions of products of incomplete combustion, and/or potentially nuisance situations.
15 SI 1958 No. 498 available here : http://www.legislation.gov.uk/uksi/1958/498/made 16 SI 1958 No. 878 available here : http://www.legislation.gov.uk/uksi/1958/878/made 17 SI 1969 No. 1263 available here : http://www.legislation.gov.uk/uksi/1969/1263/made 18 SI 2007 No 1156 The Waste Management (Miscellaneous Provisions)(England and Wales) Regulations 2007 available here : http://www.legislation.gov.uk/uksi/2007/1156/contents/made

Assessment of the effectiveness of measures under the Clean Air Act 1993
Ref: AEA/ED46626/3289/Issue 1 9
Table 3-1 Summary of provisions relating to Dark Smoke Domestic/Non-domestic
Domestic and Non-domestic
Applicability Applies to all UK. Buildings’ chimneys, fixed industrial plant, industrial/trade premises also railway locomotive engines and vessels.
Notes Doesn’t apply to bonfires on non-trade premises. Dark smoke arises from poor supervision or maintenance of appliances and from open or uncontrolled burning. Persistent emission from a chimney or premises could be controlled (eventually) under complaints and Statutory nuisance. Disposal of waste materials on trade premises by burning may be discouraged by waste regulation.
Pollutants Particulate matter, pollutants with particulate phase, products of incomplete combustion, black carbon, POPs
Options for change
Remove
Activity, potential behaviour change (removal)
Open burning/low technology burning of materials on trade premises may increase in absence of dark smoke provision. Lower quality appliances may be installed; potential issue with smoke from less supervision of manual appliances (ie domestic roomheaters, some small commercial boilers and some airheaters). Increase in smoke emissions from automatic furnaces would be less likely (would require efficiency/quality of appliance/quality of fuel to decline) but may arise if maintenance or supervision relaxed.
Potential Impacts (removal)
Description Outcome Local National Assessable ?
Incidents of smoke, deposition and soiling nuisance.
Increase Y N Qualitative
PM emission, AQ conc., (all sizes from ultrafine to coarser material) and pollutants with particulate fraction (metals).
Increase Y Y Qualitative
Emissions and AQ conc of products of incomplete combustion (PAH, POPs, VOC, CO).
Increase Y Y Qualitative
Black carbon Increase Y Y Qualitative
3.2 Approval of non-domestic furnaces Part II of the CAA (Article 4) requires new non-domestic furnaces and boilers to be capable of smokeless operation and to be notified and plans approved by the Local Authority. In the absence of guidance for Local Authorities on smokeless operation the process for approving such furnaces at present is unclear and anecdotal evidence suggests that assessment is, at best, limited. The 1956 CAA included an Appendix which outlined some general requirements but this was not included in the 1993 CAA. The criteria for Exempted appliances could be used as guidance for smokeless operation or indeed the Exempted appliance list but this would imply that Smoke Control Area criteria should apply nationally.
Assessment of the effectiveness of measures under the Clean Air Act 1993
Ref: AEA/ED46626/3289/Issue 1 10
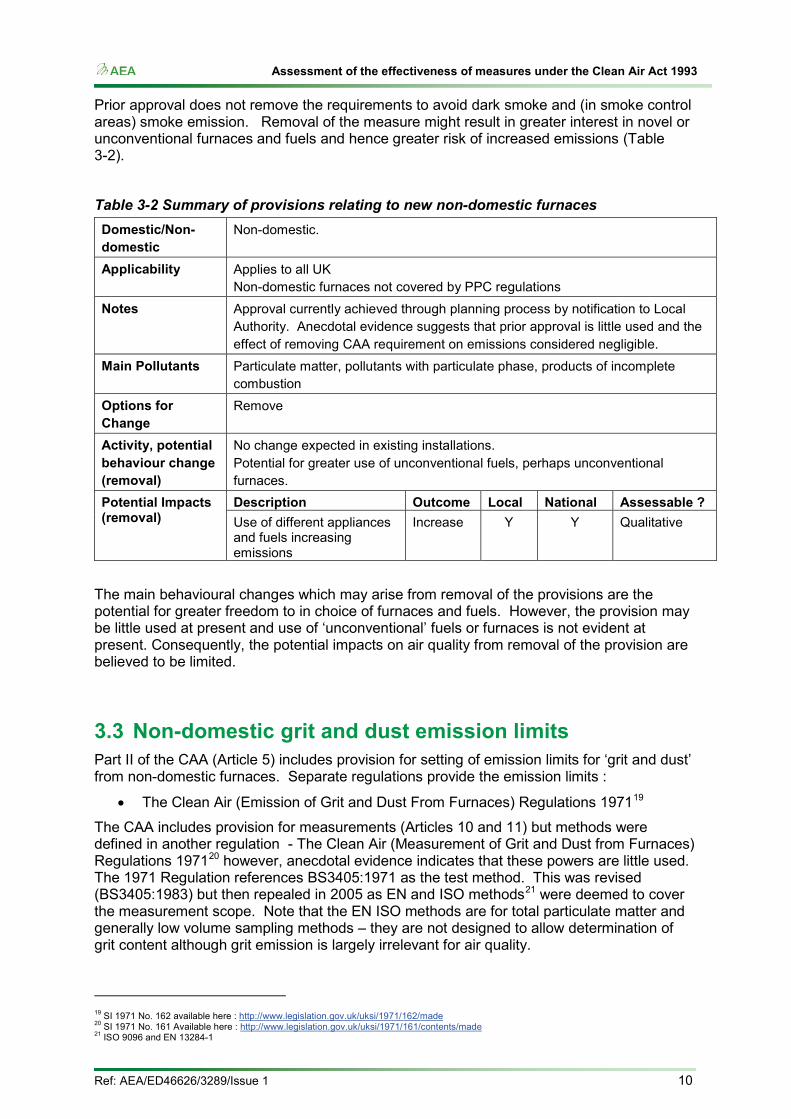
Prior approval does not remove the requirements to avoid dark smoke and (in smoke control areas) smoke emission. Removal of the measure might result in greater interest in novel or unconventional furnaces and fuels and hence greater risk of increased emissions (Table 3-2).
Table 3-2 Summary of provisions relating to new non-domestic furnaces Domestic/Non-domestic
Non-domestic.
Applicability Applies to all UK Non-domestic furnaces not covered by PPC regulations
Notes Approval currently achieved through planning process by notification to Local Authority. Anecdotal evidence suggests that prior approval is little used and the effect of removing CAA requirement on emissions considered negligible.
Main Pollutants Particulate matter, pollutants with particulate phase, products of incomplete combustion
Options for Change
Remove
Activity, potential behaviour change (removal)
No change expected in existing installations. Potential for greater use of unconventional fuels, perhaps unconventional furnaces.
Potential Impacts (removal)
Description Outcome Local National Assessable ? Use of different appliances and fuels increasing emissions
Increase Y Y Qualitative
The main behavioural changes which may arise from removal of the provisions are the potential for greater freedom to in choice of furnaces and fuels. However, the provision may be little used at present and use of ‘unconventional’ fuels or furnaces is not evident at present. Consequently, the potential impacts on air quality from removal of the provision are believed to be limited.
3.3 Non-domestic grit and dust emission limits Part II of the CAA (Article 5) includes provision for setting of emission limits for ‘grit and dust’ from non-domestic furnaces. Separate regulations provide the emission limits :
• The Clean Air (Emission of Grit and Dust From Furnaces) Regulations 197119
The CAA includes provision for measurements (Articles 10 and 11) but methods were defined in another regulation - The Clean Air (Measurement of Grit and Dust from Furnaces) Regulations 197120 however, anecdotal evidence indicates that these powers are little used. The 1971 Regulation references BS3405:1971 as the test method. This was revised (BS3405:1983) but then repealed in 2005 as EN and ISO methods21 were deemed to cover the measurement scope. Note that the EN ISO methods are for total particulate matter and generally low volume sampling methods – they are not designed to allow determination of grit content although grit emission is largely irrelevant for air quality.
19 SI 1971 No. 162 available here : http://www.legislation.gov.uk/uksi/1971/162/made 20 SI 1971 No. 161 Available here : http://www.legislation.gov.uk/uksi/1971/161/contents/made 21 ISO 9096 and EN 13284-1
Assessment of the effectiveness of measures under the Clean Air Act 1993
Ref: AEA/ED46626/3289/Issue 1 11
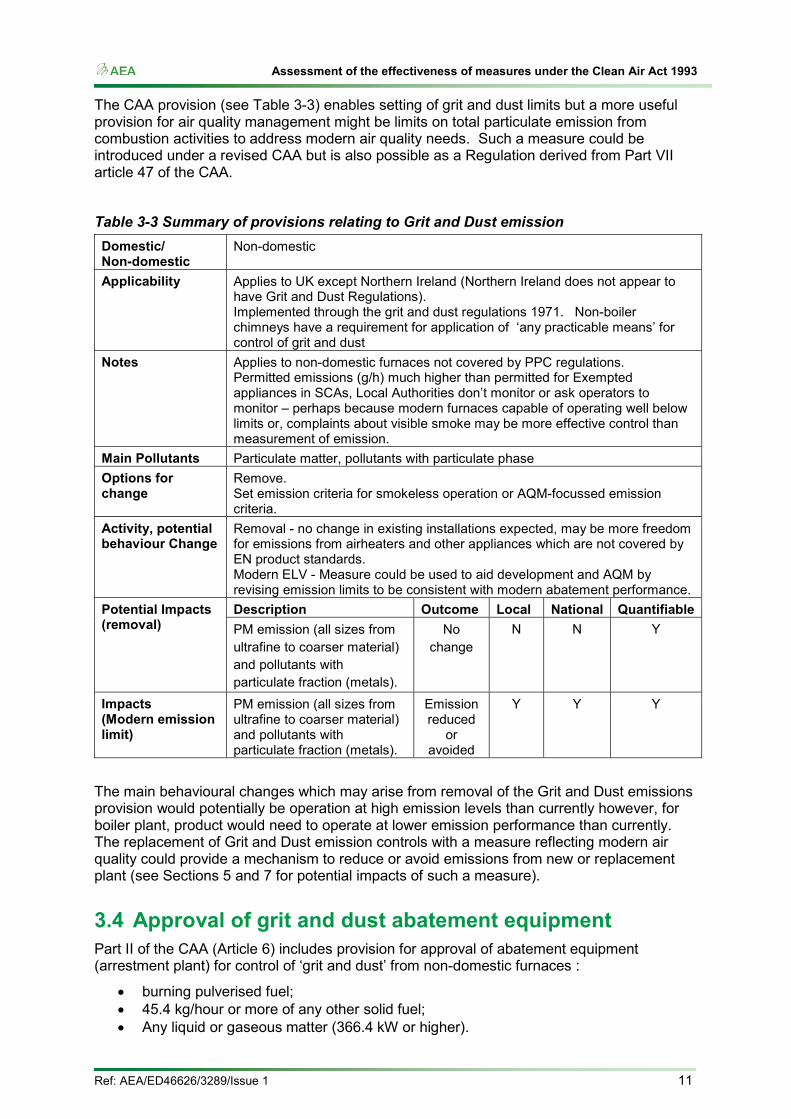
The CAA provision (see Table 3-3) enables setting of grit and dust limits but a more useful provision for air quality management might be limits on total particulate emission from combustion activities to address modern air quality needs. Such a measure could be introduced under a revised CAA but is also possible as a Regulation derived from Part VII article 47 of the CAA.
Table 3-3 Summary of provisions relating to Grit and Dust emission Domestic/ Non-domestic
Non-domestic
Applicability Applies to UK except Northern Ireland (Northern Ireland does not appear to have Grit and Dust Regulations). Implemented through the grit and dust regulations 1971. Non-boiler chimneys have a requirement for application of ‘any practicable means’ for control of grit and dust
Notes Applies to non-domestic furnaces not covered by PPC regulations. Permitted emissions (g/h) much higher than permitted for Exempted appliances in SCAs, Local Authorities don’t monitor or ask operators to monitor – perhaps because modern furnaces capable of operating well below limits or, complaints about visible smoke may be more effective control than measurement of emission.
Main Pollutants Particulate matter, pollutants with particulate phase Options for change
Remove. Set emission criteria for smokeless operation or AQM-focussed emission criteria.
Activity, potential behaviour Change
Removal - no change in existing installations expected, may be more freedom for emissions from airheaters and other appliances which are not covered by EN product standards. Modern ELV - Measure could be used to aid development and AQM by revising emission limits to be consistent with modern abatement performance.
Potential Impacts (removal)
Description Outcome Local National Quantifiable PM emission (all sizes from ultrafine to coarser material) and pollutants with particulate fraction (metals).
No change
N N Y
Impacts (Modern emission limit)
PM emission (all sizes from ultrafine to coarser material) and pollutants with particulate fraction (metals).
Emission reduced
or avoided
Y Y Y
The main behavioural changes which may arise from removal of the Grit and Dust emissions provision would potentially be operation at high emission levels than currently however, for boiler plant, product would need to operate at lower emission performance than currently. The replacement of Grit and Dust emission controls with a measure reflecting modern air quality could provide a mechanism to reduce or avoid emissions from new or replacement plant (see Sections 5 and 7 for potential impacts of such a measure).
3.4 Approval of grit and dust abatement equipment Part II of the CAA (Article 6) includes provision for approval of abatement equipment (arrestment plant) for control of ‘grit and dust’ from non-domestic furnaces :
• burning pulverised fuel; • 45.4 kg/hour or more of any other solid fuel; • Any liquid or gaseous matter (366.4 kW or higher).

Assessment of the effectiveness of measures under the Clean Air Act 1993
Ref: AEA/ED46626/3289/Issue 1 12
In the absence of guidance for Local Authorities on suitable abatement, the process for approval of plant at present is unclear and anecdotal evidence suggests that assessment is not undertaken.
Cyclones or multi-cyclones are typical abatement plant for larger particulate material but have limited effectiveness for fine particulate22. Note that there is a general Exemption for appliances designed to burn liquid fuel for use in Smoke Control Areas and gas is an Authorised fuel so the need to consider abatement plant for these fuels is inconsistent.
Table 3-4 Summary of provisions relating to arrestment plant Domestic/ Non-domestic
Non-domestic
Applicability Applies to all UK. Solid (≥45.4 kg/hr and all pulverised fuel furnaces), liquid and gaseous fuels (≥366.4 kW thermal input).
Notes Non-domestic furnaces not covered by PPC regulations. Although required in theory, anecdotal evidence indicates that this is little used.
Main Pollutants Particulate matter, pollutants with particulate phase Options for change
Remove. Set emission criteria for smokeless operation (or AQM-focussed emission criteria)
Activity, potential behaviour Change
Removal - Effect of removing CAA requirement on emissions considered negligible, modern boilers unlikely to fail to comply with grit & dust regulations but potential for relaxed abatement requirement (non-fitting of optional abatement). More freedom for emissions from airheaters and other appliances which are not covered by EN product standards. Modern ELV - Measure could be used to aid development and AQM by revising emission limits to be consistent with modern abatement performance.
Potential Impacts (removal)
Description Outcome Local National Quantifiable PM emission (all sizes from ultrafine to coarser material) and pollutants with particulate fraction (metals).
No change
N N Y
Potential Impacts (Modern emission limit)
PM emission (all sizes from ultrafine to coarser material) and pollutants with particulate fraction (metals).
Emission reduced
or avoided
Y Y Y
Exempted appliances could be used as guidance for smokeless operation or indeed the Exempted appliance list but this would imply that Smoke Control Area criteria would apply nationally. Modern air quality management is concerned with PM10 and PM2.5 rather than grit (material greater than 75µm). The need to approve arrestment plant could be replaced with emission performance criteria or if prior approval is desired the provision should be revised to focus on total particulate emission (Table 3-4) to be consistent with current measurement Standards. Such a measure could be introduced in a revised CAA but is also possible as Regulation derived from the current CAA (Part VII article 47).
The replacement of Grit and Dust emission controls with a measure reflecting modern air quality could provide a mechanism to reduce or avoid emissions from new or replacement plant (see Sections 5 and 7 for potential impacts of such a measure).
22 See http://www.usewoodfuel.co.uk/using-woodfuel/wood-fuel-equipment-and-systems/emissions-abatement-technology.aspx
Assessment of the effectiveness of measures under the Clean Air Act 1993
Ref: AEA/ED46626/3289/Issue 1 13
3.5 Chimney Height Approval Part II of the CAA (Articles 14 to 16) includes provision for approval of chimney height for non-domestic furnaces :
• burning pulverised fuel; • 45.4 kg/hour or more of any other solid fuel; • Any liquid or gaseous matter (366.4 kW or higher).
The chimney height is reviewed by the Local Authority to prevent, ’so far as practicable’, the emissions from the chimney being prejudicial to health or a nuisance having regard to :
• The purpose of the chimney; • The position and descriptions of buildings near to it; • The levels of neighbouring ground; • And any other matters requiring consideration in the circumstances.
The requirement and guidance for this provision is well-established. However, the methodologies used to demonstrate stack height for the CAA do not generally address modern AQ standards but are considered to be reasonable screening tools.
Removal of the approval requirement (Table 3-5) could result in use of minimal or inappropriate stack heights outside of air quality management areas. However, there remains a requirement under the Building Regulations (England and Wales)23 2010 to consider discharge of products of combustion.
Revision of current CAA and associated guidance on chimney heights to match modern AQ management could help developers and planners more easily identify and address air quality concerns of developments. The potential impacts on air quality of removing stack height controls are examined in Section 8.
23 Similar provisions apply in other regions of the UK, the Regulations can be found here : http://www.legislation.gov.uk/uksi/2010/2214/contents/made

Assessment of the effectiveness of measures under the Clean Air Act 1993
Ref: AEA/ED46626/3289/Issue 1 14
Table 3-5 Summary of chimney height approval provisions Domestic/ Non-domestic
Non-domestic
Applicability Applies to all UK. Solid (≥45.4 kg/hr and all pulverised fuel furnaces), liquid and gaseous fuels (≥366.4 kW thermal input).
Notes Non-domestic furnaces not covered by PPC regulations. Used to prevent “smoke, grit, dust, gases or fumes” emitted from a chimney becoming prejudicial to health or a nuisance.
Main Pollutants Relevant for all AQ pollutants plus nuisance smoke and odour but guidance primarily based on SO2 and NOx
Options for change
Remove. Provide guidance to reflect modern AQ requirements
Activity, potential behaviour change (Remove)
Planning controls and building regulations become primary driver for stack height. Not a material consideration for planning outside an AQMA at present so potential for minimal stack heights to avoid impact on visual amenity.
Activity, potential behaviour change (statutory guidance provision for modern AQM)
Clearer guidance for developers and local authorities on determining appropriate chimney height could ease planning decisions, allowing appropriate development and prevent inappropriate siting of appliances/chimneys.
Potential Impacts (removal)
Description Outcome Local National Quantifiable Potential for greater local AQ impacts due to shorter stack heights leading to higher ground level (AQ) concentrations and closer to stack
Impact on AQ
concentration
Y N Y
Potential Impacts (statutory guidance provision for modern AQM)
Retains local review process and strengthens guidance to LA and developers to avoid AQ impact.
AQ impacts minimised
Y N Y
3.6 Smoke control areas Part III (Article 18) of the CAA allows the designation of Smoke Control Areas (SCA). Article 20 prohibits emission of smoke from building chimneys and from chimneys serving furnaces of ‘any fixed boiler or industrial plant’ in an SCA. There are derogations that allow smoke arising from use of an Authorised fuel or an Exempted appliance – these are fuels and appliances which have been demonstrated to emit a lower level of smoke (compared to coal). The acquisition and sale of a non-Authorised solid fuel for use in an SCA at a non-Exempt appliance is an offence.
Removal of Smoke Control Areas would remove the requirement for operation without smoke emission. The most likely behavioural change (Table 3-6) will be that householders would reduce or stop using Authorised fuels and installation of Exempted appliances. It is likely that the impact of removing SCAs would have limited impact for emissions from automatic boilers (modern appliances have relatively low emissions compared to CAA smokeless
Assessment of the effectiveness of measures under the Clean Air Act 1993
Ref: AEA/ED46626/3289/Issue 1 15
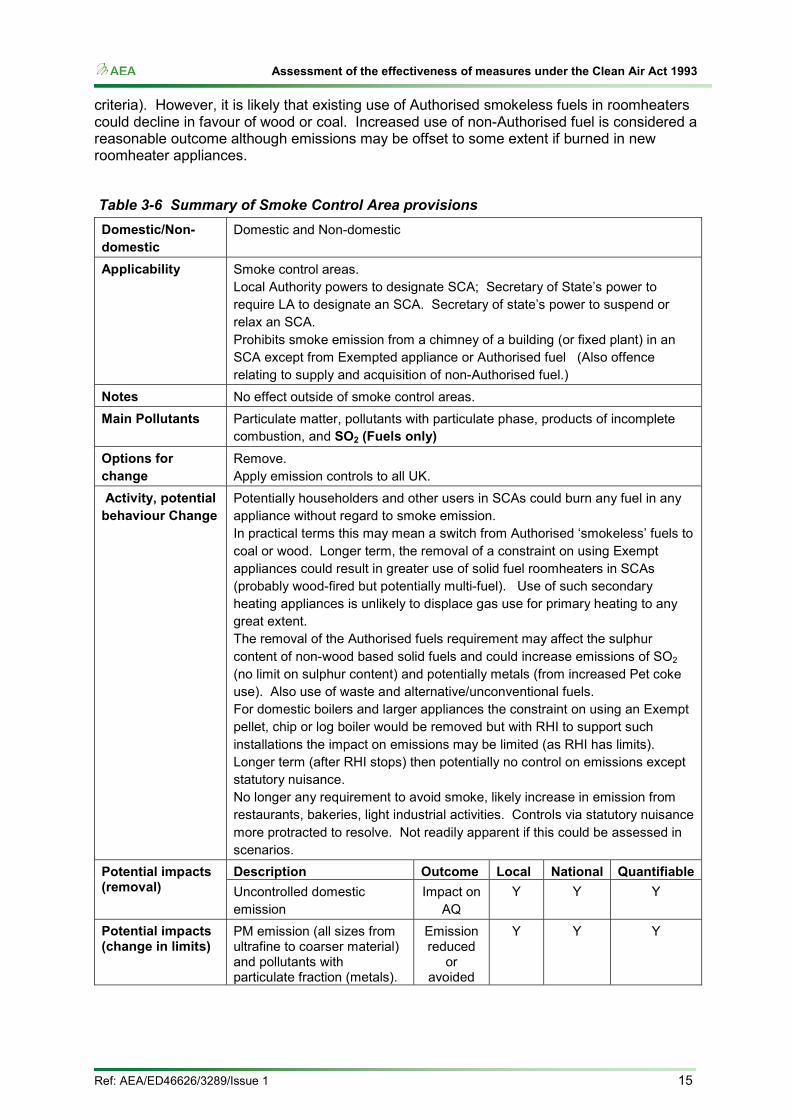
criteria). However, it is likely that existing use of Authorised smokeless fuels in roomheaters could decline in favour of wood or coal. Increased use of non-Authorised fuel is considered a reasonable outcome although emissions may be offset to some extent if burned in new roomheater appliances.
Table 3-6 Summary of Smoke Control Area provisions Domestic/Non-domestic
Domestic and Non-domestic
Applicability Smoke control areas. Local Authority powers to designate SCA; Secretary of State’s power to require LA to designate an SCA. Secretary of state’s power to suspend or relax an SCA. Prohibits smoke emission from a chimney of a building (or fixed plant) in an SCA except from Exempted appliance or Authorised fuel (Also offence relating to supply and acquisition of non-Authorised fuel.)
Notes No effect outside of smoke control areas. Main Pollutants Particulate matter, pollutants with particulate phase, products of incomplete
combustion, and SO2 (Fuels only) Options for change
Remove. Apply emission controls to all UK.
Activity, potential behaviour Change
Potentially householders and other users in SCAs could burn any fuel in any appliance without regard to smoke emission. In practical terms this may mean a switch from Authorised ‘smokeless’ fuels to coal or wood. Longer term, the removal of a constraint on using Exempt appliances could result in greater use of solid fuel roomheaters in SCAs (probably wood-fired but potentially multi-fuel). Use of such secondary heating appliances is unlikely to displace gas use for primary heating to any great extent. The removal of the Authorised fuels requirement may affect the sulphur content of non-wood based solid fuels and could increase emissions of SO2 (no limit on sulphur content) and potentially metals (from increased Pet coke use). Also use of waste and alternative/unconventional fuels. For domestic boilers and larger appliances the constraint on using an Exempt pellet, chip or log boiler would be removed but with RHI to support such installations the impact on emissions may be limited (as RHI has limits). Longer term (after RHI stops) then potentially no control on emissions except statutory nuisance. No longer any requirement to avoid smoke, likely increase in emission from restaurants, bakeries, light industrial activities. Controls via statutory nuisance more protracted to resolve. Not readily apparent if this could be assessed in scenarios.
Potential impacts (removal)
Description Outcome Local National Quantifiable Uncontrolled domestic emission
Impact on AQ
Y Y Y
Potential impacts (change in limits)
PM emission (all sizes from ultrafine to coarser material) and pollutants with particulate fraction (metals).
Emission reduced
or avoided
Y Y Y

Assessment of the effectiveness of measures under the Clean Air Act 1993
Ref: AEA/ED46626/3289/Issue 1 16
An alternative to removing SCAs would be to link them with Air Quality Management Areas (AQMAs) which are used to define and address areas with air quality issues. SCAs tend to be in urban areas where most AQMAs are found (although not all).
The removal of SCAs could increase emissions of various pollutants but replacement of requirements has the potential to reduce or avoid emissions from new or replacement plant (see Sections 5 and 7 for potential impacts of such changes).

Assessment of the effectiveness of measures under the Clean Air Act 1993
Ref: AEA/ED46626/3289/Issue 1 17
4 Modelling scenario development 4.1 Overview Scenarios have been developed based on a range of changes to the main CAA measures to assess the impacts of changes on national emissions in the period 2009 to 2020. The projected 2020 emissions are based on the 2009 NAEI database and the DECC energy projection UEP 43.
In some instances, revised pollutant emission factors have been developed based on changes to methodology adopted for the 2010 NAEI database.
A number of scenarios (Table 4-1) have been developed based on the following measures
• Changes to grit and dust regulations; • Changes to smoke control areas; • Introducing a national requirement for emissions.
In addition to removal of provisions, the scenarios also consider measures that may aid achievement of air quality standards.
4.2 Changes to Grit and Dust Regulations It is considered that removal of grit and dust controls will have limited impact on emissions from existing appliances as the measure applies to non-domestic devices which are likely to be under a reasonable degree of professional supervision. Emissions may increase but an increase to levels permitted under the Grit and Dust regulations (or higher) is considered extremely unlikely.
New appliances are likely to be biomass boiler devices due to the support measures available to users. In such circumstances, the RHI emission criteria (which will apply from October 2012) and the revisions to the hot water boiler product Standard (EN303-5 will tend toward installation of appliances which will be of low particulate emission. In the longer term, the EC Ecodesign process for solid fuel heating appliances may also provide a regulatory means to control emissions from EN303-5 solid fuel hot water boiler appliances. For boiler appliances which are not covered by EN303-5 (different function and/or outside the size range of EN303-5) there is potential for higher emissions if RHI is not continued.
For appliances not covered by RHI or EN303-5 (for example air heaters), the absence of the Grit and Dust Regulations could allow some opportunity for more polluting appliances.
The scenarios are therefore based on replacement of the Grit and Dust Regulations with an alternative measure with a range of control on emissions. For the purpose of the scenarios, the measures are presumed to be based on type approval through compliance with a Standard or, for larger appliances, verification of emission performance (similar to RHI).
Note that the likely introduction of any measures and potential lifetime of the appliances mean that the full benefit of such measures would not be achieved until at least 2030.

Assessment of the effectiveness of measures under the Clean Air Act 1993
Ref: AEA/ED46626/3289/Issue 1 18
Table 4-1 Summary of scenarios for impact analysis Measure Scenario Description Fuel Pollutant emission factors,
ktonne/Mtonne fuel Comment
PM NOx CO VOC Grit and Dust regulations (Non-Domestic)
3a Introduce limit based on CAA Exempt appliance limit
Coal 2.0 - - - From 150 mg/m3 emission criteria assumed at 10% O2 Wood 0.88 - - -
3b Introduce EN303-5 based limit, Ecodesign scenario
Coal 1.67 - 16 1.34 From EN303-5 Class 3. Class 3 will be least stringent class in revised EN303-5
Wood 0.88 - 7.02 0.58
3c Introduce RHI limit Wood 0.36 1.82 - - Biomass only 3d Introduce stringent emission
limit Coal 0.85 4.25 - - Applies RHI limit to wood and
coal Wood 0.36 1.82 - - Smoke Control Areas (Domestic)
7a Replace solid Authorised fuels with Coal
Coal - - - - No change in factors, change is fuel substitution (replacement of Coke, anthracite and Solid Smokeless Fuel)
7b Replace solid Authorised fuels with Wood
Wood - - - -
7c Replace solid Authorised fuels with Petroleum coke
Pet Coke
- - - -
7e Additional coal burn (displacing gas)
Coal 7.08 - - - Activity increase in new roomheaters, factor from EEA Emission Inventory Guidebook
7f Additional wood burn (displacing gas)
wood 1.21 - - - Activity increase in new roomheaters, factor based on recent CAA exempted appliances
(Non-domestic) 7f Additional wood burn (displacing gas)
Wood 0.36 1.82 - - Assumes compliant with RHI
Other 11a Domestic national criteria Coal 2.59 - - - For new appliances based on

Assessment of the effectiveness of measures under the Clean Air Act 1993
Ref: AEA/ED46626/3289/Issue 1 19
Measure Scenario Description Fuel Pollutant emission factors, ktonne/Mtonne fuel
Comment
PM NOx CO VOC (Domestic) Wood 1.25 - - - CAA limit for 5kW roomheater
and EN303-5 Class 3 for boilers. Assigns 85% of fuel use to boilers (based on Energy using Products Lot 15 preparatory study24).
Pet coke
2.79 - - -
SSF 2.84 - - - Anthr-acite
3.09 - - -
(Non-domestic) 11b Non-domestic national criteria (EN303-5)
Wood 0.88 - 7.02 0.58 Same as 3b
coal 1.67 - 16 1.34
Notes :
1. Emission factors for pollutants which are largely in particulate phase (for example metals, benzo(a)pyrene) are scaled according to the proposed particulate emission factor. Pollutants which may have a significant vapour phase (mercury and dioxins) have been assumed to be unchanged.
2. In the scenarios 3 and 7, in which changes are expected to improve emissions, where emission factors are higher than existing NAEI default or implied emission factors the lower NAEI factor has been adopted. This results in no change to emissions but avoids a notional increase which would be unlikely in practise.
3. Product lifetimes – non-domestic appliances 15 years (Scenario 3), domestic appliances 25 years (Scenario 7)
24 Ecodesign ‘EuP’ preparatory study Lot 15 information here www.ecosolidfuel.org , information from Task 3 report, Table 3-23.

Assessment of the effectiveness of measures under the Clean Air Act 1993
Ref: AEA/ED46626/3289/Issue 1 20
4.3 Changes to Smoke Control Areas 4.3.1 Domestic appliances The risk of increased emissions to air in SCAs is mainly from behavioural change in the domestic sector. The removal of controls could have an immediate effect on fuel use with a potential switch from Authorised fuels to other fuel types (coal, wood or petroleum coke). Longer term, there would be no constraint on the use of wood or coal in an SCA and installation of roomheaters would not need to be Exempted appliances.
Scenarios are based on fuel switching between Authorised (solid) fuels and selected non-Authorised fuels – wood, coal and petroleum coke. In addition, there is potential for increased use of solid fuels – this is assumed to be displacement of gas and using new roomheater appliances. Displacement levels are notional and based on about 50% increase in projected solid fuel use. For the purpose of the scenarios the additional fuel is assumed to be burned in new roomheaters with emission factors based on recently exempted stoves (for wood) and EEA default factor for coal appliance.
4.3.2 Non-domestic appliances It is considered that removal of Smoke Control Areas will have limited impact on emissions from existing appliances as these are larger automatic devices (see Section 4.2).
However, removal of Exempt appliance requirements would remove a potential barrier to installation and may result in greater installation of biomass in Smoke Control Areas.
An uplift in biomass use of about 50% is assumed with emissions set at a level compliant with RHI (on the presumption that biomass continues to be supported by RHI and appliances would be RHI-eligible boilers and need to meet RHI emission criteria).
4.4 National smokeless appliance ‘ecodesign’ criteria As indicated in Table 2-3, the small combustion sector is a significant contributor to many air quality pollutant emissions in the UK. A revision to the CAA may provide an opportunity to define national emission criteria for domestic and other small combustion equipment, particularly given the projected rise in small-scale biomass combustion activities for heat and cogeneration.
Such changes could be a mechanism to adopt any EC Ecodesign emission requirements for small scale solid fuel combustion that may arise.
For domestic appliances, the criteria are based on an aggregation of emission factors for Clean Air Act exempt stoves and an EN303-5 Class 3 compliant boiler.
For non-domestic appliances the criteria is based on an EN303-5 Class 3 compliant boiler.
Note that the likely introduction of any measures and potential lifetime of the appliances mean that the full benefit of such measures are not achieved until at least 2040.

Assessment of the effectiveness of measures under the Clean Air Act 1993
Ref: AEA/ED46626/3289/Issue 1 21
5 Impacts on national emissions 5.1 Changes to grit and dust regulations The results indicate that the potential change to national emissions from revision to the Grit and Dust Regulations would be limited. The changes to measures produce very little change in emissions (Table 5-1) with the largest change <2.5% relative to basecase. for all scenarios. Comparing changes with the 2009 national emissions25 are consequently minimal and have not been summarised. Appendix 1 provides further details of the emissions.
The absence of change is counterintuitive, particularly for the most stringent scenario but probably reflects that the bulk of current and projected fuel use is in the NAEI ‘Other Industrial Combustion’ activity which has comparatively low emission factors for PM10 and NOx in the NAEI. The appliance replacement rate also an impact but this is relatively limited (assuming a 15 year life results in 40% replacement of the appliances by 2020).
The benefits of changing the Grit and Dust regulations would appear to be limited but this may reflect limitations in the NAEI and available energy-consumption data for detailed sectoral analysis.
In the event of removing the Grit and Dust regulation, there would be potential for increased emission mitigated to a degree by the non-mandatory RHI emission criteria. Growth in non-biomass solid fuel use is not anticipated under current energy forecasts. A replacement measure based on an emission limit concentration that would be achievable and consistent with product standards may provide a mechanism to safeguard AQ by avoiding potential for emission increase arising from growth of (non-incentivised) biomass or other unforeseen changes in the UK energy mix.
5.2 Changes to Smoke Control Area provisions 5.2.1 Replacement of Authorised solid fuels with alternative fuels The results indicate that the potential impact on emissions from revision to the provisions for Smoke Control Areas could be large. The changes to measures potentially produce some substantial changes in particulate and particulate-associated emissions for the domestic sector all scenarios (see Table 5-2) however, for national emissions (for 2009) the largest changes are for PM10, PM2.5 and Benzo(a)pyrene (Table 5-3). However national Ni, V and Sulphur dioxide emissions are also increased significantly by increased use of petroleum coke. Appendix 1 provides further details of the emissions.
5.2.2 Growth in use of non-authorised fuels As with the replacement scenarios, the growth in non-Authorised fuels increase emissions from the affected sectors. Some of these emissions are very much larger than in the basecase; comparison with the 2009 national emissions indicates that the most significant national impacts are in PM10, PM2.5, Benzo(a)pyrene and (for coal) SO2.
25 Note that the national emissions are those reported at the 2009 NAEI database as national projections for most pollutants are not available for 2020.

Assessment of the effectiveness of measures under the Clean Air Act 1993
Ref: AEA/ED46626/3289/Issue 1 22
Table 5-1 Impacts from change of Grit and Dust Regulation Pollutant Units 2020
Basecase Projected 2020 emissions, % change from basecase 3a CAA limit
3b EN303-5 (Ecodesign)
3c RHI 3d RHI+
Carbon dioxide as carbon ktonnes 25312 0.00 0.00 0.00 0.00 Carbon monoxide ktonnes 354 0.00 -0.58 0.00 0.00 Oxides of Nitrogen ktonnes 104 0.00 0.00 -0.01 -0.02 Sulphur Dioxide ktonnes 60.7 0.00 0.00 0.00 0.00 Volatile Organic Compounds ktonnes 20.7 0.00 0.00 0.00 0.00 Chromium ktonnes 2.5E-03 -0.02 -0.03 -0.03 -0.09 Arsenic ktonnes 1.2E-03 -0.29 -0.46 -0.06 -1.00 Cadmium ktonnes 2.8E-04 -0.03 -0.05 -0.05 -0.16 Copper ktonnes 2.0E-03 -0.76 -1.21 -0.09 -2.42 Hydrogen Chloride ktonnes 4.44 0.00 0.00 0.00 0.00 Mercury ktonnes 7.5E-04 0.00 0.00 0.00 0.00 Nickel ktonnes 3.9E-02 -0.01 -0.01 0.00 -0.03 Lead ktonnes 6.3E-03 -0.21 -0.33 -0.03 -0.70 Selenium ktonnes 1.0E-03 -0.13 -0.21 -0.01 -0.41 Vanadium ktonnes 9.8E-02 0.00 0.00 0.00 -0.01 Zinc ktonnes 8.8E-03 -0.18 -0.28 -0.17 -0.75 Ammonia ktonnes 1.76 0.00 0.00 0.00 0.00 Benzene ktonnes 0.97 0.00 0.00 0.00 0.00 PM10 ktonnes 19.0 -0.04 -0.06 -0.01 -0.14 Benzo[a]pyrene kg 2263 0.00 0.00 0.00 0.00
Dioxins grammes ITEQ 15.5 0.00 0.00 0.00 0.00
Manganese ktonnes 7.6E-03 -0.05 -0.08 -0.73 -0.89 Beryllium ktonnes 1.1E-03 -0.17 -0.27 0.00 -0.52 Tin ktonnes 2.1E-03 -0.02 -0.03 -0.04 -0.10 PM2.5 ktonnes 11.28 -0.02 -0.04 -0.02 -0.10

Assessment of the effectiveness of measures under the Clean Air Act 1993
Ref: AEA/ED46626/3289/Issue 1 23
Table 5-2 Impacts from changes to Smoke Control Areas – Domestic Fuel (1) Pollutant Units 2020
Basecase Projected 2020 emissions, % change from basecase 7a Coal for Auth. fuel
7b Pet. Coke for Auth. fuel
7c Wood for Auth. fuel
Carbon dioxide as C ktonnes 25312 -0.08 -0.02 -1.52 Carbon monoxide ktonnes 354 1.73 -2.06 0.61 Oxides of Nitrogen ktonnes 104 -0.31 0.22 -0.73 Sulphur Dioxide ktonnes 60.7 7.71 93.89 -12.39 Volatile Organic Compounds ktonnes 20.7 27.68 2.41 31.59 Chromium ktonnes 2.5E-03 1.69 39.06 24.33 Arsenic ktonnes 1.2E-03 1.82 15.43 -15.78 Cadmium ktonnes 2.8E-04 0.51 43.13 28.48 Copper ktonnes 2.0E-03 0.51 20.63 0.77 Hydrogen Chloride ktonnes 4.44 17.43 -10.74 -10.74 Mercury ktonnes 7.5E-04 0.69 14.77 -2.44 Nickel ktonnes 3.9E-02 0.06 304.35 2.39 Lead ktonnes 6.3E-03 2.14 -16.29 -5.06 Selenium ktonnes 1.0E-03 1.97 56.56 -9.77 Vanadium ktonnes 9.8E-02 0.01 316.25 -0.02 Zinc ktonnes 8.8E-03 1.34 14.04 2.87 Ammonia ktonnes 1.76 18.53 -11.41 54.29 Benzene ktonnes 0.97 25.92 -7.87 22.40 PM10 ktonnes 19.0 25.83 1.53 42.87 Benzo[a]pyrene kg 2263 32.07 -3.78 62.71
Dioxins grammes ITEQ 15.5 2.37 -0.63 10.44
Manganese ktonnes 7.6E-03 -1.13 47.92 6.03 Beryllium ktonnes 1.1E-03 40.58 -18.92 -24.29 Tin ktonnes 2.1E-03 2.18 294.47 6.15 PM2.5 ktonnes 11.28 17.68 2.14 55.57

Assessment of the effectiveness of measures under the Clean Air Act 1993
Ref: AEA/ED46626/3289/Issue 1 24
Table 5-3 Changes in National Emission – Domestic Fuel (1) Pollutant Units 2009 Projected 2020 emissions, % change from
national total (2009) 7a Coal for Auth. fuel
7b Pet. Coke for Auth. fuel
7c Wood for Auth. fuel
Carbon dioxide as C ktonnes 154360 0.0 0.0 -0.2 Carbon monoxide ktonnes 2277 0.3 -0.3 0.1 Oxides of Nitrogen ktonnes 1086 0.0 0.0 -0.1 Sulphur Dioxide ktonnes 397 1.2 14.3 -1.9 Volatile Organic Compounds ktonnes 826 0.7 0.1 0.8 Chromium ktonnes 26.1 0.2 3.8 2.4 Arsenic ktonnes 13.2 0.2 1.4 -1.5 Cadmium ktonnes 2.3 0.1 5.2 3.4 Copper ktonnes 52.3 0.0 0.8 0.0 Hydrogen Chloride ktonnes 11211 6.9 -4.3 -4.3 Mercury ktonnes 7.3 0.1 1.5 -0.2 Nickel ktonnes 83.1 0.0 141.0 1.1 Lead ktonnes 60.4 0.2 -1.7 -0.5 Selenium ktonnes 30.9 0.1 1.8 -0.3 Vanadium ktonnes 477.0 0.0 64.9 0.0 Zinc ktonnes 339.1 0.0 0.4 0.1 Ammonia ktonnes 288 0.1 -0.1 0.3 Benzene ktonnes 17551 0.0 0.0 0.0 PM10 ktonnes 119 4.1 0.2 6.9 Benzo[a]pyrene kg 3167 22.9 -2.7 44.8
Dioxins grammes ITEQ 193 0.2 -0.1 0.8
Manganese ktonnes 33.2 -0.3 11.0 1.4 Beryllium ktonnes 5.4 8.1 -3.8 -4.9 Tin ktonnes 32.5 0.1 19.1 0.4 PM2.5 ktonnes 70.5 2.8 0.3 8.9

Assessment of the effectiveness of measures under the Clean Air Act 1993
Ref: AEA/ED46626/3289/Issue 1 25
Table 5-4 Impacts from changes to Smoke Control Areas – Domestic Fuel (2) Pollutant Units 2020
Basecase Projected 2020 emissions, % change from basecase 7e Increase coal
7f Increase wood
Carbon dioxide as C ktonnes 25312 0.22 -0.73 Carbon monoxide ktonnes 354 9.79 18.55 Oxides of Nitrogen ktonnes 104 0.35 0.51 Sulphur Dioxide ktonnes 60.7 8.31 0.19 Volatile Organic Compounds ktonnes 20.7 14.67 17.10 Chromium ktonnes 2.5E-03 7.76 19.37 Arsenic ktonnes 1.2E-03 8.37 6.26 Cadmium ktonnes 2.8E-04 2.36 17.99 Copper ktonnes 2.0E-03 2.34 9.53 Hydrogen Chloride ktonnes 4.44 11.53 0.00 Mercury ktonnes 7.5E-04 3.19 3.23 Nickel ktonnes 3.9E-02 0.26 1.46 Lead ktonnes 6.3E-03 9.85 9.05 Selenium ktonnes 1.0E-03 9.07 5.05 Vanadium ktonnes 9.8E-02 0.02 0.02 Zinc ktonnes 8.8E-03 6.17 20.29 Ammonia ktonnes 1.76 12.25 26.89 Benzene ktonnes 0.97 13.69 12.79 PM10 ktonnes 19.0 8.11 1.97 Benzo[a]pyrene kg 2263 14.92 27.45
Dioxins grammes ITEQ 15.5 4.11 46.47
Manganese ktonnes 7.6E-03 1.09 33.75 Beryllium ktonnes 1.1E-03 26.83 0.58 Tin ktonnes 2.1E-03 1.44 6.15 PM2.5 ktonnes 11.28 8.24 25.01

Assessment of the effectiveness of measures under the Clean Air Act 1993
Ref: AEA/ED46626/3289/Issue 1 26
Table 5-5 Changes in National Emission – Domestic Fuel (2) Pollutant Units 2009 Projected 2020 emissions, %
change from national total (2009) 7e Increase coal
7f Increase wood
Carbon dioxide as C ktonnes 154360 0.04 -0.12 Carbon monoxide ktonnes 2277 1.52 2.88 Oxides of Nitrogen ktonnes 1086 0.03 0.05 Sulphur Dioxide ktonnes 397 1.27 0.03 Volatile Organic Compounds ktonnes 826 0.37 0.43 Chromium ktonnes 26.1 0.75 1.88 Arsenic ktonnes 13.2 0.78 0.58 Cadmium ktonnes 2.3 0.28 2.16 Copper ktonnes 52.3 0.09 0.36 Hydrogen Chloride ktonnes 11211 4.57 0.00 Mercury ktonnes 7.3 0.33 0.33 Nickel ktonnes 83.1 0.12 0.68 Lead ktonnes 60.4 1.03 0.94 Selenium ktonnes 30.9 0.30 0.16 Vanadium ktonnes 477.0 0.01 0.00 Zinc ktonnes 339.1 0.16 0.53 Ammonia ktonnes 288 0.07 0.16 Benzene ktonnes 17551 0.00 0.00 PM10 ktonnes 119 1.30 0.31 Benzo[a]pyrene kg 3167 10.66 19.62
Dioxins grammes ITEQ 193 0.33 3.73
Manganese ktonnes 33.2 0.25 7.73 Beryllium ktonnes 5.4 5.37 0.12 Tin ktonnes 32.5 0.09 0.40 PM2.5 ktonnes 70.5 1.32 4.00

Assessment of the effectiveness of measures under the Clean Air Act 1993
Ref: AEA/ED46626/3289/Issue 1 27
5.3 National emission criteria for small combustion Table 5-6 indicates that significant national reductions in PM10, PM2.5 and Benzo(a)pyrene could be achieved by adopting an existing Ecodesign proposal based on the Exempt appliance and EN303-5 class 3 emission criteria within all regions of the UK.
Table 5-6 Changes in emission for national emission limits –domestic and non-domestic activities Pollutant Units 2020
Basecase 11 Projected 2020 emissions, % change from basecase
11 Projected 2020 emissions, % change from national total (2009)
Carbon dioxide as C ktonnes 25312 0.00 0.00 Carbon monoxide ktonnes 354 0.00 0.00 Oxides of Nitrogen ktonnes 104 0.00 0.00 Sulphur Dioxide ktonnes 60.7 0.00 0.00 Volatile Organic Compounds ktonnes 20.7 0.00 0.00 Chromium ktonnes 2.5E-03 -11.05 -1.07 Arsenic ktonnes 1.2E-03 -3.72 -0.34 Cadmium ktonnes 2.8E-04 -7.48 -0.90 Copper ktonnes 2.0E-03 -2.05 -0.08 Hydrogen Chloride ktonnes 4.44 0.00 0.00 Mercury ktonnes 7.5E-04 0.00 0.00 Nickel ktonnes 3.9E-02 -0.68 -0.31 Lead ktonnes 6.3E-03 -7.01 -0.73 Selenium ktonnes 1.0E-03 -5.46 -0.18 Vanadium ktonnes 9.8E-02 -0.02 0.00 Zinc ktonnes 8.8E-03 -5.57 -0.14 Ammonia ktonnes 1.76 0.00 0.00 Benzene ktonnes 0.97 0.00 0.00 PM10 ktonnes 19.0 -14.37 -2.30 Benzo[a]pyrene kg 2263 -18.73 -13.38
Dioxins grammes ITEQ 15.5 0.00 0.00
Manganese ktonnes 7.6E-03 -2.33 -0.53 Beryllium ktonnes 1.1E-03 -10.25 -2.05 Tin ktonnes 2.1E-03 -2.01 -0.13 PM2.5 ktonnes 11.28 -14.46 -2.31
5.4 Scenarios and proposed Gothenburg revision The revision to the Gothenburg Protocol to the CLRTAP introduces new emission reduction commitments for UK and other countries for 2020 and beyond and includes an additional pollutant - PM2.5.
Table 5-7 compares the main scenario outputs relative to the reduction commitments. The scenarios do not include any new measures that UK Government or the EC may introduce to meet the revised protocol. However, the proportion of the national emissions which could be taken up by NOx, SO2 and PM2.5 emissions from small combustion in 2020 are significant.
Assessment of the effectiveness of measures under the Clean Air Act 1993
Ref: AEA/ED46626/3289/Issue 1 28
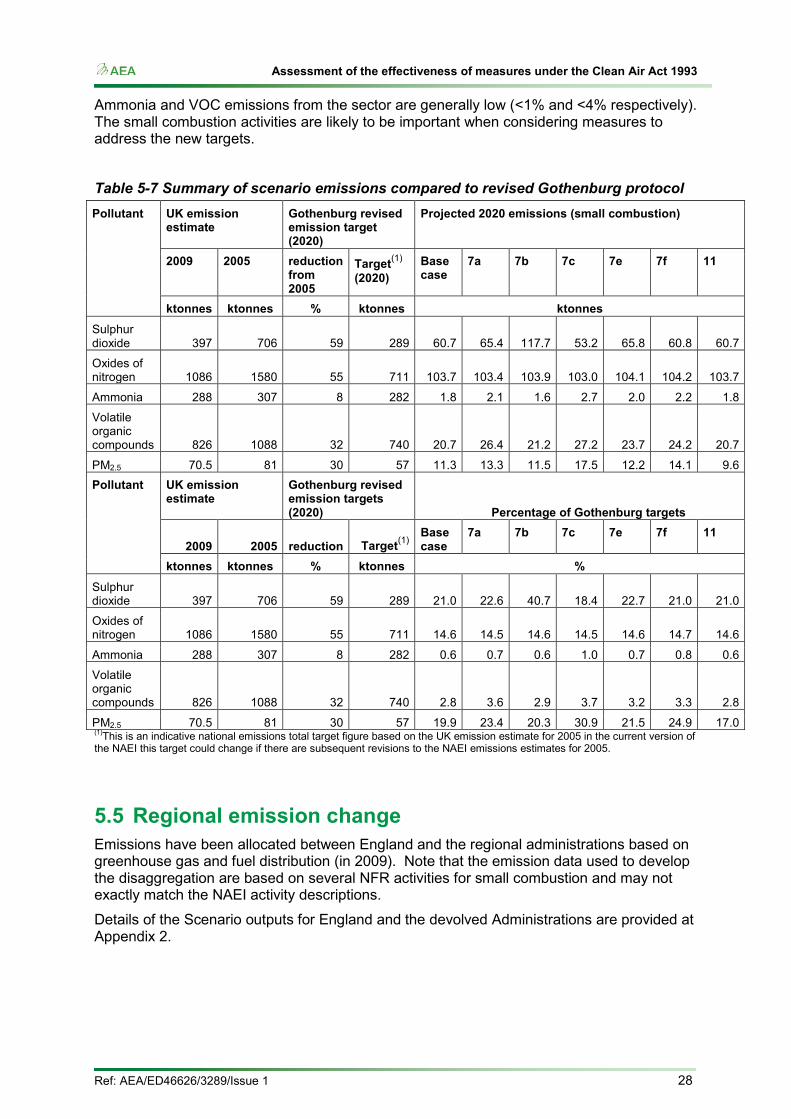
Ammonia and VOC emissions from the sector are generally low (<1% and <4% respectively). The small combustion activities are likely to be important when considering measures to address the new targets.
Table 5-7 Summary of scenario emissions compared to revised Gothenburg protocol Pollutant UK emission
estimate
Gothenburg revised emission target (2020)
Projected 2020 emissions (small combustion)
2009 2005 reduction from 2005
Target(1) (2020)
Base case
7a 7b 7c 7e 7f 11
ktonnes ktonnes % ktonnes ktonnes Sulphur dioxide 397 706 59 289 60.7 65.4 117.7 53.2 65.8 60.8 60.7
Oxides of nitrogen 1086 1580 55 711 103.7 103.4 103.9 103.0 104.1 104.2 103.7
Ammonia 288 307 8 282 1.8 2.1 1.6 2.7 2.0 2.2 1.8
Volatile organic compounds 826 1088 32 740 20.7 26.4 21.2 27.2 23.7 24.2 20.7
PM2.5 70.5 81 30 57 11.3 13.3 11.5 17.5 12.2 14.1 9.6 Pollutant UK emission
estimate
Gothenburg revised emission targets (2020) Percentage of Gothenburg targets
2009 2005 reduction Target(1) Base case
7a 7b 7c 7e 7f 11
ktonnes ktonnes % ktonnes % Sulphur dioxide 397 706 59 289 21.0 22.6 40.7 18.4 22.7 21.0 21.0
Oxides of nitrogen 1086 1580 55 711 14.6 14.5 14.6 14.5 14.6 14.7 14.6
Ammonia 288 307 8 282 0.6 0.7 0.6 1.0 0.7 0.8 0.6
Volatile organic compounds 826 1088 32 740 2.8 3.6 2.9 3.7 3.2 3.3 2.8
PM2.5 70.5 81 30 57 19.9 23.4 20.3 30.9 21.5 24.9 17.0 (1)This is an indicative national emissions total target figure based on the UK emission estimate for 2005 in the current version of the NAEI this target could change if there are subsequent revisions to the NAEI emissions estimates for 2005.
5.5 Regional emission change Emissions have been allocated between England and the regional administrations based on greenhouse gas and fuel distribution (in 2009). Note that the emission data used to develop the disaggregation are based on several NFR activities for small combustion and may not exactly match the NAEI activity descriptions.
Details of the Scenario outputs for England and the devolved Administrations are provided at Appendix 2.

Assessment of the effectiveness of measures under the Clean Air Act 1993
Ref: AEA/ED46626/3289/Issue 1 29
Table 5-8 Disaggregation of emissions for the basecase for England and the Devolved Administrations Pollutant Units 2020
Basecase England Scotland Wales Northern
Ireland
Carbon dioxide as C ktonnes 25312 20499 2330 1469 1014 Carbon monoxide ktonnes 354 242 51 35 26 Oxides of Nitrogen ktonnes 104 84 10 6.0 4.2 Sulphur Dioxide ktonnes 60.7 44 6.7 3.9 5.6 Volatile Organic Compounds ktonnes 20.7 13 3.2 2.6 1.4 Chromium ktonnes 2.5E-03 1.7E-03 3.5E-04 2.7E-04 1.7E-04 Arsenic ktonnes 1.2E-03 8.4E-04 1.7E-04 1.3E-04 8.1E-05 Cadmium ktonnes 2.8E-04 1.9E-04 3.8E-05 3.0E-05 1.8E-05 Copper ktonnes 2.0E-03 1.3E-03 2.7E-04 2.1E-04 1.3E-04 Hydrogen Chloride ktonnes 4.44 3.3 4.9E-01 2.9E-01 4.1E-01 Mercury ktonnes 7.5E-04 5.2E-04 1.0E-04 8.1E-05 5.0E-05 Nickel ktonnes 3.9E-02 2.7E-02 5.3E-03 4.1E-03 2.5E-03 Lead ktonnes 6.3E-03 4.3E-03 8.7E-04 6.8E-04 4.2E-04 Selenium ktonnes 1.0E-03 6.9E-04 1.4E-04 1.1E-04 6.7E-05 Vanadium ktonnes 9.8E-02 6.7E-02 1.3E-02 1.1E-02 6.5E-03 Zinc ktonnes 8.8E-03 6.1E-03 1.2E-03 9.4E-04 5.8E-04 Ammonia ktonnes 1.76 1.3 1.9E-01 1.1E-01 1.6E-01 Benzene ktonnes 0.97 0.6 1.5E-01 1.2E-01 6.7E-02 PM10 ktonnes 19.0 13 2.6 2.0 1.3 Benzo[a]pyrene kg 2263 1559 311 243 150
Dioxins grammes ITEQ 15.5 11 2.1 1.7 1.0
Manganese ktonnes 7.6E-03 5.2E-03 1.0E-03 8.2E-04 5.0E-04 Beryllium ktonnes 1.1E-03 7.4E-04 1.5E-04 1.1E-04 7.1E-05 Tin ktonnes 2.1E-03 1.5E-03 2.9E-04 2.3E-04 1.4E-04 PM2.5 ktonnes 11.28 7.8 1.6 1.2 7.5E-01

Assessment of the effectiveness of measures under the Clean Air Act 1993
Ref: AEA/ED46626/3289/Issue 1 30
6 Damage and other costs 6.1 Damage costs 6.1.1 Estimation methodology Damage costs have been calculated for 2020 (on a 2007 price basis) for the change in emission form the baseline and damage costs published by Defra (the Interdepartmental Group on Costs and Benefits - IGCB)26 and the European Environment Agency (EEA)27. These damage costs estimate the marginal external costs caused by each additional tonne of pollutant emitted - or conversely the benefits of reducing a pollutant emitted by one tonne. Damage costs used for each pollutant are provided in Table 6-1 and are UK specific except for mercury and lead which represent an EU damage cost.
Table 6-1 Damage costs Pollutant 2020 Damage cost
(2007 prices) Units Source Comment
NOx 1,131 £/tonne Defra (IGCB)
SO2 1,933 £/tonne Defra (IGCB) Value for SOx
PM 33,303 £/tonne Defra (IGCB) Value applied is for domestic PM
As 323 £/kg EEA
Cd 34 £/kg EEA
Pb 697 £/kg EEA EU average
Hg 1,031 £/kg EEA EU average
Ni 4 £/kg EEA
Benzene 0.09 £/kg EEA
BaP 1,450 £/kg EEA
Dioxins 30,617,000 £/kg EEA
The IGCB damage costs for NOx, SO2 and PM are based on values for a range of health impacts, including mortality and morbidity effects, and selected non-health impacts, such as damage to buildings and effects on crop yields, and also take account of both primary and secondary air pollution changes. The IGCB damage costs for NOx and SO2 are lower than the EEA range of damage costs which may reflect different assumptions and range of application. However the IGCB damage cost for PM10 is within the range of EEA damage costs.
The EEA damage costs for metals, benzene, BaP and dioxins are based on health impacts only. The lead and mercury damage costs are derived from global damage costs and are an EU damage cost (other costs are UK costs).
26 Interdepartmental Group on Costs and Benefits (IGCB) information here http://archive.defra.gov.uk/environment/quality/air/airquality/panels/igcb/guidance/damagecosts.htm 27 European Environment Agency Technical Report 15/2011 Revealing the costs of air pollution from industrial facilities in Europe available here : http://www.eea.europa.eu/publications/cost-of-air-pollution

Assessment of the effectiveness of measures under the Clean Air Act 1993
Ref: AEA/ED46626/3289/Issue 1 31
6.1.2 Summary of damage costs Damage costs or costs avoided have been calculated from the difference in emissions between scenarios and the baseline – where emissions increase under a scenario a cost is indicated and where emissions decrease, a negative cost represents a benefit or an avoided damage cost (see Table 6-2).
Although there are damage costs associated with metals these are low in comparison with damage costs associated with NOx, SO2, PM10 and dioxins.
The pollutants with the largest additional damage costs under the scenarios and greatest potential for avoided costs are SO2 and PM10.
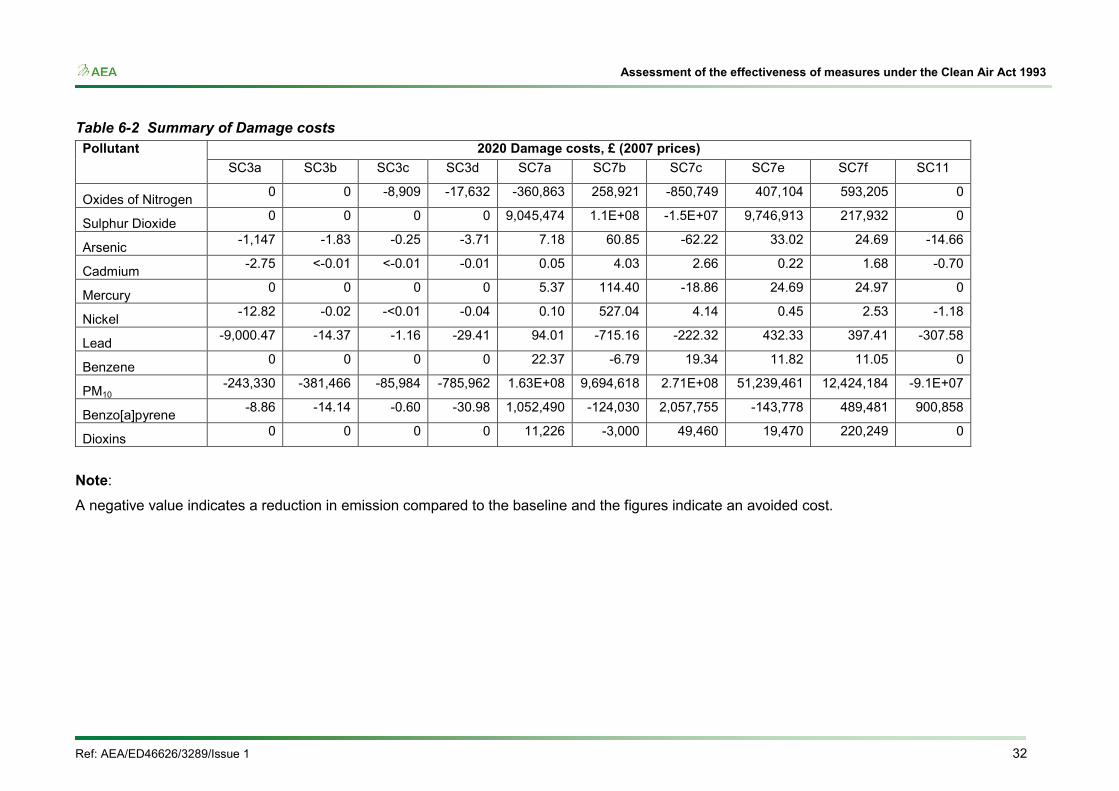
Assessment of the effectiveness of measures under the Clean Air Act 1993
Ref: AEA/ED46626/3289/Issue 1 32
Table 6-2 Summary of Damage costs Pollutant 2020 Damage costs, £ (2007 prices)
SC3a SC3b SC3c SC3d SC7a SC7b SC7c SC7e SC7f SC11
Oxides of Nitrogen 0 0 -8,909 -17,632 -360,863 258,921 -850,749 407,104 593,205 0
Sulphur Dioxide 0 0 0 0 9,045,474 1.1E+08 -1.5E+07 9,746,913 217,932 0
Arsenic -1,147 -1.83 -0.25 -3.71 7.18 60.85 -62.22 33.02 24.69 -14.66
Cadmium -2.75 <-0.01 <-0.01 -0.01 0.05 4.03 2.66 0.22 1.68 -0.70
Mercury 0 0 0 0 5.37 114.40 -18.86 24.69 24.97 0
Nickel -12.82 -0.02 -<0.01 -0.04 0.10 527.04 4.14 0.45 2.53 -1.18
Lead -9,000.47 -14.37 -1.16 -29.41 94.01 -715.16 -222.32 432.33 397.41 -307.58
Benzene 0 0 0 0 22.37 -6.79 19.34 11.82 11.05 0
PM10 -243,330 -381,466 -85,984 -785,962 1.63E+08 9,694,618 2.71E+08 51,239,461 12,424,184 -9.1E+07
Benzo[a]pyrene -8.86 -14.14 -0.60 -30.98 1,052,490 -124,030 2,057,755 -143,778 489,481 900,858
Dioxins 0 0 0 0 11,226 -3,000 49,460 19,470 220,249 0
Note:
A negative value indicates a reduction in emission compared to the baseline and the figures indicate an avoided cost.

Assessment of the effectiveness of measures under the Clean Air Act 1993
Ref: AEA/ED46626/3289/Issue 1 33
6.2 Other costs Defra, the DAs, a small number of Local Authorities with and without Smoke Control Areas and a selection of exempt appliance manufacturers/distributors have been contacted to determine the resources applied to supervising and complying with the CAA. Estimated resources to implement the CAA by Defra are summarised at Table 6-3 (the DAs were unable to provide quantitative estimates of resources used). Local Authority and manufacturer responses are summarised in Table 6-4 and Table 6-5.
Table 6-3 Defra resources for supervising the CAA Activity Days per year Preparing smoke control orders (Policy team) 6 Answering queries (Policy team) 9 Validating smoke control orders (Legal team) 8 Answering queries (Correspondence unit) 38 Answering queries (Helpdesk) 8.5 Total 69.5
Table 6-4 Local Authority resources for supervising the CAA Activity LA with SCAs LA without SCAs Responses 4 1 Hours per year Time spent dealing with chimney height enquiries or furnace approvals
<5-40 4
Responding to CAA, SCA enquiries, including smoke nuisance, exempt appliances and authorised fuels
40-70 1.5
Other costs commented : Three Authorities mentioned maintenance of SCA database/maps, websites
Table 6-5 Manufacturer/applicant resources for obtaining appliance exemption Applicant (appliance type) Hours per
product Appliance testing, £
Other
A (stove) 6-10 No data - B (boiler) 20 No data 20 hours for
translation C (boiler) 24 No data, Access, support
during tests £2500 D (stove) 79.5 3750 -

Assessment of the effectiveness of measures under the Clean Air Act 1993
Ref: AEA/ED46626/3289/Issue 1 34
7 Impacts on air quality 7.1 Selection of scenarios for assessment 7.1.1 Overview The baseline scenario includes the DECC Updated Energy Projection (UEP) of October 2011 (UEP 43) applied to the national emission projections based on the 2009 NAEI.
The scenarios chosen for assessing changes to background concentrations were developed to reflect the potential for increases in PM10/PM2.5 and associated pollutants. PM2.5 is of growing concern both with regards air quality (the need to reduce population exposure) and also inclusion in the revision to the CLRTAP Gothenburg Protocol.
Small combustion currently contributes a large proportion of UK PM10 and PM2.5 emissions of these pollutants. Emissions of NOx were considered but scenarios indicated little impact on national emissions. Sulphur dioxide emissions were also considered as a basis for the projections but although small combustion represents a larger proportion than for NOx, the contribution to national emission is less than for PM10 or PM2.5
The chosen scenarios are :
1. A high PM emission increase scenario 2. A medium PM emission increase scenario 3. A PM emission reduction scenario
7.1.2 High PM emission increase scenario As discussed in Section 5.1, changes to grit and dust regulation are considered unlikely to increase emissions and this scenario was therefore developed from elements of the smoke control area Scenario 7 to produce a large increase in emissions :
• Substitution of smokeless fuels with wood - domestic fuel in smoke control areas (7c) • An increase in wood use in smokeless areas - domestic and non-domestic fuel in
smoke control areas (7f)
For the increase in wood use, natural gas use was assumed to be displaced (worst case for growth in PM emissions) . A notional 50% increase in domestic and non0-domestic wood use at 2020 was developed which was assumed to be a reasonable upper limit on growth from the relaxation of SCA controls – this corresponds to <0.5% switch from gas for domestic appliances and about 1% for non-domestic appliances.
7.1.3 Medium PM emission increase scenario This scenario was constructed from combined high coal and high wood use in smoke control areas (Scenario 7) :
• Substitution of smokeless fuels with coal - domestic fuel in smoke control areas (7a) • An increase in coal and wood use in smokeless areas - domestic (coal) and non-
domestic fuel (wood) in smoke control areas (7e and non-domestic elements of 7f)
Increased coal use in domestic appliances from substitution of Authorised fuels and growth was felt to be a credible scenario. However, a driver for increased coal use in small non-

Assessment of the effectiveness of measures under the Clean Air Act 1993
Ref: AEA/ED46626/3289/Issue 1 35
domestic boilers was felt to be unlikely given the efficiency and practical advantages of gas operation, the incentives for renewable-fuelled boiler use and the current small market in small coal-burning boilers. Consequently, the growth in non-domestic boilers has been assumed to be from growth in wood-fuelled machines.
In both cases, natural gas use was assumed to be displaced (worst case for growth in PM emissions). A notional 50% increase in domestic coal and 50% increase in non-domestic wood use at 2020 was developed which was assumed to be a reasonable upper limit on growth from the relaxation of SCA controls – this corresponds to <0.5% switch from gas for domestic appliances and about 1% for non-domestic appliances.
7.1.4 PM Emission reduction scenario This scenario was developed from Scenario 11 and essentially assesses the benefit of applying smoke control area criteria for ‘Exempt’ appliances on a national basis. Such a scenario also indicates what may be achieved through application of an ‘Ecodesign’-type Regulation. Note that, potential for emission reduction in non-domestic small combustion is limited (as indicated by changes to grit and dust regulations in Scenario 3), the main reduction is achieved through replacement of the UK domestic solid fuel appliance population with lower emission appliances. The domestic appliance emissions have been set at a level consistent with a hybrid appliance emission factor combining roomheater and boiler emission factors based on domestic energy use for small solid fuel combustion appliances developed by the EUP Lot 15 study (about 15% roomheater and 85% automatic boiler). Note also that full emission reduction would not be achieved by 2020.
7.2 Development of background concentrations and air quality exceedences
7.2.1 Air quality modelling Full details of the modelling methods implemented are given in the annual modelling reports28 prepared for Defra . In brief, national emissions are disaggregated between point sources, distant sources and, area sources (emissions from CAA activities are assumed to be area sources). The emissions from the various sources are modelled to develop their contributions to pollutant concentration within 1 x 1 km areas. The contribution to a particular area is determined by activity grids which allow disaggregation of fuel use and hence emissions from domestic and smaller-scale combustion across the UK. The activity grids are developed for activities and each fuel type (for example coal, wood, gas, smokeless fuels) and provide an approximation to the location of Smoke Control Areas.
Note that the exact extent of Smoke Control Areas in the UK is known only to the Local Authorities which have Smoke Control Areas – modelling of emissions, has required some assumptions regarding locations which have been based on fuel use allocations across the UK assumed by the NAEI.
To assess the scenarios, each sector and each fuel replaced was considered separately. Emissions were subtracted from reduction in use of a fuel and then emissions from the increased use of the replacement fuels were added. A distribution grid for the replaced fuel was used to distribute the overall additional emissions (or overall emissions reduction) for each fuel replaced for the scenario.
For example, where domestic wood replaced domestic anthracite, we used the domestic anthracite distribution grid to calculate where the additional emissions from the domestic
28 Available here http://uk-air.defra.gov.uk/reports/cat09/1204301513_AQD2010mapsrep_master_v0.pdf and http://uk-air.defra.gov.uk/reports/cat09/1204301456_dd42009mapsrep_v7.pdf)

Assessment of the effectiveness of measures under the Clean Air Act 1993
Ref: AEA/ED46626/3289/Issue 1 36
wood would be located (after subtracting the emissions reduction due to the domestic anthracite not being burnt). If the scenario was for areas within smoke control areas only, the scenario emissions were distributed within these areas only. The concentrations from these emissions were then calculated using dispersion kernels for the area sources.
The model assesses compliance with Air Quality Directive (AQD) limits and 4th Daughter Directive (DD4) targets and assesses the areas and agglomeration zones which are likely to exceed the limits or targets.
7.2.2 Nitrogen oxides and Benzo(a)pyrene Background concentrations for NO2 and B(a)P have been calculated for the relevant metrics laid out in the Air Quality Directive at a 1 km x 1 km resolution. These maps have been calculated by summing concentrations from the following layers:
Large point sources29 – modelled using the air dispersion model ADMS and emissions estimates from the National Atmospheric Emissions Inventory (NAEI).
Small point sources – modelled using the small points model and emissions estimates from the NAEI (for NO2 only)
Distant sources – characterised by the rural background concentration (for NO2 only).
Area sources30 – modelled using a dispersion kernel and emissions estimates from the NAEI.
7.2.3 PM10 and PM2.5 For PM10 and PM2.5 a similar approach has been used to generate 1 km x 1 km background concentration maps. For these pollutants, the following layers have been included:
Secondary inorganic aerosol – derived by interpolation and scaling of measurements of SO4, NO3 and NH4 at rural sites
Secondary organic aerosol – semi-volatile organic compounds formed by the oxidation of non-methane volatile organic compounds. Estimates derived from results from Photochemical Trajectory model (the PTM model).
Large point sources of primary particles – modelled using ADMS and emissions estimates from the NAEI
Small point sources of primary particles – modelled using the small points model and emissions estimates from the NAEI
Regional primary particles – from results from the TRACK model and emissions estimates from the NAEI and EMEP
Area sources of primary particles – modelled using a dispersion kernel and emissions estimates from the NAEI
Rural calcium rich dusts from re-suspension of soils – modelled using a dispersion kernel and information on land use
Urban calcium rich dusts from re-suspension of soils due to urban activity – estimated from a combination of measurements made in Birmingham and population density
Regional iron rich dusts from re-suspension – assumed to be a constant value, estimated measurements made in the vicinity of Birmingham 29 Point source emissions are defined as emissions of a known amount from a known location (e.g. a power station). 30 Area source emissions are defined as ‘diffuse emissions’ from many unspecified locations. (e.g. emissions from domestic heating, or from shipping).

Assessment of the effectiveness of measures under the Clean Air Act 1993
Ref: AEA/ED46626/3289/Issue 1 37
Iron rich dusts from re-suspension due to vehicle activity – modelled using a dispersion kernel land and vehicle activity data for heavy duty vehicles
Sea salt – derived by interpolation and scaling of measurements of chloride at rural sites
Residual – assumed to be a constant value.
7.2.4 Roadside concentration maps Maps showing modelled roadside concentrations of NO2, PM10, PM2.5 have been calculated for 9259 urban major road links (A-roads and motorways) across the UK. These have been calculated by adding a ‘roadside increment’ concentration component to the modelled background concentration for each road. This roadside increment concentration is calculated as a function of a road link emission that has been adjusted to take into account traffic flow. The roadside increment model is then calibrated using monitoring data from the AURN. This is a similar approach to that used within the DMRB Screening Model (Boulter, Hickman, and McCrae, 2003).
7.2.5 NO2 maps Background and roadside NO2 concentration maps have been calculated by applying a calibrated version of the updated oxidant-partitioning model. This model describes the complex inter-relationships between NO, NO2 and O3 as a set of chemically coupled species (Jenkin, 2004; Murrells et al., 2008).
7.3 High PM emission increase scenario The model outputs for 2020 are summarised at Table 7-1 and Table 7-2 with detailed results and maps for 2020 provided at Appendix 3.
7.3.1 Benzo(a)pyrene The results indicate that B(a)P concentrations will exceed the 1 ng/m3 AQ PAH target due to be implemented in 2012 at an additional 22 zones. The increase in population-weighted mean exposure is particularly apparent in Northern Ireland.
7.3.2 PM2.5 The number of zones containing areas predicted to exceed the 25 µg/m3 limit (due to be implemented by 2015) and the proposed 20 µg/m3 limit (for implementation in 2020 but under review) are 13 and 19 respectively.
7.3.3 PM10 The number of zones containing areas predicted in 2020 to exceed the 31.5 µg/m3 annual equivalent of the daily limit and the 40 µg/m3 annual limit are 5 and 1 respectively. 24-hour mean concentrations have not been explicitly modelled for comparison with the 24-hour limit value. An annual mean concentration of 31.5 μg m-3, gravimetric has been taken to be equivalent to 35 days with 24-hour mean concentrations greater than 50 μg m-3 gravimetric (the 24-hour limit value). A modelled annual mean concentration of greater than this value has been taken to indicate a modelled exceedance of the 24-hour mean limit value. This

Assessment of the effectiveness of measures under the Clean Air Act 1993
Ref: AEA/ED46626/3289/Issue 1 38
equivalence has been derived from an analysis of monitoring data. More information on this can be found in Brookes et al (2011)31.
7.3.4 Nitrogen dioxide Although this scenario results in additional PM emission, the NOx emissions decrease and no zones are predicted to exceed for NO2 due to the modelled changes in the CAA and the NO2 concentrations are reduced slightly.
Table 7-1 Summary of predicted exceedences in 2020 (High PM increase) Pollutant Limit/target value Areas exceeding, km2 Zones exceeding Baseline Scenario Baseline Scenario BaP 1 ng/m3 annual target (for
PAH as BaP from 2012) 457 4194 10 32
PM2.5 25 µg/m3 annual limit (target, limit from 2015)
0 35 0 13
20 µg/m3 annual limit (proposed, under review)
0 87 0 19
PM10 40 µg/m3 annual limit 0 2 0 1
31.5 µg/m3 annual equivalent of the daily limit
0 11 0 5
Table 7-2 Population-weighted mean concentration in 2020 (High PM increase) Pollutant Scenario UK Scotland Wales Northern
Ireland England
Inner London
Outer London
Rest
ng/m3
BaP Basecase 0.23 0.18 0.30 1.07 0.28 0.21 0.20
Scenario 0.70 0.48 0.57 5.57 1.18 0.81 0.50
µg/m3
PM2.5 Basecase 9.47 7.51 7.97 7.13 13.02 11.65 9.45
Scenario 10.17 8.04 8.45 10.21 14.60 12.70 9.99
PM10 Basecase 14.22 11.49 11.92 11.60 19.22 16.99 14.21
Scenario 14.79 11.92 12.30 13.86 20.61 17.91 14.65
NO2 Basecase 13.41 8.96 10.01 6.27 26.51 19.47 13.02
Scenario 13.42 8.96 10.00 6.12 26.61 19.53 13.01
31 Brookes, D. M., Stedman, Grice, S. E., J. R., Kent, A. J., Walker, H. L., Cooke, S. L., Vincent, K. J., Lingard, J. J. N., Bush, T. J., Abbott, J (2011). UK air quality modelling UK modelling under the Air Quality Directive (2008/50/EC) for 2010 covering the following air quality pollutants: SO2, NOx, NO2, PM10, PM2.5, lead, benzene, CO, and ozone. Report for The Department for Environment, Food and Rural Affairs, Welsh Assembly Government, the Scottish Government and the Department of the Environment for Northern Ireland. AEA report. AEAT/ENV/R/3215 Issue 1. http://uk-air.defra.gov.uk/library/

Assessment of the effectiveness of measures under the Clean Air Act 1993
Ref: AEA/ED46626/3289/Issue 1 39
7.4 Medium PM emission increase scenario The model outputs for 2020 are summarised at Table 7-3 and Table 7-4 with detailed results and maps for 2020 provided at Appendix 3.
7.4.1 Benzo(a)pyrene The results indicate that B(a)P concentrations will exceed the 1 ng/m3 AQ PAH target due to be implemented in 2012 at an additional 21 zones. The increase in population-weighted mean exposure is particularly apparent in Northern Ireland.
7.4.2 PM2.5 The number of zones containing areas predicted to exceed the 25 µg/m3 limit (due to be implemented by 2015) and the proposed 20 µg/m3 limit (for implementation in 2020 but under review) are 0 and 1 respectively.
7.4.3 PM10 The number of zones containing areas predicted in 2020 to exceed the 31.5 µg/m3 annual equivalent of the daily limit (as described in section 7.3.3) and the 40 µg/m3 annual limit are 4 and 1 respectively.
7.4.4 Nitrogen dioxide Although the UK NO2 AQ concentration increases slightly there are no predicted exceedences due to the modelled changes in the CAA.
Table 7-3 Summary of predicted exceedences in 2020 (Medium PM increase) Pollutant Limit/target value Areas exceeding, km2 Zones exceeding Baseline Scenario Baseline Scenario
BaP 1 ng/m3 annual target (for PAH as BaP from 2012)
457 2091 10 31
PM2.5 25 µg/m3 annual limit (target, limit from 2015)
0 0 0 0
20 µg/m3 annual limit (proposed, under review)
0 2 0 1
PM10 40 µg/m3 annual limit 0 2 0 1
31.5 µg/m3 annual equivalent of the daily limit
0 5 0 4

Assessment of the effectiveness of measures under the Clean Air Act 1993
Ref: AEA/ED46626/3289/Issue 1 40
Table 7-4 Population-weighted mean concentration in 2020 (Medium PM increase) Pollutant Scenario UK Scotland Wales Northern
Ireland England
Inner London
Outer London
Rest
ng/m3
BaP Basecase 0.23 0.18 0.30 1.07 0.28 0.21 0.20
Scenario 0.48 0.34 0.44 3.32 0.77 0.53 0.36
µg/m3
PM2.5 Basecase 9.47 7.51 7.97 7.13 13.02 11.65 9.45
Scenario 9.74 7.71 8.15 8.11 13.64 12.06 9.66
PM10 Basecase 14.22 11.49 11.92 11.60 19.22 16.99 14.21
Scenario 14.65 11.81 12.25 13.57 20.06 17.55 14.56
NO2 Basecase 13.41 8.96 10.01 6.27 26.51 19.47 13.02
Scenario 13.44 8.97 10.01 6.21 26.64 19.55 13.03
7.5 PM emission reduction scenario The model outputs for 2020 are summarised at Table 7-5 and Table 7-6 with detailed results and maps for 2020 provided at Appendix 3.
7.5.1 Benzo(a)pyrene The results indicate that B(a)P concentrations will exceed the 1 ng/m3 AQ PAH target due to be implemented in 2012 at two fewer zones than in the basecase.
7.5.2 PM2.5 No areas are predicted to exceed the 25 µg/m3 limit (due to be implemented by 2015) or the proposed 20 µg/m3 limit (for implementation in 2020 but under review) in 2020.
7.5.3 PM10 No zones are predicted to exceed the 31.5 µg/m3 annual equivalent of the daily limit (as described in section 7.3.3) or the 40 µg/m3 annual limit in 2020.
7.5.4 Nitrogen dioxide There is no change in NOx emissions in this scenario and NO2 air quality concentrations were not modelled.
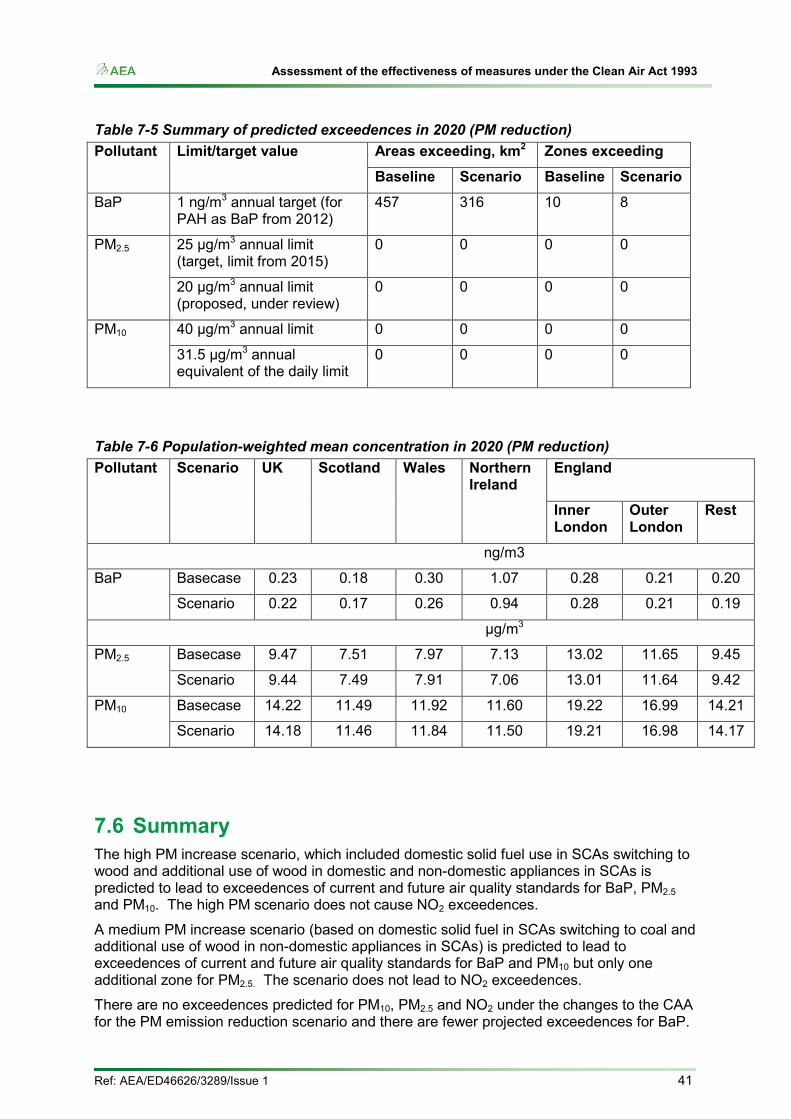
Assessment of the effectiveness of measures under the Clean Air Act 1993
Ref: AEA/ED46626/3289/Issue 1 41
Table 7-5 Summary of predicted exceedences in 2020 (PM reduction) Pollutant Limit/target value Areas exceeding, km2 Zones exceeding Baseline Scenario Baseline Scenario BaP 1 ng/m3 annual target (for
PAH as BaP from 2012) 457 316 10 8
PM2.5 25 µg/m3 annual limit (target, limit from 2015)
0 0 0 0
20 µg/m3 annual limit (proposed, under review)
0 0 0 0
PM10 40 µg/m3 annual limit 0 0 0 0
31.5 µg/m3 annual equivalent of the daily limit
0 0 0 0
Table 7-6 Population-weighted mean concentration in 2020 (PM reduction) Pollutant Scenario UK Scotland Wales Northern
Ireland England
Inner London
Outer London
Rest
ng/m3
BaP Basecase 0.23 0.18 0.30 1.07 0.28 0.21 0.20
Scenario 0.22 0.17 0.26 0.94 0.28 0.21 0.19
µg/m3
PM2.5 Basecase 9.47 7.51 7.97 7.13 13.02 11.65 9.45
Scenario 9.44 7.49 7.91 7.06 13.01 11.64 9.42
PM10 Basecase 14.22 11.49 11.92 11.60 19.22 16.99 14.21
Scenario 14.18 11.46 11.84 11.50 19.21 16.98 14.17
7.6 Summary The high PM increase scenario, which included domestic solid fuel use in SCAs switching to wood and additional use of wood in domestic and non-domestic appliances in SCAs is predicted to lead to exceedences of current and future air quality standards for BaP, PM2.5 and PM10. The high PM scenario does not cause NO2 exceedences.
A medium PM increase scenario (based on domestic solid fuel in SCAs switching to coal and additional use of wood in non-domestic appliances in SCAs) is predicted to lead to exceedences of current and future air quality standards for BaP and PM10 but only one additional zone for PM2.5. The scenario does not lead to NO2 exceedences.
There are no exceedences predicted for PM10, PM2.5 and NO2 under the changes to the CAA for the PM emission reduction scenario and there are fewer projected exceedences for BaP.

Assessment of the effectiveness of measures under the Clean Air Act 1993
Ref: AEA/ED46626/3289/Issue 1 42
8 Removing chimney height controls 8.1 Chimney height provisions Part II of the CAA (Articles 14 to 16) includes the provisions for approval of chimney height for non-domestic furnaces. This report is most concerned with paragraph 14(2):
(2) An occupier of a building shall not knowingly cause or permit a furnace to be used in the building—
(a) to burn pulverised fuel;
(b) to burn, at a rate of 45.4 kilograms or more an hour, any other solid matter; or
(c) to burn, at a rate equivalent to 366.4 kilowatts or more, any liquid or gaseous matter,
unless the height of the chimney serving the furnace has been approved for the purposes of this section and any conditions subject to which the approval was granted are complied with.
paragraph 14(4): (4) A person having possession of any fixed boiler or industrial plant, other than an exempted boiler or plant, shall not knowingly cause or permit a furnace of that boiler or plant to be used as mentioned in subsection (2), unless the height of the chimney serving the furnace has been approved for the purposes of this section and any conditions subject to which the approval was granted are complied with.
and paragraphs 16(1) and 16(2) l) This section applies where plans for the erection or extension of a building outside Greater London or in an outer London borough, other than a building used or to be used wholly for one or more of the following purposes, that is to say—
(a) as a residence or residences;
(b) as a shop or shops; or
(c) as an office or offices,
are in accordance with building regulations deposited with the local authority and the plans show that it is proposed to construct a chimney, other than one serving a furnace, for carrying smoke, grit, dust or gases from the building.
(2) The local authority shall reject the plans unless they are satisfied that the height of the chimney as shown on the plans will be sufficient to prevent, so far as practicable, the smoke, grit, dust or gases from becoming prejudicial to health or a nuisance having regard to—
(a) the purpose of the chimney;
(b) the position and descriptions of buildings near it;
(c) the levels of the neighbouring ground; and
(d) any other matters requiring consideration in the circumstances.
It is notable that the Act:
• makes separate provision for the use of: o i) chimneys discharging from furnaces in buildings o ii) chimneys discharging from fixed boilers or industrial plant and o iii) other chimneys
• relates to the use of the furnace, fixed boiler or industrial plant and not its installation
In practice, chimney heights for CAA combustion appliances are often approved on the basis of the methods described in the Chimney Heights: Third edition of the 1956 Clean Air Act Memorandum. The methods seek to determine the minimum height for a chimney that will ensure adequate dispersal of sulphur dioxide and other pollutant produced in normal combustion. Separate methods are supplied for very low sulphur fuels (natural gas, premium
Assessment of the effectiveness of measures under the Clean Air Act 1993
Ref: AEA/ED46626/3289/Issue 1 43
kerosene, butane, propane and desulphurised coke oven gas) and for other fuels. The methods do not deal with particulate emissions, e.g. from biomass combustion.
8.2 Removal of provisions If the provisions of the Clean Air Act relating to chimney heights were removed, an occupier of a building operating a furnace or a fixed boiler or industrial plant would no longer be required to obtain approval of the chimney height. There are three scenarios that might arise:
1. Developers install the lowest feasible chimney 2. Developers install a chimney corresponding to the Chimney Heights Memorandum
3rd edition or other similar guidance 3. The Local planning authority recognises that air quality is a material consideration in
assessing the planning application because the plant is in or near an Air Quality Management Area or the development itself would require the designation of an AQMA.
Defra requires an assessment of the potential impact on local air quality for a range of potential developments under these scenarios. We have developed some simple nomograms using dispersion modelling that allow the assessment of the air quality impact of a variety of typical combustion plant installations. Section 3.2 describes the development of the nomographs. We apply the nomograms to some case studies for the first two scenarios in Section 3.3.
We have assumed that the Local Authority can effectively control impacts under the planning regulations under the third scenario where the Local Authority recognises that a development potentially affects the status of an AQMA. We have not modelled this scenario.
8.3 Dispersion modelling The methods used to develop the nomographs follow the procedures used for the biomass nomographs in Local Authority Technical Guidance LAQM.TG(09). The biomass nomographs were developed assuming discharge velocities and temperatures that are typical of small biomass boilers. For this study, we have prepared nomographs for:
• Small industrial boilers and fan assisted boilers with discharge velocity of 10 m s-1 and discharge temperature of 100oC
• Condensing boilers with discharge velocity 4 m s-1 and discharge velocity of 4 m s-1.
LAQM.TG(09) has nomographs for larger industrial boilers, but these are not useful for small boilers where the effective stack height is less than 10 m.
The dispersion model ADMS4 was used to predict ground level concentrations for a unit (1 g s-1) emission rate of pollutant from discharge stacks with heights in the range 10.6-40 m and diameters in the range 0.1-1m. ADMS4 is an up-to-date dispersion model widely used to assess the air quality impact of pollutant emissions.
Further details of the modelling and output nomographs are provided in Appendix 3. These were used to develop a series of case studies for different boilers sizes and fuels.
8.4 Case studies We have used the nomographs to estimate the maximum contribution from combustion plant to ground level concentration that might arise if the provisions of the Clean Air Act relating to chimney heights were revoked. We have considered a range of boiler types for the following scenarios:

Assessment of the effectiveness of measures under the Clean Air Act 1993
Ref: AEA/ED46626/3289/Issue 1 44
• No effective control on stack heights • Chimney heights calculated using the Clean Air Act Memorandum 3rd edition or
similar guidance based on the Memorandum
We have compared the predicted contributions to the following air quality objectives:
• 50 µg m-3 as a daily mean PM10 concentration, not to be exceeded more than 35 times in a year-this corresponds to the 90th percentile 24 hour mean value
• 40 µg m-3 as a daily mean PM10 concentration • 40 µg m-3 as a daily mean nitrogen dioxide concentration • 200 µg m-3 as an hourly mean not to be exceeded more than 18 times in a year-this
corresponds to the 99.8th percentile hourly mean value • where relevant, 266 µg m-3 as a 15 minute mean sulphur dioxide concentration not to
be exceeded more than 35 times in a year-this corresponds to the 99.9th percentile value
Environmental Protection UK provide some descriptors for assessing the size of the impact for annual mean concentrations. These are shown in Table 8-1.
Table 8-1: Definition of impact magnitude for changes in pollutant concentration as a percentage of the assessment level
Magnitude of Change Change as a percentage of the annual mean objective
Large Increase/decrease >10%
Medium Increase/decrease 5 - 10%
Small Increase/decrease 1 - 5%
Imperceptible Increase/decrease <1%
The nomographs estimate ground level concentrations for oxides of nitrogen based on the estimated emissions. The air quality objectives are for nitrogen dioxide. For simplicity, we have assumed that all the oxides of nitrogen are present as nitrogen dioxide. This results in a conservative assessment of the impact.
8.4.1 Biomass boilers, < 1 MW thermal input The emission factors for biomass pellet boilers depend on the details of the fuel used and the design of the boiler. The EEA air pollutant emission inventory guidebook — 2009 provides reasonable upper limit estimates for the emission factors for well-designed pellet boilers. In practice many pellet boilers achieve lower emission factors. Table 3-26 of the guidebook provides emission factors for source category residential pellet stoves burning wood up to 1 MW thermal input. The analysis also includes assessment based on the RHI criteria for PM (30 g/GJ). Table 8-2 shows the estimated rates of emission for a range of pellet boiler sizes up to 1 MW. Table 8-2 also shows our estimated stack diameters based on flowrates calculated using the Environmental Protection UK unit conversion tool and the discharge velocities assumed in the development of the LAQM.TG(09) nomographs for biomass.

Assessment of the effectiveness of measures under the Clean Air Act 1993
Ref: AEA/ED46626/3289/Issue 1 45
Table 8-2: Typical emission rates and stack diameters for biomass boilers Thermal input,
MW Stack diameter,
m Emission rate, g s-1
NOx: 90 g GJ-1 PM10: 30 g GJ-1 PM10: 76 g GJ-1
0.1 0.2 0.009 0.003 0.0076
0.2 0.2 0.018 0.006 0.0142
0.5 0.5 0.045 0.015 0.038
1 0.5 0.09 0.03 0.076
8.4.1.1 No control on stack heights Table 8-3 shows our estimated maximum ground level concentrations derived from the nomographs (Appendix 3) for the scenario where removal of the Clean Air Act provisions removes effective control of chimney heights. The use of the nomographs is conservative in that the nomographs assume continuous operation of the boilers at capacity. The concentrations in Table 8-3 are for an effective stack height of 1 m above the roof height.
Table 8-3: Maximum ground level concentrations, µg m-3 for biomass boilers with 1 m effective stack height
Thermal input, MW
90th percentile 24 hour mean
PM10 (30 g/GJ)
90th percentile 24 hour mean
PM10 (76 g/GJ)
Annual mean PM10
(76g/GJ)
Annual mean NOx
99.8th percentile 1 hour mean
NOx 0.1 4 11 4 5 50 0.2 8 20 7 9 99 0.5 13 32 11 15 113 1 26 65 23 30 225
The predicted PM10 contribution for the 1 MW pellet boiler exceeds the objective for the daily average concentration without taking into account background concentrations. The contributions to the annual mean concentrations are large according to the EPUK criteria even for the 0.1 MW boiler.
8.4.1.2 Chimney Heights Memorandum The Chimney Heights Memorandum provides a simple graphical method for estimating the stack heights for Very Low Sulphur Fuels. These fuels comprise natural gas, premium kerosene, butane, propane and coke oven gas where satisfactorily desulphurised. The definition does not include biomass combustion and so the memorandum has not been applied here.
8.4.2 Packaged condensing gas boilers Several manufacturers provide packaged condensing gas boilers for space and water heating. They are widely installed in commercial and large residential developments. Oxides of nitrogen emissions from these boilers are typically 20 g GJ-1.
Table 8-4 shows the estimated rates of emission for a range of boiler sizes up to 2 MW. Table 8-4 also shows our estimated stack diameters based on flowrates calculated using the

Assessment of the effectiveness of measures under the Clean Air Act 1993
Ref: AEA/ED46626/3289/Issue 1 46
Environmental Protection UK unit conversion tool and the discharge velocities assumed in the development of the nomographs for condensing boilers.
Table 8-4: Typical emission rates and stack diameters for packaged condensing gas boilers
Thermal input, MW Stack diameter, m Emission rate, g s-1
NOx: 20 g/GJ 0.1 0.2 0.002
0.2 0.2 0.004
0.5 0.2 0.01
1 0.5 0.02
2 0.5 0.04
8.4.2.1 No control on stack heights Table 8-5 shows our estimated maximum ground level concentrations derived from nomographs (Appendix 3) for the scenario where removal of the Clean Air Act provisions removes effective control of chimney heights. The use of the nomographs is conservative in that the nomographs assume continuous operation of the boilers at capacity. The concentrations in Table 8-5 are for an effective stack height of 1 m above the roof height.
Table 8-5: Maximum ground level concentrations, µg m-3 for packaged condensing gas boilers with 1 m effective stack height Thermal input, MW Annual mean NOx 99.8th percentile 1 hour mean NOx 0.1 0.7 4
0.2 1.4 8
0.5 4 20
1 6 26
2 12 52
The contributions to the annual mean concentrations are small according to the EPUK criteria for gas condensing boilers with thermal input of 0.2 MW or less. The contribution is large for boilers greater than 0.5 MW thermal input.
8.4.2.2 Chimney Heights Memorandum The Chimney Heights Memorandum provides a simple method for estimating the required stack height for Very Low Sulphur Fuels including natural gas. For heat inputs, Q (MW), less than 30MW, the effective (uncorrected) stack height, U (m) is given by U=1.36Q0.6 rounded to the nearest whole metre. Table 8-6 shows our estimated maximum ground level concentrations derived for the scenario where the simple Chimney Heights formula has been applied. The contributions to the annual mean concentrations are small according to the EPUK criteria for gas condensing boilers with thermal input of 0.2 MW or less. The contribution is large for boilers greater than 0.5 MW thermal input.
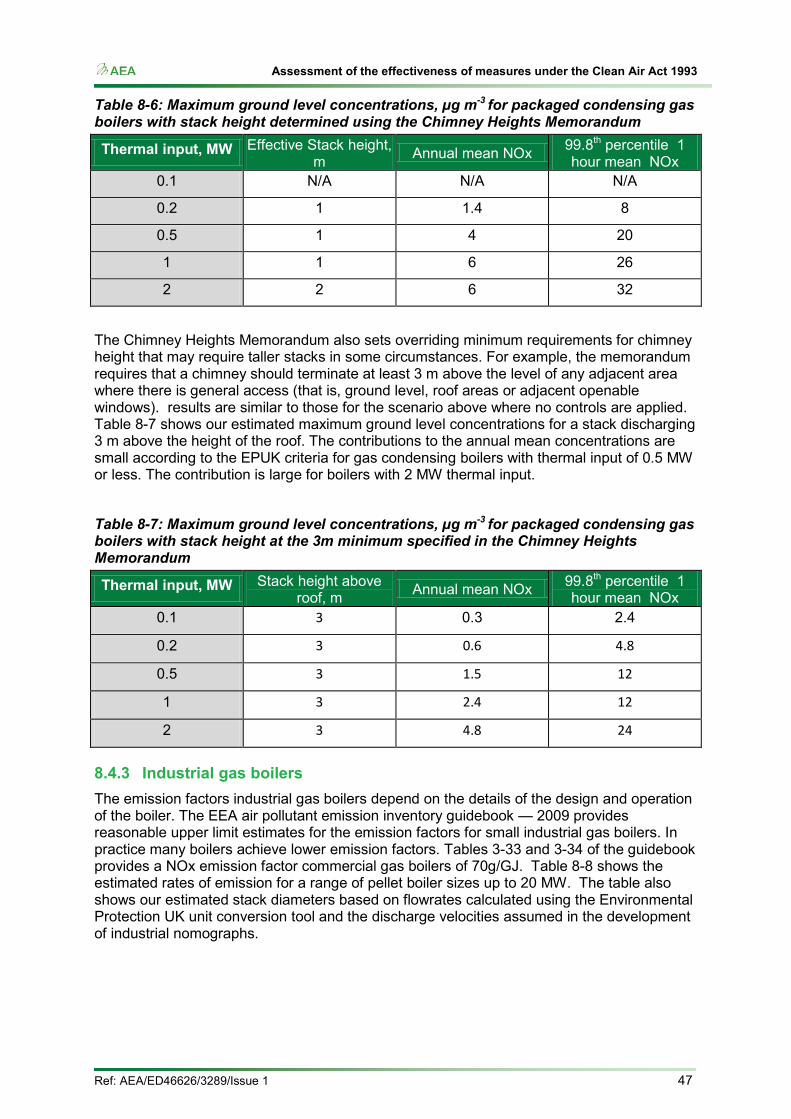
Assessment of the effectiveness of measures under the Clean Air Act 1993
Ref: AEA/ED46626/3289/Issue 1 47
Table 8-6: Maximum ground level concentrations, µg m-3 for packaged condensing gas boilers with stack height determined using the Chimney Heights Memorandum
Thermal input, MW Effective Stack height, m Annual mean NOx 99.8th percentile 1
hour mean NOx 0.1 N/A N/A N/A
0.2 1 1.4 8
0.5 1 4 20
1 1 6 26
2 2 6 32
The Chimney Heights Memorandum also sets overriding minimum requirements for chimney height that may require taller stacks in some circumstances. For example, the memorandum requires that a chimney should terminate at least 3 m above the level of any adjacent area where there is general access (that is, ground level, roof areas or adjacent openable windows). results are similar to those for the scenario above where no controls are applied. Table 8-7 shows our estimated maximum ground level concentrations for a stack discharging 3 m above the height of the roof. The contributions to the annual mean concentrations are small according to the EPUK criteria for gas condensing boilers with thermal input of 0.5 MW or less. The contribution is large for boilers with 2 MW thermal input.
Table 8-7: Maximum ground level concentrations, µg m-3 for packaged condensing gas boilers with stack height at the 3m minimum specified in the Chimney Heights Memorandum
Thermal input, MW Stack height above roof, m Annual mean NOx 99.8th percentile 1
hour mean NOx 0.1 3 0.3 2.4
0.2 3 0.6 4.8
0.5 3 1.5 12
1 3 2.4 12
2 3 4.8 24
8.4.3 Industrial gas boilers The emission factors industrial gas boilers depend on the details of the design and operation of the boiler. The EEA air pollutant emission inventory guidebook — 2009 provides reasonable upper limit estimates for the emission factors for small industrial gas boilers. In practice many boilers achieve lower emission factors. Tables 3-33 and 3-34 of the guidebook provides a NOx emission factor commercial gas boilers of 70g/GJ. Table 8-8 shows the estimated rates of emission for a range of pellet boiler sizes up to 20 MW. The table also shows our estimated stack diameters based on flowrates calculated using the Environmental Protection UK unit conversion tool and the discharge velocities assumed in the development of industrial nomographs.
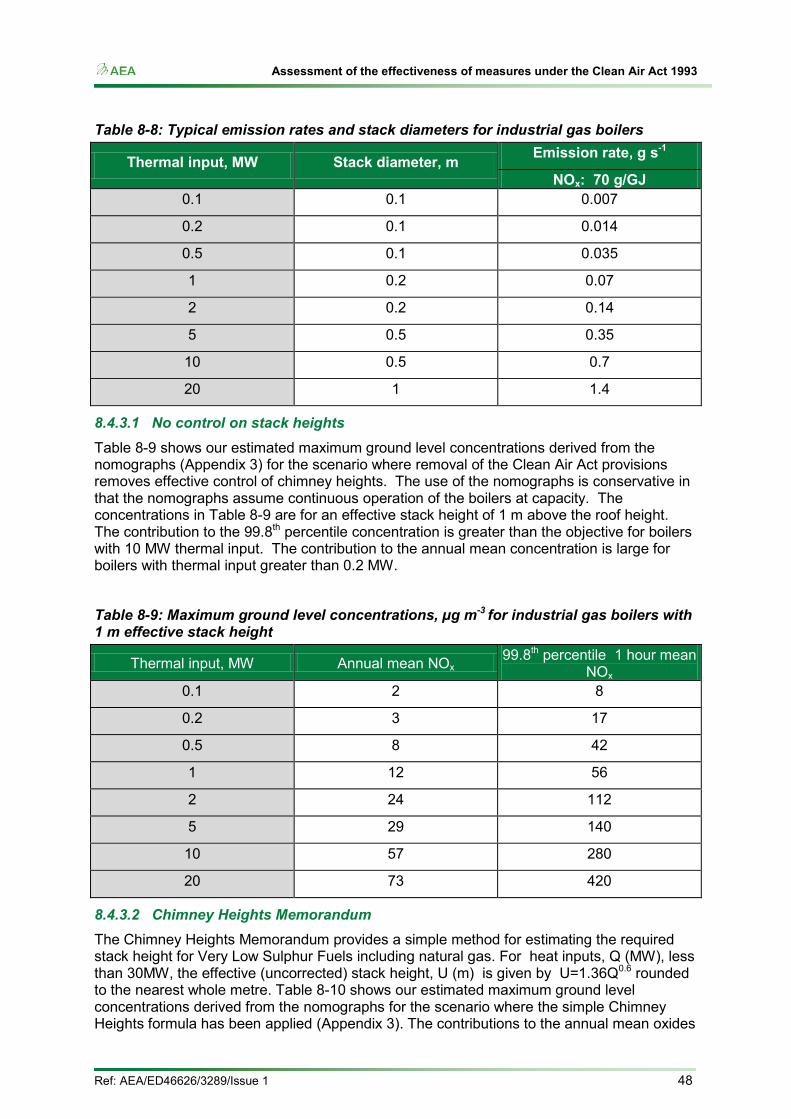
Assessment of the effectiveness of measures under the Clean Air Act 1993
Ref: AEA/ED46626/3289/Issue 1 48
Table 8-8: Typical emission rates and stack diameters for industrial gas boilers
Thermal input, MW Stack diameter, m Emission rate, g s-1
NOx: 70 g/GJ 0.1 0.1 0.007
0.2 0.1 0.014
0.5 0.1 0.035
1 0.2 0.07
2 0.2 0.14
5 0.5 0.35
10 0.5 0.7
20 1 1.4
8.4.3.1 No control on stack heights Table 8-9 shows our estimated maximum ground level concentrations derived from the nomographs (Appendix 3) for the scenario where removal of the Clean Air Act provisions removes effective control of chimney heights. The use of the nomographs is conservative in that the nomographs assume continuous operation of the boilers at capacity. The concentrations in Table 8-9 are for an effective stack height of 1 m above the roof height. The contribution to the 99.8th percentile concentration is greater than the objective for boilers with 10 MW thermal input. The contribution to the annual mean concentration is large for boilers with thermal input greater than 0.2 MW.
Table 8-9: Maximum ground level concentrations, µg m-3 for industrial gas boilers with 1 m effective stack height
Thermal input, MW Annual mean NOx 99.8th percentile 1 hour mean
NOx 0.1 2 8
0.2 3 17
0.5 8 42
1 12 56
2 24 112
5 29 140
10 57 280
20 73 420
8.4.3.2 Chimney Heights Memorandum The Chimney Heights Memorandum provides a simple method for estimating the required stack height for Very Low Sulphur Fuels including natural gas. For heat inputs, Q (MW), less than 30MW, the effective (uncorrected) stack height, U (m) is given by U=1.36Q0.6 rounded to the nearest whole metre. Table 8-10 shows our estimated maximum ground level concentrations derived from the nomographs for the scenario where the simple Chimney Heights formula has been applied (Appendix 3). The contributions to the annual mean oxides

Assessment of the effectiveness of measures under the Clean Air Act 1993
Ref: AEA/ED46626/3289/Issue 1 49
of nitrogen concentrations are large according to the EPUK criteria for industrial gas boilers with thermal input of 0.2 MW or greater.
Table 8-10: Maximum ground level concentrations, µg m-3 for industrial gas boilers with stack height determined using the Chimney Heights Memorandum
Thermal input, MW
Effective stack height, m
Emission rate, g s-1
Annual average, NOx µg m-3
99.8th percentile 1 hour mean
NOx, µg m-3
0.1 n/a 0.007 n/a n/a
0.2 1 0.014 3 17
0.5 1 0.035 8 42
1 1 0.07 12 56
2 2 0.14 14 77
5 4 0.35 12 70
10 5 0.7 21 126
20 8 1.4 25 112
8.4.4 Industrial coal boilers The emission factors industrial coal-fuelled boilers depend on the details of the design and operation of the boiler. The EEA air pollutant emission inventory guidebook — 2009 provides reasonable upper limit estimates for the emission factors for small commercial coal boilers. In practice many boilers achieve lower emission factors. Table 8-11 shows the estimated rates of emission for a range of boiler sizes up to 20 MW. Table 8-11 also shows our estimated stack diameters based on flowrates calculated using the Environmental Protection UK unit conversion tool and the discharge velocities assumed in the development industrial nomographs.
Table 8-11: Typical emission rates and stack diameters for industrial coal-fuelled boilers
Thermal input, MW
Stack diameter, m
Emission rate, g s-1
NOx: <1MW:160 g/GJ >1MW:180 g/GJ
PM10 <1MW:190 g/GJ >1MW:76 g/GJ
SO2 900 g/GJ*
0.1 0.1 0.016 0.019 0.09
0.2 0.1 0.032 0.038 0.18
0.5 0.1 0.08 0.095 0.45
1 0.2 0.16 0.19 0.9
2 0.2 0.36 0.152 1.8
5 0.5 0.9 0.38 4.5
10 0.5 1.8 0.76 9
20 1 3.6 1.52 18
*1.2% S dry ash free; lower heating value of 24.9 GJ/t net; 10% retention in ash

Assessment of the effectiveness of measures under the Clean Air Act 1993
Ref: AEA/ED46626/3289/Issue 1 50
8.4.4.1 No control on stack heights Table 8-12 shows our estimated maximum ground level concentrations derived from Figs.3.4-3.7 for the scenario where removal of the Clean Air Act provisions removes effective control of chimney heights. The use of the nomographs is conservative in that the nomographs assume continuous operation of the boilers at capacity. The concentrations in Table are for an effective stack height of 1 m above the roof height. The contribution to the 99.8th percentile oxides of nitrogen concentration is greater than the hourly objective for nitrogen dioxide for boilers with 2 MW thermal input or greater. The contribution to the 90th percentile 24 hour mean PM10 concentration is greater than the objective for boilers with thermal input 0.5 MW or greater. The contribution to the 99.9th percentile 15 minute mean sulphur dioxide concentration is greater than the objective for boilers with thermal input 0.5 MW or greater. The contributions to the annual mean concentrations for NOx and PM10 are large for boilers with thermal input greater than 0.2 MW.
Table 8-12: Maximum ground level concentrations, µg m-3 for industrial coal-fuelled boilers with 1 m effective stack height
Thermal input, MW
Stack height , m
Contribution to maximum ground level concentrations, µg m-3
Annual mean, NOx
99.8th percentile
hourly NOx
Annual mean PM10
90th percentile 24
hour mean PM10
99.9th percentile 15 minute mean
SO2
0.1 1 4 19 4 13 117
0.2 1 7 38 9 27 234
0.5 1 18 96 22 67 585
1 1 27 128 32 95 720
2 1 61 288 26 76 1440
5 1 77 360 32 95 1800
10 1 153 720 65 190 3600
20 1 180 1080 76 228 5400
8.4.4.2 Chimney Heights Memorandum The Chimney Heights Memorandum provides a simple method for estimating the required stack height for fuels containing more than 0.2 % sulphur. For installations in built-up residential areas the uncorrected stack height is given by U = 6 R0.5 for rates of sulphur dioxide emission, R less than10 kg h-1 and U = 12 R0.2 for rates of sulphur dioxide emission in the range 10-100 kg h-1. Table 8-13 shows our estimated maximum ground level concentrations derived from nomographs for the scenario where the simple Chimney Heights formula has been applied. The contribution to the 99.8th percentile oxides of nitrogen concentration is less than half the hourly objective for nitrogen dioxide for boilers up to 20 MW thermal. The contribution to the 99.9th percentile 15 minute mean sulphur dioxide concentration is greater than the objective for boilers with thermal input 2 MW or greater. The contribution to the annual mean concentration for NOx is large for boilers with thermal input greater than 1 MW. The contribution to the annual mean concentration for PM10 is small or medium throughout most of the range of boiler sizes.
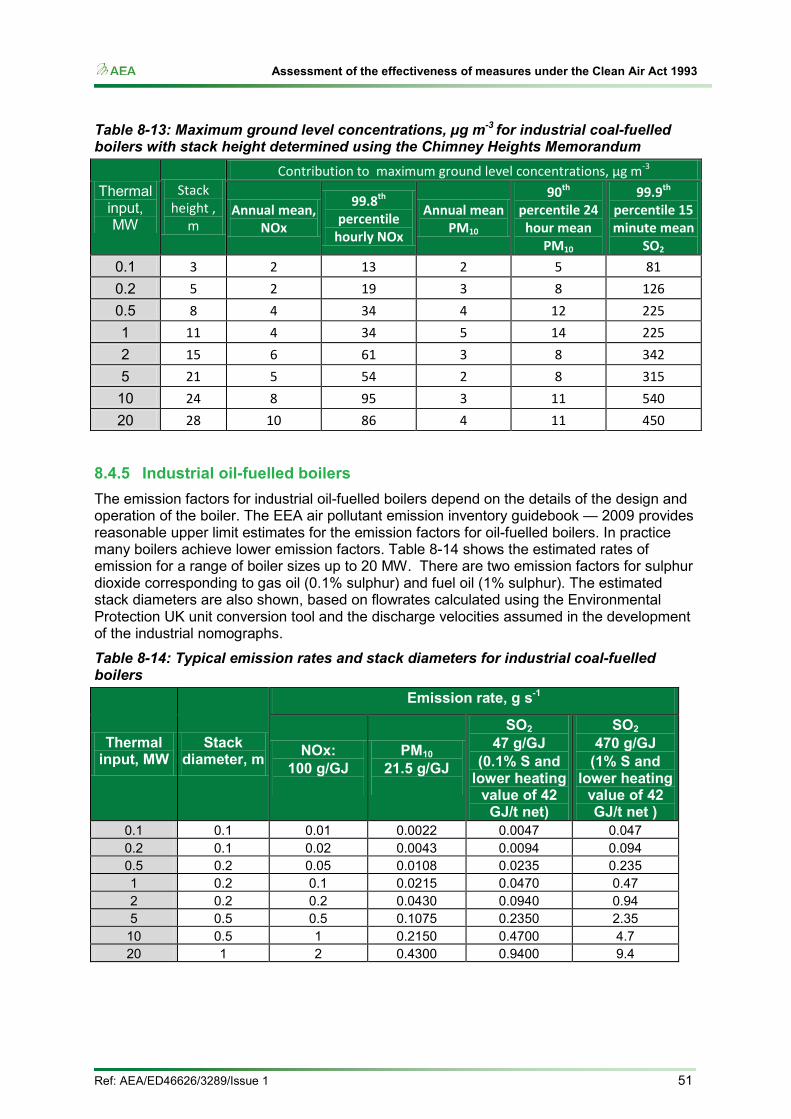
Assessment of the effectiveness of measures under the Clean Air Act 1993
Ref: AEA/ED46626/3289/Issue 1 51
Table 8-13: Maximum ground level concentrations, µg m-3 for industrial coal-fuelled boilers with stack height determined using the Chimney Heights Memorandum
Thermal input, MW
Stack height ,
m
Contribution to maximum ground level concentrations, µg m-3
Annual mean, NOx
99.8th percentile
hourly NOx
Annual mean PM10
90th percentile 24 hour mean
PM10
99.9th percentile 15 minute mean
SO2
0.1 3 2 13 2 5 81 0.2 5 2 19 3 8 126 0.5 8 4 34 4 12 225 1 11 4 34 5 14 225 2 15 6 61 3 8 342 5 21 5 54 2 8 315 10 24 8 95 3 11 540 20 28 10 86 4 11 450
8.4.5 Industrial oil-fuelled boilers The emission factors for industrial oil-fuelled boilers depend on the details of the design and operation of the boiler. The EEA air pollutant emission inventory guidebook — 2009 provides reasonable upper limit estimates for the emission factors for oil-fuelled boilers. In practice many boilers achieve lower emission factors. Table 8-14 shows the estimated rates of emission for a range of boiler sizes up to 20 MW. There are two emission factors for sulphur dioxide corresponding to gas oil (0.1% sulphur) and fuel oil (1% sulphur). The estimated stack diameters are also shown, based on flowrates calculated using the Environmental Protection UK unit conversion tool and the discharge velocities assumed in the development of the industrial nomographs.
Table 8-14: Typical emission rates and stack diameters for industrial coal-fuelled boilers
Thermal input, MW
Stack diameter, m
Emission rate, g s-1
NOx: 100 g/GJ
PM10 21.5 g/GJ
SO2 47 g/GJ
(0.1% S and lower heating
value of 42 GJ/t net)
SO2 470 g/GJ
(1% S and lower heating
value of 42 GJ/t net )
0.1 0.1 0.01 0.0022 0.0047 0.047 0.2 0.1 0.02 0.0043 0.0094 0.094 0.5 0.2 0.05 0.0108 0.0235 0.235 1 0.2 0.1 0.0215 0.0470 0.47 2 0.2 0.2 0.0430 0.0940 0.94 5 0.5 0.5 0.1075 0.2350 2.35 10 0.5 1 0.2150 0.4700 4.7 20 1 2 0.4300 0.9400 9.4

Assessment of the effectiveness of measures under the Clean Air Act 1993
Ref: AEA/ED46626/3289/Issue 1 52
8.4.5.1 No control on stack heights Table 8-15 shows our estimated maximum ground level concentrations derived for the scenario where removal of the Clean Air Act provisions removes effective control of chimney heights (see nomographs in Appendix 3). The use of the nomographs is conservative in that continuous operation of the boilers at capacity is assumed. The concentrations in Table 8-15 are for an effective stack height of 1 m above the roof height. The contribution to the 99.8th percentile oxides of nitrogen concentration is greater than the hourly objective for nitrogen dioxide for boilers with 5 MW thermal input or greater. The contribution to the 90th percentile 24 hour mean PM10 concentration is greater than the objective for boilers with thermal input 10 MW or greater. The contribution to the 99.9th percentile 15 minute mean sulphur dioxide concentration is greater than the objective for boilers with thermal input of 20 MW for gas oil (0.1% sulphur) and 0.5 MW or greater for fuel oil (1% sulphur). The contribution to the annual mean concentration for NOx is large for boilers with thermal 0.2 MW or greater.
Table 8-15: Maximum ground level concentrations, µg m-3 for industrial oil-fuelled boilers with 1 m effective stack height
Thermal input, MW
Stack height , m
Contribution to maximum ground level concentrations, µg m-3
Annual mean, NOx
99.8th percentile hourly NOx
Annual mean PM10
90th percentile 24 hour mean PM10
99.9th percentile 15 minute mean SO2
0.1% sulphur
99.9th percentile 15 minute mean SO2
1% sulphur
0.1 1 2 12 1 2 6 61 0.2 1 5 24 1 3 12 122 0.5 1 12 60 2 8 31 306 1 1 17 80 4 11 38 376 2 1 34 160 7 22 75 752 5 1 43 200 9 27 94 940
10 1 85 400 18 54 188 1880 20 1 100 600 22 65 282 2820
8.4.5.2 Chimney Heights Memorandum: Fuel oil The Chimney Heights Memorandum provides a simple method for estimating the required stack height for fuels containing more than 0.2 % sulphur. For installations in built-up residential areas the uncorrected stack height is given by U = 6 R0.5 for rates of sulphur dioxide emission, R less than10 kg h-1 and U = 12 R0.2 for rates of sulphur dioxide emission in the range 10-100 kg h-1. Table 8-16 shows our estimated maximum ground level concentrations derived for the scenario where the simple Chimney Heights formula has been applied for fuel oil with 1% sulphur. The contribution to the 99.8th percentile oxides of nitrogen concentration is less than a third of the hourly objective for nitrogen dioxide for boilers up to 20 MW thermal. The contribution to the 99.9th percentile 15 minute mean sulphur dioxide concentration is greater than the objective for boilers with thermal input 10 MW or greater. The contribution to the annual mean concentration for NOx is large for boilers with thermal input greater than 1 MW. The contribution to the annual mean concentration for PM10 is small throughout most of the range of boiler sizes.
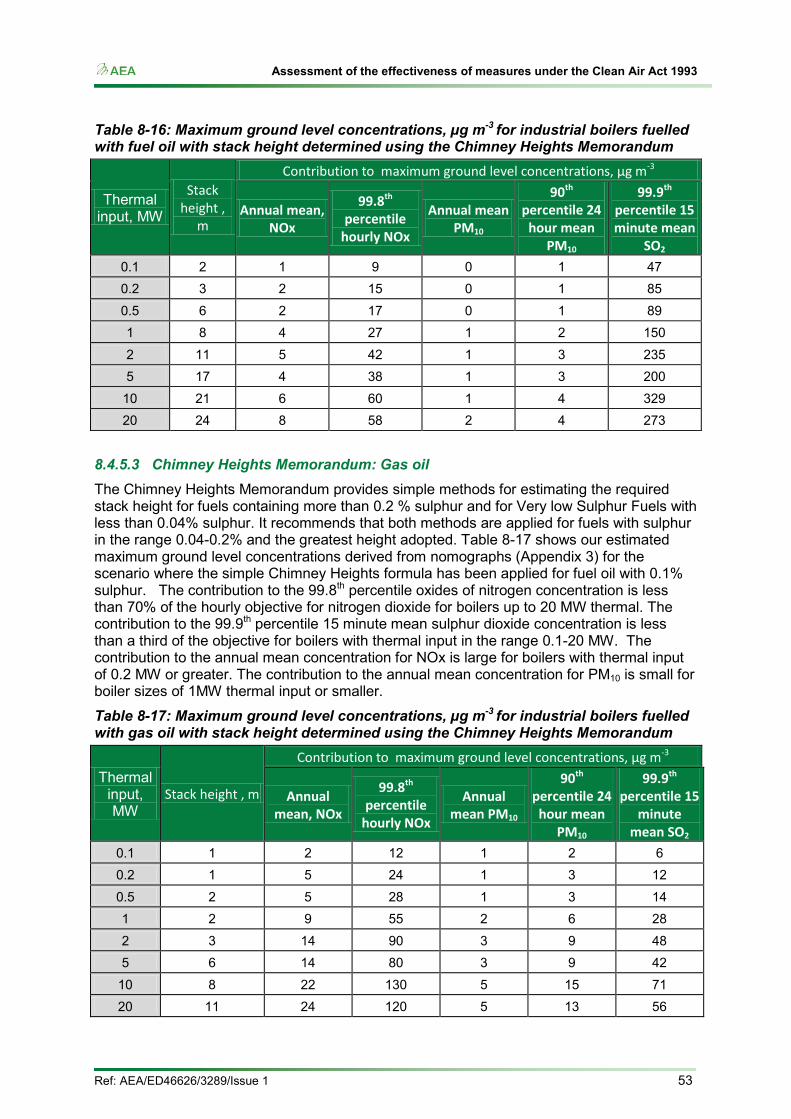
Assessment of the effectiveness of measures under the Clean Air Act 1993
Ref: AEA/ED46626/3289/Issue 1 53
Table 8-16: Maximum ground level concentrations, µg m-3 for industrial boilers fuelled with fuel oil with stack height determined using the Chimney Heights Memorandum
Thermal input, MW
Stack height ,
m
Contribution to maximum ground level concentrations, µg m-3
Annual mean, NOx
99.8th percentile
hourly NOx
Annual mean PM10
90th percentile 24
hour mean PM10
99.9th percentile 15 minute mean
SO2
0.1 2 1 9 0 1 47 0.2 3 2 15 0 1 85 0.5 6 2 17 0 1 89 1 8 4 27 1 2 150 2 11 5 42 1 3 235 5 17 4 38 1 3 200
10 21 6 60 1 4 329 20 24 8 58 2 4 273
8.4.5.3 Chimney Heights Memorandum: Gas oil The Chimney Heights Memorandum provides simple methods for estimating the required stack height for fuels containing more than 0.2 % sulphur and for Very low Sulphur Fuels with less than 0.04% sulphur. It recommends that both methods are applied for fuels with sulphur in the range 0.04-0.2% and the greatest height adopted. Table 8-17 shows our estimated maximum ground level concentrations derived from nomographs (Appendix 3) for the scenario where the simple Chimney Heights formula has been applied for fuel oil with 0.1% sulphur. The contribution to the 99.8th percentile oxides of nitrogen concentration is less than 70% of the hourly objective for nitrogen dioxide for boilers up to 20 MW thermal. The contribution to the 99.9th percentile 15 minute mean sulphur dioxide concentration is less than a third of the objective for boilers with thermal input in the range 0.1-20 MW. The contribution to the annual mean concentration for NOx is large for boilers with thermal input of 0.2 MW or greater. The contribution to the annual mean concentration for PM10 is small for boiler sizes of 1MW thermal input or smaller.
Table 8-17: Maximum ground level concentrations, µg m-3 for industrial boilers fuelled with gas oil with stack height determined using the Chimney Heights Memorandum
Thermal input, MW
Stack height , m
Contribution to maximum ground level concentrations, µg m-3
Annual mean, NOx
99.8th percentile
hourly NOx
Annual mean PM10
90th percentile 24 hour mean
PM10
99.9th percentile 15
minute mean SO2
0.1 1 2 12 1 2 6 0.2 1 5 24 1 3 12 0.5 2 5 28 1 3 14 1 2 9 55 2 6 28 2 3 14 90 3 9 48 5 6 14 80 3 9 42
10 8 22 130 5 15 71 20 11 24 120 5 13 56
Assessment of the effectiveness of measures under the Clean Air Act 1993
Ref: AEA/ED46626/3289/Issue 1 54
8.5 Summary The ‘no control’ option could have a large impact on local air quality (NOx) even for comparatively small boilers (over 200 kW for most fuels but 100 kW for biomass). Note that these sizes are lower than the threshold where CAA currently requires chimney height approval.
In general, use of the Chimney Heights Memorandum is suitable for boiler size up to 1 MW however the nomographs indicate that current air quality considerations are not addressed for CAA-controlled boilers >1 MW (and CAA-controlled furnaces can be up to 20 MW).
The nomographs could be used to provide a basis for an updated CAA provision and guidance to developers and regulators.
Assessment of the effectiveness of measures under the Clean Air Act 1993
Ref: AEA/ED46626/3289/Issue 1 55
9 Mitigating Standards and Legislation 9.1 Legislation 9.1.1 Introduction This section provides a brief summary of current and potential legislation relating to small combustion and chimney heights. Our purpose, here, is to set out our understanding of the situation. We have focused on the legislation implemented in England: equivalent legislation applies in the Devolved Administrations.
9.1.2 The Building Regulations 2010 Schedule 1 Part J of the Building Regulations 2010 specifies the requirements for combustion appliances and fuel storage systems. Requirement J2 states that combustion appliances shall have adequate provision for the discharge of combustion products to the outside air. The requirement only applies to fixed combustion appliances.
Practical guidance on ways to comply with the functional requirements in the Building Regulations is outlined in a series of 'Approved Documents' published by the Department for Communities and Local Government. Approved Document J: combustion appliances and fuel storage system provides detailed guidance for combustion installations having power ratings and fuel storage capacity up to:
• 45 kW rated output for solid fuel installations • 70 kW net (77.7 kW gross) rated input for gas installations • 45 kW rated output for oil installations
The detailed guidance thus does not correspond to the installations covered by the Clean Air Act (e.g. 366.4 kW or more for gas and oil installations). However, section 0.3 states that “for installations subject to the requirements of part J but outside the scope of the Approved Document, such as incinerators or installations with higher ratings than those mentioned above, specialist guidance may be necessary. Some larger installations may be shown to comply by adopting the relevant recommendations to be found in CIBSE Guide B and practice standards produced by BSI and IGEM.” Methods for estimating chimney heights in these documents are largely derived from the Chimney Heights: Third edition of the 1956 Clean Air Act Memorandum.
The Building Regulations 2010 define a “building” as any permanent or temporary building but not any other kind of structure or erection, and a reference to a building includes a reference to part of a building. The Regulations would therefore not be applied in the case of fixed boiler plant or industrial plant outside a building.
The Regulations are applied during the building process and for defined changes of use so do not prevent the occupier of the building causing additional pollution by, for example, changing fuels. The planning portal website http://www.planningportal.gov.uk/permission/commonprojects/boilersheating/ indicates that approved Document J should be applied where a (domestic) boiler is changed or if a new boiler is installed. However, we have not been able to establish this requirement from the Regulations themselves.
9.1.3 Town and Country Planning Act 1990 (as amended) Under the Town and Country Planning Act 1990, as amended, planning permission from the local planning authority is usually required for the carrying out of any development of land.

Assessment of the effectiveness of measures under the Clean Air Act 1993
Ref: AEA/ED46626/3289/Issue 1 56
Certain minor building works, known as permitted developments, don’t need planning permission. The local planning authority takes into account many factors when considering whether to give planning permission. Planning Policy Statement 23 Annex 1: Pollution Control, Air and Water Quality provides guidance on when air quality becomes a material consideration in development control decisions. The impact on ambient air quality is likely to be particularly important:
– where the development is proposed inside, or adjacent to, an air quality management area (AQMA) designated under Part IV of the Environment Act 1995;
– where the development could in itself result in the designation of an AQMA; and
– where to grant planning permission would conflict with, or render unworkable, elements of a LA’s air quality action plan.
Further guidance is provided in the Environmental Protection UK publication “Development control: planning for air quality (2010 Update)”.
A boiler installation requiring an outside flue will normally be permitted development for households if the flue is on the rear or side elevation of the building and is less than one metre above the highest part of the roof. This permitted development allowance applies to houses but not flats, maisonettes or other buildings. The allowance is thus only of relevance in the context of the Clean Air Act for household boilers greater than the limits specified in paragraph 14(2), e.g. greater than 366.4 kW for gas boilers. There are not many household boilers of this size.
9.1.4 Environment Protection Act 1990 Protection from smoke and other nuisance is possible under the statutory nuisance provisions within article 79 of the Environmental Protection Act 1990 (EPA 90). However, at present, the EPA 90 excludes some smoke emissions which are subject to CAA provisions so EPA 90 would need amendment to provide alternative to CAA provisions.
Statutory nuisance applies where the emission is either prejudicial to health (which is likely to be difficult to prove) or is a ‘nuisance’ – unreasonable and significant, an unreasonable effect on a person’s enjoyment of their property.
Potential nuisances relevant to the Clean Air Act includes smoke, dust, odour, fumes or gases. Local authorities are responsible for assessing nuisance and undertaking action once satisfied that a nuisance exist. In general under EPA 90, there is a need to demonstrate frequency/recurrence and duration of events so potentially any action may take longer to resolve than under the CAA.
9.1.5 Renewable Heat Incentive Regulations The 2011 RHI regulations do not include provision for emission limits but the RHI guidance ‘recognises the importance of controlling emissions from the burning of biomass’32and proposes inclusion of limits in the 2012 Regulations. These limits would apply to PM and NOx emissions from boilers <20 MW thermal input including domestic boilers.
9.1.6 Environmental Permitting Regulations 2010 Emissions to air from large furnaces are currently regulated under the Environmental Permitting Regulations 2010 (EPR 2010) or Pollution Prevention and Control (PPC) instruments in Scotland and Northern Ireland. Installations regulated under EPR or PPC instruments are excluded from CAA controls. So, unless the scope of EPR/PPC were to be extended to include CAA activities, these instruments do not provide any supervision of CAA activities. 32 DECC RHI guidance available here : http://www.decc.gov.uk/assets/decc/What%20we%20do/UK%20energy%20supply/Energy%20mix/Renewable%20energy/policy/renewableheat/1387-renewable-heat-incentive.pdf

Assessment of the effectiveness of measures under the Clean Air Act 1993
Ref: AEA/ED46626/3289/Issue 1 57
Furnaces with rated thermal inputs greater than 20 MW require permits to operate from the Local Authority or the Environment Agency (in England and Wales) or from the Scottish Environmental Protection Agency (in Scotland). The provisions of the Clean Air Act are no longer applied to furnaces with rated thermal inputs greater than 20 MW. In some instances smaller furnaces are regulated under EPR (under aggregation rules, use of waste as fuel or if the furnace is a directly-associated to an EPR activity).
The Environmental Permitting Regulations 2010 provide the basis for regulation of a wide range of industrial processes other than furnaces. The processes specified in the regulations require permits to operate from the appropriate authority. EPR 2010 thus effectively replaces Section 16 of the Clean Air Act in almost all cases. However, EPR 2010 does not have the ‘catch all’ quality of Section 16: it is conceivable that some polluting process is not covered by EPR 2010.
9.1.7 Potential future ‘Ecodesign’ instruments The EC Directive 2009/125/EC on energy-related products or ErP (which has replaced the ‘Energy using Products’ or EuP directive) provides a mechanism for setting minimum criteria including air quality pollutant emission limits. The main focus is energy efficiency and hence carbon reduction but a number of products include combustion emissions and the process has the potential to set minimum standards for air quality pollutant emissions. The draft EC Regulations on water heaters and boilers includes emission limits for NOx from gas and oil-fired appliances.
Similarly there are potential future regulations for small solid fuel appliances and non-solid fuel roomheaters.
Note that EC Ecodesign measures are for ‘products’ which are generally restricted to residential heating appliances and appliances less than 500 kW output (because appliance sales above this threshold are not large enough to meet the ‘product’ criteria in the Directive). The scope of any Regulation will therefore not cover all appliances currently covered by the CAA and may not address smoke emission.
9.2 Product Standards At present, EN303-5 includes emission classes for PM, VOC and CO and applies to solid fuel hot water boilers up to 300 kW output but is not a harmonised Standard. A revised version of EN303-5 has recently passed voting and extends the scope to 500 kW output – the Standard will be harmonised but emission criteria are not harmonised.
There are a range of harmonised product Standards covering domestic solid fuel roomheaters and boilers – these do not currently include emission criteria (other than CO). A common test method is in development for domestic roomheaters which is intended to provide a common basis for measurement of particulate emissions across Europe – partly to address the different monitoring systems currently used across Europe but also to address potential emission limits which may arise from the Ecodesign process (see 9.1.7).
Assessment of the effectiveness of measures under the Clean Air Act 1993
Ref: AEA/ED46626/3289/Issue 1 58
10 Conclusions The CAA was introduced to address air pollution from smogs caused by widespread burning of coal for residential heating and by industry. The CAA covers England, Wales and Scotland with separate legislation for Northern Ireland. The legislation targets smoke emission from chimneys and premises and smoke emissions from residential and non-residential furnaces. Although some activities fall on Defra and the Devolved Administrations, the key CAA measures are applied and supervised by Local Authorities and include the:
• Control of dark smoke; • Prohibition of cable burning except at authorised installations; • Designation and supervision of smoke control areas – control of smoke emission and
constraints on the types of appliances and fuels which can be used in such areas; • Approval of chimney heights for non-residential furnaces; • Control of grit and dust emissions from non-residential furnaces (up to thresholds in
EPR); • Approval of new non-residential furnaces; • Approval of abatement equipment for use on non-residential furnaces.
The CAA regulates combustion and other activities (including domestic combustion) which provide significant contribution to the UK total emission for many pollutants. Consequently they are also important contributors to local air quality.
The recent revision to the Gothenburg protocol sets national emission ceilings for NOx, SO2, VOC, NH3 and PM2.5 . The contribution of small combustion activities to the new 2020 ceilings for SO2, NOx and PM2.5 based on no change to the CAA are about 21, 15 and 20 % respectively which indicates the importance of these activities when considering measures to address the new ceilings.
The provisions of the CAA have been reviewed to identify the key measures available for use and hence potential changes. Changes include revocation of measures or changes to provide more focus on air quality and hence impacts on public health. The behavioural changes have been identified and impacts quantified where possible.
Scenarios for changes in emissions in 2020 from CAA-regulated activities were developed based on removal of Smoke Control Areas. In addition, scenarios were developed to assess the potential for improved measures such as replacing the grit and dust regulations and national criteria for domestic and non-domestic combustion appliances.
Credible quantifiable scenarios relating to the dark smoke and cable burning provisions could not be developed. The impacts from such activity are difficult to quantify as there are no activity data and limited emission factors to develop a reasonable emission estimate. In the absence of CAA controls/supervision, incidents of dark smoke could be expected to increase and this would lead to an increase in loss of amenity, potentially increase emissions of products of incomplete combustion, and/or potentially nuisance situations.
Changes to reduce the emission limits permitted under the Grit and Dust regulations had little effect on emissions. However, this may reflect uncertainty in the NAEI and activity data for the sector.
Removal of Smoke Control Area provisions has potential for large increases in UK emissions from domestic solid fuel combustion including significant impacts on national emissions of Benzo(a)pyrene, PM10 and PM2.5 . Uplift in the use of petroleum coke could also increase Ni, V and SO2 emissions.

Assessment of the effectiveness of measures under the Clean Air Act 1993
Ref: AEA/ED46626/3289/Issue 1 59
There is potential for some benefits to national emissions of PM10, PM2.5 and Benz(a)pyrene from applying national emission controls on solid fuel appliances to match those controls which are applied in Smoke Control Areas. Such benefits mainly arise from improvements to domestic solid fuel heating appliances.
Three scenarios were developed to investigate potential impacts on air quality concentrations of PM2.5, PM10, BaP and NO2. These indicate little or no change in NO2 ambient concentrations. The high PM increase scenario, which included domestic solid fuel use in SCAs switching to wood and additional use of wood in domestic and non-domestic appliances in SCAs is predicted to lead to exceedences of current and future air quality standards for BaP, PM2.5 and PM10.
A medium PM increase scenario (based on domestic solid fuel in SCAs switching to coal and additional use of wood in non-domestic appliances in SCAs) is predicted to lead to exceedences of current and future air quality standards for BaP and PM10 but only one additional zone for PM2.5.
There are no exceedences predicted for PM10, PM2.5 and NO2 under the changes to the CAA for the PM emission reduction scenario and there are fewer projected exceedences for BaP.
Although there is provision for control of stack height through Building Regulations, removal of chimney height provisions in the CAA could have a large impact on local air quality (NO2) even for comparatively small boilers (over 200 kW for most fuels but 100 kW for biomass). Note that these sizes are lower than the threshold where CAA currently requires chimney height approval.
In general, use of the Chimney Heights Memorandum is suitable for boiler size up to 1 MW however nomographs developed to model chimney height impacts indicate that current air quality considerations are not addressed for CAA-controlled boilers >1 MW (and CAA-controlled furnaces can be up to 20 MW).
Application of the nomographs indicates that removing the Clean Air Act requirements for approval of stack heights for small boilers (<20 MW thermal input) can potentially lead to high local air quality concentrations in excess of the air quality objectives and EU limit values.
Assessment of the effectiveness of measures under the Clean Air Act 1993
Ref: AEA/ED46626/3289/Issue 1 60
Appendices Appendix 1: Scenario output tables
Appendix 2: Devolved administration disaggregation
Appendix 3: Air quality concentration modelling outputs
Appendix 4 : Chimney height assumptions and nomographs

Assessment of the effectiveness of measures under the Clean Air Act 1993
Ref: AEA/ED46626/3289/Issue 1 61
Appendix 1 – Detailed outputs of scenario modelling
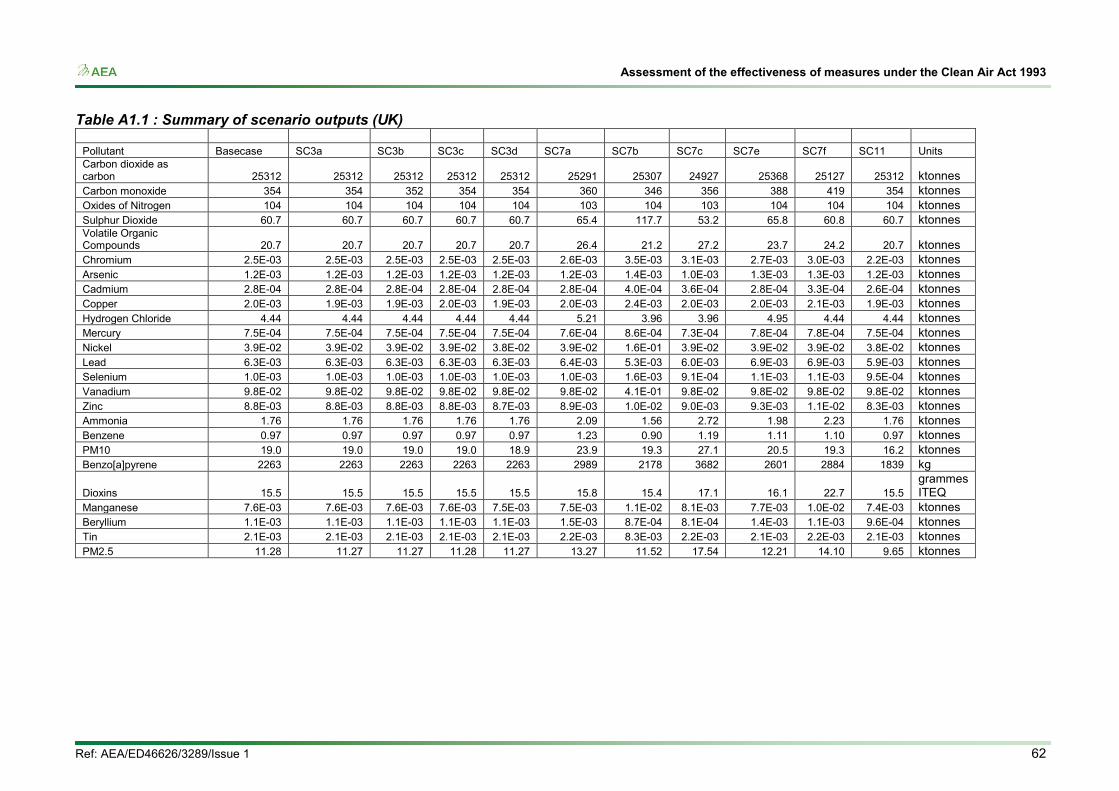
Assessment of the effectiveness of measures under the Clean Air Act 1993
Ref: AEA/ED46626/3289/Issue 1 62
Table A1.1 : Summary of scenario outputs (UK)
Pollutant Basecase SC3a SC3b SC3c SC3d SC7a SC7b SC7c SC7e SC7f SC11 Units Carbon dioxide as carbon 25312 25312 25312 25312 25312 25291 25307 24927 25368 25127 25312 ktonnes Carbon monoxide 354 354 352 354 354 360 346 356 388 419 354 ktonnes Oxides of Nitrogen 104 104 104 104 104 103 104 103 104 104 104 ktonnes Sulphur Dioxide 60.7 60.7 60.7 60.7 60.7 65.4 117.7 53.2 65.8 60.8 60.7 ktonnes Volatile Organic Compounds 20.7 20.7 20.7 20.7 20.7 26.4 21.2 27.2 23.7 24.2 20.7 ktonnes Chromium 2.5E-03 2.5E-03 2.5E-03 2.5E-03 2.5E-03 2.6E-03 3.5E-03 3.1E-03 2.7E-03 3.0E-03 2.2E-03 ktonnes Arsenic 1.2E-03 1.2E-03 1.2E-03 1.2E-03 1.2E-03 1.2E-03 1.4E-03 1.0E-03 1.3E-03 1.3E-03 1.2E-03 ktonnes Cadmium 2.8E-04 2.8E-04 2.8E-04 2.8E-04 2.8E-04 2.8E-04 4.0E-04 3.6E-04 2.8E-04 3.3E-04 2.6E-04 ktonnes Copper 2.0E-03 1.9E-03 1.9E-03 2.0E-03 1.9E-03 2.0E-03 2.4E-03 2.0E-03 2.0E-03 2.1E-03 1.9E-03 ktonnes Hydrogen Chloride 4.44 4.44 4.44 4.44 4.44 5.21 3.96 3.96 4.95 4.44 4.44 ktonnes Mercury 7.5E-04 7.5E-04 7.5E-04 7.5E-04 7.5E-04 7.6E-04 8.6E-04 7.3E-04 7.8E-04 7.8E-04 7.5E-04 ktonnes Nickel 3.9E-02 3.9E-02 3.9E-02 3.9E-02 3.8E-02 3.9E-02 1.6E-01 3.9E-02 3.9E-02 3.9E-02 3.8E-02 ktonnes Lead 6.3E-03 6.3E-03 6.3E-03 6.3E-03 6.3E-03 6.4E-03 5.3E-03 6.0E-03 6.9E-03 6.9E-03 5.9E-03 ktonnes Selenium 1.0E-03 1.0E-03 1.0E-03 1.0E-03 1.0E-03 1.0E-03 1.6E-03 9.1E-04 1.1E-03 1.1E-03 9.5E-04 ktonnes Vanadium 9.8E-02 9.8E-02 9.8E-02 9.8E-02 9.8E-02 9.8E-02 4.1E-01 9.8E-02 9.8E-02 9.8E-02 9.8E-02 ktonnes Zinc 8.8E-03 8.8E-03 8.8E-03 8.8E-03 8.7E-03 8.9E-03 1.0E-02 9.0E-03 9.3E-03 1.1E-02 8.3E-03 ktonnes Ammonia 1.76 1.76 1.76 1.76 1.76 2.09 1.56 2.72 1.98 2.23 1.76 ktonnes Benzene 0.97 0.97 0.97 0.97 0.97 1.23 0.90 1.19 1.11 1.10 0.97 ktonnes PM10 19.0 19.0 19.0 19.0 18.9 23.9 19.3 27.1 20.5 19.3 16.2 ktonnes Benzo[a]pyrene 2263 2263 2263 2263 2263 2989 2178 3682 2601 2884 1839 kg
Dioxins 15.5 15.5 15.5 15.5 15.5 15.8 15.4 17.1 16.1 22.7 15.5 grammes ITEQ
Manganese 7.6E-03 7.6E-03 7.6E-03 7.6E-03 7.5E-03 7.5E-03 1.1E-02 8.1E-03 7.7E-03 1.0E-02 7.4E-03 ktonnes Beryllium 1.1E-03 1.1E-03 1.1E-03 1.1E-03 1.1E-03 1.5E-03 8.7E-04 8.1E-04 1.4E-03 1.1E-03 9.6E-04 ktonnes Tin 2.1E-03 2.1E-03 2.1E-03 2.1E-03 2.1E-03 2.2E-03 8.3E-03 2.2E-03 2.1E-03 2.2E-03 2.1E-03 ktonnes PM2.5 11.28 11.27 11.27 11.28 11.27 13.27 11.52 17.54 12.21 14.10 9.65 ktonnes
Assessment of the effectiveness of measures under the Clean Air Act 1993
Ref: AEA/ED46626/3289/Issue 1 63
Appendix 2 – Devolved Administrations summary tables

Assessment of the effectiveness of measures under the Clean Air Act 1993
Ref: AEA/ED46626/3289/Issue 1 64
Table A2.1 Summary of basecase and emission changes - England Pollutant Basecase SC3a SC3b SC3c SC3d SC7a SC7b SC7c SC7e SC7f SC11 Units Carbon dioxide as carbon 20499 0.0E+00 0.0E+00 0.0E+00 0.0E+00 -1.7E+01 -3.5E+00 -3.1E+02 4.5E+01 -1.5E+02 0.0E+00 ktonnes Carbon monoxide 242 0.0E+00 -1.4E+00 0.0E+00 0.0E+00 4.2E+00 -5.0E+00 1.5E+00 2.4E+01 4.5E+01 0.0E+00 ktonnes Oxides of Nitrogen 84 0.0E+00 0.0E+00 -6.4E-03 -1.3E-02 -2.6E-01 1.9E-01 -6.1E-01 2.9E-01 4.2E-01 0.0E+00 ktonnes Sulphur Dioxide 44 0.0E+00 0.0E+00 0.0E+00 0.0E+00 3.4E+00 4.2E+01 -5.5E+00 3.7E+00 8.3E-02 0.0E+00 ktonnes Volatile Organic Compounds 13 0.0E+00 0.0E+00 0.0E+00 0.0E+00 3.7E+00 3.2E-01 4.2E+00 2.0E+00 2.3E+00 0.0E+00 ktonnes Chromium 1.7E-03 -3.0E-07 -4.8E-07 -5.0E-07 -1.6E-06 2.9E-05 6.8E-04 4.2E-04 1.4E-04 3.4E-04 -1.9E-04 ktonnes Arsenic 8.4E-04 -2.5E-06 -3.9E-06 -5.2E-07 -8.4E-06 1.5E-05 1.3E-04 -1.3E-04 7.1E-05 5.3E-05 -3.1E-05 ktonnes Cadmium 1.9E-04 -5.6E-08 -9.0E-08 -9.8E-08 -3.0E-07 9.8E-07 8.2E-05 5.4E-05 4.5E-06 3.4E-05 -1.4E-05 ktonnes Copper 1.3E-03 -1.0E-05 -1.6E-05 -1.2E-06 -3.3E-05 6.9E-06 2.8E-04 1.0E-05 3.2E-05 1.3E-04 -2.8E-05 ktonnes Hydrogen Chloride 3.3 0.0E+00 0.0E+00 0.0E+00 0.0E+00 5.7E-01 -3.5E-01 -3.5E-01 3.8E-01 0.0E+00 0.0E+00 ktonnes Mercury 5.2E-04 0.0E+00 0.0E+00 0.0E+00 0.0E+00 3.6E-06 7.6E-05 -1.3E-05 1.7E-05 1.7E-05 0.0E+00 ktonnes Nickel 2.7E-02 -2.0E-06 -3.1E-06 -7.9E-07 -7.3E-06 1.5E-05 8.1E-02 6.3E-04 6.9E-05 3.9E-04 -1.8E-04 ktonnes Lead 4.3E-03 -8.9E-06 -1.4E-05 -1.1E-06 -3.0E-05 9.3E-05 -7.1E-04 -2.2E-04 4.3E-04 3.9E-04 -3.0E-04 ktonnes Selenium 6.9E-04 -9.0E-07 -1.4E-06 -6.7E-08 -2.9E-06 1.4E-05 3.9E-04 -6.8E-05 6.3E-05 3.5E-05 -3.8E-05 ktonnes Vanadium 6.7E-02 -1.0E-06 -1.7E-06 -2.3E-08 -3.9E-06 3.6E-06 2.1E-01 -1.3E-05 1.7E-05 1.2E-05 -1.1E-05 ktonnes Zinc 6.1E-03 -1.1E-05 -1.7E-05 -1.0E-05 -4.5E-05 8.1E-05 8.5E-04 1.7E-04 3.7E-04 1.2E-03 -3.4E-04 ktonnes Ammonia 1.3 0.0E+00 0.0E+00 0.0E+00 0.0E+00 2.4E-01 -1.5E-01 7.0E-01 1.6E-01 3.5E-01 0.0E+00 ktonnes Benzene 0.6 0.0E+00 0.0E+00 0.0E+00 0.0E+00 1.6E-01 -5.0E-02 1.4E-01 8.6E-02 8.1E-02 0.0E+00 ktonnes PM10 13 -5.0E-03 -7.9E-03 -1.8E-03 -1.8E-02 3.4E+00 2.0E-01 5.6E+00 1.1E+00 2.6E-01 -1.9E+00 ktonnes Benzo[a]pyrene 1559 -4.2E-03 -6.7E-03 -2.8E-04 -1.5E-02 5.0E+02 -5.9E+01 9.8E+02 2.3E+02 4.3E+02 -2.9E+02 kg
Dioxins 11 0.0E+00 0.0E+00 0.0E+00 0.0E+00 2.5E-01 -6.8E-02 1.1E+00 4.4E-01 5.0E+00 0.0E+00 grammes ITEQ
Manganese 5.2E-03 -2.7E-06 -4.2E-06 -3.8E-05 -4.7E-05 -5.9E-05 2.5E-03 3.2E-04 5.7E-05 1.8E-03 -1.2E-04 ktonnes Beryllium 7.4E-04 -1.2E-06 -2.0E-06 -2.6E-08 -3.8E-06 3.0E-04 -1.4E-04 -1.8E-04 2.0E-04 4.3E-06 -7.6E-05 ktonnes Tin 1.5E-03 -2.6E-07 -4.2E-07 -5.5E-07 -1.4E-06 3.2E-05 4.3E-03 8.9E-05 2.1E-05 8.9E-05 -2.9E-05 ktonnes PM2.5 7.8 -1.9E-03 -3.0E-03 -1.3E-03 -7.9E-03 1.4E+00 1.7E-01 4.3E+00 6.4E-01 1.9E+00 -1.1E+00 ktonnes

Assessment of the effectiveness of measures under the Clean Air Act 1993
Ref: AEA/ED46626/3289/Issue 1 65
Table A2.2 Summary of basecase and emission changes - Scotland Pollutant Basecase SC3a SC3b SC3c SC3d SC7a SC7b SC7c SC7e SC7f SC11 Units Carbon dioxide as carbon 2330 0.0E+00 0.0E+00 0.0E+00 0.0E+00 -1.9E+00 -3.9E-01
-3.5E+01 5.2E+00 -1.7E+01 0.0E+00 ktonnes
Carbon monoxide 51 0.0E+00 -2.9E-01 0.0E+00 0.0E+00 8.7E-01 -1.0E+00 3.1E-01 4.9E+00 9.4E+00 0.0E+00 ktonnes Oxides of Nitrogen 10 0.0E+00 0.0E+00 -7.3E-04 -1.4E-03 -2.9E-02 2.1E-02 -6.9E-02 3.3E-02 4.8E-02 0.0E+00 ktonnes Sulphur Dioxide 6.7 0.0E+00 0.0E+00 0.0E+00 0.0E+00 5.2E-01 6.3E+00 -8.3E-01 5.6E-01 1.2E-02 0.0E+00 ktonnes Volatile Organic Compounds 3.2 0.0E+00 0.0E+00 0.0E+00 0.0E+00 8.9E-01 7.8E-02 1.0E+00 4.7E-01 5.5E-01 0.0E+00 ktonnes Chromium 3.5E-04 -6.0E-08 -9.5E-08 -1.0E-07 -3.1E-07 5.9E-06 1.4E-04 8.5E-05 2.7E-05 6.7E-05 -3.8E-05 ktonnes Arsenic 1.7E-04 -4.9E-07 -7.8E-07 -1.0E-07 -1.7E-06 3.1E-06 2.6E-05 -2.7E-05 1.4E-05 1.1E-05 -6.3E-06 ktonnes Cadmium 3.8E-05 -1.1E-08 -1.8E-08 -2.0E-08 -5.9E-08 2.0E-07 1.6E-05 1.1E-05 9.0E-07 6.9E-06 -2.9E-06 ktonnes Copper 2.7E-04 -2.0E-06 -3.2E-06 -2.3E-07 -6.5E-06 1.4E-06 5.5E-05 2.1E-06 6.3E-06 2.6E-05 -5.5E-06 ktonnes Hydrogen Chloride 4.9E-01 0.0E+00 0.0E+00 0.0E+00 0.0E+00 8.5E-02 -5.3E-02 -5.3E-02 5.6E-02 0.0E+00 0.0E+00 ktonnes Mercury 1.0E-04 0.0E+00 0.0E+00 0.0E+00 0.0E+00 7.2E-07 1.5E-05 -2.5E-06 3.3E-06 3.3E-06 0.0E+00 ktonnes Nickel 5.3E-03 -3.9E-07 -6.3E-07 -1.6E-07 -1.5E-06 3.0E-06 1.6E-02 1.3E-04 1.4E-05 7.7E-05 -3.6E-05 ktonnes Lead 8.7E-04 -1.8E-06 -2.8E-06 -2.3E-07 -6.0E-06 1.9E-05 -1.4E-04 -4.4E-05 8.5E-05 7.9E-05 -6.1E-05 ktonnes Selenium 1.4E-04 -1.8E-07 -2.9E-07 -1.3E-08 -5.7E-07 2.7E-06 7.8E-05 -1.4E-05 1.3E-05 7.0E-06 -7.6E-06 ktonnes Vanadium 1.3E-02 -2.1E-07 -3.3E-07 -4.7E-09 -7.8E-07 7.2E-07 4.3E-02 -2.5E-06 3.3E-06 2.4E-06 -2.2E-06 ktonnes Zinc 1.2E-03 -2.1E-06 -3.4E-06 -2.0E-06 -9.1E-06 1.6E-05 1.7E-04 3.5E-05 7.5E-05 2.5E-04 -6.7E-05 ktonnes Ammonia 1.9E-01 0.0E+00 0.0E+00 0.0E+00 0.0E+00 3.6E-02 -2.2E-02 1.1E-01 2.4E-02 5.2E-02 0.0E+00 ktonnes Benzene 1.5E-01 0.0E+00 0.0E+00 0.0E+00 0.0E+00 3.9E-02 -1.2E-02 3.4E-02 2.1E-02 1.9E-02 0.0E+00 ktonnes PM10 2.6 -1.0E-03 -1.6E-03 -3.6E-04 -3.6E-03 6.7E-01 4.0E-02 1.1E+00 2.1E-01 5.1E-02 -3.8E-01 ktonnes
Benzo[a]pyrene 311 -8.4E-04 -1.3E-03 -5.7E-05 -3.0E-03 1.0E+02 -1.2E+01 2.0E+02 4.6E+01 8.5E+01 -
5.8E+01 kg
Dioxins 2.1 0.0E+00 0.0E+00 0.0E+00 0.0E+00 5.0E-02 -1.3E-02 2.2E-01 8.8E-02 9.9E-01 0.0E+00 grammes ITEQ
Manganese 1.0E-03 -5.3E-07 -8.5E-07 -7.6E-06 -9.3E-06 -1.2E-05 5.0E-04 6.3E-05 1.1E-05 3.5E-04 -2.4E-05 ktonnes Beryllium 1.5E-04 -2.5E-07 -3.9E-07 -5.2E-09 -7.7E-07 6.0E-05 -2.8E-05 -3.6E-05 4.0E-05 8.5E-07 -1.5E-05 ktonnes Tin 2.9E-04 -5.2E-08 -8.3E-08 -1.1E-07 -2.9E-07 6.3E-06 8.6E-04 1.8E-05 4.2E-06 1.8E-05 -5.8E-06 ktonnes PM2.5 1.6 -3.8E-04 -6.0E-04 -2.5E-04 -1.6E-03 2.7E-01 3.3E-02 8.6E-01 1.3E-01 3.9E-01 -2.2E-01 ktonnes
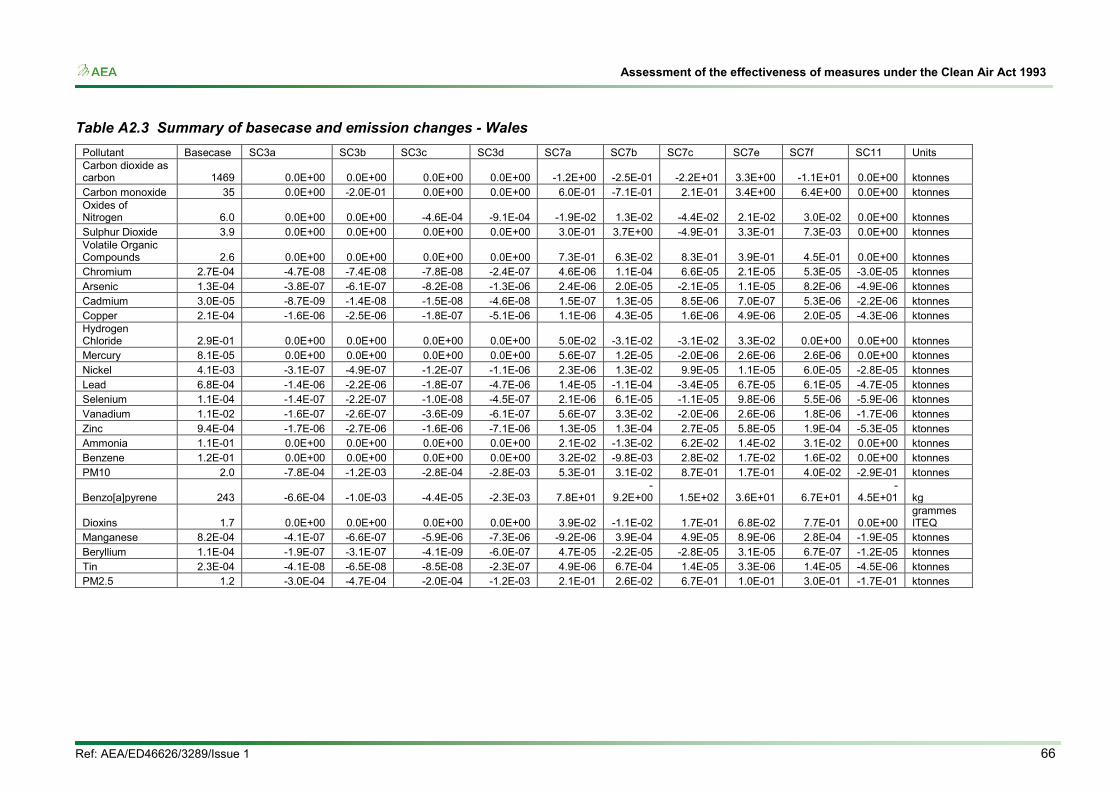
Assessment of the effectiveness of measures under the Clean Air Act 1993
Ref: AEA/ED46626/3289/Issue 1 66
Table A2.3 Summary of basecase and emission changes - Wales Pollutant Basecase SC3a SC3b SC3c SC3d SC7a SC7b SC7c SC7e SC7f SC11 Units Carbon dioxide as carbon 1469 0.0E+00 0.0E+00 0.0E+00 0.0E+00 -1.2E+00 -2.5E-01 -2.2E+01 3.3E+00 -1.1E+01 0.0E+00 ktonnes Carbon monoxide 35 0.0E+00 -2.0E-01 0.0E+00 0.0E+00 6.0E-01 -7.1E-01 2.1E-01 3.4E+00 6.4E+00 0.0E+00 ktonnes Oxides of Nitrogen 6.0 0.0E+00 0.0E+00 -4.6E-04 -9.1E-04 -1.9E-02 1.3E-02 -4.4E-02 2.1E-02 3.0E-02 0.0E+00 ktonnes Sulphur Dioxide 3.9 0.0E+00 0.0E+00 0.0E+00 0.0E+00 3.0E-01 3.7E+00 -4.9E-01 3.3E-01 7.3E-03 0.0E+00 ktonnes Volatile Organic Compounds 2.6 0.0E+00 0.0E+00 0.0E+00 0.0E+00 7.3E-01 6.3E-02 8.3E-01 3.9E-01 4.5E-01 0.0E+00 ktonnes Chromium 2.7E-04 -4.7E-08 -7.4E-08 -7.8E-08 -2.4E-07 4.6E-06 1.1E-04 6.6E-05 2.1E-05 5.3E-05 -3.0E-05 ktonnes Arsenic 1.3E-04 -3.8E-07 -6.1E-07 -8.2E-08 -1.3E-06 2.4E-06 2.0E-05 -2.1E-05 1.1E-05 8.2E-06 -4.9E-06 ktonnes Cadmium 3.0E-05 -8.7E-09 -1.4E-08 -1.5E-08 -4.6E-08 1.5E-07 1.3E-05 8.5E-06 7.0E-07 5.3E-06 -2.2E-06 ktonnes Copper 2.1E-04 -1.6E-06 -2.5E-06 -1.8E-07 -5.1E-06 1.1E-06 4.3E-05 1.6E-06 4.9E-06 2.0E-05 -4.3E-06 ktonnes Hydrogen Chloride 2.9E-01 0.0E+00 0.0E+00 0.0E+00 0.0E+00 5.0E-02 -3.1E-02 -3.1E-02 3.3E-02 0.0E+00 0.0E+00 ktonnes Mercury 8.1E-05 0.0E+00 0.0E+00 0.0E+00 0.0E+00 5.6E-07 1.2E-05 -2.0E-06 2.6E-06 2.6E-06 0.0E+00 ktonnes Nickel 4.1E-03 -3.1E-07 -4.9E-07 -1.2E-07 -1.1E-06 2.3E-06 1.3E-02 9.9E-05 1.1E-05 6.0E-05 -2.8E-05 ktonnes Lead 6.8E-04 -1.4E-06 -2.2E-06 -1.8E-07 -4.7E-06 1.4E-05 -1.1E-04 -3.4E-05 6.7E-05 6.1E-05 -4.7E-05 ktonnes Selenium 1.1E-04 -1.4E-07 -2.2E-07 -1.0E-08 -4.5E-07 2.1E-06 6.1E-05 -1.1E-05 9.8E-06 5.5E-06 -5.9E-06 ktonnes Vanadium 1.1E-02 -1.6E-07 -2.6E-07 -3.6E-09 -6.1E-07 5.6E-07 3.3E-02 -2.0E-06 2.6E-06 1.8E-06 -1.7E-06 ktonnes Zinc 9.4E-04 -1.7E-06 -2.7E-06 -1.6E-06 -7.1E-06 1.3E-05 1.3E-04 2.7E-05 5.8E-05 1.9E-04 -5.3E-05 ktonnes Ammonia 1.1E-01 0.0E+00 0.0E+00 0.0E+00 0.0E+00 2.1E-02 -1.3E-02 6.2E-02 1.4E-02 3.1E-02 0.0E+00 ktonnes Benzene 1.2E-01 0.0E+00 0.0E+00 0.0E+00 0.0E+00 3.2E-02 -9.8E-03 2.8E-02 1.7E-02 1.6E-02 0.0E+00 ktonnes PM10 2.0 -7.8E-04 -1.2E-03 -2.8E-04 -2.8E-03 5.3E-01 3.1E-02 8.7E-01 1.7E-01 4.0E-02 -2.9E-01 ktonnes
Benzo[a]pyrene 243 -6.6E-04 -1.0E-03 -4.4E-05 -2.3E-03 7.8E+01 -
9.2E+00 1.5E+02 3.6E+01 6.7E+01 -
4.5E+01 kg
Dioxins 1.7 0.0E+00 0.0E+00 0.0E+00 0.0E+00 3.9E-02 -1.1E-02 1.7E-01 6.8E-02 7.7E-01 0.0E+00 grammes ITEQ
Manganese 8.2E-04 -4.1E-07 -6.6E-07 -5.9E-06 -7.3E-06 -9.2E-06 3.9E-04 4.9E-05 8.9E-06 2.8E-04 -1.9E-05 ktonnes Beryllium 1.1E-04 -1.9E-07 -3.1E-07 -4.1E-09 -6.0E-07 4.7E-05 -2.2E-05 -2.8E-05 3.1E-05 6.7E-07 -1.2E-05 ktonnes Tin 2.3E-04 -4.1E-08 -6.5E-08 -8.5E-08 -2.3E-07 4.9E-06 6.7E-04 1.4E-05 3.3E-06 1.4E-05 -4.5E-06 ktonnes PM2.5 1.2 -3.0E-04 -4.7E-04 -2.0E-04 -1.2E-03 2.1E-01 2.6E-02 6.7E-01 1.0E-01 3.0E-01 -1.7E-01 ktonnes

Assessment of the effectiveness of measures under the Clean Air Act 1993
Ref: AEA/ED46626/3289/Issue 1 67
Table A2.4 Summary of basecase and emission changes – Northern Ireland Pollutant Basecase SC3a SC3b SC3c SC3d SC7a SC7b SC7c SC7e SC7f SC11 Units Carbon dioxide as carbon 1014 0.0E+00 0.0E+00 0.0E+00 0.0E+00 -8.2E-01 -1.7E-01 -1.5E+01 2.2E+00 -7.4E+00 0.0E+00 ktonnes Carbon monoxide 26 0.0E+00 -1.5E-01 0.0E+00 0.0E+00 4.6E-01 -5.5E-01 1.6E-01 2.6E+00 4.9E+00 0.0E+00 ktonnes Oxides of Nitrogen 4.2 0.0E+00 0.0E+00 -3.2E-04 -6.2E-04 -1.3E-02 9.2E-03 -3.0E-02 1.4E-02 2.1E-02 0.0E+00 ktonnes Sulphur Dioxide 5.6 0.0E+00 0.0E+00 0.0E+00 0.0E+00 4.3E-01 5.2E+00 -6.9E-01 4.6E-01 1.0E-02 0.0E+00 ktonnes Volatile Organic Compounds 1.4 0.0E+00 0.0E+00 0.0E+00 0.0E+00 3.9E-01 3.4E-02 4.5E-01 2.1E-01 2.4E-01 0.0E+00 ktonnes Chromium 1.7E-04 -2.9E-08 -4.6E-08 -4.8E-08 -1.5E-07 2.8E-06 6.5E-05 4.1E-05 1.3E-05 3.2E-05 -1.8E-05 ktonnes Arsenic 8.1E-05 -2.3E-07 -3.8E-07 -5.0E-08 -8.1E-07 1.5E-06 1.2E-05 -1.3E-05 6.8E-06 5.1E-06 -3.0E-06 ktonnes Cadmium 1.8E-05 -5.4E-09 -8.6E-09 -9.4E-09 -2.8E-08 9.4E-08 7.9E-06 5.2E-06 4.3E-07 3.3E-06 -1.4E-06 ktonnes Copper 1.3E-04 -9.8E-07 -1.6E-06 -1.1E-07 -3.1E-06 6.6E-07 2.7E-05 9.9E-07 3.0E-06 1.2E-05 -2.6E-06 ktonnes Hydrogen Chloride 4.1E-01 0.0E+00 0.0E+00 0.0E+00 0.0E+00 7.1E-02 -4.4E-02 -4.4E-02 4.7E-02 0.0E+00 0.0E+00 ktonnes Mercury 5.0E-05 0.0E+00 0.0E+00 0.0E+00 0.0E+00 3.4E-07 7.3E-06 -1.2E-06 1.6E-06 1.6E-06 0.0E+00 ktonnes Nickel 2.5E-03 -1.9E-07 -3.0E-07 -7.5E-08 -7.0E-07 1.4E-06 7.7E-03 6.1E-05 6.6E-06 3.7E-05 -1.7E-05 ktonnes Lead 4.2E-04 -8.5E-07 -1.4E-06 -1.1E-07 -2.9E-06 8.9E-06 -6.8E-05 -2.1E-05 4.1E-05 3.8E-05 -2.9E-05 ktonnes Selenium 6.7E-05 -8.6E-08 -1.4E-07 -6.4E-09 -2.8E-07 1.3E-06 3.8E-05 -6.5E-06 6.0E-06 3.4E-06 -3.6E-06 ktonnes Vanadium 6.5E-03 -1.0E-07 -1.6E-07 -2.2E-09 -3.7E-07 3.4E-07 2.0E-02 -1.2E-06 1.6E-06 1.1E-06 -1.0E-06 ktonnes Zinc 5.8E-04 -1.0E-06 -1.6E-06 -9.6E-07 -4.4E-06 7.8E-06 8.2E-05 1.7E-05 3.6E-05 1.2E-04 -3.2E-05 ktonnes Ammonia 1.6E-01 0.0E+00 0.0E+00 0.0E+00 0.0E+00 3.0E-02 -1.8E-02 8.8E-02 2.0E-02 4.3E-02 0.0E+00 ktonnes Benzene 6.7E-02 0.0E+00 0.0E+00 0.0E+00 0.0E+00 1.7E-02 -5.2E-03 1.5E-02 9.1E-03 8.5E-03 0.0E+00 ktonnes PM10 1.3 -4.8E-04 -7.6E-04 -1.7E-04 -1.7E-03 3.2E-01 1.9E-02 5.4E-01 1.0E-01 2.5E-02 -1.8E-01 ktonnes
Benzo[a]pyrene 150 -4.0E-04 -6.4E-04 -2.7E-05 -1.4E-03 4.8E+01 -
5.7E+00 9.4E+01 2.2E+01 4.1E+01 -
2.8E+01 kg
Dioxins 1.0 0.0E+00 0.0E+00 0.0E+00 0.0E+00 2.4E-02 -6.5E-03 1.1E-01 4.2E-02 4.8E-01 0.0E+00 grammes ITEQ
Manganese 5.0E-04 -2.5E-07 -4.1E-07 -3.7E-06 -4.5E-06 -5.7E-06 2.4E-04 3.0E-05 5.5E-06 1.7E-04 -1.2E-05 ktonnes Beryllium 7.1E-05 -1.2E-07 -1.9E-07 -2.5E-09 -3.7E-07 2.9E-05 -1.3E-05 -1.7E-05 1.9E-05 4.1E-07 -7.3E-06 ktonnes Tin 1.4E-04 -2.5E-08 -4.0E-08 -5.3E-08 -1.4E-07 3.0E-06 4.1E-04 8.6E-06 2.0E-06 8.6E-06 -2.8E-06 ktonnes PM2.5 7.5E-01 -1.8E-04 -2.9E-04 -1.2E-04 -7.6E-04 1.3E-01 1.6E-02 4.1E-01 6.1E-02 1.9E-01 -1.1E-01 ktonnes

Assessment of the effectiveness of measures under the Clean Air Act 1993
Ref: AEA/ED46626/3289/Issue 1 68
Appendix 3 – Air Quality concentration modelling A3.1 High PM emission scenario outputs Table A3.1 Benzo(a)pyrene outputs
2020 scenario 7c+7f Basecase Scenario
>1.0 ngm-3 >1.0 ngm-3
Zagglom backgr_km2 backgr_km2 Greater London Urban Area 0 325 West Midlands Urban Area 0 2 Greater Manchester Urban Area 0 46 West Yorkshire Urban Area 0 104 Tyneside 0 65 Liverpool Urban Area 0 29 Sheffield Urban Area 0 11 Nottingham Urban Area 0 0 Bristol Urban Area 0 1 Brighton/Worthing/Littlehampton 0 0 Leicester Urban Area 0 0 Portsmouth Urban Area 0 1 Teesside Urban Area 2 9 The Potteries 0 6 Bournemouth Urban Area 0 0 Reading/Wokingham Urban Area 0 10 Coventry/Bedworth 0 0 Kingston upon Hull 0 0 Southampton Urban Area 0 4 Birkenhead Urban Area 0 2 Southend Urban Area 0 0 Blackpool Urban Area 0 0 Preston Urban Area 0 2 Glasgow Urban Area 0 8 Edinburgh Urban Area 0 1 Cardiff Urban Area 0 0 Swansea Urban Area 0 7 Belfast Metropolitan Urban Area 130 208 Eastern 0 0 South West 0 15 South East 0 50 East Midlands 0 17 North West & Merseyside 2 301 Yorkshire & Humberside 9 462 West Midlands 2 72 North East 5 385 Central Scotland 0 161

Assessment of the effectiveness of measures under the Clean Air Act 1993
Ref: AEA/ED46626/3289/Issue 1 69
2020 scenario 7c+7f Basecase Scenario
>1.0 ngm-3 >1.0 ngm-3
Zagglom backgr_km2 backgr_km2 North East Scotland 0 6 Highland 1 1 Scottish Borders 0 0 South Wales 32 114 North Wales 4 112 Northern Ireland 270 1657
London 0 325 Rest of England 20 1594 Scotland 1 177 Wales 36 233 Northern Ireland 400 1865 Total 457 4194 Total zones exceeding 10 32
Table A3.2 Population-weighted mean concentrations for Benzo(a)pyrene (ng/m3)
Basecase Scenario
Scotland 0.18 0.48 Wales 0.30 0.57 Northern Ireland 1.07 5.57 Inner London 0.28 1.18 Outer London 0.21 0.81 Rest of England 0.20 0.50 UK 0.23 0.70

Assessment of the effectiveness of measures under the Clean Air Act 1993
Ref: AEA/ED46626/3289/Issue 1 70
Figure A3.1 Impacts on BaP AQ concentration Baseline Scenario

Assessment of the effectiveness of measures under the Clean Air Act 1993
Ref: AEA/ED46626/3289/Issue 1 71
Table A3.3 PM2.5 outputs
2020 scenario 7c+7f Basecase Scenario Basecase Scenario
>20 ugm-3 >20 ugm-3 >25 ugm-3 >25 ugm-3
Zagglom backgr_km2 backgr_km2 backgr_km2 backgr_km2 Greater London Urban Area 0 0 0 0 West Midlands Urban Area 0 0 0 0 Greater Manchester Urban Area 0 1 0 0 West Yorkshire Urban Area 0 5 0 1 Tyneside 0 2 0 1 Liverpool Urban Area 0 2 0 2 Sheffield Urban Area 0 1 0 0 Nottingham Urban Area 0 0 0 0 Bristol Urban Area 0 0 0 0 Brighton/Worthing/Littlehampton 0 0 0 0 Leicester Urban Area 0 0 0 0 Portsmouth Urban Area 0 0 0 0 Teesside Urban Area 0 1 0 1 The Potteries 0 1 0 1 Bournemouth Urban Area 0 0 0 0 Reading/Wokingham Urban Area 0 0 0 0 Coventry/Bedworth 0 0 0 0 Kingston upon Hull 0 0 0 0 Southampton Urban Area 0 0 0 0 Birkenhead Urban Area 0 0 0 0 Southend Urban Area 0 0 0 0 Blackpool Urban Area 0 0 0 0 Preston Urban Area 0 0 0 0 Glasgow Urban Area 0 0 0 0 Edinburgh Urban Area 0 0 0 0 Cardiff Urban Area 0 0 0 0 Swansea Urban Area 0 0 0 0 Belfast Metropolitan Urban Area 0 33 0 13 Eastern 0 0 0 0 South West 0 1 0 1 South East 0 1 0 0 East Midlands 0 1 0 0 North West & Merseyside 0 6 0 2 Yorkshire & Humberside 0 8 0 4 West Midlands 0 1 0 0 North East 0 6 0 1 Central Scotland 0 2 0 1 North East Scotland 0 0 0 0 Highland 0 0 0 0 Scottish Borders 0 0 0 0 South Wales 0 2 0 2
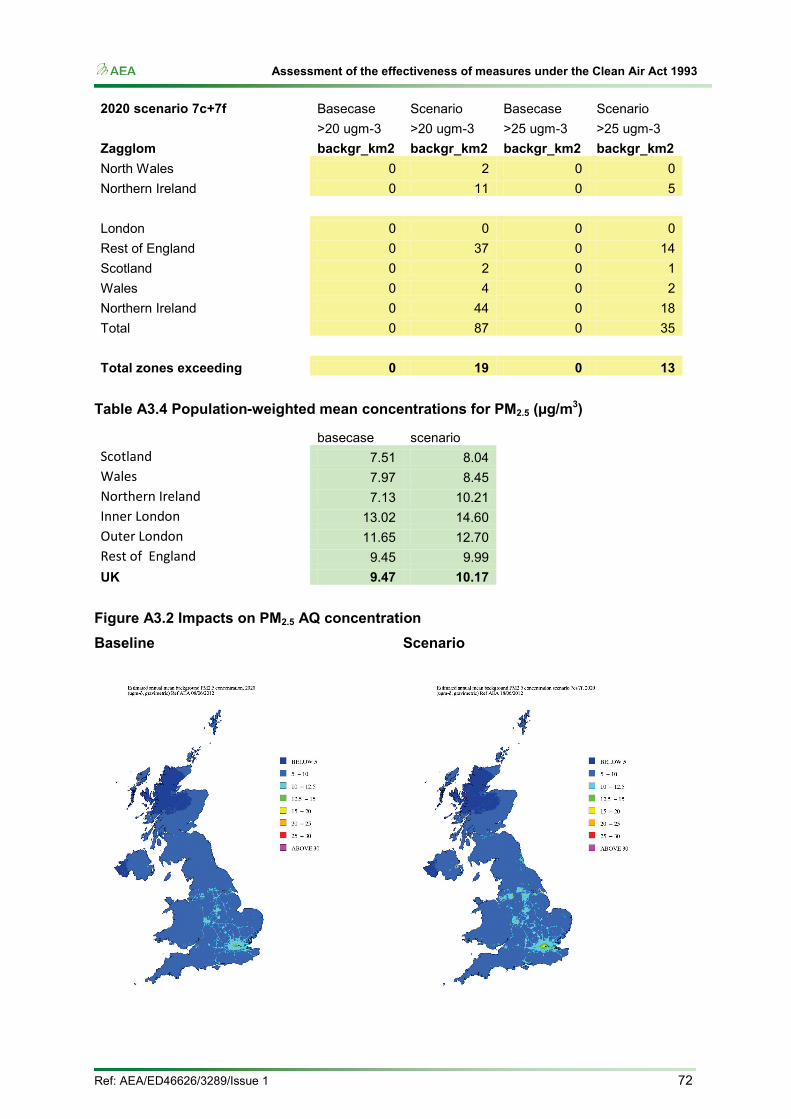
Assessment of the effectiveness of measures under the Clean Air Act 1993
Ref: AEA/ED46626/3289/Issue 1 72
2020 scenario 7c+7f Basecase Scenario Basecase Scenario
>20 ugm-3 >20 ugm-3 >25 ugm-3 >25 ugm-3
Zagglom backgr_km2 backgr_km2 backgr_km2 backgr_km2 North Wales 0 2 0 0 Northern Ireland 0 11 0 5
London 0 0 0 0 Rest of England 0 37 0 14 Scotland 0 2 0 1 Wales 0 4 0 2 Northern Ireland 0 44 0 18 Total 0 87 0 35
Total zones exceeding 0 19 0 13
Table A3.4 Population-weighted mean concentrations for PM2.5 (µg/m3)
basecase scenario
Scotland 7.51 8.04 Wales 7.97 8.45 Northern Ireland 7.13 10.21 Inner London 13.02 14.60 Outer London 11.65 12.70 Rest of England 9.45 9.99 UK 9.47 10.17
Figure A3.2 Impacts on PM2.5 AQ concentration Baseline Scenario

Assessment of the effectiveness of measures under the Clean Air Act 1993
Ref: AEA/ED46626/3289/Issue 1 73
Table A3.5 PM10 outputs 2020 scenario 7c+7f Basecase Scenario Basecase Scenario
>31.5 ugm-3 >31.5 ugm-3 >40 ugm-3 >40 ugm-3
Zagglom backgr_km2 backgr_km2 backgr_km2 backgr_km2 Greater London Urban Area 0 0 0 0 West Midlands Urban Area 0 0 0 0 Greater Manchester Urban Area 0 0 0 0 West Yorkshire Urban Area 0 0 0 0 Tyneside 0 0 0 0 Liverpool Urban Area 0 0 0 0 Sheffield Urban Area 0 0 0 0 Nottingham Urban Area 0 0 0 0 Bristol Urban Area 0 0 0 0 Brighton/Worthing/Littlehampton 0 0 0 0 Leicester Urban Area 0 0 0 0 Portsmouth Urban Area 0 0 0 0 Teesside Urban Area 0 1 0 0 The Potteries 0 0 0 0 Bournemouth Urban Area 0 0 0 0 Reading/Wokingham Urban Area 0 0 0 0 Coventry/Bedworth 0 0 0 0 Kingston upon Hull 0 0 0 0 Southampton Urban Area 0 0 0 0 Birkenhead Urban Area 0 0 0 0 Southend Urban Area 0 0 0 0 Blackpool Urban Area 0 0 0 0 Preston Urban Area 0 0 0 0 Glasgow Urban Area 0 0 0 0 Edinburgh Urban Area 0 0 0 0 Cardiff Urban Area 0 0 0 0 Swansea Urban Area 0 0 0 0 Belfast Metropolitan Urban Area 0 5 0 0 Eastern 0 0 0 0 South West 0 0 0 0 South East 0 0 0 0 East Midlands 0 0 0 0 North West & Merseyside 0 0 0 0 Yorkshire & Humberside 0 1 0 0 West Midlands 0 0 0 0 North East 0 0 0 0 Central Scotland 0 0 0 0 North East Scotland 0 0 0 0 Highland 0 0 0 0 Scottish Borders 0 0 0 0 South Wales 0 2 0 2 North Wales 0 0 0 0 Northern Ireland 0 2 0 0
London 0 0 0 0 Rest of England 0 2 0 0 Scotland 0 0 0 0 Wales 0 2 0 2 Northern Ireland 0 7 0 0
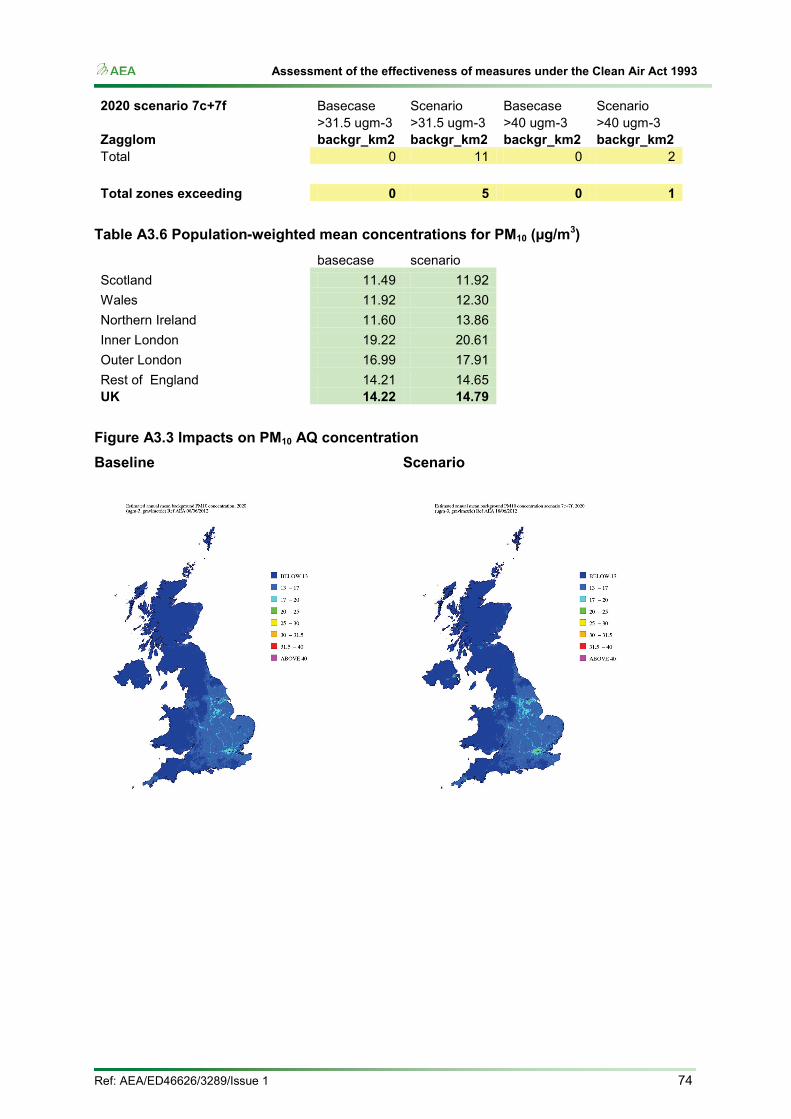
Assessment of the effectiveness of measures under the Clean Air Act 1993
Ref: AEA/ED46626/3289/Issue 1 74
2020 scenario 7c+7f Basecase Scenario Basecase Scenario
>31.5 ugm-3 >31.5 ugm-3 >40 ugm-3 >40 ugm-3
Zagglom backgr_km2 backgr_km2 backgr_km2 backgr_km2 Total 0 11 0 2
Total zones exceeding 0 5 0 1
Table A3.6 Population-weighted mean concentrations for PM10 (µg/m3)
basecase scenario
Scotland 11.49 11.92 Wales 11.92 12.30 Northern Ireland 11.60 13.86 Inner London 19.22 20.61 Outer London 16.99 17.91 Rest of England 14.21 14.65 UK 14.22 14.79
Figure A3.3 Impacts on PM10 AQ concentration Baseline Scenario

Assessment of the effectiveness of measures under the Clean Air Act 1993
Ref: AEA/ED46626/3289/Issue 1 75
Table A3.7 Population-weighted mean concentrations for NO2 (µg/m3)
Basecase Scenario
Scotland 8.96 8.96 Wales 10.01 10.00 Northern Ireland 6.27 6.12 Inner London 26.51 26.61 Outer London 19.47 19.53 Rest of England 13.02 13.02 UK 13.41 13.42
Figure A3.4 Impacts on NO2 AQ concentration Baseline Scenario

Assessment of the effectiveness of measures under the Clean Air Act 1993
Ref: AEA/ED46626/3289/Issue 1 76
A3.2 Medium PM emission scenario outputs
Table A3.8 Benzo(a)pyrene outputs
2020 scenario 7a7e+nondom7f Basecase Scenario
>1.0 ngm-3 >1.0 ngm-3
Zagglom backgr_km2 backgr_km2 Greater London Urban Area 0 3 West Midlands Urban Area 0 1 Greater Manchester Urban Area 0 15 West Yorkshire Urban Area 0 26 Tyneside 0 21 Liverpool Urban Area 0 15 Sheffield Urban Area 0 2 Nottingham Urban Area 0 0 Bristol Urban Area 0 1 Brighton/Worthing/Littlehampton 0 0 Leicester Urban Area 0 0 Portsmouth Urban Area 0 1 Teesside Urban Area 2 6 The Potteries 0 3 Bournemouth Urban Area 0 0 Reading/Wokingham Urban Area 0 5 Coventry/Bedworth 0 0 Kingston upon Hull 0 0 Southampton Urban Area 0 1 Birkenhead Urban Area 0 1 Southend Urban Area 0 0 Blackpool Urban Area 0 0 Preston Urban Area 0 1 Glasgow Urban Area 0 1 Edinburgh Urban Area 0 0 Cardiff Urban Area 0 0 Swansea Urban Area 0 2 Belfast Metropolitan Urban Area 130 204 Eastern 0 0 South West 0 6 South East 0 17 East Midlands 0 7 North West & Merseyside 2 116 Yorkshire & Humberside 9 176 West Midlands 2 29 North East 5 149 Central Scotland 0 50 North East Scotland 0 3 Highland 1 1

Assessment of the effectiveness of measures under the Clean Air Act 1993
Ref: AEA/ED46626/3289/Issue 1 77
2020 scenario 7a7e+nondom7f Basecase Scenario
>1.0 ngm-3 >1.0 ngm-3
Zagglom backgr_km2 backgr_km2 Scottish Borders 0 0 South Wales 32 67 North Wales 4 50 Northern Ireland 270 1111
London 0 3 Rest of England 20 599 Scotland 1 55 Wales 36 119 Northern Ireland 400 1315 Total 457 2091 Total zones exceeding 10 31
Table A3.9 Population-weighted mean concentrations for Benzo(a)pyrene (ng/m3)
Basecase Scenario
Scotland 0.18 0.34 Wales 0.30 0.44 Northern Ireland 1.07 3.32 Inner London 0.28 0.77 Outer London 0.21 0.53 Rest of England 0.20 0.36 UK 0.23 0.48

Assessment of the effectiveness of measures under the Clean Air Act 1993
Ref: AEA/ED46626/3289/Issue 1 78
Figure A3.5 Impacts on BaP AQ concentration Baseline Scenario

Assessment of the effectiveness of measures under the Clean Air Act 1993
Ref: AEA/ED46626/3289/Issue 1 79
Table A3.10 PM2.5 outputs
2020 scenario 7a7e+nondom7f Basecase Scenario Basecase Scenario
>20 ugm-3 >20 ugm-3 >25 ugm-3 >25 ugm-3
Zagglom backgr_km2 backgr_km2 backgr_km2 backgr_km2 Greater London Urban Area 0 0 0 0 West Midlands Urban Area 0 0 0 0 Greater Manchester Urban Area 0 0 0 0 West Yorkshire Urban Area 0 0 0 0 Tyneside 0 0 0 0 Liverpool Urban Area 0 0 0 0 Sheffield Urban Area 0 0 0 0 Nottingham Urban Area 0 0 0 0 Bristol Urban Area 0 0 0 0 Brighton/Worthing/Littlehampton 0 0 0 0 Leicester Urban Area 0 0 0 0 Portsmouth Urban Area 0 0 0 0 Teesside Urban Area 0 0 0 0 The Potteries 0 0 0 0 Bournemouth Urban Area 0 0 0 0 Reading/Wokingham Urban Area 0 0 0 0 Coventry/Bedworth 0 0 0 0 Kingston upon Hull 0 0 0 0 Southampton Urban Area 0 0 0 0 Birkenhead Urban Area 0 0 0 0 Southend Urban Area 0 0 0 0 Blackpool Urban Area 0 0 0 0 Preston Urban Area 0 0 0 0 Glasgow Urban Area 0 0 0 0 Edinburgh Urban Area 0 0 0 0 Cardiff Urban Area 0 0 0 0 Swansea Urban Area 0 0 0 0 Belfast Metropolitan Urban Area 0 0 0 0 Eastern 0 0 0 0 South West 0 0 0 0 South East 0 0 0 0 East Midlands 0 0 0 0 North West & Merseyside 0 0 0 0 Yorkshire & Humberside 0 0 0 0 West Midlands 0 0 0 0 North East 0 0 0 0 Central Scotland 0 0 0 0 North East Scotland 0 0 0 0 Highland 0 0 0 0 Scottish Borders 0 0 0 0 South Wales 0 2 0 0

Assessment of the effectiveness of measures under the Clean Air Act 1993
Ref: AEA/ED46626/3289/Issue 1 80
2020 scenario 7a7e+nondom7f Basecase Scenario Basecase Scenario
>20 ugm-3 >20 ugm-3 >25 ugm-3 >25 ugm-3
Zagglom backgr_km2 backgr_km2 backgr_km2 backgr_km2 North Wales 0 0 0 0 Northern Ireland 0 0 0 0
London 0 0 0 0 Rest of England 0 0 0 0 Scotland 0 0 0 0 Wales 0 2 0 0 Northern Ireland 0 0 0 0 Total 0 2 0 0
Total zones exceeding 0 1 0 0
Table A3.11 Population-weighted mean concentrations for PM2.5 (µg/m3)
basecase scenario
Scotland 7.51 7.71 Wales 7.97 8.15 Northern Ireland 7.13 8.11 Inner London 13.02 13.64 Outer London 11.65 12.06 Rest of England 9.45 9.66 UK 9.47 9.74
Figure A3.6 Impacts on PM2.5 AQ concentration Baseline Scenario

Assessment of the effectiveness of measures under the Clean Air Act 1993
Ref: AEA/ED46626/3289/Issue 1 81
Table A3.12 PM10 outputs 2020 scenario 7a7e+nondom7f Basecase Scenario Basecase Scenario
>31.5 ugm-3 >31.5 ugm-3 >40 ugm-3 >40 ugm-3
Zagglom backgr_km2 backgr_km2 backgr_km2 backgr_km2 Greater London Urban Area 0 0 0 0 West Midlands Urban Area 0 0 0 0 Greater Manchester Urban Area 0 0 0 0 West Yorkshire Urban Area 0 0 0 0 Tyneside 0 0 0 0 Liverpool Urban Area 0 0 0 0 Sheffield Urban Area 0 0 0 0 Nottingham Urban Area 0 0 0 0 Bristol Urban Area 0 0 0 0 Brighton/Worthing/Littlehampton 0 0 0 0 Leicester Urban Area 0 0 0 0 Portsmouth Urban Area 0 0 0 0 Teesside Urban Area 0 1 0 0 The Potteries 0 0 0 0 Bournemouth Urban Area 0 0 0 0 Reading/Wokingham Urban Area 0 0 0 0 Coventry/Bedworth 0 0 0 0 Kingston upon Hull 0 0 0 0 Southampton Urban Area 0 0 0 0 Birkenhead Urban Area 0 0 0 0 Southend Urban Area 0 0 0 0 Blackpool Urban Area 0 0 0 0 Preston Urban Area 0 0 0 0 Glasgow Urban Area 0 0 0 0 Edinburgh Urban Area 0 0 0 0 Cardiff Urban Area 0 0 0 0 Swansea Urban Area 0 0 0 0 Belfast Metropolitan Urban Area 0 1 0 0 Eastern 0 0 0 0 South West 0 0 0 0 South East 0 0 0 0 East Midlands 0 0 0 0 North West & Merseyside 0 0 0 0 Yorkshire & Humberside 0 1 0 0 West Midlands 0 0 0 0 North East 0 0 0 0 Central Scotland 0 0 0 0 North East Scotland 0 0 0 0 Highland 0 0 0 0 Scottish Borders 0 0 0 0 South Wales 0 2 0 2 North Wales 0 0 0 0 Northern Ireland 0 0 0 0
London 0 0 0 0 Rest of England 0 2 0 0 Scotland 0 0 0 0 Wales 0 2 0 2
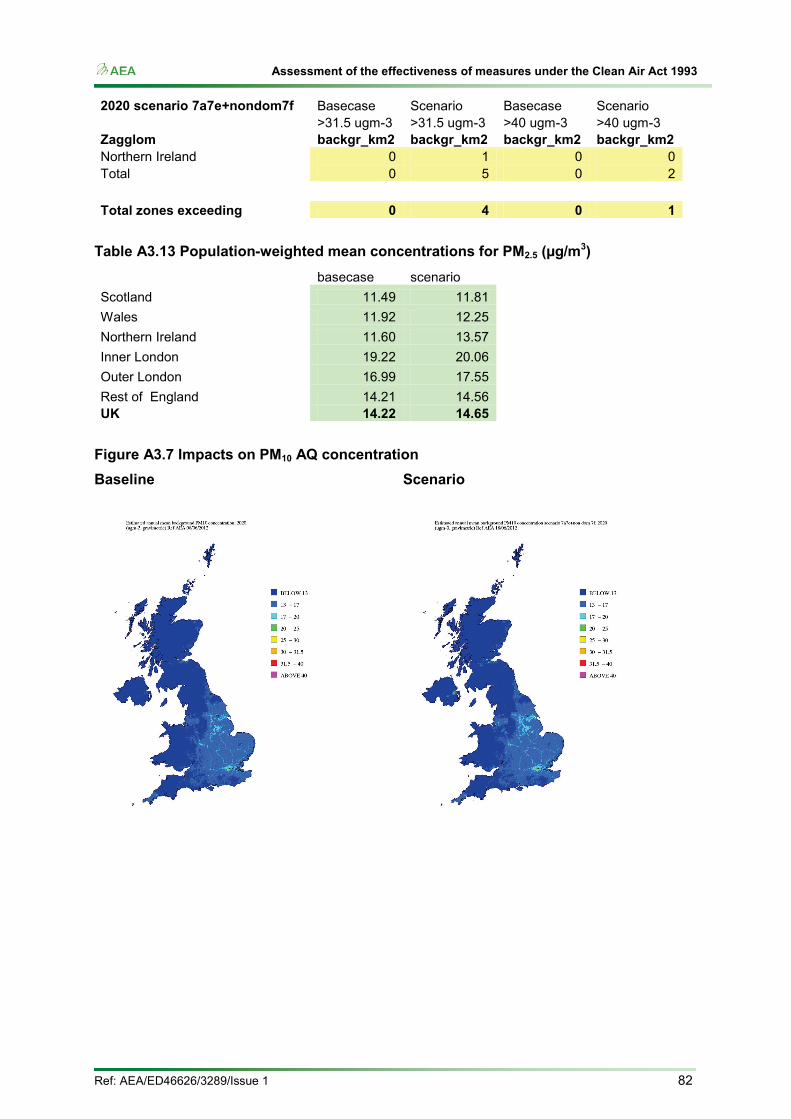
Assessment of the effectiveness of measures under the Clean Air Act 1993
Ref: AEA/ED46626/3289/Issue 1 82
2020 scenario 7a7e+nondom7f Basecase Scenario Basecase Scenario
>31.5 ugm-3 >31.5 ugm-3 >40 ugm-3 >40 ugm-3
Zagglom backgr_km2 backgr_km2 backgr_km2 backgr_km2 Northern Ireland 0 1 0 0 Total 0 5 0 2
Total zones exceeding 0 4 0 1
Table A3.13 Population-weighted mean concentrations for PM2.5 (µg/m3)
basecase scenario
Scotland 11.49 11.81 Wales 11.92 12.25 Northern Ireland 11.60 13.57 Inner London 19.22 20.06 Outer London 16.99 17.55 Rest of England 14.21 14.56 UK 14.22 14.65
Figure A3.7 Impacts on PM10 AQ concentration Baseline Scenario

Assessment of the effectiveness of measures under the Clean Air Act 1993
Ref: AEA/ED46626/3289/Issue 1 83
Table A3.14 Population-weighted mean concentrations for NO2 (µg/m3)
Basecase Scenario
Scotland 8.96 8.97 Wales 10.01 10.01 Northern Ireland 6.27 6.21 Inner London 26.51 26.64 Outer London 19.47 19.55 Rest of England 13.02 13.03 UK 13.41 13.44
Figure A3.8 Impacts on NO2 AQ concentration Baseline Scenario

Assessment of the effectiveness of measures under the Clean Air Act 1993
Ref: AEA/ED46626/3289/Issue 1 84
A3.3 Low PM emission scenario outputs
Table A3.15 Benzo(a)pyrene outputs
2020 scenario 11+3b Basecase Scenario
>1.0 ngm-3 >1.0 ngm-3
Zagglom backgr_km2 backgr_km2 Greater London Urban Area 0 0 West Midlands Urban Area 0 0 Greater Manchester Urban Area 0 0 West Yorkshire Urban Area 0 0 Tyneside 0 0 Liverpool Urban Area 0 0 Sheffield Urban Area 0 0 Nottingham Urban Area 0 0 Bristol Urban Area 0 0 Brighton/Worthing/Littlehampton 0 0 Leicester Urban Area 0 0 Portsmouth Urban Area 0 0 Teesside Urban Area 2 2 The Potteries 0 0 Bournemouth Urban Area 0 0 Reading/Wokingham Urban Area 0 0 Coventry/Bedworth 0 0 Kingston upon Hull 0 0 Southampton Urban Area 0 0 Birkenhead Urban Area 0 0 Southend Urban Area 0 0 Blackpool Urban Area 0 0 Preston Urban Area 0 0 Glasgow Urban Area 0 0 Edinburgh Urban Area 0 0 Cardiff Urban Area 0 0 Swansea Urban Area 0 0 Belfast Metropolitan Urban Area 130 109 Eastern 0 0 South West 0 0 South East 0 0 East Midlands 0 0 North West & Merseyside 2 1 Yorkshire & Humberside 9 4 West Midlands 2 0 North East 5 2 Central Scotland 0 0 North East Scotland 0 0 Highland 1 0

Assessment of the effectiveness of measures under the Clean Air Act 1993
Ref: AEA/ED46626/3289/Issue 1 85
2020 scenario 11+3b Basecase Scenario
>1.0 ngm-3 >1.0 ngm-3
Zagglom backgr_km2 backgr_km2 Scottish Borders 0 0 South Wales 32 12 North Wales 4 1 Northern Ireland 270 185
London 0 0 Rest of England 20 9 Scotland 1 0 Wales 36 13 Northern Ireland 400 294 Total 457 316 Total zones exceeding 10 8
Table A3.16 Population-weighted mean concentrations for Benzo(a)pyrene (ng/m3)
Basecase Scenario
Scotland 0.18 0.17 Wales 0.30 0.26 Northern Ireland 1.07 0.94 Inner London 0.28 0.28 Outer London 0.21 0.21 Rest of England 0.20 0.19 UK 0.23 0.22

Assessment of the effectiveness of measures under the Clean Air Act 1993
Ref: AEA/ED46626/3289/Issue 1 86
Figure A3.9 Impacts on BaP AQ concentration Baseline Scenario
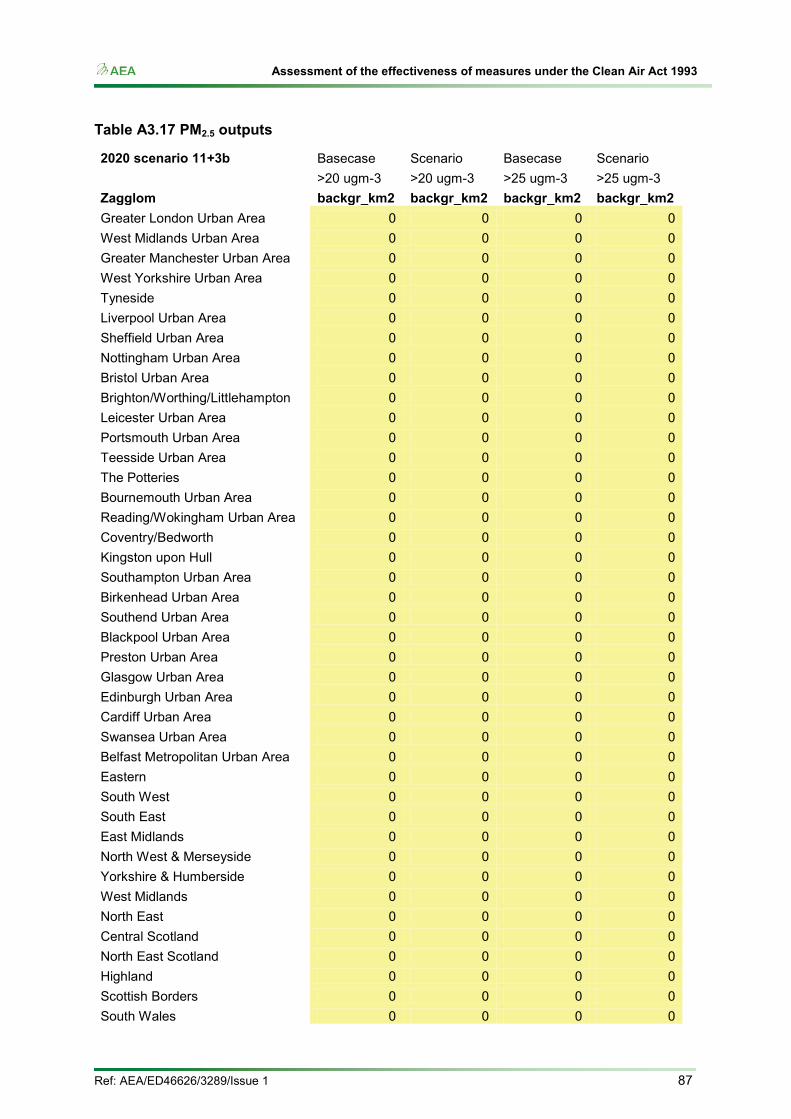
Assessment of the effectiveness of measures under the Clean Air Act 1993
Ref: AEA/ED46626/3289/Issue 1 87
Table A3.17 PM2.5 outputs
2020 scenario 11+3b Basecase Scenario Basecase Scenario
>20 ugm-3 >20 ugm-3 >25 ugm-3 >25 ugm-3
Zagglom backgr_km2 backgr_km2 backgr_km2 backgr_km2 Greater London Urban Area 0 0 0 0 West Midlands Urban Area 0 0 0 0 Greater Manchester Urban Area 0 0 0 0 West Yorkshire Urban Area 0 0 0 0 Tyneside 0 0 0 0 Liverpool Urban Area 0 0 0 0 Sheffield Urban Area 0 0 0 0 Nottingham Urban Area 0 0 0 0 Bristol Urban Area 0 0 0 0 Brighton/Worthing/Littlehampton 0 0 0 0 Leicester Urban Area 0 0 0 0 Portsmouth Urban Area 0 0 0 0 Teesside Urban Area 0 0 0 0 The Potteries 0 0 0 0 Bournemouth Urban Area 0 0 0 0 Reading/Wokingham Urban Area 0 0 0 0 Coventry/Bedworth 0 0 0 0 Kingston upon Hull 0 0 0 0 Southampton Urban Area 0 0 0 0 Birkenhead Urban Area 0 0 0 0 Southend Urban Area 0 0 0 0 Blackpool Urban Area 0 0 0 0 Preston Urban Area 0 0 0 0 Glasgow Urban Area 0 0 0 0 Edinburgh Urban Area 0 0 0 0 Cardiff Urban Area 0 0 0 0 Swansea Urban Area 0 0 0 0 Belfast Metropolitan Urban Area 0 0 0 0 Eastern 0 0 0 0 South West 0 0 0 0 South East 0 0 0 0 East Midlands 0 0 0 0 North West & Merseyside 0 0 0 0 Yorkshire & Humberside 0 0 0 0 West Midlands 0 0 0 0 North East 0 0 0 0 Central Scotland 0 0 0 0 North East Scotland 0 0 0 0 Highland 0 0 0 0 Scottish Borders 0 0 0 0 South Wales 0 0 0 0

Assessment of the effectiveness of measures under the Clean Air Act 1993
Ref: AEA/ED46626/3289/Issue 1 88
2020 scenario 11+3b Basecase Scenario Basecase Scenario
>20 ugm-3 >20 ugm-3 >25 ugm-3 >25 ugm-3
Zagglom backgr_km2 backgr_km2 backgr_km2 backgr_km2 North Wales 0 0 0 0 Northern Ireland 0 0 0 0
London 0 0 0 0 Rest of England 0 0 0 0 Scotland 0 0 0 0 Wales 0 0 0 0 Northern Ireland 0 0 0 0 Total 0 0 0 0
Total zones exceeding 0 0 0 0
Table A3.18 Population-weighted mean concentrations for PM2.5 (µg/m3)
basecase scenario
Scotland 7.51 7.49 Wales 7.97 7.91 Northern Ireland 7.13 7.06 Inner London 13.02 13.01 Outer London 11.65 11.64 Rest of England 9.45 9.42 UK 9.47 9.44
Figure A3.10 Impacts on PM2.5 AQ concentration Baseline Scenario

Assessment of the effectiveness of measures under the Clean Air Act 1993
Ref: AEA/ED46626/3289/Issue 1 89
Table A3.19 PM10 outputs 2020 scenario 11+3b Basecase Scenario Basecase Scenario
>31.5 ugm-3 >31.5 ugm-3 >40 ugm-3 >40 ugm-3
Zagglom backgr_km2 backgr_km2 backgr_km2 backgr_km2 Greater London Urban Area 0 0 0 0 West Midlands Urban Area 0 0 0 0 Greater Manchester Urban Area 0 0 0 0 West Yorkshire Urban Area 0 0 0 0 Tyneside 0 0 0 0 Liverpool Urban Area 0 0 0 0 Sheffield Urban Area 0 0 0 0 Nottingham Urban Area 0 0 0 0 Bristol Urban Area 0 0 0 0 Brighton/Worthing/Littlehampton 0 0 0 0 Leicester Urban Area 0 0 0 0 Portsmouth Urban Area 0 0 0 0 Teesside Urban Area 0 0 0 0 The Potteries 0 0 0 0 Bournemouth Urban Area 0 0 0 0 Reading/Wokingham Urban Area 0 0 0 0 Coventry/Bedworth 0 0 0 0 Kingston upon Hull 0 0 0 0 Southampton Urban Area 0 0 0 0 Birkenhead Urban Area 0 0 0 0 Southend Urban Area 0 0 0 0 Blackpool Urban Area 0 0 0 0 Preston Urban Area 0 0 0 0 Glasgow Urban Area 0 0 0 0 Edinburgh Urban Area 0 0 0 0 Cardiff Urban Area 0 0 0 0 Swansea Urban Area 0 0 0 0 Belfast Metropolitan Urban Area 0 0 0 0 Eastern 0 0 0 0 South West 0 0 0 0 South East 0 0 0 0 East Midlands 0 0 0 0 North West & Merseyside 0 0 0 0 Yorkshire & Humberside 0 0 0 0 West Midlands 0 0 0 0 North East 0 0 0 0 Central Scotland 0 0 0 0 North East Scotland 0 0 0 0 Highland 0 0 0 0 Scottish Borders 0 0 0 0 South Wales 0 0 0 0 North Wales 0 0 0 0 Northern Ireland 0 0 0 0
London 0 0 0 0 Rest of England 0 0 0 0

Assessment of the effectiveness of measures under the Clean Air Act 1993
Ref: AEA/ED46626/3289/Issue 1 90
2020 scenario 11+3b Basecase Scenario Basecase Scenario
>31.5 ugm-3 >31.5 ugm-3 >40 ugm-3 >40 ugm-3
Zagglom backgr_km2 backgr_km2 backgr_km2 backgr_km2 Scotland 0 0 0 0 Wales 0 0 0 0 Northern Ireland 0 0 0 0 Total 0 0 0 0
Total zones exceeding 0 0 0 0
Table A3.20 Population-weighted mean concentrations for PM10 (µg/m3)
basecase scenario
Scotland 11.49 11.46 Wales 11.92 11.84 Northern Ireland 11.60 11.50 Inner London 19.22 19.21 Outer London 16.99 16.98 Rest of England 14.21 14.17 UK 14.22 14.18
Figure A3.11 Impacts on PM10 AQ concentration Baseline Scenario

Assessment of the effectiveness of measures under the Clean Air Act 1993
Ref: AEA/ED46626/3289/Issue 1 91
Appendix 4 – Chimney height nomographs The discharge stack was assumed to be located at the centre of a 10 m cubical building. Table 3.1 lists the model runs and input values for each set of nomographs. Table 3.2 shows both the actual stack height above ground, C and the effective stack height, U:
for C<2.5H; otherwise U=C, where: H is the building height.
Table A4.1: Actual and effective stack height modelling
Run Stack height, m Effective stack height, m
Stack diameter, m
A1_1 10.6 1 0.1 A2_1 11.2 2 0.1 A5_1 13 5 0.1
A10_1 16 10 0.1 A20_1 22 20 0.1 A40_1 40 40 0.1 A1_2 10.6 1 0.2 A2_2 11.2 2 0.2 A5_2 13 5 0.2
A10_2 16 10 0.2 A20_2 22 20 0.2 A40_2 40 40 0.2 A1_5 10.6 1 0.5 A2_5 11.2 2 0.5 A5_5 13 5 0.5
A10_5 16 10 0.5 A20_5 22 20 0.5 A40_5 40 40 0.5 A1_10 10.6 1 1 A2_10 11.2 2 1 A5_10 13 5 1 A10_10 16 10 1 A20_10 22 20 1 A40_10 40 40 1
The model was run with hourly sequential meteorological data for Heathrow Airport, 2006 with surface roughness 1 m locally and 0.1 m at the airport. The model was run with receptor locations on a 1 km square grid centred on the stack at 10 m intervals. Maximum annual mean, 90th percentile 24-hour mean, 99.8th percentile hourly mean and 99.9th percentile 15 minute mean concentrations were calculated. Cubic polynomial curves were fitted through the modelled data of the form:
dcxbxaxy +++= 23
where: x is log10(U); and y=-log10(Cmax).
Table A4.2: Shows the values of the constants a, b, c and d
)(66.1 HCU −=

Assessment of the effectiveness of measures under the Clean Air Act 1993
Ref: AEA/ED46626/3289/Issue 1 92
Table A4.2: Values of the constants a, b, c and d
Boiler type Statistic Stack
diameter, m
a b c d
Range of effective
stack heights,
m
Biomass boilers
90th percentile of 24 hour means
0.1 0.373 0.1922 0.2193 -3.2269 1-40 0.2 0.3418 0.2323 0.2104 -3.158 1-40 0.5 0.3442 0.1309 0.3063 -2.9656 2-40 1 0.221 0.3501 0.2056 -2.7288 5-40
Annual mean
0.1 0.4990 -0.1051 0.4351 -2.8062 1-40 0.2 0.4920 -0.1211 0.4478 -2.7296 1-40
0.5 0.4790 -0.1904 0.5228 -2.5349 2-40 1 0.2923 0.1984 0.2894 -2.2548 5-40
99.8th percentile of hourly means
0.1 -0.2570 1.4398 -0.3227 -3.896 1-40 0.2 -0.2412 1.2842 -0.1655 -3.7481 1-40 0.5 -0.9642 3.3411 -1.9382 -3.0675 2-40 1 -1.6681 5.8307 -4.6034 -2.0738 5-40
Industrial stacks
90th percentile of 24 hour means
0.1 0.6814 -1.0405 1.1865 -2.8443 1-40 0.2 0.7133 -1.1071 1.1616 -2.6955 1-40 0.5 0.7395 -1.1537 1.0904 -2.4208 1-40 1 0.5616 -0.7736 0.8952 -2.2129 1-40
Annual mean
0.1 0.7704 -1.186 1.2644 -2.4096 1-40 0.2 0.7998 -1.2492 1.2379 -2.2543 1-40
0.5 0.7369 -1.1165 1.0787 -1.9522 1-40 1 0.553 -0.7546 0.8228 -1.7309 1-40
99.8th percentile of hourly means
0.1 0.3451 -0.3309 0.5301 -3.0958 1-40 0.2 0.3311 -0.5014 0.6757 -2.9167 1-40 0.5 0.406 -0.6615 0.7801 -2.6002 2-40 1 0.0966 0.0355 0.505 -2.4685 5-40
99.9th percentile of 15 minute means
0.1 0.3221 -0.2282 0.3828 -3.1125 1-40 0.2 0.3013 -0.3256 0.5183 -2.9246 1-40 0.5 0.3279 -0.5226 0.6901 -2.6033 1-40 1 -0.118 0.4903 0.3028 -2.4925 1-40
Condensing boilers
90th percentile of 24 hour means
0.1 0.5807 -0.7771 1.1474 -3.0954 1-40 0.2 0.5848 -0.8194 1.1732 -3.023 1-40
0.5 0.5271 -0.7043 1.1124 -2.9279 1-40 1 0.265 0.0057 0.6105 -2.7995 1-40
Annual mean
0.1 0.6277 -0.8717 1.2435 -2.6667 1-40 0.2 0.6267 -0.8644 1.2046 -2.5888 1-40 0.5 0.5782 -0.7542 1.1225 -2.4724 1-40 1 0.4035 -0.336 0.8624 -2.3553 1-40
99.8th percentile of hourly means
0.1 0.2504 -0.0116 0.3971 -3.3982 1-40 0.2 0.2479 -0.0598 0.4429 -3.2904 1-40 0.5 0.2332 -0.1985 0.6236 -3.0791 1-40 1 -0.1109 0.6721 0.1164 -2.9455 1-40

Assessment of the effectiveness of measures under the Clean Air Act 1993
Ref: AEA/ED46626/3289/Issue 1 93
Figures A4.1-3 show nomographs based on the polynomial curve fits. Figs A4.1 andA4.2 show the emission rates that correspond to an increase in maximum ground level 90th percentile and annual mean concentrations of 1 µg m-3. Fig. A4.3 shows the emission rate that corresponds to an increase in the 99.8th percentile oxides of nitrogen concentration of 40 µg m-3
Figure A4.1: Maximum 90th percentile 24 hour mean ground level concentration for 1 g/s emission rate-biomass boiler
Figure A4.2: Maximum annual mean ground level concentration for 1 g/s emission rate-biomass boiler

Assessment of the effectiveness of measures under the Clean Air Act 1993
Ref: AEA/ED46626/3289/Issue 1 94
Figure A4.3: Maximum 99.8h percentile 1 hour mean ground level concentration for 1 g/s emission rate-biomass boiler

Assessment of the effectiveness of measures under the Clean Air Act 1993
Ref: AEA/ED46626/3289/Issue 1 95
Figure A4.4: Maximum 90th percentile 24 hour mean ground level concentration for 1 g/s emission rate-industrial boiler
Figure A4.5: Maximum annual mean ground level concentration for 1 g/s emission rate-industrial boiler

Assessment of the effectiveness of measures under the Clean Air Act 1993
Ref: AEA/ED46626/3289/Issue 1 96
Figure A4.6: Maximum 99.8h percentile 1 hour mean ground level concentration for 1 g/s emission rate-industrial boiler
Figure A4.7: Maximum 99.9h percentile 15 minute mean ground level concentration for 1 g/s emission rate-industrial boiler

Assessment of the effectiveness of measures under the Clean Air Act 1993
Ref: AEA/ED46626/3289/Issue 1 97
Figure A4.8: Maximum 90th percentile 24 hour mean ground level concentration for 1 g/s emission rate-condensing boiler
Figure A4.9: Maximum annual mean ground level concentration for 1 g/s emission rate-condensing boiler
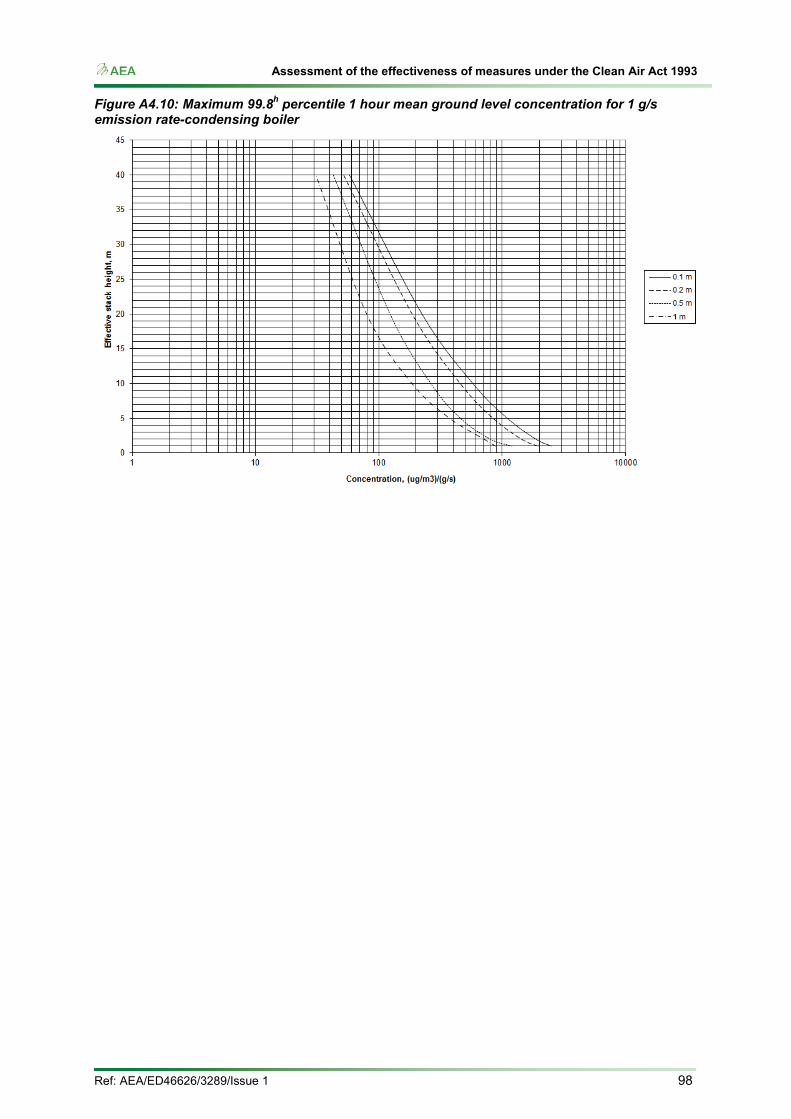
Assessment of the effectiveness of measures under the Clean Air Act 1993
Ref: AEA/ED46626/3289/Issue 1 98
Figure A4.10: Maximum 99.8h percentile 1 hour mean ground level concentration for 1 g/s emission rate-condensing boiler

The Gemini Building Fermi Avenue Harwell Didcot Oxfordshire OX11 0QR
Tel: 0870 190 1900 Fax: 0870 190 6318
www.aeat.co.uk