Effectiveness of mitigation measures to ... - fish.wa.gov.au · Effectiveness of mitigation...
120
Effectiveness of mitigation measures to reduce interactions between commercial fishing gear and whales FRDC Project No 2013/037 J. How, D. Coughran, J. Smith, M. Double, J. Harrison, J. McMath, B. Hebiton, A. Denham Fisheries Research Report No. 267, 2015 Fisheries Research Division Western Australian Fisheries and Marine Research Laboratories PO Box 20 NORTH BEACH, Western Australia 6920 3445/15
Transcript of Effectiveness of mitigation measures to ... - fish.wa.gov.au · Effectiveness of mitigation...
Effectiveness of mitigation measures to reduce interactions between
commercial fishing gear and whales
FRDC Project No 2013/037J. How, D. Coughran, J. Smith, M. Double, J. Harrison,
J. McMath, B. Hebiton, A. Denham
Fisheries Research Report No. 267, 2015
Fisheries Research Division Western Australian Fisheries and Marine Research Laboratories PO Box 20 NORTH BEACH, Western Australia 6920
3445/15

ii Fisheries Research Report [Western Australia] No. 267, 2015
Correct citation:
How, J., Coughran, D., Smith, J., Double, M., Harrison, J., McMath, J., Hebiton, B., A Denham, A. 2015. Effectiveness of mitigation measures to reduce interactions between commercial fishing gear and whales. FRDC Project No 2013/03. Fisheries Research Report No. 267. Department of Fisheries, Western Australia. 120pp.
In submitting this report, the researcher has agreed to FRDC publishing this material in its edited form.
Ownership of Intellectual property rights
Unless otherwise noted, copyright (and any other intellectual property rights, if any) in this publication is owned by the Fisheries Research and Development Corporation, Department of Fisheries (WA), Department of Parks and Wildlife (WA), Murdoch University – Cetacean Research Unit, Australian Antarctic Division, Western Rock Lobster Council and West Australian Fishing Industry Coucil
This publication (and any information sourced from it) should be attributed to How, J., Coughran, D., Smith, J., Double, M., Harrison, J., McMath, J., Hebiton, B., Denham, A. (2015) Effectiveness of mitigation measures to reduce interactions between commercial fishing gear and whales. FRDC Final Report 2013/037. Department of Fisheries Western Australia, Perth. 120pp.
Creative Commons licence
All material in this publication is licensed under a Creative Commons Attribution 3.0 Australia Licence, save for content supplied by third parties, logos and the Commonwealth Coat of Arms.
Creative Commons Attribution 3.0 Australia Licence is a standard form licence agreement that allows you to copy, distribute, transmit and adapt this publication provided you attribute the work. A summary of the licence terms is available from creativecommons.org/licenses/by/3.0/au/deed.en. The full licence terms are available from creativecommons.org/licenses/by/3.0/au/legalcode.
Inquiries regarding the licence and any use of this document should be sent to: [email protected].
Disclaimer
The authors do not warrant that the information in this document is free from errors or omissions. The authors do not accept any form of liability, be it contractual, tortious, or otherwise, for the contents of this document or for any consequences arising from its use or any reliance placed upon it. The information, opinions and advice contained in this document may not relate, or be relevant, to a readers particular circumstances. Opinions expressed by the authors are the individual opinions expressed by those persons and are not necessarily those of the publisher, research provider or the FRDC.
The Fisheries Research and Development Corporation plans, invests in and manages fisheries research and development throughout Australia. It is a statutory authority within the portfolio of the federal Minister for Agriculture, Fisheries and Forestry, jointly funded by the Australian Government and the fishing industry.
© Fisheries Research and Development Corporation and Department of Fisheries, Western Australia. August 2015. All rights reserved. ISSN: 1035 - 4549 ISBN: 978-1-921845-92-5
Researcher Contact Details
Name: Jason How
Address: Western Australian Fisheries and Marine Research Laboratories, PO Box 20 North Beach WA 6920
Phone: 08 92030111
Fax: 08 92030199
Email: [email protected]
FRDC Contact Details
Address: 25 Geils Court
Deakin ACT 2600
Phone: 02 6285 0400
Fax: 02 6285 0499
Email: [email protected]
Web: www.frdc.com.au

Fisheries Research Report [Western Australia] No. 267, 2015 iii
Contents
Acknowledgments ................................................................................................................ 1
Executive Summary ............................................................................................................ 2
1.0 Introduction .................................................................................................................. 51.1 Western Rock Lobster Fishery ............................................................................... 51.2 Developmental Octopus Fishery ............................................................................ 81.3 Humpback Whales .................................................................................................. 101.4 Whale Entanglements ............................................................................................ 10
2.0 Objectives ...................................................................................................................... 12
3.0 Methods ........................................................................................................................ 133.1 Spatial and temporal overlap of migrating whales and fishing gear ...................... 13
3.1.1 Existing information ................................................................................... 133.1.2 Additional data collection ........................................................................... 153.1.3 Commercial Fishing Data ............................................................................ 183.1.4 Preliminary spatial analysis ........................................................................ 19
3.2 Fishing gear modifications ..................................................................................... 223.2.1 Mitigation options identified in industry workshop .................................... 223.2.2 Pilot trials of gear modifications ................................................................ 233.2.3 Preliminary assessment of acoustic pingers ................................................ 253.2.4 Examination of retrieved ropes from dis-entangled whales ....................... 28
4.0 Results .......................................................................................................................... 304.1 Spatial and temporal overlap of migrating whales and fishing gear ...................... 30
4.1.1 Existing information .................................................................................... 304.1.2 Initiate collection of additional spatial and temporal information through
a whale sighting logbook and ‘app’ ............................................................ 424.1.3 Commercial Fishing Data ............................................................................ 444.1.4 Preliminary spatial analysis of all available data ....................................... 52
4.2 Examine the effectiveness of potential gear modifications to the float rigs of fishing pots/traps to reduce their likelihood of entangling whales ........................ 564.2.1 Mitigation options identified during an industry run workshop ................. 564.2.2 Pilot trials of gear modifications that may mitigate entanglements with whales . 594.2.3 Preliminary assessment of acoustic pingers as a by-catch mitigation option
for humpback whales in trap fisheries ........................................................ 624.2.4 Detailed examination of retrieved ropes from dis-entangled whales ......... 68
5.0 Discussion ...................................................................................................................... 735.1 Humpback Whale Migration .................................................................................. 735.2 Increase in whale entanglements ............................................................................ 73
6.0 Conclusion ..................................................................................................................... 85
7.0 Implications .................................................................................................................. 86
FRDC Contact Details
Address: 25 Geils Court
Deakin ACT 2600
Phone: 02 6285 0400
Fax: 02 6285 0499
Email: [email protected]
Web: www.frdc.com.au

iv Fisheries Research Report [Western Australia] No. 267, 2015
8.0 Recommendations ........................................................................................................ 878.1 Further development .............................................................................................. 87
9.0 Extension and Adoption ............................................................................................... 909.1 Project coverage ...................................................................................................... 90
10.0 Project materials developed ........................................................................................ 91
11.0 References ..................................................................................................................... 92
Appendices ............................................................................................................................ 94Appendix 1 .................................................................................................................... 94Appendix 2 ..................................................................................................................... 95Appendix 3 ..................................................................................................................... 96Appendix 4 ..................................................................................................................... 97Appendix 5 ..................................................................................................................... 98Appendix 6 ..................................................................................................................... 101Appendix 7 ..................................................................................................................... 103Appendix 8 ..................................................................................................................... 107Appendix 9 ..................................................................................................................... 108Appendix 10 ................................................................................................................... 110
List of Tables
Table 1 Changes to the management arrangements for the west coast rock lobster managed fishery that may have impacted on the rate of whale entanglements. Maximum pot usage is defined as a percentage of the initial fixed pot usage number (68 961) ............................................................................................... 7
Table 2 Source, owner and details of additional published and unpublished data on the spatial distribution of humpback whales off Western Australia. ............. 15
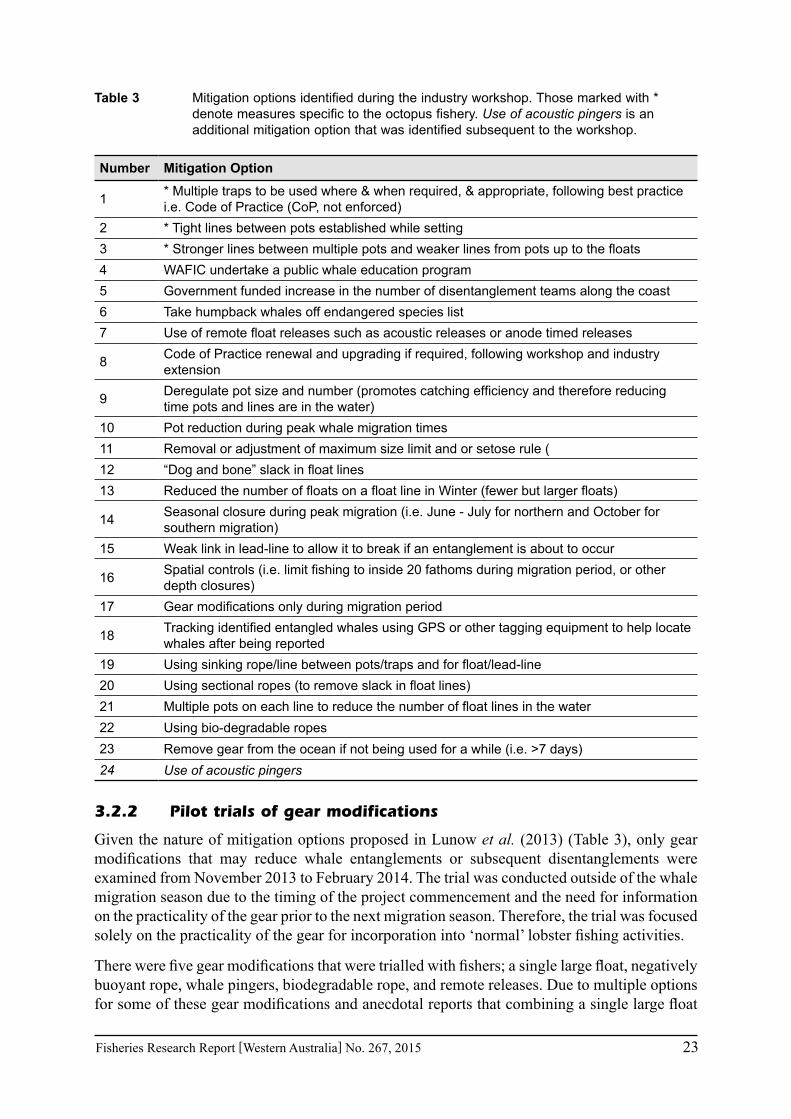
Table 3 Mitigation options identified during the industry workshop. Those marked with * denote measures specific to the octopus fishery. Use of acoustic pingers is an additional mitigation option that was identified subsequent to the workshop. ............................................................................................. 23
Table 4 Specifications of modified gear rigs .............................................................. 24
Table 5 Actual distance between vertical lines deployed in the pinger array ............ 26
Table 6 Mean difference between the actual and estimated distance using theodolite to fixed known location .................................................................................. 27
Table 7 Categorisation of entanglements by gear type and year ................................ 31
Table 8 Details of the usage (number of fishers using the gear and number of pulls of the modified gear), damage (gear breakage or pot loss) and the impact on catch for the modified gear that was trialled ............................................ 60
Fisheries Research Report [Western Australia] No. 267, 2015 v
List of Plates
Plate 1 Two different types of weak links used in the Maine Lobster Fishery ......... 81
Plate 2 Colour marking (red) on the mainline of lobster gear signifying it was from the northern management areas of the fishery ............................................... 83
Plate 3 Float rig used in Cutler (NE Maine) showing the two buoy system used due to the strong current conditions. There is no floating line between the buoys . 84
Plate 4 Two images of ropes involved in humpback whale entanglements .............. 88
Table 9 Ranking (number) for the ease of using gear modifications trialled by the nine fishers who fished four or more of the seven gear modifications. Dark green was considered the best and grey the worst, with transition states being identified by light green to yellow. Only the gear modification is specified, with the rest of the rig being of a standard configuration (i.e. negatively buoyant rope refers to that rope being used with a standard float rig. ......... 60
Table 10 Cost of rigs with gear modifications on a per pot basis being fished 60 times over a six month period (an average of 3 day pulls). Modification costs in bold, with replacement cost necessary to ensure gear is functional for the following season. Prices are an approximate guide based on a standard rig configuration and will vary between fishers .................................................. 61
Table 11 Ranked cost and practicality of gear modifications trialled in the Western Rock Lobster Fishery and their subsequent final score as a cost-practical mitigation option for whale entanglements. Cost: 1 (most expensive) – 7 (cheapest); Practicality: 1 (most impractical) – 7 (practical) ..................... 61
Table 12 Reaction to the presence of the pinger array and the closest distance (m) a pod of whales came to a pinger and the number of whales in that pod, with the associated pinger status for that day’s recordings. .............................................. 63
Table 13 The number of rig components recorded from gear recovered from entangled whales and photographic records of entanglements ..................... 68
List of Figures
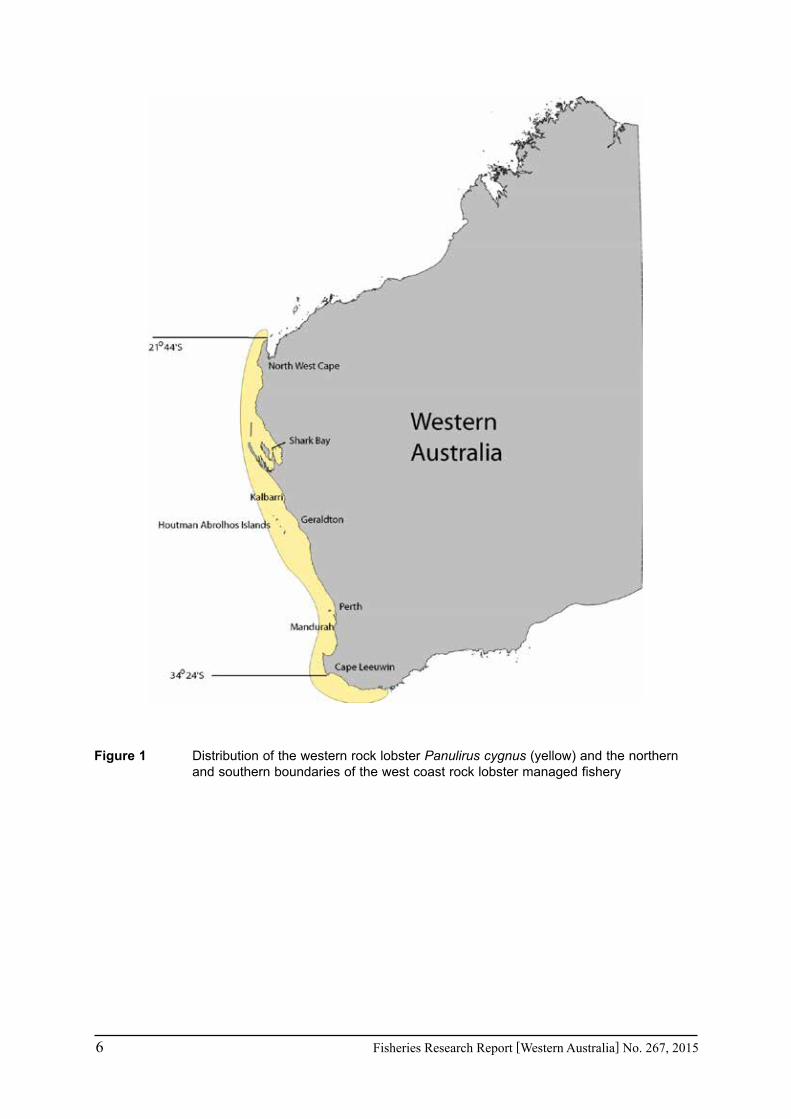
Figure 1 Distribution of the western rock lobster Panulirus cygnus and the northern and southern boundaries of the west coast rock lobster managed fishery ......... 6
Figure 2 Diagrammatic representation of the components of a western rock lobster fishing rig ......................................................................................................... 7
Figure 3 Management boundaries of the Octopus Fishery including A) the Cockburn Sound Pot and Line Managed Fishery, and B) and C) the Developing Octopus Fishery. .............................................................................................. 9
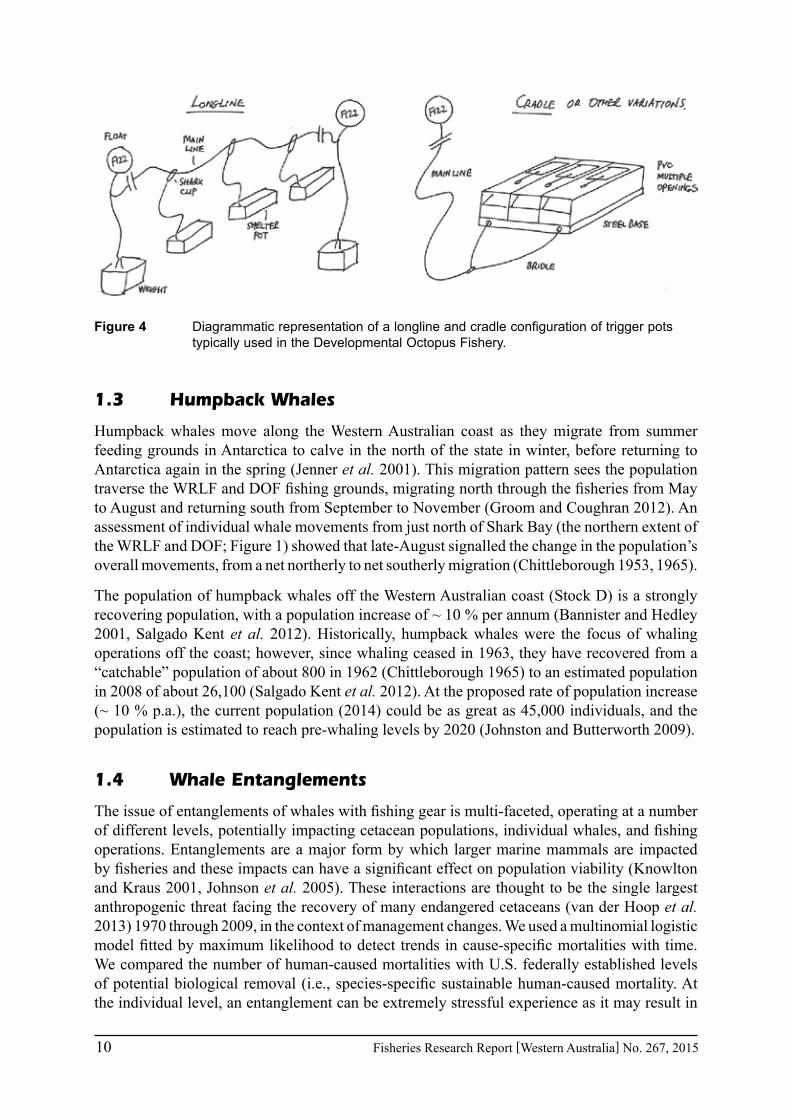
Figure 4 Diagrammatic representation of a longline and cradle configuration of trigger pots typically used in the Developmental Octopus Fishery. .............. 10
Figure 5 Nine regions where commercial whale watching sightings in Western Australia were grouped into off the Western Australian coastline ................ 14
vi Fisheries Research Report [Western Australia] No. 267, 2015
Figure 6 Screen flow of the ‘Whale Sighting WA’ app. Numbers refer to page links for areas requiring additional data. (1) to provide contact details, (2) species list to begin a sighting report, (3) link to main report page populated with chosen species, (3a) additional details on chosen species, and (4) dropdown list of behaviour attributes ........................................................................................ 17
Figure 7 Spatial distribution of data sources assessed for inclusion in predictive spatial habitat models ..................................................................................... 20
Figure 8 Location of pinger arrays (closed circle), and direction of sighted migrating whales (arrows) around Rottnest Island, Western Australia. ........................... 27
Figure 9 Timeline of entanglements of a) all entanglements by year and species and b) all entanglements in western rock lobster gear by year with those occurring during the traditional season (Nov-Jun; black) those outside of these months (Jul-Oct; grey), with dotted line indicating long-term average of whale entanglements in western rock lobster gear prior to 2011 .............. 33
Figure 10 Mean annual number of reported entanglements in WRL gear by month for a) 1982-2010 (from Groom and Coughran 2012); b) 2011; c) 2012 and d) 2013. . 34
Figure 11 Number (cumulative) of entanglement reports in western rock lobster gear for years where there were more than 5 entanglements during a whale migration season ... 35
Figure 12 Location of reported whale entanglements in WRLF gear (red circle), other fishing gear (black triangle) and non-fishing gear (green square); the spatial distribution of the Western Australian population (as per legend; data Australian Bureau of Statistics) and the areas fished by WRLF during the whale migration seasons of 2011–2013 (pink). ............................................. 37
Figure 13 Frequency of north (blue) or south (red) movement directions from reports of entangled whales by month. Dotted line represents the demarcation of the net northerly (up arrow) and net southerly (down arrow) migration of the humpback whale population off the Western Australian coast ...................... 38
Figure 14 Direction and distance of movements of entangled whales between likely entanglement and disentanglement locations (where the likely location of entanglement could be determined) during May – August (blue) and September – November (red). ........................................................................ 39
Figure 15 Likely location of the entanglement (red square) of a whale which was satellite tracked for five days with the track indicated by joined red dots before it was eventually disentangled. Red arrow indicates initial direction of travel from likely entanglement location (red square) to interception and attachment of satellite buoy ........................................................................... 40
Figure 16 a) Depth category (fathom) of entanglement where the likely depth of entanglement could be determined, and b) the entanglement rate standardised by number of pot days in each depth category for the last three seasons (2011-2013) ..................... 41
Figure 17 Numbers of whales (blue) and calves (black) sighted from commercial whale watching vessels for each week of the year for all years combined for the nine regions indicated from throughout WA .................................................. 42

Fisheries Research Report [Western Australia] No. 267, 2015 vii
Figure 18 (left) Modelling of whale abundances from commercial whale watching logbooks at four southern regions in Western Australia for years pre 2011(black), 2011 (red), 2012 (green) and 2013 (blue). (right) The timing of peak abundance and the latitude of whale watching operations for ), 2011 (red), 2012 (green) and 2013 (blue) ...................................................... 43
Figure 19 Whale sightings recorded through both the logbook and iPhone app ........... 44
Figure 20 Cumulative downloads of the ‘Whale Sighting WA’ app from the iTunes store (line) and the number of reports submitted (bars). .............................. 45
Figure 21 Timeline of a) effort (pot pulls) b) soak time (days between pot pulls) and c) rope days for the western rock lobster fishery during the whale migration period (May-November inclusive). Letters in part a refer to a-Closed season from 1 Jul – 14 Nov; b-pot reduction; c-pot reduction; d-phased effort reductions; e-competitive quota (full details see Table 1) ............................. 47
Figure 22 Entanglement rate (entanglements per 106 rope days) for the western rock lobster fishery reported during the whole whale migration period (May-November; filled circles) and during traditional fishing months (May, June and November; crosses) ................................................................................. 48
Figure 23 Timeline of rope days during the whale migration season by month for May (black), June (red) November (grey) and the additional months [July-October inclusive] (blue) combined ............................................................................. 48
Figure 24 Timeline of rope days during the whale migration season by month for May (black), June (red) November (grey) and the additional months (blue; July-October inclusive) combined for a) 10 fathoms or less, b) 11-20 fathoms, c) 21-30 fathoms, d) 31-40 fathoms and e) greater than 40 fathoms ............ 49
Figure 25 Spatial distribution of effort (rope days) for a) 2010, b) 2011 c) 2012 and d) 2013 during the whale migration period (May to November inclusive). Legend indicates the effort (rope days).......................................................... 50
Figure 26 Overall change from 2011 to 2013 in spatial distribution of effort (rope days) and likely location of entanglements (red star) .............................................. 51
Figure 27 Timeline of a) effort b) soak time (days between pot pulls) and c) potential (dotted line) and actual (dark line) rope days or for the developmental octopus fishery during the whale migration period (May-November inclusive) ........... 52
Figure 28 (top) Rope days (x 100) by year and latitude for the Developmental Octopus Fishery and the known locations of entanglements attributed to this fishery (red dots). (bottom) Depth distribution of rope days by year and 10 m depth categories ........................................................................................................ 53
Figure 29 Predictive spatial habitat model for humpback whales migrating north and south along the west coast of Western Australia ............................................ 55
Figure 30 Response curves (probability of occurrence) for environmental variable a) water depth, b) distance from the coast and c) distance (landward) from the 200 m contour ................................................................................................ 56

viii Fisheries Research Report [Western Australia] No. 267, 2015
Figure 31 Location of arrays (closed circles) to the north of Rottnest Island and the tracks (small circles and dashed line) of the initial whale pod that approached the array on 10 October (green), 25 October (red), 27 October (blue) and 30 October (pink and orange). ...................................................... 63
Figure 32 Tracks of whale pods through the array of active pingers (closed circles) with their recommended spacing (radius 25 m, light grey) and their ‘detection’ distance of 100 m (beige) for a) 2 October, b) 3 October, c) 10 October and d) 25 October 2013. Polygons represent detections which were recorded within one minute of a previous detection, with coloured closed circles the average position for the pod during that detection period. Triangles and thin arrows indicate position of whales that were observed but not tracked. ...... 65
Figure 33 Tracks of whale pods through the array of non-active pingers (open circles) with their recommended spacing (radius 25 m, light grey) and their ‘detection’ distance of 100 m (beige) for a) 27 October, b and c) 30 October. Polygons represent detections which were recorded within one minute of a previous detection, with coloured closed circles the average position for the pod during that detection period .................................................................... 66
Figure 34 Binomial proportions (with 95% Clopper-Pearson confidence intervals) of whale pods showing no change in direction due to pinger activity for a) all data and b) omitting whale pods that clearly passed around array. Total number of observations for active and inactive pingers is indicated. Mean proportion (with 95% credibility intervals) of whale pods showing no change in direction due to pinger activity using MCMC in WinBUGS for d) all data and e) omitting whale pods that clearly passed around array. Posterior distribution of difference in proportion obtained using MCMC in WinBUGS for e) all data and f) omitting whale pods that clearly passed around array. .......................... 68
Figure 35 Proportions of a) mainline and b) header rope diameter (8-14 mm) and rope type (PP- polypropylene and PE- polyethylene) for fisher surveys (light grey) and recovered from entanglements (dark grey). ............................................ 70
Figure 36 Proportion of rope colours surveyed (full colour) and identified from entanglements (hashed colour) for a) mainlines and b) header rigs .............. 72
Figure 37 Expected proportions of rope colours from fisher survey (full colour) and the observed proportion (black point) with Clopper Pearson confidence intervals for a) mainlines and b) header rigs identified from entanglements ............... 72
Figure 38 Proportions of header rigs from fisher surveys (light grey) and recovered from entanglements for a) number of floats and b) float configurations ...... 73
Figure 39 Diagrammatic representation of floating groundlines in the Maine Lobster Fishery and how they may serve to entangle humpback whales ................... 83

Fisheries Research Report [Western Australia] No. 267, 2015 1
Acknowledgments
The authors would like to thank the Fisheries Research and Development Corporation for their financial support of this project, as well as the following people for their invaluable support in completing this report;
• Matthew Kalajzich (Southern Bounty 4-F470), Travis Normington (Catalina IV-G069), Terry Mouchemore (Sahara-G300), Bruce Cockman (Night Stalker-D027), Jeff Cockman (Safari-F464), Darren McCagh (Marama-G397), Craig Chitty (Maitland-F199), Sam Koncurat (Glenley III-F620), James Waters (Sapphire-F466), Chris Williams (Crisendy II-F191), Bradley Testar (On A Mission-M051), Clinton Moss (Moby Dick II-F296), Marc Jurinovich (Seatips III-F097), Bart Gaurino (Tindari IV-F836)
• Curt and Micheline Jenner
• John Bannister
• Kristan Porter, David Cousins and Steve Train
• Patrice McCarron
• Michael Moore
2 Fisheries Research Report [Western Australia] No. 267, 2015
Executive Summary
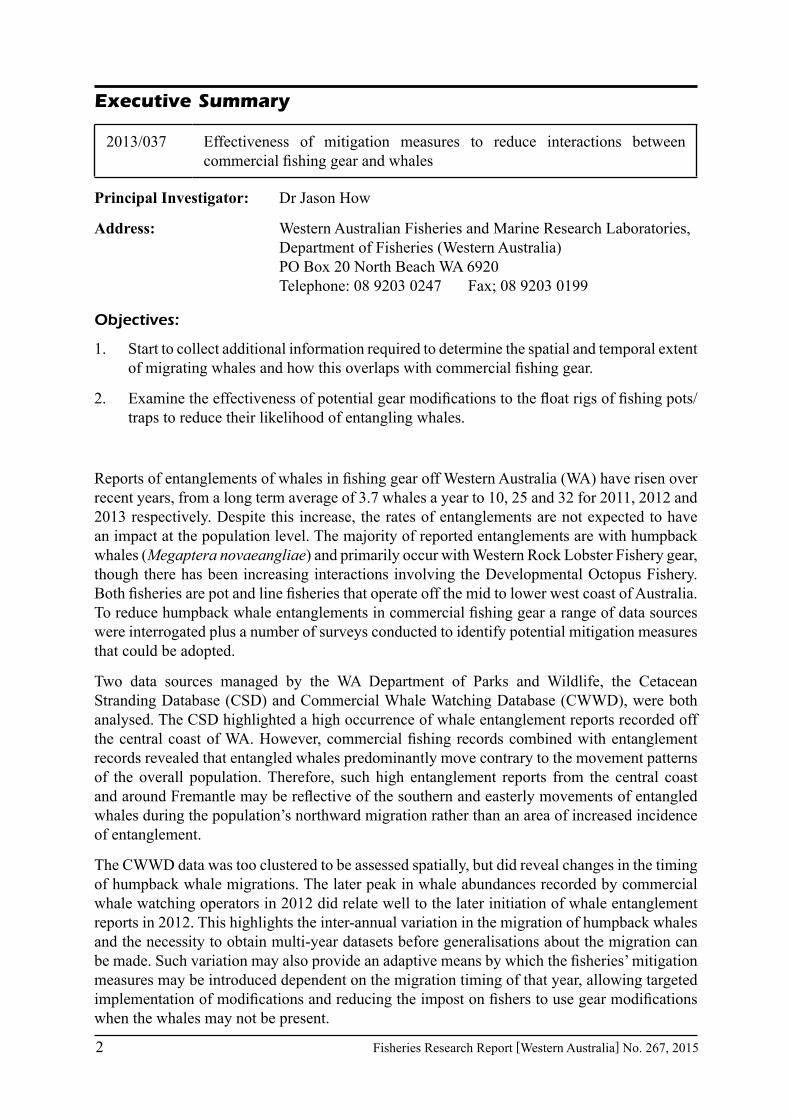
2013/037 Effectiveness of mitigation measures to reduce interactions between commercial fishing gear and whales
Principal Investigator: Dr Jason How
Address: Western Australian Fisheries and Marine Research Laboratories, Department of Fisheries (Western Australia) PO Box 20 North Beach WA 6920 Telephone: 08 9203 0247 Fax; 08 9203 0199
Objectives:
1. Start to collect additional information required to determine the spatial and temporal extent of migrating whales and how this overlaps with commercial fishing gear.
2. Examine the effectiveness of potential gear modifications to the float rigs of fishing pots/traps to reduce their likelihood of entangling whales.
Reports of entanglements of whales in fishing gear off Western Australia (WA) have risen over recent years, from a long term average of 3.7 whales a year to 10, 25 and 32 for 2011, 2012 and 2013 respectively. Despite this increase, the rates of entanglements are not expected to have an impact at the population level. The majority of reported entanglements are with humpback whales (Megaptera novaeangliae) and primarily occur with Western Rock Lobster Fishery gear, though there has been increasing interactions involving the Developmental Octopus Fishery. Both fisheries are pot and line fisheries that operate off the mid to lower west coast of Australia. To reduce humpback whale entanglements in commercial fishing gear a range of data sources were interrogated plus a number of surveys conducted to identify potential mitigation measures that could be adopted.
Two data sources managed by the WA Department of Parks and Wildlife, the Cetacean Stranding Database (CSD) and Commercial Whale Watching Database (CWWD), were both analysed. The CSD highlighted a high occurrence of whale entanglement reports recorded off the central coast of WA. However, commercial fishing records combined with entanglement records revealed that entangled whales predominantly move contrary to the movement patterns of the overall population. Therefore, such high entanglement reports from the central coast and around Fremantle may be reflective of the southern and easterly movements of entangled whales during the population’s northward migration rather than an area of increased incidence of entanglement.
The CWWD data was too clustered to be assessed spatially, but did reveal changes in the timing of humpback whale migrations. The later peak in whale abundances recorded by commercial whale watching operators in 2012 did relate well to the later initiation of whale entanglement reports in 2012. This highlights the inter-annual variation in the migration of humpback whales and the necessity to obtain multi-year datasets before generalisations about the migration can be made. Such variation may also provide an adaptive means by which the fisheries’ mitigation measures may be introduced dependent on the migration timing of that year, allowing targeted implementation of modifications and reducing the impost on fishers to use gear modifications when the whales may not be present.
Fisheries Research Report [Western Australia] No. 267, 2015 3
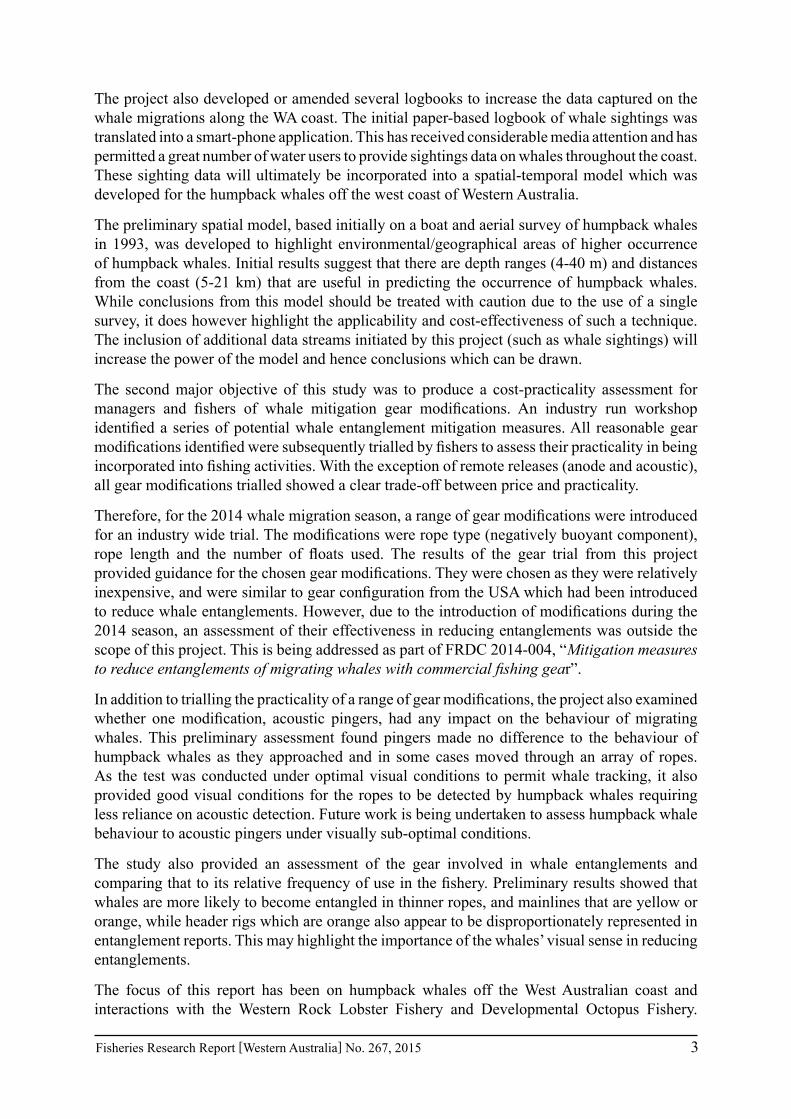
The project also developed or amended several logbooks to increase the data captured on the whale migrations along the WA coast. The initial paper-based logbook of whale sightings was translated into a smart-phone application. This has received considerable media attention and has permitted a great number of water users to provide sightings data on whales throughout the coast. These sighting data will ultimately be incorporated into a spatial-temporal model which was developed for the humpback whales off the west coast of Western Australia.
The preliminary spatial model, based initially on a boat and aerial survey of humpback whales in 1993, was developed to highlight environmental/geographical areas of higher occurrence of humpback whales. Initial results suggest that there are depth ranges (4-40 m) and distances from the coast (5-21 km) that are useful in predicting the occurrence of humpback whales. While conclusions from this model should be treated with caution due to the use of a single survey, it does however highlight the applicability and cost-effectiveness of such a technique. The inclusion of additional data streams initiated by this project (such as whale sightings) will increase the power of the model and hence conclusions which can be drawn.
The second major objective of this study was to produce a cost-practicality assessment for managers and fishers of whale mitigation gear modifications. An industry run workshop identified a series of potential whale entanglement mitigation measures. All reasonable gear modifications identified were subsequently trialled by fishers to assess their practicality in being incorporated into fishing activities. With the exception of remote releases (anode and acoustic), all gear modifications trialled showed a clear trade-off between price and practicality.
Therefore, for the 2014 whale migration season, a range of gear modifications were introduced for an industry wide trial. The modifications were rope type (negatively buoyant component), rope length and the number of floats used. The results of the gear trial from this project provided guidance for the chosen gear modifications. They were chosen as they were relatively inexpensive, and were similar to gear configuration from the USA which had been introduced to reduce whale entanglements. However, due to the introduction of modifications during the 2014 season, an assessment of their effectiveness in reducing entanglements was outside the scope of this project. This is being addressed as part of FRDC 2014-004, “Mitigation measures to reduce entanglements of migrating whales with commercial fishing gear”.
In addition to trialling the practicality of a range of gear modifications, the project also examined whether one modification, acoustic pingers, had any impact on the behaviour of migrating whales. This preliminary assessment found pingers made no difference to the behaviour of humpback whales as they approached and in some cases moved through an array of ropes. As the test was conducted under optimal visual conditions to permit whale tracking, it also provided good visual conditions for the ropes to be detected by humpback whales requiring less reliance on acoustic detection. Future work is being undertaken to assess humpback whale behaviour to acoustic pingers under visually sub-optimal conditions.
The study also provided an assessment of the gear involved in whale entanglements and comparing that to its relative frequency of use in the fishery. Preliminary results showed that whales are more likely to become entangled in thinner ropes, and mainlines that are yellow or orange, while header rigs which are orange also appear to be disproportionately represented in entanglement reports. This may highlight the importance of the whales’ visual sense in reducing entanglements.
The focus of this report has been on humpback whales off the West Australian coast and interactions with the Western Rock Lobster Fishery and Developmental Octopus Fishery.

4 Fisheries Research Report [Western Australia] No. 267, 2015
However, the scope of the outcomes from this report are potentially more wide ranging and may be applicable to other whale species and other pot and line fisheries. It should be acknowledged that this project was a tactical research project, and as such provides an initial assessment of a series of issues. Further work identified through this process is being undertaken as part of FRDC project 2014/044: “Mitigation measures to reduce entanglements of migrating whales with commercial fishing gear” aimed at a reduction in whale entanglements.
Keywords
entanglements; humpback whale; Megaptera novaeangliae; western rock lobster fishery; developmental octopus fishery; mitigation; gear modifications; spatial analysis; Panulirus cygnus, Octopus tetricus

Fisheries Research Report [Western Australia] No. 267, 2015 5
1.0 Introduction
Large whale entanglements in fishing gear are a world-wide problem, with 17 countries having confirmed reports of entanglements from 2003-2008 (IWC 2010). During this period, entanglement reports for Australia have involved five species; minke, humpback, southern right, Brydes and sperm whales. Off Western Australia, the majority of entanglement reports have involved humpback whales (Megaptera novaeangliae) (Groom & Coughran 2012).
Since 2010, there has been an increase in whale entanglement reports off the Western Australian coast. Historically, the majority of the entanglement reports with gear of known source were attributed to the Western Rock Lobster Fishery (WRLF) (Groom and Coughran 2012). While the WRLF is still the major fishery associated with entanglements where the source fishery can be identified, recently there has been an increase in the number of entanglements reports attributed to the Developing Octopus Fishery (DOF). Both fisheries operate on the west coast of Western Australia, with the WRLF catching western rock lobster (Panulirus cygnus) through multiple, individually-set single wooden pots marked with a rope and surface floats, while the DOF targets octopus (Octopus spp.) through trigger traps, which are either set in a “cradle” with a single rope and floats, or as long-lines. Both fisheries fish very similar grounds in the state’s south west. The whale interactions with these two fisheries are the primary focus of this report. However, the findings of this report will be applicable to all pot and line fisheries in Western Australia, Australia and possibly internationally.
1.1 Western Rock Lobster Fishery
The West Coast Rock Lobster Managed Fishery (WRLF) targets the endemic western rock lobster throughout most of its geographic range (Figure 1) through the use of traps (pots). Baited pots are released (set) from boats and are left overnight to attract the nocturnally active lobsters to the pots. The locations of pots are marked by surface floats which are attached to a series of ropes, which are in turn connected to the pot. The pots are retrieved by hauling on these ropes and winching the pot to the surface. The pots are generally retrieved (pulled) the following morning, though sets of two or more days often occur, particularly recently.
This predominantly export fishery which landed 5641 tonnes in the 2013 season was estimated to be worth approximately $234 million for the 2012/13 financial year, with an average beach price of $48/kg (de Lestang et al. 2014). This makes the WRLF Australia’s most valuable single-species wild caught fishery, and was the first fishery in the world to attain the Marine Stewardship Certification in 2000, and has since been recertified for the third time (de Lestang et al. 2014).
In 1897, restrictions were placed on the legal whole weight at which a western rock lobster could be kept by a fisherman, however the first major management measures such as limited-entry were introduced in the early 1960s making it one of the first managed fisheries in Western Australia (and the world) (de Lestang et al. 2012). Until the 2010/11 season, the WRL fishery was input controlled with increasing management restrictions designed to control catch and effort levels. The fishery’s catch was limited by temporal closures, restrictions on the number of pots that could be used and a number of biological controls (e.g. protection of breeding females and minimum and max size limits). A timeline of management responses can be found in de Lestang et al. (2012).
6 Fisheries Research Report [Western Australia] No. 267, 2015
Figure 1 Distribution of the western rock lobster Panulirus cygnus (yellow) and the northern and southern boundaries of the west coast rock lobster managed fishery

Fisheries Research Report [Western Australia] No. 267, 2015 7
Figure 2 Diagrammatic representation of the components of a western rock lobster fishing rig © Coretext
In November 2010 the WRLF transition from input to output control and therefore a number of management rules were changed. These included changes to season length, pot usage and other restrictions which appear to have impacted the entanglement rates with migrating humpback whales (Table 1).
Table 1 Changes to the management arrangements for the west coast rock lobster managed fishery that may have impacted on the rate of whale entanglements. Maximum pot usage is defined as a percentage of the initial fixed pot usage number (68 961)
Season System Seasonal Closure Maximum Pot Usage Other Restrictions / Notes
1965/66 Effort 16 Aug – 14 Nov Fixed pot numbers1 (76,623)
1977/78 Effort 1 Jul – 14 Nov 11986/87 Effort 0.91987/88 to 1991/92 Effort 1 – 0.9 (phased introduction
over 5 years)1992/93 Effort 0.81 pot usage 0.for B Zone1993/94 Effort 0.742005/06 to 2008/09 Effort Series of phased
usage reductions Weekend closures
2009/10Effort – Industry Quota
~0.4A & C zones shut May 2010
B zone shut 15 May 2010
2010/11 Quota 1 Sep – 14 Nov 0.5 Weekend closures2011/13* Quota 1 Oct – 14 Nov 0.52013 onwards Quota No closure 0.5
1 Limited entry for the fishery occurred in 1963 based on boat numbers and traps per boat length * An extended season so that the season’s start could move from the 15 November to the 15 January.
8 Fisheries Research Report [Western Australia] No. 267, 2015
1.2 Developmental Octopus Fishery
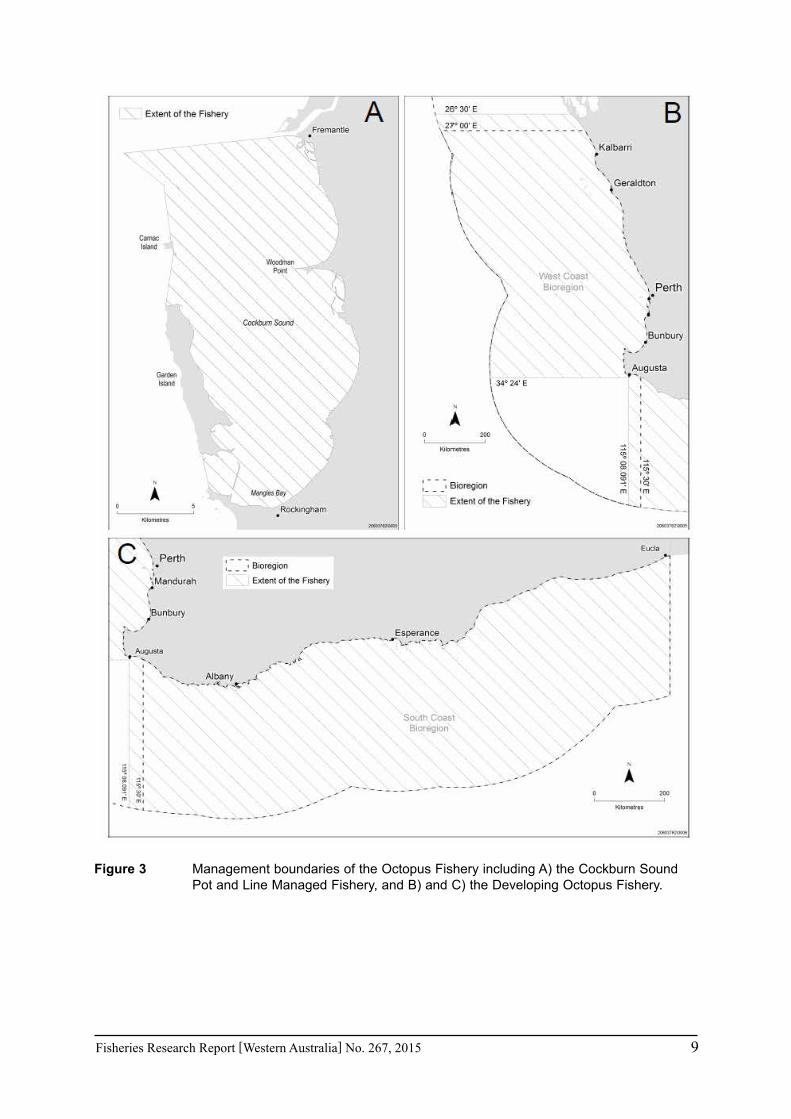
Octopus (primarily Octopus cf. tetricus) are caught by four major fisheries, by-catch of the WRLF and two targeted commercial octopus fisheries, the Developing Octopus Fishery (DOF), and the Cockburn Sound (Line and Pot) Managed Fishery (CSLPF) (Hart et al. 2014). The CSLPF lies within the West Coast Bioregion and its boundaries are limited to Cockburn Sound (Figure 3a). The DOF spans both the West and South Coast bioregions and encompasses the waters bounded by 26°30’ south latitude (Kalbarri Cliffs) and 129°00’ east longitude (the South Australian border) (Figure 3bc).
The CSLPF uses unbaited or passive (shelter) pots while the DOF uses both passive shelter pots and active (trigger pot) traps to selectively harvest octopus. All shelter pots are set as longlines though trigger pots may be set as either longlines or in a ‘cradle’ where typically three trigger pots are on a single base with a rope and float to the surface (Figure 4).
The total commercial catch of octopus in 2013 was estimated to be worth $2.1 million with 226 tonnes live weight landed (Hart et al. 2014).
Fisheries Research Report [Western Australia] No. 267, 2015 9
Figure 3 Management boundaries of the Octopus Fishery including A) the Cockburn Sound Pot and Line Managed Fishery, and B) and C) the Developing Octopus Fishery.
10 Fisheries Research Report [Western Australia] No. 267, 2015
Figure 4 Diagrammatic representation of a longline and cradle configuration of trigger pots typically used in the Developmental Octopus Fishery.
1.3 Humpback Whales
Humpback whales move along the Western Australian coast as they migrate from summer feeding grounds in Antarctica to calve in the north of the state in winter, before returning to Antarctica again in the spring (Jenner et al. 2001). This migration pattern sees the population traverse the WRLF and DOF fishing grounds, migrating north through the fisheries from May to August and returning south from September to November (Groom and Coughran 2012). An assessment of individual whale movements from just north of Shark Bay (the northern extent of the WRLF and DOF; Figure 1) showed that late-August signalled the change in the population’s overall movements, from a net northerly to net southerly migration (Chittleborough 1953, 1965).
The population of humpback whales off the Western Australian coast (Stock D) is a strongly recovering population, with a population increase of ~ 10 % per annum (Bannister and Hedley 2001, Salgado Kent et al. 2012). Historically, humpback whales were the focus of whaling operations off the coast; however, since whaling ceased in 1963, they have recovered from a “catchable” population of about 800 in 1962 (Chittleborough 1965) to an estimated population in 2008 of about 26,100 (Salgado Kent et al. 2012). At the proposed rate of population increase (~ 10 % p.a.), the current population (2014) could be as great as 45,000 individuals, and the population is estimated to reach pre-whaling levels by 2020 (Johnston and Butterworth 2009).
1.4 Whale Entanglements
The issue of entanglements of whales with fishing gear is multi-faceted, operating at a number of different levels, potentially impacting cetacean populations, individual whales, and fishing operations. Entanglements are a major form by which larger marine mammals are impacted by fisheries and these impacts can have a significant effect on population viability (Knowlton and Kraus 2001, Johnson et al. 2005). These interactions are thought to be the single largest anthropogenic threat facing the recovery of many endangered cetaceans (van der Hoop et al. 2013) 1970 through 2009, in the context of management changes. We used a multinomial logistic model fitted by maximum likelihood to detect trends in cause-specific mortalities with time. We compared the number of human-caused mortalities with U.S. federally established levels of potential biological removal (i.e., species-specific sustainable human-caused mortality. At the individual level, an entanglement can be extremely stressful experience as it may result in

Fisheries Research Report [Western Australia] No. 267, 2015 11
prolonged periods of suffering before death (Moore et al. 2006). Also, there is a considerable financial impact on fishers through loss or damage to gear and foregone earnings from lost catch.
Due the large and recovering nature of the humpback population the issue of entanglements is extremely unlikely to impact at the population level. Even if all reported entanglements in the WRLF and DOF were to ultimately lead to mortality, the current number of interactions was assessed to be at such a negligible level as to not impact on the viability of this population (Stoklosa 2013). Despite this, ethical considerations of subjecting an individual whale to such a long protracted death, as well as financial impacts on the commercial fishing industries are sufficient to warrant measures to mitigate future entanglements.
This report aims to assess available information on humpback whales off the West Australian coast to better understand the dynamics of the species with a view to reducing the level of interaction with fishing gear. It will also initiate collection of additional data to complement existing data sources. Finally, the project will examine a range of potential gear modifications that may serve to reduce the number of whale entanglements creating a benefit to the whales and industry alike.

12 Fisheries Research Report [Western Australia] No. 267, 2015
2.0 Objectives1. Start to collect additional information required to determine the spatial and temporal extent
of migrating whales and how this overlaps with commercial fishing gear, by;
a. Compiling all existing information on the spatial and temporal extent of migrating whales
b. Initiate collection of additional spatial and temporal information through a whale sighting logbook
c. Preliminary spatial analysis of all available data
2. Examine the effectiveness of potential gear modifications to the float rigs of fishing pots/traps to reduce their likelihood of entangling whales, by;.
a. Mitigation options identified during an industry run workshop
b. Pilot trials of gear modifications that may mitigate entanglements with whales
c. Detailed examination of retrieved ropes from dis-entangled whales
d. Assess the applicability of mitigation measures developed and adopted internationally
Fisheries Research Report [Western Australia] No. 267, 2015 13
3.0 Methods
3.1 Spatial and temporal overlap of migrating whales and fishing gear
3.1.1 Existing information
There are several existing databases that were interrogated to provide information on whale migration dynamics.
Cetacean stranding database
The Cetacean Stranding database contains data on all whale strandings as well as details of all whale entanglements. It is the latter that was the focus of this analysis. Whale entanglements were first recorded in 1982, however details on the species of whale, location, date, entanglement gear, entanglement outcome and a range of associated data fields was recorded from 1990. Where possible, descriptions or images of the entanglement are used to discern the fishery involved in the entanglement. This is done by experienced researchers at the Department of Fisheries and Department of Parks and Wildlife. Where ropes are obvious but the fishery cannot be determined, they are categorised as ‘rope’. Where there is no/limited information, or it doesn’t involve rope and the fishery can’t be identified, it is scored as ‘unidentified’. As of the end of the 2013 whale migration season, a total of 128 entanglements have been recorded. The database is maintained by the state government agency responsible for cetacean management, the Department of Parks and Wildlife.
Commercial whale watching logbook database
The logbook program for commercial whale watching vessels has been run by Department of Parks and Wildlife since 2000, to provide a record of all whale interactions. Currently there are 113 commercial whale watching vessels in Western Australia extending from Esperance to Broome all of which are required to provide a mandatory record of all whale interactions. Logbooks record contact time, location, species and number of adults and calves for each contact (see pg 95 Appendix 2). A commercial whale watching vessel may undertake several contacts per trip and multiple trips per day.
Analysis
Sighting data from commercial whale watching vessels was grouped into nine ‘regions’ off the Western Australian coastline (Figure 5). These regions were geographically distinct, but also grouped such that they reflect a similar timing of sightings (Figure 17). To examine temporal variation in whale sightings, regions where >50 whale sightings in a year were recorded for multiple years were examined. Normal distributions were fitted to weekly sighting abundances to a modelled mean and standard deviation to examine temporal difference in the distribution of sightings at each location between years.

14 Fisheries Research Report [Western Australia] No. 267, 2015
Figure 5 Nine regions where commercial whale watching sightings in Western Australia were grouped into off the Western Australian coastline
Published and Additional Data
Peer-reviewed literature and unpublished data were sourced when they contained information on either location or timing of humpback whales. A total of eight other data sources back to 1963 were sourced (Table 2), with publication containing geo-referenced sighting data digitised such that they could be incorporated into the spatial model.

Fisheries Research Report [Western Australia] No. 267, 2015 15
Table 2 Source, owner and details of additional published and unpublished data on the spatial distribution of humpback whales off Western Australia. * Indicates sources identified but still being obtained
Source Data Owner or Published Area Years Type
Bannister and Hedley 2001 Published Shark Bay & adjacent offshore 1999 Aerial
surveys
Bannister 1991 Published Shark Bay & adjacent offshore 1991 Aerial
surveys
Bannister 1980 Published Shark Bay & adjacent offshore
1963; 1976-80
Aerial surveys
Jenner et al. 2001 Centre for Whale Research Perth Basin 1993 Aerial surveys
Salgado Kent et al. 2012* Published NW Cape 2000-01; 2006-08
Aerial surveys
Marine Mammal Observer Program Returns Database* Australian Antarctic Division
Annual Wildlife Interaction Database* Dept. Parks and Wildlife West coast -
Oakajee Port Survey* BMC Oceanica Geraldton
3.1.2 Additional data collection
Sightings Logbook
To improve the amount of spatial and temporal data recorded for humpback whales and other whale species which utilise the Western Australian coast, a paper-based logbook was distributed to WRLF and DOF fishers to record data on the date, latitude/longitude, depth, species and number of whales that were sighted (see pg 96 Appendix 3). Comments on the whale including their behaviour (migration direction or surface active) were also recorded.
iPhone app
To better utilise the numerous ‘water users’ throughout the state, including recreational and commercial vessels, and to increase the ease of submitting a sighting and provide a more accurate and instantaneous recording of whale sightings, a smart-phone application was developed. ‘Whale Sighting WA’ (Figure 6) was released on the 28 July 2014 to the App Store on iTunes. The app provides information on the whales to aid in identification of the species, but also serving as an informative reference tool (Figure 6). Records of sightings are stored in a database, with individual sightings being sent to Department of Fisheries staff each time a record is lodged for verification.
Alterations to Whale Watching Logbook
The commercial whale watching database records interactions between commercial vessels and whales (for more details see pg 13 Methods; Commercial whale watching logbook database). The wide coverage of the program provides the opportunity for additional data collection on the whale populations off the state’s coast. The original form (see pg 96 Appendix 3) collects data on the interaction. However, data recording precludes, or requires significant post processing to analyse all data effectively. Therefore several alterations to the logbook were made to facilitate greater accuracy and data being collected by the program.

16 Fisheries Research Report [Western Australia] No. 267, 2015
Two additional fields were added to the new whale watching logbook (see pg 97 Appendix 4). The first deals with scarring. This will provide a long-term data set on scarring rates in the whale populations. Reporting rate of entanglements or other anthropogenic impacts is an important metric to understand the extent of human impact on whale populations. Reporting rates of entanglements have been recorded elsewhere as being very low based on scar-analysis methods (Knowlton et al. 2012). However, these studies have been carried out on very small populations with high observer coverage. To undertake such a study on the populations off Western Australia would be cost-prohibitive, or would only survey a small portion of the population. Addition of this field provides the opportunity to take advantage of pre-existing ‘observers’ who can record such scarring events.

Fisheries Research Report [Western Australia] No. 267, 2015 17
Figu
re 6
S
cree
n flo
w o
f the
‘Wha
le S
ight
ing
WA’
app
. Num
bers
refe
r to
page
link
s fo
r are
as re
quiri
ng a
dditi
onal
dat
a. (1
) to
prov
ide
cont
act d
etai
ls,
(2) s
peci
es li
st to
beg
in a
sig
htin
g re
port,
(3) l
ink
to m
ain
repo
rt pa
ge p
opul
ated
with
cho
sen
spec
ies,
(3a)
add
ition
al d
etai
ls o
n ch
osen
sp
ecie
s, a
nd (4
) dro
pdow
n lis
t of b
ehav
iour
attr
ibut
es
18 Fisheries Research Report [Western Australia] No. 267, 2015
The second additional data field deals with movement and behaviour of the pod. This will complement the data collected through the Whale Sighting WA app. Collecting movement data such as “None; North, South, East, West” and behavioural data “Logging, Surface Active, Actively Swimming” will provide data on possible ‘rest areas’ or migratory corridors or timings. This can then be incorporated into future runs of the spatial model to increase the available data and hence applicability of the model.
The remaining changes were to eliminate a number of potential sources of data error. These included a data field for vessel registration, to eliminate a vessel name being entered differently for multiple returns from the same vessel. Similarly, the field of “area of operation’ will be accompanied by a list of specified areas in the notes of the logbook, which will eliminate the use of local colloquial names and better enable a regional analysis to be undertaken. With the ability to locate whales likely to change with cloud cover and sea state, these fields have been included. With these changes to environmental data, it will allow adjustment of sighting rates according to the environmental conditions.
3.1.3 Commercial Fishing Data
Catch and effort data for the western rock lobster fishery
Prior to the transition to a quota fishery (Table 1), the WRLF had statutory monthly returns in a catch and effort system (CAES). This recorded the number of days fished, pots pulled per day and the retained catch for that month for each 1ox1o fishing block. Concomitantly, a voluntary research logbook program recorded greater detail on fishing operations including but not limited to daily information on: soak period (days between setting and pulling the pots), catch and effort by 10 fathom depth categories in 0.1o latitude x 0.5o longitude blocks. These logbooks were completed by approximately 30-40% of the fleet and were used to apportion the CAES data into a finer temporal and spatial scale of the logbook program. The recent change to the management regimes for the WRLF moving to a quota fishery (Table 1) has required the statutory use of daily catch disposal records. The improved temporal resolution, coupled with the improved spatial resolution (0.1o x 0.1o block) and mandatory reporting of the fishing depth range and soak period has greatly improved the understanding of the dynamics of the whole fishery.
Catch and effort data for the octopus fishery
For the DOF, fishers are required to supply a position (latitude and longitude) for fishing effort, and in the case of long-lines, a start and end position as part of statutory daily reporting requirements. Other variables recorded are depth, soak time, the number of cradles and as fishers can use either long-line or fish ‘singles’ (Figure 4), the fishing method is also recorded.
Analysis
Catch and effort data analysis for both fisheries was limited to May to November, when humpback whales migrate through the fishing grounds. An additional index of rope days was calculated. This provided an indication of the number of vertical lines that were present in the water during a month and was calculated by multiplying the number of pots by the soak period. In the case of long-lining octopus fishers, the number of vertical lines was calculated by multiplying the soak period by three as each long-line has vertical lines at either end of the line, and also one marking the lines’ midpoint.
Identifying the likely location of an entanglement was possible for those entanglement reports where the fisher’s unique gear identity could be established. This was done by examining the
Fisheries Research Report [Western Australia] No. 267, 2015 19
fisher’s effort (0.1o x 0.1o block and associated depth) for the 30 days prior to the entanglement. Depth range for each fishing trip was used to establish a mean depth for that fishing trip. The latitude/longitude for each block was determined as the mid-point of the 0.1o x 0.1o block. The ‘likely’ location of the entanglement (latitude/longitude) and mean depth was established through a weighted mean based on the number of pots for each fishing record. The distance moved from the likely entanglement site to the location of disentanglement was calculated using the spherical law of cosines method for the great circle distance (Hasan et al. 2009)
3.1.4 Preliminary spatial analysis
Dataset Assessment
All identified and available datasets (Table 2) off the West Australian coast that was compiled for this project were assessed for their suitability of inclusion in a predictive spatial habitat model. The majority of the datasets available for this project consisted of relatively clustered sighting data due to the nature of the specific coverage for which it was collected (Figure 7). The structured boat and aerial survey conducted in 1993 (Jenner et al. 2001) was identified as the ‘best’ available data in which to apply predictive spatial habitat modelling. Data used for the final model incorporated both northward and southward migrating whales to produce an average distribution map of migrating whales through the WRLF area. While no predictive spatial habitat modelling was conducted on the remaining datasets (Figure 7), these datasets are useful in identifying temporal variation of whale movements throughout the west coast of Western Australia.

20 Fisheries Research Report [Western Australia] No. 267, 2015
Figure 7 Spatial distribution of data sources assessed for inclusion in predictive spatial habitat models

Fisheries Research Report [Western Australia] No. 267, 2015 21
Environmental variables
The bounds of the spatial modelling were offshore from the coast to approximately 2000 m as all whale sightings were within the 2000 m depth contour. Latitudinal bounds extended from Cape Naturaliste to Onslow which are the southern and northern extents of the WRLF area. This also incorporates the major part of the DOF where interactions with migrating humpback whales have occurred.
Predictive spatial habitat models were derived using topographical variables of depth, seafloor slope and seafloor rugosity (benthic terrain complexity) as well as geophysical variables consisting of distance from the coast and distance from the 200 m contour line. These were selected based on their importance identified in previously published literature investigating relationships between humpback whale distribution and the environment (Ersts and Rosenbaum 2003, Johnston et al. 2007, Rasmussen et al. 2007, Oviedo and Solís 2008, Smith et al. 2012). Bathymetry data were obtained from the Geoscience Australia Bathymetry and Topography Grid 2009 (Whiteway 2009). The geophysical variables distance to coast and distance to 200 m contour were calculated in ArcGIS 10.2 using the Spatial Analyst Tools and seafloor slope and seafloor rugosity were calculated using the Benthic Terrain Modeller add in for ArcGIS 10.2 (Wright et al. 2012). All environmental layers used were raster data at a resolution of 300 x 300 m (Universal Transverse Mercator (UTM) GDA 1994 Zone 50 projection) that were converted to ascii files for use in Maxent.
Predictive spatial habitat modelling
Predictive models of humpback whale distribution in the WLRF area were developed using the software Maxent (version 3.3.2), which is based on the maximum entropy method (Phillips et al. 2006, Elith et al. 2010). This approach was chosen because the method performs as well as Generalized Linear Models, although uses presence only data and there was limited knowledge of the sampling effort for the data used in the model. The underlying theory and assumptions for Maxent have been described in detail in Phillips et al. (2006) and Elith et al. (2010). The general approach of Maxent is to create a probability distribution for a species by contrasting occurrence data with background data (pseudo-absences) rather than true absence data. Maxent builds a model of species occurrence starting with a uniform distribution of probability values within each grid over the entire geographic extent (i.e. the background data) and then conducts an optimization routine that iteratively improves model fit measured as gain (i.e. a likelihood or deviance statistic). The gain is closely related to deviance, which is a measure of goodness of fit used in generalized additive and generalized linear models, and indicates how closely the model is concentrated around the presence samples. The iterative approach increases the probability value over locations with conditions similar to occurrence samples. Among all probability distributions satisfying the constraints (expressed in terms of simple functions of the environmental variables), the one of maximum entropy (i.e. the most unconstrained one) is chosen. The output of Maxent is a probability distribution of environmental suitability for a species, whereby higher values correspond to a prediction of better conditions and higher probability of occurrence.
The final model was developed using 75% of the occurrence data (n = 62) from the 1993 surveys (Jenner et al. 2001) and tested using the remaining 25% of the data (n = 21), which was randomly drawn from the entire occurrence dataset for each of 50 bootstrap samples. Response curves of the environmental variables were conducted and a jack-knife test was undertaken to evaluate the relative contributions of each environmental variable to the model. Each

22 Fisheries Research Report [Western Australia] No. 267, 2015
Maxent predictive model was evaluated using the area under the curve (AUC) of the receiver operator characteristic (ROC), which evaluates how well model predictions discriminate between locations where observations are present and random background data (pseudo-absence points). The AUC is one of the most widely used threshold-independent evaluators of model discriminatory power (Fielding and Bell 1997). The AUC statistic can range from 0 to 1, whereby an AUC of 0.5 indicates that model performance is equal to that of a random prediction and a value of 1 suggests perfect discrimination between suitable and non-suitable habitat. However, for presence only and pseudo absence data the maximum possible AUC value is less than one, represented by 1-α/2 where α represents a species’ true distribution (Wiley et al. 2003, Phillips et al. 2006).
3.2 Fishing gear modifications
3.2.1 Mitigation options identified in industry workshop
A workshop run by industry to assess potential options to reduce whale interactions was undertaken in February 2013 (Lunow et al. 2013). This identified 23 mitigation options (Table 3) which were ranked according to their potential effectiveness in reducing whale entanglements and their practicality in being applied. Scoring was conducted by fishers (octopus and western rock lobster) and others member invited to the workshop (government, university, federal institution members) (Lunow et al. 2013). An additional gear modification to mitigate whale entanglements was identified subsequent to the workshop (acoustic pingers) and has been added to the workshop list of options (Table 3).
Mitigation options were classified into several overarching groups, based on their perceived outcome:
• No effect on whale entanglement rates or subsequent disentanglement
• Options to increase the number of disentanglements
• Closures to reduce whale entanglement rates
• Reduction in the number of vertical lines in the water column
• Gear modifications to reduce whale entanglement rates or aid subsequent disentanglement
• Miscellaneous
Their applicability for reducing whale entanglements in the WRLF and DOF were explored.
Fisheries Research Report [Western Australia] No. 267, 2015 23
Table 3 Mitigation options identified during the industry workshop. Those marked with * denote measures specific to the octopus fishery. Use of acoustic pingers is an additional mitigation option that was identified subsequent to the workshop.
Number Mitigation Option
1 * Multiple traps to be used where & when required, & appropriate, following best practice i.e. Code of Practice (CoP, not enforced)
2 * Tight lines between pots established while setting3 * Stronger lines between multiple pots and weaker lines from pots up to the floats4 WAFIC undertake a public whale education program5 Government funded increase in the number of disentanglement teams along the coast6 Take humpback whales off endangered species list7 Use of remote float releases such as acoustic releases or anode timed releases
8 Code of Practice renewal and upgrading if required, following workshop and industry extension
9 Deregulate pot size and number (promotes catching efficiency and therefore reducing time pots and lines are in the water)
10 Pot reduction during peak whale migration times11 Removal or adjustment of maximum size limit and or setose rule (12 “Dog and bone” slack in float lines13 Reduced the number of floats on a float line in Winter (fewer but larger floats)
14 Seasonal closure during peak migration (i.e. June - July for northern and October for southern migration)
15 Weak link in lead-line to allow it to break if an entanglement is about to occur
16 Spatial controls (i.e. limit fishing to inside 20 fathoms during migration period, or other depth closures)
17 Gear modifications only during migration period
18 Tracking identified entangled whales using GPS or other tagging equipment to help locate whales after being reported
19 Using sinking rope/line between pots/traps and for float/lead-line20 Using sectional ropes (to remove slack in float lines)21 Multiple pots on each line to reduce the number of float lines in the water22 Using bio-degradable ropes23 Remove gear from the ocean if not being used for a while (i.e. >7 days)24 Use of acoustic pingers
3.2.2 Pilot trials of gear modifications
Given the nature of mitigation options proposed in Lunow et al. (2013) (Table 3), only gear modifications that may reduce whale entanglements or subsequent disentanglements were examined from November 2013 to February 2014. The trial was conducted outside of the whale migration season due to the timing of the project commencement and the need for information on the practicality of the gear prior to the next migration season. Therefore, the trial was focused solely on the practicality of the gear for incorporation into ‘normal’ lobster fishing activities.
There were five gear modifications that were trialled with fishers; a single large float, negatively buoyant rope, whale pingers, biodegradable rope, and remote releases. Due to multiple options for some of these gear modifications and anecdotal reports that combining a single large float

24 Fisheries Research Report [Western Australia] No. 267, 2015
1 44 kg/220 m and 22 kg/220 m2 Housing from a dolphin specific pinger. Whale pinger under development but will use same housing3 B5A (44 hr release @ 20oC) and C5 (66.5 hr release @ 20oC)4 Fiomarine Industries™ Fiobuoy ® commercial fishing buoy prototype acoustic release
and negatively buoyant rope could reduce whale entanglements, seven options were tested by fishers (Table 4). Fishers were also supplied with information regarding rigging methods (see pg 98 Appendix 5).
Table 4 Specifications of modified gear rigs
Gear Modification Modification 1 Modification 2Single large float with negatively buoyant rope Polyethylene Lead core1 Polyform™ LD1 floatNegatively buoyant rope (normal float rigs) Polyethylene Lead core1
Future Oceans Whale pingers Future Oceans™ 3kHzBanana Whale pingers Fishtek™ Banana pinger 2
Biodegradable rope Sisal rope (10 mm)Anode Release Ocean Appliances3
Acoustic Release Fiobuoy® Prototype 4
The modified gear configurations (Table 3) were trialled by 14 fishers from ports throughout the fishery (Fremantle to Geraldton). Each fisher used the modified gear as part of their normal fishing operations and was asked to complete an evaluation questionnaire (see pg 101 Appendix 6) at the conclusion of their trial.
Assessments of gear costs were made relative to current ‘standard’ fishing gear. It is acknowledged that the fishing practices and gear configurations do change throughout the fishery, season and with depth. However to provide an assessment of the cost-practicality of different gear modifications, they were assessed against a ‘standard’ fishing gear configuration being fished on average every three days throughout six months of whale migration period. The standard gear configuration was for fishing in 20 fathoms (36 m) which is the approximate average depth of fishing during the whale migration period. A fisher fishing in 20 fathoms currently uses approximately 35 fathoms (65 m) of rope with a two float header rig.
Analysis
Scores (1-5; harder-easier) were summed for each fisher and gear type combination across the six ‘how to’ questions which were surveyed (see pg 101 Appendix 6). Analysis of gear rankings were limited to those fishers who trialled four or more of the seven gear modifications. The gear modifications were ranked for each fisher according to their surveyed scores.
Fishers trialled different combinations and numbers of the seven gear modifications. The gear modifications that they trialled were then ranked by their survey scores. To provide an overall practicality ranking for the gear modifications, the gear modification with the most top ranked scores by fishers was deemed the most practical. This process was then done in reverse to establish the worse performing gear modification.
Ranking (1-5; expensive-cheaper) of the costs of the gear modifications were done by scoring each gear modifications likely annual cost, i.e. included whether they were likely to need replacement during or at the end of the whale migration period. These scores were then combined with the scores for practicality to produce an index of the gear modifications cost-practicality.
Fisheries Research Report [Western Australia] No. 267, 2015 25
3.2.3 Preliminary assessment of acoustic pingers
Study Site and Array Deployment
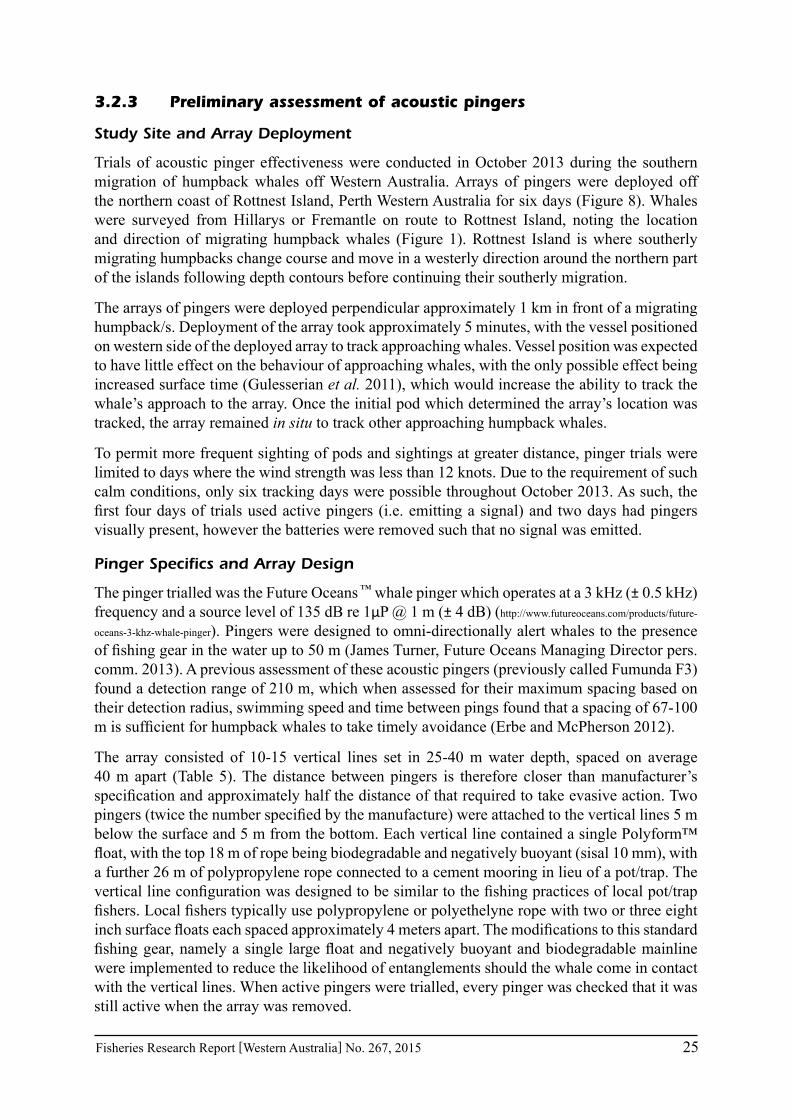
Trials of acoustic pinger effectiveness were conducted in October 2013 during the southern migration of humpback whales off Western Australia. Arrays of pingers were deployed off the northern coast of Rottnest Island, Perth Western Australia for six days (Figure 8). Whales were surveyed from Hillarys or Fremantle on route to Rottnest Island, noting the location and direction of migrating humpback whales (Figure 1). Rottnest Island is where southerly migrating humpbacks change course and move in a westerly direction around the northern part of the islands following depth contours before continuing their southerly migration.
The arrays of pingers were deployed perpendicular approximately 1 km in front of a migrating humpback/s. Deployment of the array took approximately 5 minutes, with the vessel positioned on western side of the deployed array to track approaching whales. Vessel position was expected to have little effect on the behaviour of approaching whales, with the only possible effect being increased surface time (Gulesserian et al. 2011), which would increase the ability to track the whale’s approach to the array. Once the initial pod which determined the array’s location was tracked, the array remained in situ to track other approaching humpback whales.
To permit more frequent sighting of pods and sightings at greater distance, pinger trials were limited to days where the wind strength was less than 12 knots. Due to the requirement of such calm conditions, only six tracking days were possible throughout October 2013. As such, the first four days of trials used active pingers (i.e. emitting a signal) and two days had pingers visually present, however the batteries were removed such that no signal was emitted.
Pinger Specifics and Array Design
The pinger trialled was the Future Oceans ™ whale pinger which operates at a 3 kHz (± 0.5 kHz) frequency and a source level of 135 dB re 1µP @ 1 m (± 4 dB) (http://www.futureoceans.com/products/future-
oceans-3-khz-whale-pinger). Pingers were designed to omni-directionally alert whales to the presence of fishing gear in the water up to 50 m (James Turner, Future Oceans Managing Director pers. comm. 2013). A previous assessment of these acoustic pingers (previously called Fumunda F3) found a detection range of 210 m, which when assessed for their maximum spacing based on their detection radius, swimming speed and time between pings found that a spacing of 67-100 m is sufficient for humpback whales to take timely avoidance (Erbe and McPherson 2012).
The array consisted of 10-15 vertical lines set in 25-40 m water depth, spaced on average 40 m apart (Table 5). The distance between pingers is therefore closer than manufacturer’s specification and approximately half the distance of that required to take evasive action. Two pingers (twice the number specified by the manufacture) were attached to the vertical lines 5 m below the surface and 5 m from the bottom. Each vertical line contained a single Polyform™ float, with the top 18 m of rope being biodegradable and negatively buoyant (sisal 10 mm), with a further 26 m of polypropylene rope connected to a cement mooring in lieu of a pot/trap. The vertical line configuration was designed to be similar to the fishing practices of local pot/trap fishers. Local fishers typically use polypropylene or polyethelyne rope with two or three eight inch surface floats each spaced approximately 4 meters apart. The modifications to this standard fishing gear, namely a single large float and negatively buoyant and biodegradable mainline were implemented to reduce the likelihood of entanglements should the whale come in contact with the vertical lines. When active pingers were trialled, every pinger was checked that it was still active when the array was removed.

26 Fisheries Research Report [Western Australia] No. 267, 2015
Figure 8 Location of pinger arrays (closed circle), and direction of sighted migrating whales (arrows) around Rottnest Island, Western Australia. Dotted arrow indicates the common direction of whales along the north of Rottnest Island
Table 5 Actual distance between vertical lines deployed in the pinger array
Date Array Number
Mean Distance
Minimum Distance
Maximum Distance
Number in Array
2 Oct 2013 1 41.63 23.26 49.75 103 Oct 2013 2 41.27 18.77 72.11 1510 Oct 2013 3 42.71 27.47 65.59 1525 Oct 2013 4 43.09 28.38 56.53 1527 Oct 2013 5 44.87 35.16 59.52 1530 Oct 2013 6 40.79 26.26 66.33 1530 Oct 2013 7 40.80 23.64 50.38 15

Fisheries Research Report [Western Australia] No. 267, 2015 27
Whale tracking and behavioural assignment
Due to the lack of high topographical positions from which to track humpbacks off Western Australia (J. Smith pers. comm.), positioning of humpbacks was done from the vessel using a mobile (iPhone) theodolite (Hunter Research and Technology™). Theodolite images and Xif data (positional information recorded when photos were taken) were captured providing latitude/longitude, bearing and time. Range was estimated from the captured theodolite image, and adjustments to bearings were made when the whale was not in centre of the view. Positions determined through the theodolite were coupled with field notes to determine the location and behaviour of numerous whale pods within the vicinity of the array. Where an accurate position for a whale’s movements could not be determined, its location relative to the array and other whales was recorded and included in subsequent behavioural descriptions.
A series of in-situ validation tests were undertaken on each tracking day to assess the accuracy of position estimates generated from the theodolite. Estimates of the distance and bearing to the buoys comprising the array were compared to their known distance and bearing from the boat. To account for daily variation in the accuracy of range estimates, the mean difference between the actual (known) and estimated distance (Table 6) were used to correct range estimates thus producing a more accurate position for each whale location. This was a similar approach to other behavioural studies of whales in relation to simulated fishing gear (Kot et al. 2012).
Table 6 Mean difference between the actual and estimated distance using theodolite to fixed known location
Date Mean Distance ± SE2 Oct 2013 90.05 8.503 Oct 2013 36.59 27.52
10 Oct 2013 -1.45 7.7325 Oct 2013 34.52 12.8327 Oct 2013 -18.60 9.7130 Oct 2013 -1.05 7.37
With a known location, bearing and adjusted distance to the whale, the whales location was then determined. This was done numerous times for each whale/s that was within the vicinity of the array to provide a track of the whale’s movements. As it was often not possible to identify individual whales within a pod, all locations that occurred within a minute of the previous sighting of that pod were combined and a mean location for the pod was established.
Whales that were not tracked within 100 m of the array were omitted from further analysis. This distance was chosen based on work by Erbe and McPherson (2012) as they suggested it to be a sufficient distance at which humpback whales may take timely avoidance.
The remaining whale pods’ response to the pinger array was categorized as: 1) they continued on a path which passed close but not through the array, but appeared to be unaffected by the array’s presence 2) they continued on their course and passed through or very close (<10 m) to the array and 3) as they moved toward array their course deviated away from the array or they were tracked moving away from the array.
Comparisons of whale responses to the pinger array were conducted using two components of the data set. An initial comparison was made for pinger activity on the proportion of whales which showed no effect from the pinger array i.e. they moved through or continued
28 Fisheries Research Report [Western Australia] No. 267, 2015
past with no obvious direction change, compared with those that did change direction (full dataset). Subsequent analysis compared the proportion of whale pods which deviated from the array compared to those that moved through the array as a factor of pinger activity. This saw the removal of whales that appeared to move past the array with no obvious change (reduced dataset). These pods were usually moving in a nor-westerly direction (Figure 32 & Figure 33). This secondary analysis therefore permitted an examination of pinger activity on those animals which were clearly affected (deviated away) and those which were clearly unaffected (moved through) the array.
Analysis
Differences in the proportions are typically examined using contingency table analysis (chi-square test of homogeneity). However, the test requires adequate sample sizes, with counts of more than five in 80% of categories and no categories with zero expected counts (Zar 2010), which was not possible with the number of observed whale pods. Consequently, three alternative methods were used to assess the difference in proportions, to provide a weight of evidence approach to assess pinger performance. They were Clopper-Pearson confidence intervals (Zar 2010), Fisher exact test and Monte Carlo Markov Chain simulations [MCMC in WinBUGS (Spiegelhalter et al. 2002)].
Clopper-Pearson confidence intervals were calculated to compare the effect of pinger activity on the binomial proportions of whale pods showing no obvious direction change. It must be noted that this is a conservative confidence interval, as it tends to be larger than necessary for the desired level of confidence.
Fisher exact test used fixed margins. While this is not the case with the data presented here, many researchers still recommend its use for small samples with caution (Zar 2010). Calculated hypergeometric probabilities were used to compare the observed data written as a 2x2 contingency table with all other possible 2x2 contingency tables with the same row and column margins as the observed data to examine possible difference in pinger activity on whale behaviour.
The probability that the proportion of whale pods changing direction differed as a result of the pinger status was assessed using MCMC in WinBUGS to generate simulated observations from the posterior distribution of the proportions. Uninformative β prior probability distributions, β(1,1), were specified for the probabilities of whale pods changing direction for active and inactive pingers. The analysis employed two Markov chains, specifying a total of 1 000 000 iterations. Graphical output produced by WinBUGS was examined to assess whether the two chains were likely to have converged to the same solution.
3.2.4 Examination of retrieved ropes from dis-entangled whales
As part of disentanglements attempts, fishing gear involved in the entanglement was recovered from the whale. Initially recovered gear was returned to the fisher when the owner of the gear could be identified. However recently, recovered fishing gear from disentangled whales was retained, resulting in 25 fishing rigs from whale entanglements which could be examined. Complementing this information, photographs and records of entanglements were used to discern components of the gear involved in historical entanglement reports. Where possible, records were made on the rope (type, diameter, colour, length and join method), floats (number, type and attachment method) and the distances between varying aspects of the fishing gear. Multiple recordings were sometimes possible for a single component of a recovered rig. For

Fisheries Research Report [Western Australia] No. 267, 2015 29
example, a recovered mainline rig could be comprised of two joined ropes, with each rope being a different type or colour or thickness, and hence would all be recorded separately.
Additional information on the gear involved in whale entanglements was extracted from entanglement reports and photos captured in the Department of Parks and Wildlife Cetacean Stranding Database (see pg 13 Methods: Cetacean stranding database). Due to the descriptive nature of the reports and images, information was limited to rope colour and float numbers.
A fishing gear survey was provided to all 256 WLR and 17 DOF fishers in 2014 (see pg 103 Appendix 7). with 70 WLR (27%) and three DOF (17%) surveys returned to the Department of Fisheries. The survey recorded the same aspects of the fishing gear as was recorded during the examination of the retrieved disentangled whales. This permitted an examination on of the proportion of different gear types which were recorded from entanglements to their proportional usage in the fisheries.
Analysis
Comparisons between the proportions of observed (entanglement gear) and expected (fisher survey) data was analysed through Chi-squared analysis. Where expected values were less than five for an analysis, p-values were accepted when all of the following criteria as per Zar (2010) were met
22k k10;n10;n k 3;n≥ ≥ ≥ >
where n is the number of observations and k is the number of categories. Clopper Pearson confidence intervals were used to examine pair-wise significant differences between observed and expected proportions. Variations in float numbers between those used in the fishery (surveyed) and involved in entanglements were examined using a Kolmogorov-Smirnov Test.

30 Fisheries Research Report [Western Australia] No. 267, 2015
4.0 Results
4.1 Spatial and temporal overlap of migrating whales and fishing gear
4.1.1 Existing information
All data sources were limited to data for the 2013 whale migration period and earlier.
Cetacean stranding database
Temporal
Since 1990 there have been 130 (128 in commercial fishing gear) entanglements recorded in Western Australia, with 92% of them being with humpback whales (Figure 9a). Since 2010, there has been a dramatic increase in the number of whale entanglement reports in all types of gear (Figure 9a) and in WRLF gear (Figure 9b). Categorisation of gear types associated with entanglements shows that the large number of entanglement reports have been attributed to the WRLF (Table 7), though recently there has been a number in the DOF, however a large proportion remain either unidentified, or un-attributable to a fishery or source (Table 7).
Current levels of entanglement reports in the WRLF are well above the long-term average of whale entanglement reports for this fishery, which prior to 2011 was between 0-4 (average 1.72) per year (Figure 9b). It is notable that there has also been an increase in the number of entanglements that have been reported in recent seasons (2011–2013) in May and June, which is most comparable with previous seasons as this period has always been fished (Figure 9b), despite currently being fished at lower levels than historically (Figure 21).

Fisheries Research Report [Western Australia] No. 267, 2015 31
Table 7 Categorisation of entanglements by gear type and year
Fishing Related Entanglements
Year All Entanglements
Non Fishing WRLF Rope Unidentified Octopus Other
FisheriesTotal
Fishing1990 2 0 1 1 0 0 0 21991 0 0 0 0 0 0 0 01992 1 0 0 0 0 0 1 11993 0 0 0 0 0 0 0 01994 2 0 0 0 0 1 1 21995 2 0 2 0 0 0 0 21996 3 0 2 1 0 0 0 31997 1 0 0 1 0 0 0 11998 4 0 2 1 0 0 1 41999 0 0 0 0 0 0 0 02000 3 0 3 0 0 0 0 32001 1 0 1 0 0 0 0 12002 5 0 3 2 0 0 0 52003 3 0 2 1 0 0 0 32004 6 0 4 0 0 0 2 62005 6 0 0 5 0 0 1 62006 8 0 6 1 1 0 0 82007 4 1 1 0 2 0 0 32008 5 0 3 1 0 0 1 52009 3 0 1 1 0 0 1 32010 4 1 0 2 0 1 0 32011 10 0 6 3 0 1 0 102012 25 0 13 3 6 3 0 252013 32 1 18 6 4 3 0 31Total 130 3 68 29 13 9 8 127
Prior to 2011 when the fishing season ended in June, whale entanglement reports in western rock lobster gear occurred primarily in June, with a few entanglements reported in July (Figure 10a). The recent expansion in the fishing season has seen a temporal increase in entanglements which are now reported through to the end of the fishing season for that migration year. There has also been an increase in entanglements reported in May (Figure 10b–d).

32 Fisheries Research Report [Western Australia] No. 267, 2015
Figure 9 Timeline of entanglements of a) all entanglements by year and species and b) all entanglements in western rock lobster gear by year with those occurring during the traditional season (Nov-Jun; black) those outside of these months (Jul-Oct; grey), with dotted line indicating long-term average of whale entanglements in western rock lobster gear prior to 2011

Fisheries Research Report [Western Australia] No. 267, 2015 33
Figure 10 Mean annual number of reported entanglements in WRL gear by month for a) 1982-2010 (from Groom and Coughran 2012); b) 2011; c) 2012 and d) 2013. The solid black line at the top of each figure represents the temporal extent of that fishing season.
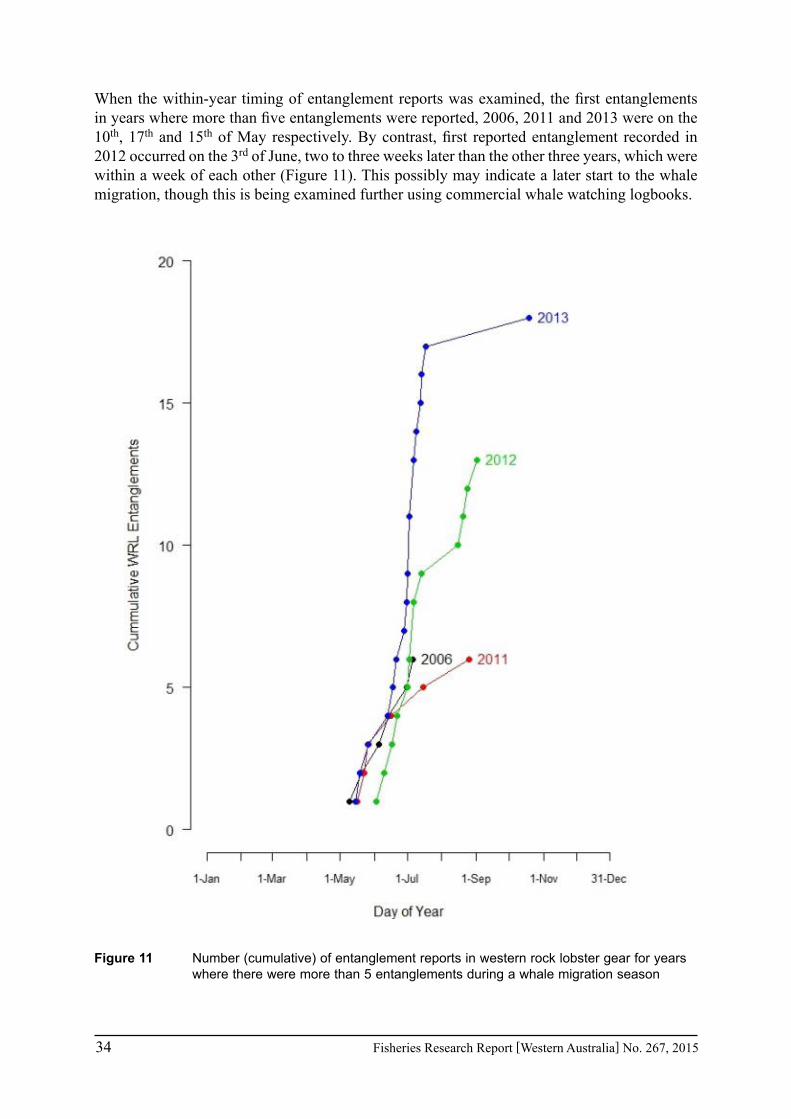
34 Fisheries Research Report [Western Australia] No. 267, 2015
When the within-year timing of entanglement reports was examined, the first entanglements in years where more than five entanglements were reported, 2006, 2011 and 2013 were on the 10th, 17th and 15th of May respectively. By contrast, first reported entanglement recorded in 2012 occurred on the 3rd of June, two to three weeks later than the other three years, which were within a week of each other (Figure 11). This possibly may indicate a later start to the whale migration, though this is being examined further using commercial whale watching logbooks.
Figure 11 Number (cumulative) of entanglement reports in western rock lobster gear for years where there were more than 5 entanglements during a whale migration season

Fisheries Research Report [Western Australia] No. 267, 2015 35
Spatial variation in entanglements
Reported entanglements of whales off the West Australian coast have been recorded from the far north of the state, through the west coast and onto the south coast (Figure 12). However, there are clearly more entanglements recorded on the west coast. This is a more densely populated part of the coast, contains more water users and is also the area of the WRLF and DOF fisheries where there are significant numbers of active fishing vessels (Figure 12). This increased occurrence of reported entanglements may also be a result of behavioural changes of entangled whales.
The directions travelled by 48 whales were determined from their entanglement records. Nine were recorded as being stationary, two moving west, while the majority (n=33) moved either north or south, which is the general orientation of the Western Australian coast (Figure 13). In the first half of the migration season (May to August), the net movement of the population is in a northerly direction (Chittleborough 1953, 1965). During this period, 17entangled whales were reported moving in a northerly direction; however, there were 11 entangled whales that were moving south, contrary to the net movement of the population during this period (Figure 13). A further five entangled whales were sighted moving south in September and October (Figure 13), which follows the movement patterns described for humpbacks returning to Antarctica from the northern calving grounds (Jenner et al. 2001).

36 Fisheries Research Report [Western Australia] No. 267, 2015
Figure 12 Location of reported whale entanglements in WRLF gear (red circle), other fishing gear (black triangle) and non-fishing gear (green square); the spatial distribution of the Western Australian population (as per legend; data Australian Bureau of Statistics) and the areas fished by WRLF during the whale migration seasons of 2011–2013 (pink).

Fisheries Research Report [Western Australia] No. 267, 2015 37
Figure 13 Frequency of north (blue) or south (red) movement directions from reports of entangled whales by month. Dotted line represents the demarcation of the net northerly (up arrow) and net southerly (down arrow) migration of the humpback whale population off the Western Australian coast
In a further 20 entanglement reports from 2010 – 2013 it was possible to identify fisher’s gear and hence the location where the whale had come from. On average, whales moved 40 km from their entanglement site to where they were disentangled, though distances ranged from 1.2 to 153.9 km. As with the observed direction of travel of entangled whales (Figure 13), the entanglement-disentanglement tracking showed that most entangled whales were disentangled generally south or east of their likely entanglement location (Figure 14). During the first half of the migration period, when the population as a whole is heading north, there were only three entangled whales that moved north. Conversely, 14 entangled whales moved either in a southerly or easterly direction during this period.
During the second half of the migration period, which is a generally southern migration, three whale’s movements were examined. One whale was found only about one kilometre from its entanglement site. The remaining two whales showed either a contrary movement of 78 km north or an offshore movement (west) of around 36 km from their likely entanglement location (Figure 14).

38 Fisheries Research Report [Western Australia] No. 267, 2015
Figure 14 Direction and distance of movements of entangled whales between likely entanglement and disentanglement locations (where the likely location of entanglement could be determined) during May – August (blue) and September – November (red).
On the 17 May 2011, a specialized entanglement tracking satellite buoy was attached to the trailing entanglement gear of a humpback whale when deteriorating weather prevented a Department of Parks and Wildlife response team from carrying out disentanglement attempts. The whale was tracked from 79 Argos satellite fixes for just over 5.5 days (130 hours), during which time the whale travelled 718 km (Figure 15). The entangled humpback whale initially moved offshore 120 km in a south west direction without stopping, before turning north towards the Houtman Abrolhos Islands. At times, the whale was recorded 200 km west of the Australian coast in waters where the depth was 5000 metres. The tracking buoy and entanglement gear was recovered from the whale between the Houtman Abrolhos Islands and the mainland. Identification of the gear enabled an assessment of the movement of the whale, from its likely location of entanglement to where the satellite buoy was attached, of 54 km in a southerly direction (red arrow in Figure 15).
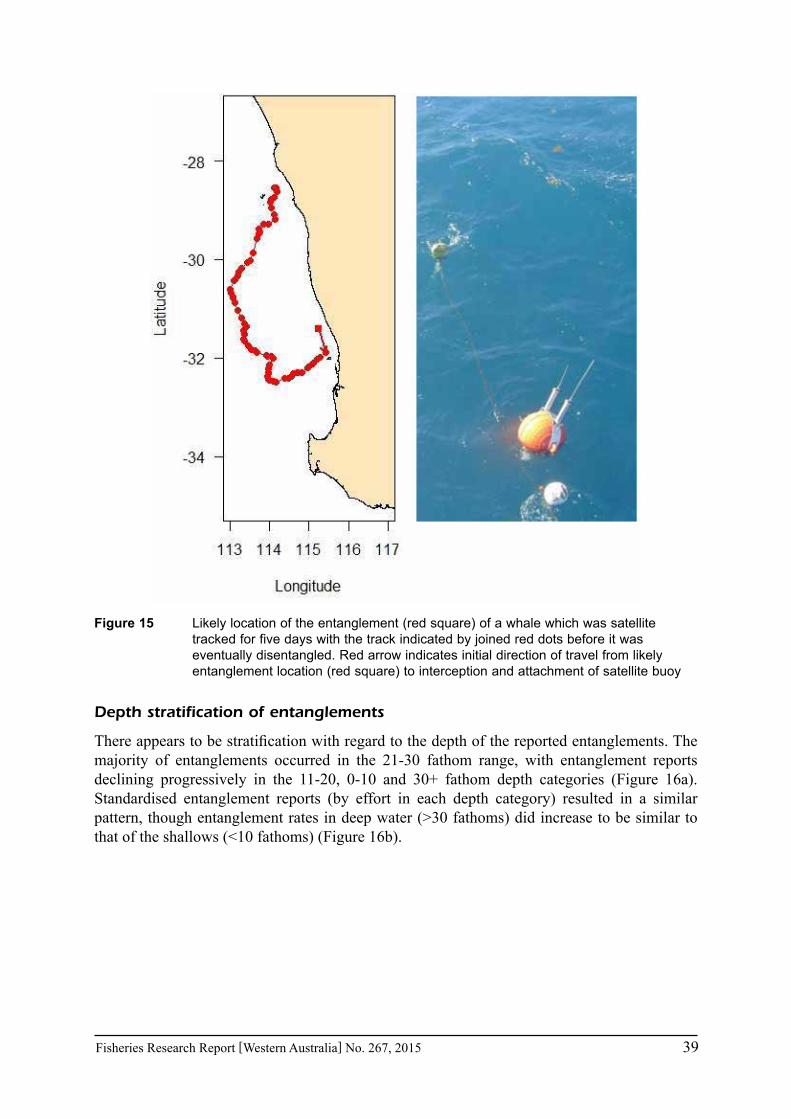
Fisheries Research Report [Western Australia] No. 267, 2015 39
Figure 15 Likely location of the entanglement (red square) of a whale which was satellite tracked for five days with the track indicated by joined red dots before it was eventually disentangled. Red arrow indicates initial direction of travel from likely entanglement location (red square) to interception and attachment of satellite buoy
Depth stratification of entanglements
There appears to be stratification with regard to the depth of the reported entanglements. The majority of entanglements occurred in the 21-30 fathom range, with entanglement reports declining progressively in the 11-20, 0-10 and 30+ fathom depth categories (Figure 16a). Standardised entanglement reports (by effort in each depth category) resulted in a similar pattern, though entanglement rates in deep water (>30 fathoms) did increase to be similar to that of the shallows (<10 fathoms) (Figure 16b).

40 Fisheries Research Report [Western Australia] No. 267, 2015
Figure 16 a) Depth category (fathom) of entanglement where the likely depth of entanglement could be determined, and b) the entanglement rate standardised by number of pot days in each depth category for the last three seasons (2011-2013)
Commercial Whale Watching Logbooks
Whale watching data was compiled into sightings from nine regions throughout the state (Figure 17). In the southern part of the state (Albany, Augusta, Cape Naturaliste and ‘Metro’) there was a clear separation in whale sightings representing the northern and southern migration. Sightings in Albany and Augusta both peaked around weeks 24-28 (June and July), compared to those at Cape Naturaliste and ‘Metro’ where peak sightings were at week 42 (mid-October). For the northern locations, the separation between a northern and southern migration is not evident. Peak numbers were recorded at Ningaloo, Dampier and ‘Kimberley’ at weeks 28-31 weeks (mid-July-early August). All three of these sites however did have sightings which stretched later into the whale migration season. Exmouth and Kalbarri peaked later at around 36-40 weeks (September), though both had a considerable number of sightings before this peak (Figure 17).
Sightings of calves occurred later in the migration and were apparent as far north as the Kimberleys. There were clear peaks in calf numbers seen at the southern regions of ‘Metro’ and Cape Naturaliste which exploit the southern migration of the humpback whales (Figure 17). At all regions where calves were recorded, the peak of calf abundances was well after that of the adult populations (Figure 17).

Fisheries Research Report [Western Australia] No. 267, 2015 41
Modelling of sightings showed that the peak abundance in each region varied between years (Figure 18). The “Metro” region showed a very consistent modelled peak in abundances occurring in either week 41 or 42 (mid-October) for the ten years where abundance data was available. In contrast, the timing of peak abundance in Augusta showed considerable variation. In the five years where sufficient data were available, the modelled peak abundance varied by over five weeks, occurring between late June in 2010 to late July in 2012. The late peak abundance in 2012 was also seen at Ningaloo on the northern run, and at the “Capes” on the southern migration (Figure 18).
Figure 17 Numbers of whales (blue) and calves (black) sighted from commercial whale watching vessels for each week of the year for all years combined for the nine regions indicated from throughout WA

42 Fisheries Research Report [Western Australia] No. 267, 2015
Figure 18 (left) Modelling of whale abundances from commercial whale watching logbooks at four southern regions in Western Australia for years pre 2011(black), 2011 (red), 2012 (green) and 2013 (blue). (right) The timing of peak abundance and the latitude of whale watching operations for ), 2011 (red), 2012 (green) and 2013 (blue)
4.1.2 Initiate collection of additional spatial and temporal information through a whale sighting logbook and ‘app’
Reporting of whale sightings during the 2013 and 2014 seasons (as at 20 September 2014) were lodged through both paper based logbooks (see pg 96 Appendix 3) and electronically through ‘Whale Sighting WA’ (see pg 15 Methods: iPhone app). A total of 212 sightings were reported through the two systems throughout the state (Figure 19)
The uptake of the ‘Whale Sighting WA’ was very good, with 279 downloads from the iTunes store (Figure 20) and 18 people already lodging sightings. This resulted in a total of 701 whales sighted which was made available for the spatial model for humpback whales off the Western Australian coast (see pg 52 Results: Preliminary spatial analysis of all available data).
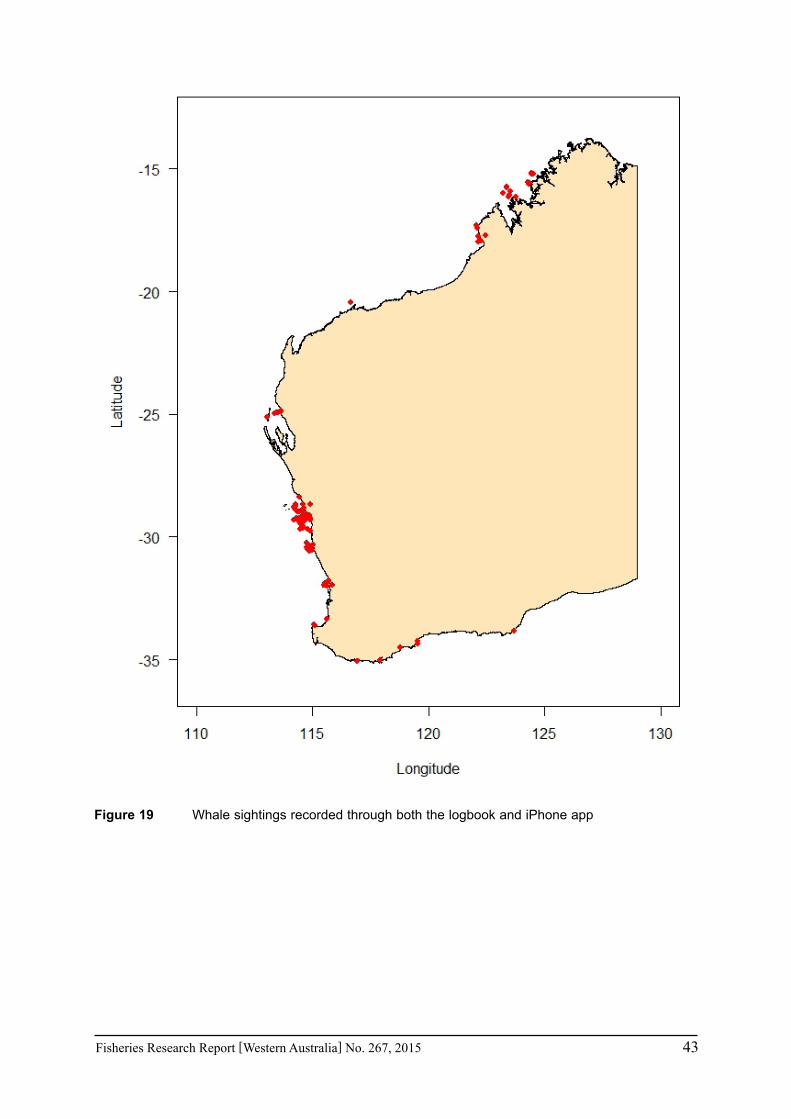
Fisheries Research Report [Western Australia] No. 267, 2015 43
Figure 19 Whale sightings recorded through both the logbook and iPhone app
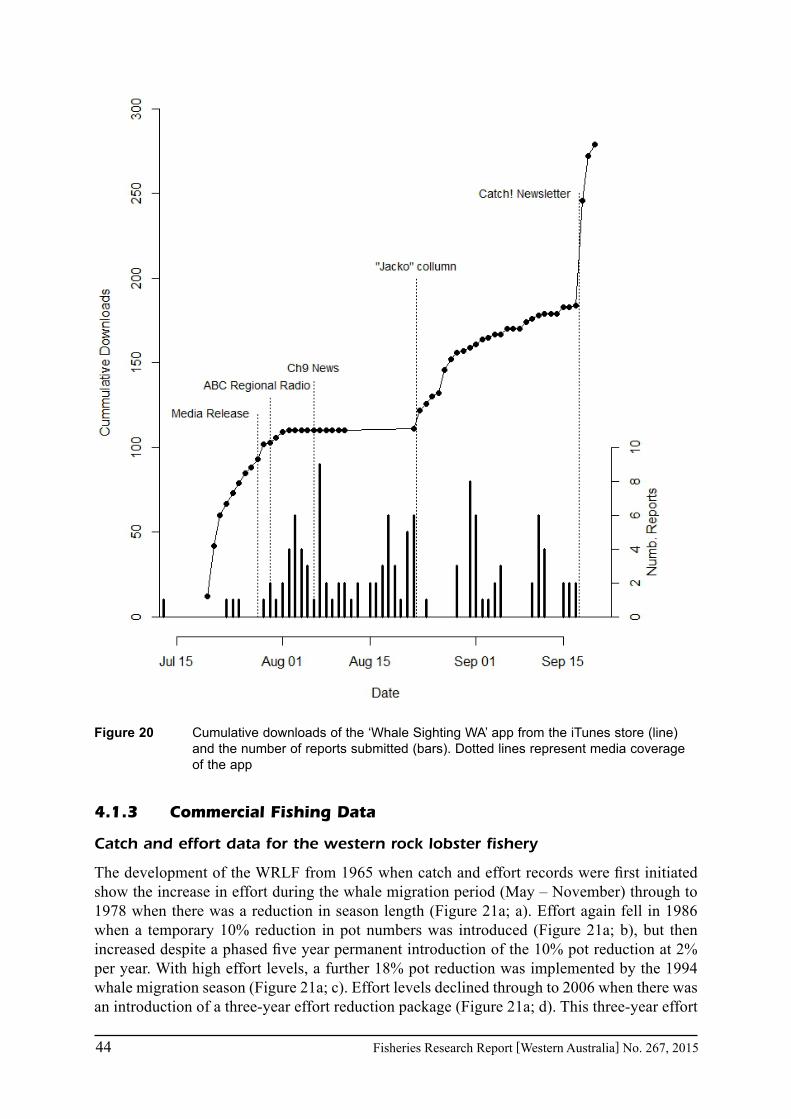
44 Fisheries Research Report [Western Australia] No. 267, 2015
Figure 20 Cumulative downloads of the ‘Whale Sighting WA’ app from the iTunes store (line) and the number of reports submitted (bars). Dotted lines represent media coverage of the app
4.1.3 Commercial Fishing Data
Catch and effort data for the western rock lobster fishery
The development of the WRLF from 1965 when catch and effort records were first initiated show the increase in effort during the whale migration period (May – November) through to 1978 when there was a reduction in season length (Figure 21a; a). Effort again fell in 1986 when a temporary 10% reduction in pot numbers was introduced (Figure 21a; b), but then increased despite a phased five year permanent introduction of the 10% pot reduction at 2% per year. With high effort levels, a further 18% pot reduction was implemented by the 1994 whale migration season (Figure 21a; c). Effort levels declined through to 2006 when there was an introduction of a three-year effort reduction package (Figure 21a; d). This three-year effort

Fisheries Research Report [Western Australia] No. 267, 2015 45
reduction package drastically reduced effort levels in the fishery, which declined until 2010 (Figure 21a; e), where fishing stopped in May 2010 due to a fishery-wide catch limit being reached. From this point on, the fishery’s effort during the whale migration period increased slightly, still well below previous minimum level prior to the transition to a full individually transferable quota (ITQ) fishery.
With the introduction of the ITQ, there was a marked change in the average soak time of pots during the whale migration period (Figure 21b). Traditionally when the fishery was effort based, fishers tended to soak their pots for shorter periods (set the pot on one day and pull it the following day) as this pattern of fishing maximised their catch. The time pots were left soaking in the water, almost doubled with ITQ introduction (Figure 21b). This change in fishing behaviour has made it necessary to develop a new index of effort (rather than pot lifts) that is more relevant to whale entanglements (i.e. how many days ropes are in the water) standardised for and how long the float lines are present in the water column. The number of ropes present in the water in each month followed a very similar pattern to pot pulls as expected by the fairly uniform soak period from 1984 until 2010. It is notable that the gradual decline in effort between 1994 and 2006 (Figure 21b; c-d) was not as obvious in the number of ropes in the water due to the gradually increasing soak period during this same time period (Figure 21b). However, after 2010 the marked reduction in pot usage was great enough to out weight the increase in soak period and result in fewer ropes in the water over recent seasons when compared to seasons prior to 2008 (Figure 21c), although prior to 2010 the effort was concentrated in May-June whereas in recent years the season has extended to include all months.
When the entanglement rates of whales in western rock lobster gear were standardised to account for the days ropes were in the water, there is still a notable rise in the entanglement rate of humpback whales from 2010-2013 (Figure 22). This occurs for reports recorded during traditional fishing months (May, June and November) and for those recorded over the entire whale migration period (May-November). Prior to 2011, the average overall entanglement rate was 0.45 entanglements per 106 rope days, with a rate of 0.38 entanglements per 106 rope days during the traditional fishing months. This increased in 2013 to 7.2 entanglements per 106 rope days for all entanglements and 5.5 entanglements per 106 rope days for all entanglements during the traditional fishing months (Figure 22).
Rope days remained relatively stable during May and June through from 1994 until 2008 (Figure 23). In the May and June of 2009 there was a dramatic decline in the numbers of rope days, associated with reduced pot usage levels. This decline continued in 2010 with the competitive quota which resulted in the fishery closing early that season (Figure 23). Rope days increased in 2011 and have remained well below the levels recorded in 2008 and prior (Figure 23). Rope days in November have shown a progressive decline since 2004, associated with weekend closures and other effort control measures to reduce the peak catches of ‘whites’ (Figure 23). The impact extending the season had on the number of rope days is evident by fishing effort in July – Oct, which first occur in 2011, before increasing in 2012 and 2013 (Figure 23).
When split by water depth the number of rope days during the traditional fishing months of May, June and November either did not change much or declined markedly after the move to quota in 2010 (Figure 24). Fishing during July-October, i.e. additional months accessible after management changes, showed an increase in rope days from 2011 to 2012 before declining in 2013 for all depths below 30 fathoms (Figure 24). In the deeper (31-40 and >40 fathoms) water there was a consistent increase in rope days for the additional months from 2011 to 2013 (Figure 24).

46 Fisheries Research Report [Western Australia] No. 267, 2015
Figure 21 Timeline of a) effort (pot pulls) b) soak time (days between pot pulls) and c) rope days for the western rock lobster fishery during the whale migration period (May-November inclusive). Letters in part a refer to a-Closed season from 1 Jul – 14 Nov; b-pot reduction; c-pot reduction; d-phased effort reductions; e-competitive quota (full details see Table 1)
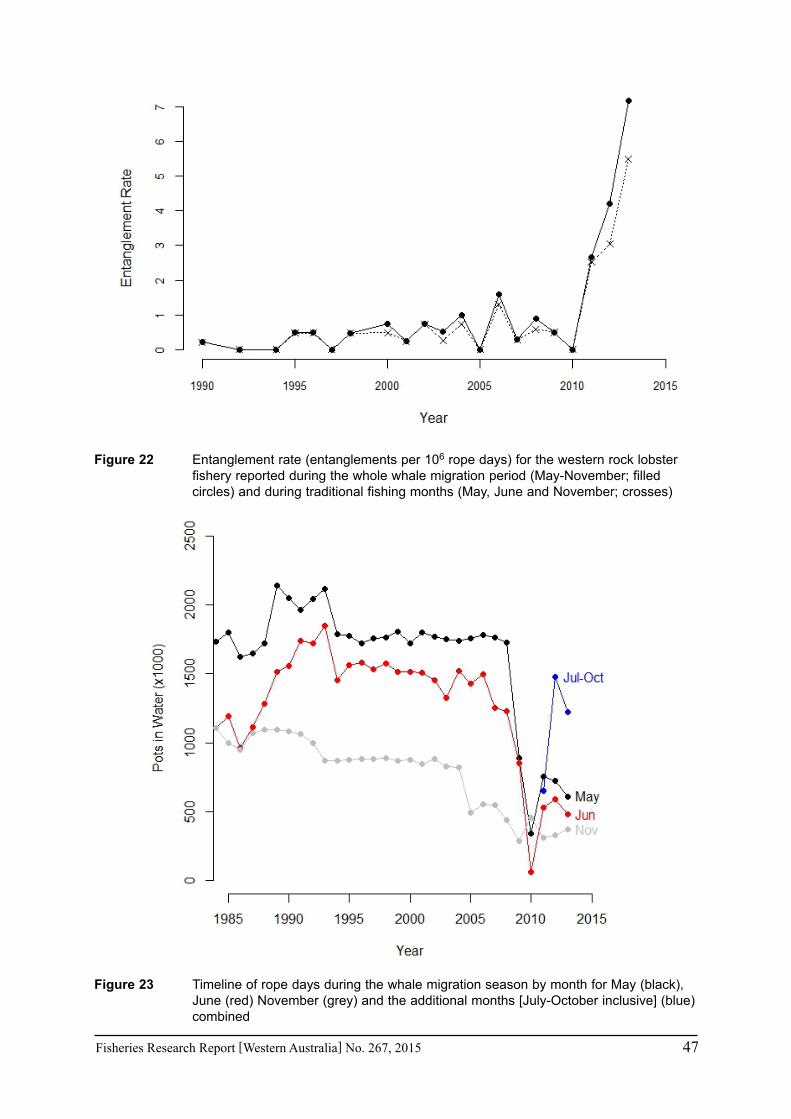
Fisheries Research Report [Western Australia] No. 267, 2015 47
Figure 22 Entanglement rate (entanglements per 106 rope days) for the western rock lobster fishery reported during the whole whale migration period (May-November; filled circles) and during traditional fishing months (May, June and November; crosses)
Figure 23 Timeline of rope days during the whale migration season by month for May (black), June (red) November (grey) and the additional months [July-October inclusive] (blue) combined

48 Fisheries Research Report [Western Australia] No. 267, 2015
Figure 24 Timeline of rope days during the whale migration season by month for May (black), June (red) November (grey) and the additional months (blue; July-October inclusive) combined for a) 10 fathoms or less, b) 11-20 fathoms, c) 21-30 fathoms, d) 31-40 fathoms and e) greater than 40 fathoms
The spatial distribution of the western rock lobster fleet has continually changed since the move to the ITQ (Figure 25). The increase in rope days from 2010 to 2011 appeared to be relatively uniform, with a few ‘hotspots’ (i.e. areas with increased rope days), located around Lancelin and Jurien (Figure 25a). A similar hotspot to the north of Jurien was evident when comparing effort from 2011 to 2012, though the remainder of the fishery showed a fairly consistent increase in effort (Figure 25b). The areas offshore from Dongara through to Geraldton, and also an offshore area south of Fremantle appeared to be the major areas where there was an increase in rope days between 2012 and 2013 (Figure 25c).

Fisheries Research Report [Western Australia] No. 267, 2015 49
There were several regions which showed consistent increase in rope days from 2010 to 2013 for all months of the whale migration (May-November; Figure 26). They are concentrated into two general areas, south of Fremantle and also north from Jurien, both mainly in offshore waters (Figure 26). Known entanglements occurred within, or adjacent to blocks of increased effort. This is with the exception of a number of entanglements which occurred around Lancelin (Figure 26).
Figure 25 Spatial distribution of effort (rope days) for a) 2010, b) 2011 c) 2012 and d) 2013 during the whale migration period (May to November inclusive). Legend indicates the effort (rope days)

50 Fisheries Research Report [Western Australia] No. 267, 2015
Figure 26 Overall change from 2011 to 2013 in spatial distribution of effort (rope days) and likely location of entanglements (red star)
Catch and effort data for the octopus fishery
Effort in the DOF during the whale migration season increased markedly in 2010, moving from just over 4 million potlifts in 2009 to over 78.5 million potlifts in 2010 (Figure 27a) . Since then there has been some fluctuation in potlifts, though they have not fallen below 40 million potlits, 10 times the levels recorded in 2009. Despite the increase in effort, there has been little change in the soak period during the development of the fishery (Figure 27b), averaging around 12 days between pulls since 2008. In this fishery the actual numbers of vertical lines in the water
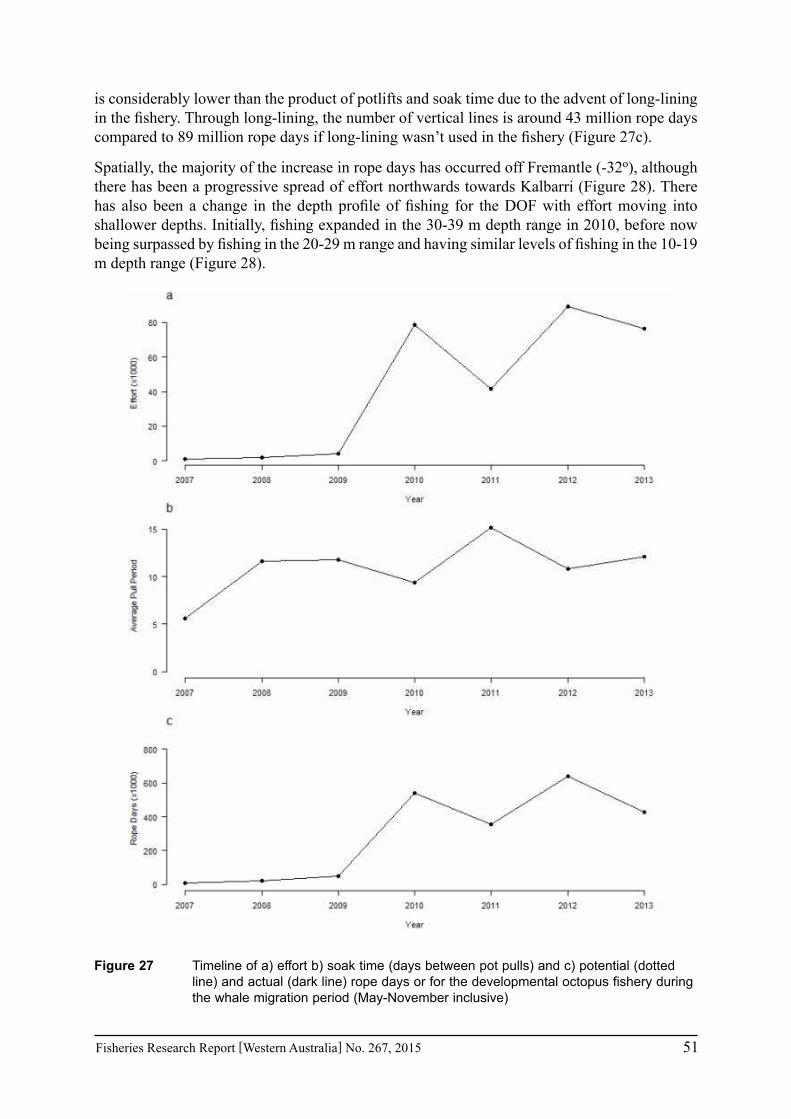
Fisheries Research Report [Western Australia] No. 267, 2015 51
is considerably lower than the product of potlifts and soak time due to the advent of long-lining in the fishery. Through long-lining, the number of vertical lines is around 43 million rope days compared to 89 million rope days if long-lining wasn’t used in the fishery (Figure 27c).
Spatially, the majority of the increase in rope days has occurred off Fremantle (-32o), although there has been a progressive spread of effort northwards towards Kalbarri (Figure 28). There has also been a change in the depth profile of fishing for the DOF with effort moving into shallower depths. Initially, fishing expanded in the 30-39 m depth range in 2010, before now being surpassed by fishing in the 20-29 m range and having similar levels of fishing in the 10-19 m depth range (Figure 28).
Figure 27 Timeline of a) effort b) soak time (days between pot pulls) and c) potential (dotted line) and actual (dark line) rope days or for the developmental octopus fishery during the whale migration period (May-November inclusive)

52 Fisheries Research Report [Western Australia] No. 267, 2015
Figure 28 (top) Rope days (x 100) by year and latitude for the Developmental Octopus Fishery and the known locations of entanglements attributed to this fishery (red dots). (bottom) Depth distribution of rope days by year and 10 m depth categories
4.1.4 Preliminary spatial analysis of all available data
The mean test AUC score from the Maxent model using the 1993 aerial and boat-based data (Jenner et al. 2001) was 0.92 (range 0.86-0.94, SD = 0.009), indicating the model is reliable at predicting presence sites from random background sites. The model predicted a range in suitable habitats (>0.5 probability of occurrence [yellow and red colours]) throughout the modelled area. These were located close to the coast modelled area, except between Kalbarri and Shark Bay (Figure 29). Core areas of higher habitat suitability, in which there was a greater than 70% probability of occurrence identified in the model, occurred between Jurien south to Lancelin, offshore of Perth and Fremantle and offshore of the Cape Range near Exmouth.
The key environmental predictors for migrating humpback whales, based on their relative contributions to the Maxent model, were water depth (71.3%), followed by distance to the coast (20.5%), distance to the 200 m contour line (4.6%), seafloor rugosity (2%) and seafloor slope (1.6%). The jack-knife test of variable importance showed water depth and distance to the
Fisheries Research Report [Western Australia] No. 267, 2015 53
coast have the most useful information as single variables on training gain (highest gain scores in isolation) and the most predictive power (highest AUC in isolation) within the model. In particular, water depth has the highest gain when used in isolation and therefore appears to have the most useful factor. Water depth also decreases the gain the most when it is omitted which suggests it has the most information that isn’t present in the other variables.
Response curves characterising the relationship between probability of occurrence and environmental variables indicate a preference (habitat suitability values > 0.5) for water depths between 4 and 40 m (highest probability between 16 and 28 m; Figure 30a), distances between 5.3 and 21 km from the coast (highest probability at 10 km; Figure 30b) and distances between 17 and 63 km from the 200 m contour line (highest probability at 27 km; Figure 30c). However, there was also a great range from 17 to 106 km from the contour line with a habitat suitability value of 0.48 indicating this predictor is not extremely reliable in identifying humpback whale distribution in isolation.

54 Fisheries Research Report [Western Australia] No. 267, 2015
Figure 29 Predictive spatial habitat model for humpback whales migrating north and south along the west coast of Western Australia

Fisheries Research Report [Western Australia] No. 267, 2015 55
-2000-1500-1000-5000
Hab
itat
Sui
tabi
lity
valu
e
Depth (m)
0.7
0.6
0.5
0.4
0.3
0.2
0.1
a
0
0.1
0.2
0.3
0.4
0.5
0.6
0.7
0.8
0 50000 200000 250000
Hab
itat
sui
tabi
lity
valu
e
b
100000 150000
Distance from coast (m)
0
0.1
0.2
0.3
0.4
0.5
0.6
-50000 0 200000 250000
Hab
itat
Sui
tabi
lity
valu
e
c
50000 100000 150000
Distance from 200m contour (m)
Figure 30 Response curves (probability of occurrence) for environmental variable a) water depth, b) distance from the coast and c) distance (landward) from the 200 m contour
56 Fisheries Research Report [Western Australia] No. 267, 2015
4.2 Examine the effectiveness of potential gear modifications to the float rigs of fishing pots/traps to reduce their likelihood of entangling whales
4.2.1 Mitigation options identified during an industry run workshop
The first three measures in Table 3 are specifically aimed at addressing the issue of long lining in the octopus fishery and hence are not applicable the western rock lobster fishery. As some octopus fishers were unable to long line pots, it was decided for the purpose of this analysis, to assess options that dealt with vertical lines in the water. These will still be applicable to long lining operations as they also require up to three vertical lines to retrieve the pots.
No effect on whale entanglement rates or subsequent disentanglement
Two mitigation options identified during the workshop were considered to not be able to impact on the entanglement rates or dis-entanglement of entangled whales. A stronger public education project by the commercial fishing representative body (#4 Table 3), or removal of humpback whales from the endangered species list (#6 Table 3) would not reduce whale entanglement rates. While it may highlight the status of the whale population migrating along the WA coast, in a practical sense, it would not have a material impact on entanglements.
Options to increase the number of disentanglements
Options to increase the capacity to respond to whale entanglements were raised at the workshop. An increase to the number of disentanglement teams (#5 Table 3) and tracking devices to be attached to entangled whales to allow future interception for disentanglement (#18 Table 3) were both suggested. While these are valid suggestions to mitigate long-term issues with whale entanglements, they are reactive and do not serve to reduce entanglement rates.
Closures to reduce whale entanglement rates
Both spatial (#16 Table 3) and temporal (#14 Table 3) closures to fishing were raised as options to reduce whale entanglements. These would be highly effective measures and could completely eliminate whale entanglements. However, they would also cause a significant economic impact on the commercial fisheries. A temporal closure was proposed as an option for the WRLF by the Department of Fisheries WA should possible mitigation options not be implemented to reduce entanglements. The examination of possible mitigation options to reduce whale entanglements while also allowing for continued for fishing during this period is the primary focus of this section.
Reduction in the number of vertical lines in the water column
These options were based on ways by which the number of vertical lines (ropes) in the water could be reduced while still using rope and float rigs. However, the impacts of these suggestions may reduce or indeed increase the number of vertical lines, with their impacts not know until their implementation. These include the deregulation of pot size and numbers (#9 Table 3) and removal of setose / maximum size regulations (#11 Table 3).
Currently fishers are not able to retain lobsters which are setose or females over a maximum size and are only permitted to fish with 50% of their pot entitlement. Pots are also currently restricted to a standard dimension (de Lestang et al. 2012). The rationale behind the removal of these input controls, which are of a lesser importance now the fishery has progressed to a quota

Fisheries Research Report [Western Australia] No. 267, 2015 57
management arrangement, is that removal of these regulations will increase the legal catch rate, allowing fishers to be more efficient. This should permit fishers to obtain their quota quicker and therefore remove their pots from the water sooner, hence reducing the number of vertical lines. However, it may eventuate that fishers will shift more effort to the whale migration season to take advantage of this increased efficiency. Allowing the retention of setose lobsters which primarily occur during the whale migration period, would make this period, which is otherwise not a peak fishing period, more viable due to the increase catch rate. This may induce more fishers into the water when they may have previously seen this period as not viable due to a lower catch rate when unable to take setose lobsters. Similarly, deregulating pot numbers could increase the number of pots that could be fished by fishers and in turn increasing the overall number of vertical lines in the water during the whale migration period.
Three other options will directly reduce the number of vertical lines in the water, being a pot reduction during the peak migration period (#10 Table 3), multiple pots on a single line (#21 Table 3) and removal of gear not being fished for greater than a week (#23 Table 3). The latter is a key component of the Code of Practice (see pg 107 Appendix 8).
Gear modifications to reduce whale entanglement rates or subsequent disentanglement
There are several options that may serve to reduce whale entanglements rates or eliminate the need for subsequent disentanglement. They include:
Remote releases (acoustic/anode)
The use of remote releases (#7 Table 3) would permit continued fishing during the migration periods through the complete removal of vertical lines from the water. Remote release systems function by ‘storing’ all of the ropes and floats out of the water column (near the bottom), with the ropes and floats being released at a pre-specified time (anode) or on-demand (acoustic). At this point the gear is released and will float to the surface for retrieval.
Acoustic release, are preferable to pre-specified anode release mechanisms as the rope may release at times when the fisher was not present causing vertical lines in the water column. By contrast the on-demand system will only be released and come to the surface when the fisher is present eliminating any chance of surface entanglement.
Reduce slack rope (“dog bone” or Sectional ropes)
Coiling and tying up excess rope on the surface is called a ‘dog bone’ (#12 Table 3) and is a major component of the previous and current code of practice. Sectional ropes (#20 Table 3), as with ‘dog boning’ serve to reduce the amount of surface line. This is achieved through a series of ‘clips’ or rope lengths that can be removed or added to provide the appropriate amount of rope for setting pots in a particular depth. A reduction in slack line has the possibility to reduce whale entanglements, as there has been no previous whale disentanglement attempt involving dog boned rope (D. Coughran pers. comm.). It is unclear if entanglements begin on the surface or sub-surface and is currently being examined (Results; Detailed examination of retrieved ropes from dis-entangled whales). As such a reduction in surface line may possibly reduce whale entanglements.
Fewer and larger floats
Modification to the header gear of lobster pots through a reduction in the number and an

58 Fisheries Research Report [Western Australia] No. 267, 2015
increase in the size of floats (#13 Table 3) may result in fewer entanglements. Fewer floats have the potential to reduce the number of ‘pinch’ points with which the float line can become entangled. However, larger floats may reduce the ability of rope to move over the float and again causing an entanglement. This mitigation option is difficult to assess without fully understanding the dynamics of an entanglement, but it is possible that it may reduce the incidents of whale entanglements.
Weak links
Weak links (#15 Table 3) are designed such that if they come under an increased pressure, such as would occur when a whale becomes entangled in fishing gear, they will break. They are currently used in the Gulf of Maine fishery in the U.S.A (Maine Lobsterman’s Association 2013). Issues with weak links are associated with the contrast between the pressure exerted when a whale is entangled, compared to the pressure applied when the pot is being hauled, especially if it is snagged. Furthermore, if a whale is entangled in gear with a weak link, the weak link should break allowing the whale to swim away, though the entanglement on the whale would still be in place. Most successful disentanglements are achieved when the whale is anchored such that it can be relocated and disentangled without being free-swimming (D. Coughran pers. comm.). It is for this reason that weak links are not a preferred gear mitigation option here in Western Australia.
Negatively buoyant (sinking) lines
Negatively buoyant (sinking) lines (#19 Table 3) between pots on a ground line, or as part of a float line would serve to reduce the amount of line on the surface. This would provide a similar role on mainlines as would ‘dog boning’ (see previous), with slack rope being removed from the surface. The impact of increased amounts of rope subsurface on whale entanglement is difficult to assess, but a reduction in floating line will possibly reduce the likelihood of entanglements.
Biodegradable rope
Biodegradable rope (#22 Table 3) may prevent the initial entanglement of a whale as it is negatively buoyant when wet (negatively buoyant –sinking– lines). However, these ropes have the added advantage of being biodegradable. The rope would breakdown such that the entanglement would eventually dis-entangle itself as all components would breakaway. Therefore depending on the period which the rope takes to break down, it would reduce the ultimate entanglement rate for whales.
There has been limited work done on biodegradable rope as mainlines or float lines, although it is used on sacrificial panels to prevent traps from ghost fishing (Bannister et al. 2013). Some whales are estimated to die after about four months of entanglement being present (Moore et al. 2006). Therefore any biodegradable rope that lasted for less than four months would reduce the ultimate entanglement rate of whales. The corollary of this is while a quicker degrading time is of benefit for the whale it will last less time for the fisher and hence require more regular replacement.
There are a number of potential biodegradable ropes which may be suitable for use in fisheries, including manila, hemp, flax sisal, cotton and a plastic rope without UV stabilisers. Sisal was eventually chosen to be trialled as it was the only degradable rope that was freely and readily available.
Fisheries Research Report [Western Australia] No. 267, 2015 59
Acoustic pingers
Acoustic pingers (#24 Table 3) as a mitigation option was not originally raised at the whale mitigation workshop (Lunow et al. 2013), but has since been postulated as a possible mitigation option for whale entanglements. They are not designed to act as a deterrent as the signal strength is not of a sufficient level to deter interactions (Werner et al. 2006) but it is designed to emit a signal that would alert the whale to the presence of fishing gear in the water. Several studies on their effectiveness on toothed whales and dolphins have been conducted, though there have only be anecdotal accounts of the effectiveness of acoustic pingers on baleen whales. Therefore a test of their effectiveness was conducted on migrating humpbacks off the West Australia coast (Methods/Results: Preliminary assessment of acoustic pingers).
Miscellaneous
There were two suggestions which could not be ascribed into any of the aforementioned categories. They were an upgrading of the Code of Practice (#8 Table 3) and gear modifications only during the whale migration period (#17 Table 3). The Code of Practice (see pg 107 Appendix 8) was updated and has been distributed to all industry members. The indication from the Department of Fisheries is that gear modifications will only currently be necessary during the whale migration period, with this project focusing on the identification of possible gear modifications.
4.2.2 Pilot trials of gear modifications that may mitigate entanglements with whales
Most of the gear trialling occurred in the 30 – 50 m range, with some fishing occurring as shallow as five fathoms, while others fished as deep as 150 m. Most fishers trialled the three different rope options (biodegradable, negatively buoyant, and negatively buoyant with a large single float) and the Future Ocean’s whale pinger (Table 8). However, due to only having five Banana pingers to trial, and a single opportunity to trial the acoustic release prototype, these were not trialled by many fishers. Anode releases were supplied to all fishers, though few chose to use them (Table 8).
Despite the few numbers of pot pulls using anode releases, there were two pots which were lost using this technique. Pots were also lost when using negatively buoyant rope, both with and without the large single float. This was likely due to the rope being snagged when fishing in shallow water (Table 8). One of the sisal ropes did break as the fisher attempted to haul a snagged pot. Despite this break, he was able to retrieve the pot. There were also some breakages associated with the two pinger options. The Future Ocean pinger did break five times compared to the once for the Banana pinger, though the Future Ocean pinger was trialled more extensively (Table 8). The damage to the pingers was associated with retrieving the gear and moving it over the tipper and around the winch, and was likely due to the way the pinger was attached to the mainline.

60 Fisheries Research Report [Western Australia] No. 267, 2015
Table 8 Details of the usage (number of fishers using the gear and number of pulls of the modified gear), damage (gear breakage or pot loss) and the impact on catch for the modified gear that was trialled
Gear Type Number Fishers
Number Potlifts
Number Pots Lost
Damage or Break Impact on Catch
Acoustic Release 1 3 0 Not assessedAnode Release 2 7 2 Negative (1of 2)Biodegradable Rope 9 114 0 1 Negative (1of 9)Negatively Buoyant Rope 11 169 1 No ImpactNeg. Buoy. Single large Float 13 227 2 Negative (1of 13)Future Ocean Whale Pinger 12 201 0 5 Negative (1of 9)Banana Whale Pinger 6 50 0 1 No Impact
The rankings of gear types for the ease of using them while fishing, revealed that each fisher who trialled an acoustic pinger (Future Oceans or Banana pingers) generally rated them as the most practical option to be incorporated into their fishing gear (Table 9). Other than for two fishers, they were always scored the highest or second highest ranking for a fisher. By contrast, any fisher that trialled a release, either acoustic or anode, ranked them as the worst gear modification to be incorporated into their fishing operations (Table 9). Of the three rope/rope float options, negatively buoyant rope with a single large float was the most effective, being ranked higher than the negatively buoyant rope with normal float set up which in turn was better to be fished than the biodegradable rope with normal float set up (Table 9).
Table 9 Ranking (number) for the ease of using gear modifications trialled by the nine fishers who fished four or more of the seven gear modifications. Dark green was considered the best and grey the worst, with transition states being identified by light green to yellow. Only the gear modification is specified, with the rest of the rig being of a standard configuration (i.e. negatively buoyant rope refers to that rope being used with a standard float rig.
Gear ModificationFisher
1 2 3 4 5 6 7 8 9Acoustic Release 1Anode Release 1 1Biodegradable Rope 3 3 1 1 2 3 2 3Negatively Buoyant Rope 2 4 2 2 3 4 1 3 2Neg. Buoy. Single large Float 2 5 4 4 2 3 2 4 4Future Ocean Whale Pinger 5 2 4 4 4 3 5 6 1Banana Whale Pinger 5 5 5 4 6
Costs of gear modifications were assessed relative to the ‘standard’ current fishing gear configuration over the whale migration period. Incorporating biodegradable rope into a fishers standard fishing gear would add no further costs, both being priced at approximately $44 per rig (Table 10). The replacement of standard rope with negatively buoyant rope adds about $5.60 to the cost of a rig, with a single large float replacing the traditional float rig adding a further $14. There is a noticeable increase in cost when fishers move to pingers, with the Banana pinger and Future Ocean pinger adding an additional $63 and $108.50 a rig (Table 10). Anode releases are similar in cost to the Future Oceans pinger, but pale in significance compared with the additional $2005 per pot that would be required if acoustic pingers were to be used (Table 10).

Fisheries Research Report [Western Australia] No. 267, 2015 61
Table 10 Cost of rigs with gear modifications on a per pot basis being fished 60 times over a six month period (an average of 3 day pulls). Modification costs in bold, with replacement cost necessary to ensure gear is functional for the following season. Prices are an approximate guide based on a standard rig configuration and will vary between fishers
Current fishing rigFloat Rig
Rope 1(10
fathom)
Rope 2(20
fathom)
Strop (5
fthm)
Modification Cost
Replacement costs Total
$15 $8 $16 $5 $44 Acoustic Release $8 $16 $5 $2,000 $20 $2,049 Anode Release $15 $8 $16 $5 $2 $120 $166 Biodegradable Rope $15 $4 $16 $5 $4 $44 Negatively Buoyant Rope $15 $13.605 $16 $5 $50 Neg. Buoy. Single Float $29 $13.605 $16 $5 $64 Future Ocean Whale Pinger $15 $8 $16 $5 $866 $22.507 $152.50Banana Whale Pinger $15 $8 $16 $5 $60 $38 $107
It is clear from the ranked cost-practicality, that releases either acoustic or anodes are not viable options as gear modification for reducing whale entanglements at this stage (Table 11). The remaining five options were all very similar, with the Banana pinger being only slightly more cost-practical than the other four options (Table 11). It should be noted that only five Banana pingers were available for testing and apart from the two release options, were trialled over the least number of pot pulls (Table 8).
Table 11 Ranked cost and practicality of gear modifications trialled in the Western Rock Lobster Fishery and their subsequent final score as a cost-practical mitigation option for whale entanglements. Cost: 1 (most expensive) – 7 (cheapest); Practicality: 1 (most impractical) – 7 (practical)
Gear Modification Cost Practicality Final Score
Acoustic Release 1 1 2
Anode Release 2 1 3
Biodegradable Rope 7 3 10Negatively Buoyant Rope 6 4 10Neg. Buoy. Single large Float 5 5 10Future Ocean Whale Pinger 3 7 10Banana Whale Pinger 4 7 11
5 Pricing based off a 220 m coil of 22 kg per coil weighted rope.6 Cost of pinger and shipping is US$77.50 based on an exchange rate of AUD 0.89 to one USD7 Based on replacing batteries every 60 days as per manufacturer’s specifications when used 24 hours/day.
This would then require three replacements (@ $7.50) per whale migration season8 Based on replacing batteries every 40 days as per manufacturer’s specifications when used 24 hours/day.
This would then require five replacements (@ $0.60) per whale migration season

62 Fisheries Research Report [Western Australia] No. 267, 2015
4.2.3 Preliminary assessment of acoustic pingers as a by-catch mitigation option for humpback whales in trap fisheries
Some whales were tracked as they approached the locations where arrays were deployed. One pod was located 143 times over 6.4 km during their approach to the array (Figure 31). While in the vicinity the array, some whale pods were located >10 times. These locations, when combined, showed the whales moving either through, around, or deviating away from the pingers (Table 12). All three of these behavioural responses to the array occurred irrespective of the pingers status (Figure 32 & Figure 33).
Figure 31 Location of arrays (closed circles) to the north of Rottnest Island and the tracks (small circles and dashed line) of the initial whale pod that approached the array on 10 October (green), 25 October (red), 27 October (blue) and 30 October (pink and orange).
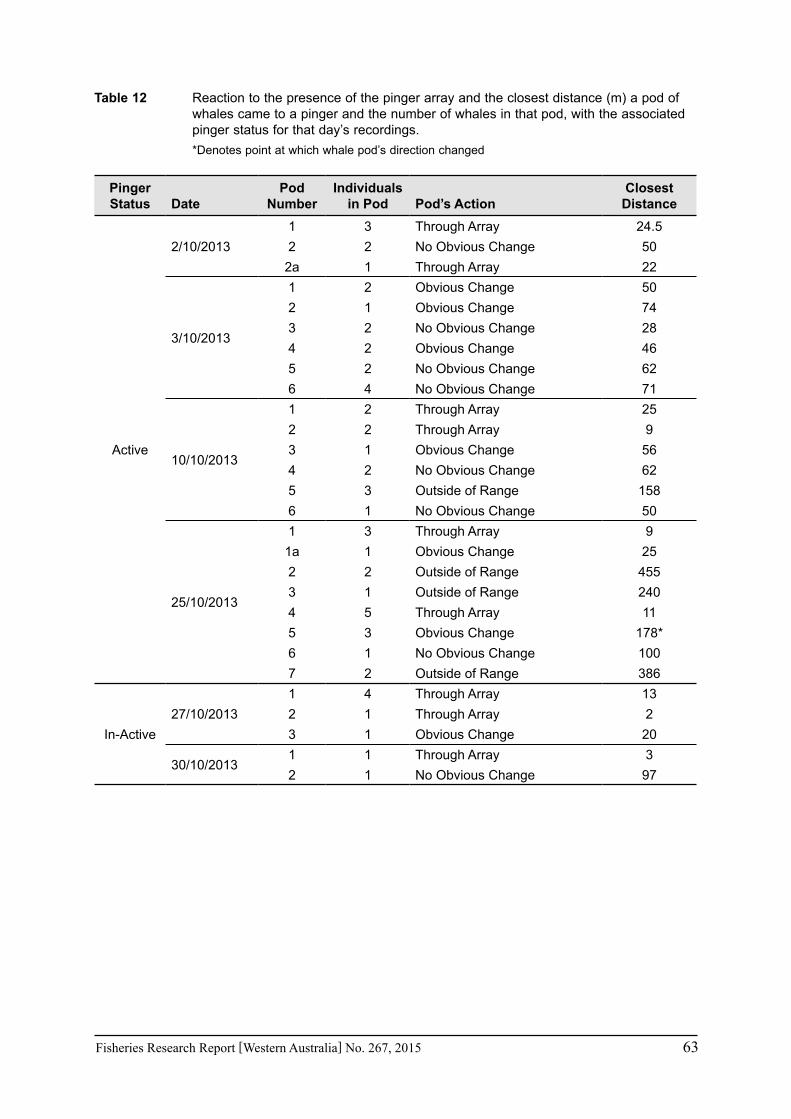
Fisheries Research Report [Western Australia] No. 267, 2015 63
Table 12 Reaction to the presence of the pinger array and the closest distance (m) a pod of whales came to a pinger and the number of whales in that pod, with the associated pinger status for that day’s recordings.
*Denotes point at which whale pod’s direction changed
Pinger Status Date
Pod Number
Individuals in Pod Pod’s Action
Closest Distance
Active
2/10/20131 3 Through Array 24.52 2 No Obvious Change 502a 1 Through Array 22
3/10/2013
1 2 Obvious Change 502 1 Obvious Change 743 2 No Obvious Change 284 2 Obvious Change 465 2 No Obvious Change 626 4 No Obvious Change 71
10/10/2013
1 2 Through Array 252 2 Through Array 93 1 Obvious Change 564 2 No Obvious Change 625 3 Outside of Range 1586 1 No Obvious Change 50
25/10/2013
1 3 Through Array 91a 1 Obvious Change 252 2 Outside of Range 4553 1 Outside of Range 2404 5 Through Array 115 3 Obvious Change 178*6 1 No Obvious Change 1007 2 Outside of Range 386
In-Active27/10/2013
1 4 Through Array 132 1 Through Array 23 1 Obvious Change 20
30/10/20131 1 Through Array 32 1 No Obvious Change 97

64 Fisheries Research Report [Western Australia] No. 267, 2015
Figure 32 Tracks of whale pods through the array of active pingers (closed circles) with their recommended spacing (radius 25 m, light grey) and their ‘detection’ distance of 100 m (beige) for a) 2 October, b) 3 October, c) 10 October and d) 25 October 2013. Polygons represent detections which were recorded within one minute of a previous detection, with coloured closed circles the average position for the pod during that detection period. Triangles and thin arrows indicate position of whales that were observed but not tracked. Numbers associated with ‘A’ and ‘C’ refers to the number of adults and calves respectively in the tracked pod.

Fisheries Research Report [Western Australia] No. 267, 2015 65
Figure 33 Tracks of whale pods through the array of non-active pingers (open circles) with their recommended spacing (radius 25 m, light grey) and their ‘detection’ distance of 100 m (beige) for a) 27 October, b and c) 30 October. Polygons represent detections which were recorded within one minute of a previous detection, with coloured closed circles the average position for the pod during that detection period. Numbers associated with ‘A’ and ‘C’ refers to the number of adults and calves respectively in the tracked pod.

66 Fisheries Research Report [Western Australia] No. 267, 2015
Full data set
Comparisons of proportion of whales which showed no obvious change in direction (moving through or around the array, compared to those which deviated around the array), showed that the proportion was greater for the inactive pingers. The 95% Clopper-Pearson confidence intervals were (0.284, 0.995) for inactive pingers and (0.434, 0.874) for active pingers, indicating no difference in the proportions (Figure 34a). Similarly, the Fisher exact test concluded that there is no significant difference in proportions of whale pods showing no change in direction between active and inactive pingers (p=1), with probabilities of the six 2x2 contingency tables, calculated using hypergeometric probabilities all being less than the probability of the observed table. Finally, the 95% credible intervals for the proportion of whale pods changing direction for the complete data set obtained via MCMC were (0.358, 0.957) for inactive pingers and (0.457, 0.846) for active pingers, indicating no difference in the proportions. This was further supported by the posterior distribution of the difference in proportion obtained using MCMC in WinBUGS and the associated 95% credible interval for the difference in proportions, Pinactive-Pactive calculated as (-0.352, 0.382) (Figure 34c & e). The posterior probability that the proportion of whales changing direction have a higher proportion when pingers are inactive compared to active pinger arrays is 62.2%.
Reduced dataset
Analysis was also conducted on those whale pods which showed a clear interaction with the array. This removed those pods which pass close but not through the array and didn’t deviate in course, leaving those that passed directly through the array and those that obviously changed course. Proportions of whale pods that showed no obvious change (i.e. passed through the array) when compared using Clopper-Pearson confidence intervals indicated no evidence of difference for pinger status (Figure 34b). The Fisher exact test also yielded no significant difference in proportions of whale pods showing no obvious change in direction between active and inactive pinger arrays (p=0.584). The 95% credible intervals obtained via MCMC for the proportion of whale pods changing direction for the reduced data set were (0.283, 0.947) for inactive pingers and (0.252, 0.749) for active pingers, indicating no difference in the proportions. This was further supported by the posterior distribution of the difference in proportion obtained using MCMC in WinBUGS and the associated 95% credible interval for the difference in proportions, Pinactive-Pactive calculated as (-0.289, 0.563) (Figure 34 d & f). The posterior probability that the proportion of whales changing direction have a higher proportion when pingers are inactive compared to active pinger arrays for the reduced data set is 77.4%.
Overall, all three methods of comparing proportions of whale pods showing no change in direction (for the full or reduced data sets) suggest that there is no statistical difference due to pinger activity. However, it is worth noting that there is very weak evidence from the Winbugs analysis that proportions of whale pods showing no change in direction are higher for inactive pingers but would require a greater sample size to determine its statistical significance.

Fisheries Research Report [Western Australia] No. 267, 2015 67
Figure 34 Binomial proportions (with 95% Clopper-Pearson confidence intervals) of whale pods showing no change in direction due to pinger activity for a) all data and b) omitting whale pods that clearly passed around array. Total number of observations for active and inactive pingers is indicated. Mean proportion (with 95% credibility intervals) of whale pods showing no change in direction due to pinger activity using MCMC in WinBUGS for d) all data and e) omitting whale pods that clearly passed around array. Posterior distribution of difference in proportion obtained using MCMC in WinBUGS for e) all data and f) omitting whale pods that clearly passed around array.

68 Fisheries Research Report [Western Australia] No. 267, 2015
4.2.4 Detailed examination of retrieved ropes from dis-entangled whales
Only parts of the 25 recovered rigs that were retrieved from disentangled whales were available for assessments. These consisted predominantly of mainline, header rope and floats (Table 13). Similarly, floats and mainlines were the rig components which were able to be assessed from photographic records of entanglement reports (Table 13). Therefore, comparisons of rig components from entanglement reports to the survey of fishers were limited to the mainline, header and float components.
Table 13 The number of rig components recorded from gear recovered from entangled whales and photographic records of entanglements
Rig Component Rigs Photos Total
Bridal 2 0 2Float 16 74 90Header 14 6 20Join 1 0 1Mainline 20 17 37
Rope Thickness and Type
The majority (94%) of mainline rope used in fishing operations has a thickness of 11 mm (59%) and 12 mm (35%). However, the proportion of different thicknesses in the gear recovered from entangled whales, was significantly different (X2 = Inf, df = 4, p < 0.001) from that recorded in the fisher survey (Figure 35a). Thinner ropes (8 and 10 mm), while only used in <2.5% of fishing operations, accounted for over 40% of rope recovered from entanglements (Figure 35a). Poly Propylene (PP) was the more commonly used mainline accounting for 57% of the vertical lines used (Figure 35a). The proportions of PP and Poly Ethylene (PE) recovered from whale entanglements were not significantly different from their usage (X2 = 0.0754, df = 1, p = 0.784).
Header rope used in the fishery generally had a thickness of 12 mm (43%), with smaller amounts of 11 (27%) and 14 mm (26%) rope also being used (Figure 35b). The proportions of rope recovered from entangled whales were significantly different (X2 = 124.45, df = 5, p < 0.001) from those used in the fishery. As with mainlines (Figure 35a), 8 and 10 mm rope was more commonly recovered from entangled whales than was used in the fishery (Figure 35b).
While PP was more commonly used as a mainline (Figure 35a), PE was the major rope type used in header gear (54%; Figure 35b). However, the vast majority of rigs recovered from entangled whales were constructed of PE, with 80% of entanglements having a PE header line. This resulted in a significant difference between the surveyed and recovered gear types (X2 = 4.1764, df =1, p = 0.04; Figure 35b).
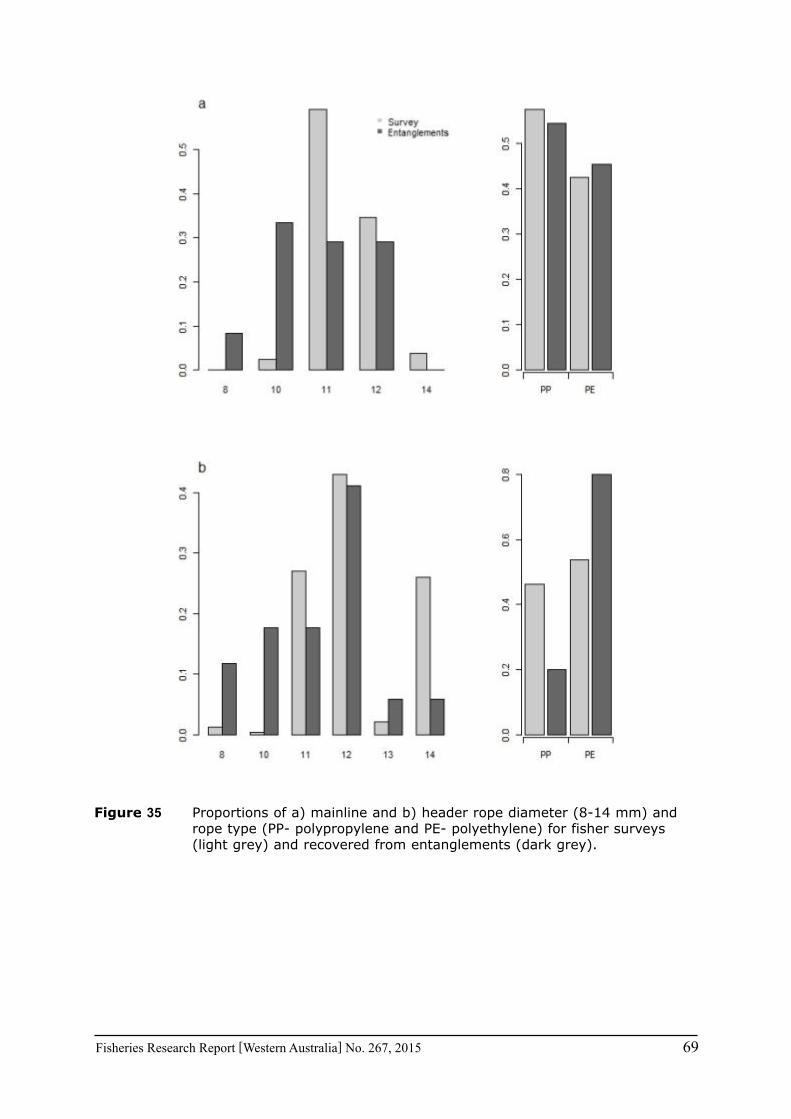
Fisheries Research Report [Western Australia] No. 267, 2015 69
Figure 35 Proportions of a) mainline and b) header rope diameter (8-14 mm) and rope type (PP- polypropylene and PE- polyethylene) for fisher surveys (light grey) and recovered from entanglements (dark grey).
Red marking

70 Fisheries Research Report [Western Australia] No. 267, 2015
Rope Colour
Most commonly used mainline rope colour in the fishery is yellow (>40%), with red, orange, green, pink and blue also contributing between 8-13% (Figure 36a). These colours also featured strongly in the colours of ropes involved in entanglements (Figure 36a). Yellow was again the dominant colour in the ropes of header rigs, with red and black ropes also being used in about 20% of the rigs each (Figure 36b). However, orange rope was almost as prevalent in whale entanglement gear as yellow, while red header rope wasn’t found in any entanglement header gear (Figure 36b). The colours of mainlines associated with entanglements, both from photos or recovered during disentanglement were significantly different from the proportions of mainline colours used in the fishery (Χ2=14.67, df=5, p=0.012; Figure 37a). Clopper-Pearson confidence intervals show that orange ropes are significantly over-represented in entanglements, with the proportion of yellow mainlines associated with entanglements also over-represented compared with its surveyed usage in the fishery (Figure 37a). Similarly, the colours of header ropes which were involved in entanglements were significantly different from those proportions used in the fishery (Χ2=54.56, df=3 p<0.0001; Figure 37b). Orange header ropes were significantly more frequently involved in entanglements than their usage in the fishery would suggest, while red was absent from entanglement despite being used in 19% of header ropes in the fishery (Figure 37b).

Fisheries Research Report [Western Australia] No. 267, 2015 71
Figure 36 Proportion of rope colours surveyed (full colour) and identified from entanglements (hashed colour) for a) mainlines and b) header rigs
Figure 37 Expected proportions of rope colours from fisher survey (full colour) and the observed proportion (black point) with Clopper Pearson confidence intervals for a) mainlines and b) header rigs identified from entanglements

72 Fisheries Research Report [Western Australia] No. 267, 2015
Floats
There was no significant difference (p=0.892) between the distribution of the numbers of float used in header rigs in the fishery and those involved in entanglements (Figure 38). However, it is of note that the proportion of rigs with 3 - 5 floats was higher in entanglements than that was used in the fishery (Figure 38). Due to the large number of possible float configurations, a statistically robust examination between those used in the fishery and those involved in entanglements was not possible. The majority of float rigs used 8” floats and these were also common in entanglements (Figure 38).
Figure 38 Proportions of header rigs from fisher surveys (light grey) and recovered from entanglements for a) number of floats and b) float configurations

Fisheries Research Report [Western Australia] No. 267, 2015 73
5.0 Discussion
5.1 Humpback Whale Migration
The general pattern of humpback migration off the West Australian coast is a northerly migration during May to August and southerly migration from August to November (Chittleborough 1953, 1965, Jenner et al. 2001). This was confirmed through the analysis of the commercial whale watching data. The demarcation between the northern and southern migrations, as expected, was most evident in the southern part of the state, with commercial operations in certain regions only interacting with either the northerly or southerly migration.
Some sexual demarcation in the migration was also evident from the commercial whale watching data. Mothers accompany calves on their southern migration to Antarctica, with calves clearly distinguishable from other demographic groups. Consistent with calving occurring in the states north (Jenner et al. 2001), calves were only evident at those regions which operated during the southern migration and were absent from those interacting with the northern migration. The peak in calves was also later than the general population, indicating that females with calves either leave the states north later than the rest of the population, or as is more likely, they take longer to traverse the state and hence recorded on their southern migration at the south of the state later than the rest of the population.
The commercial whale watching data also provided evidence that there are inter-annual shifts in the timing of the humpback migration. It appears that certain years (e.g. 2012) that the peak in migration along the coast may be up to two – three weeks later than in other years. It should be noted that due to the criteria used to analyse whale migration abundances and timing (i.e. > 50 whales) this is a limited data set. With an increasing whale population, this is likely to improve the number of years and regions that are able to be assessed.
Nonetheless, the later migration of whales on the WA coast in 2012 was mirrored with a later start to entanglements being reported that year. This again was only based on four years where there were more than five entanglements reported, though it does indicate that the timing of the whale migration does impact the timing of when entanglement reports occur. With more years to analyse, this data may provide an adaptive means whereby gear restrictions may be introduced for different months in different years corresponding to the timing of whales migration along the coast in that particular year. This would allow fishers to fish with traditional gear until whale sightings by commercial operators reached a certain point, after which gear modifications or closures may be instigated. While this data has a number of issues to be addressed, analysis of a previously unreported data source may be of future benefit in the mitigation of whale entanglements in commercial fishing gear.
5.2 Increase in whale entanglements
Over the last three seasons (2011-2013) there has been an increase in the number whale entanglement reports off the West Australian coast. Most of these have been attributed to the WRLF. The long-term historic (1990-2010) average for entanglement reports in WRLF is just under two (1.72) entanglement per year. However, the last three seasons (2011-2013) have shown a progressive increase in the number of entanglement reports from none in 2010 to 18 in 2013. There has also been an increase in the number of entanglement reports in the DOF, which until 2009 had not been associated with a reported entanglement, before recording a total 8 entanglement reports by the end of the 2013 migration season.
74 Fisheries Research Report [Western Australia] No. 267, 2015
The increase in WRLF entanglement reports occurred concurrently with an expansion in season length resulting in an increasing temporal-spread in whale entanglements with more entanglements being reported in months that weren’t traditionally fished (July-October). Therefore, it would seem to indicate that the increasing season length was the main cause for the increase in whale entanglement reports. This would logically lead to the re-instigation of the traditional closed season (July-October) as a means to reduce whale entanglements but there would be a significant financial cost to fishers due to the benefit to marketing of spreading the catch throughout the year. However, while returning to the previous season structure would reduce entanglements, it would not eliminate what appears to be an increasing trend in whale entanglement reports.
To better understand the increase in reports of entangled whales there are several factors which need to be considered. For an entanglement to be recorded a whale must become entangled and it must be sighted and reported. However, for a whale to become entangled there needs to be an interaction with the gear. This can be influenced by not only the way and amount the gear is fished, but also the number of animals which can interact with the gear and the reporting rate. This can be considered by the following formula
Ent = qNλ
where: Ent is the number of reported entanglements, q the rate of entanglements, N is the whale population size, and λ the reporting rate. The total number of actual entanglements is Ent qN= with all entanglements reported (i.e. λ = 1).
Whale population size ( N ) will have a profound impact on the entanglement rate. With a greater number of whales moving through fishing grounds, the likelihood of an interaction increases. The West Australian population of humpback whales is increasing at about 10% p/a (Bannister and Hedley 2001, Salgado Kent et al. 2012) and as such, with no change to the rate of entanglements, entanglement reports would be expected to increase at about 10% p/a.
There is some preliminary evidence that the population size is causing an increase in entanglement reports. Firstly, there has been an increase in whale entanglement reports in recent seasons during the traditional (May-June) portion of the WRLF season. It is unlikely that this is solely attributable to the subtle changes in fishing behaviour which have occurred in these months in recent seasons as a result of a change to quota (see below). Historically (1990-2010), the average number of entanglements reported in this part of the season was two (range zero to five). For 2011-2013, the entanglements reported in May-June were four, five and eight respectively. We can examine the effect of an increasing population size on the number reported entanglements with a few assumptions, namely a constant reporting rate (λ) (discussed below) and a conservative initial interaction rate ( q ) such that the population size in 1995 resulted in one entanglement report per year which is half of the number of entanglement reports that occurred in 1995 and 1996. Therefore with a population increase of 10% p/a, the expected number of entanglement reports during the ‘traditional’ part of the last three seasons is what would be expected given the increase in population size ( N ).
Secondly, the entanglement reports involving non-fishing gear have been more frequent in recent years. Since 1990, there have been three entanglement reports that were not in fishing gear. They were in a sea-anchor (2007), data logger (2010) and wave rider buoy (2013). While there is likely to be an increase in the amount of non-fishing gear in the water, it is interesting to note that all of these entanglement reports have come in recent years and may be reflective of the increased entanglements due to a larger number of whales traversing the states coastal waters, as well as greater use of the ocean by other users.

Fisheries Research Report [Western Australia] No. 267, 2015 75
The issue of reporting rate (λ) has been highlighted in other fisheries to illustrate the magnitude of the entanglement problem, which is greater than the number of entanglements which are actually reported. Using photo-recordings and scar analysis, it was estimated that over 83% of North Atlantic right whales were entangled at least once, with some whales being involved up to seven entanglement events (Knowlton et al. 2012). This has resulted in an estimate of entanglements which is 10 times higher than obtained from observations of whales carrying gear. It should be noted that this is a small and consequently well studied population of whales that occurs in an area of high fishing effort.
With regard to the entanglement reporting rate in Western Australia, there is likely to be an increase in entanglement reports. This is driven by recent economic benefits which have afforded the West Australian population generally greater disposable income and greater leisure time associated with fly-in fly-out mining jobs. With more water users, the likelihood of an entangled whale being reported is likely to increase. This change in reporting rate has not been factored into changes to the entanglement rates which have been recorded over recent years.
Instigation of a scar-based photo identification program similar to that used in the North Atlantic (Knowlton et al. 2012) may be of limited benefit for humpback whales off Western Australia. The population of whales off Western Australia was estimated to be over 30 000 humpback whales (Salgado Kent et al. 2012) compared to <500 North Atlantic right whales (Kraus et al. 2014). This provides a several order of magnitude difference in detecting scars, and repeated sighting of individuals. However, to address this, commercial whale watching vessels have been asked to survey for possible scaring (see pg 97 Appendix 4). This will provide a cost-effective means by which possible changes in entanglement scaring can be monitored.
The rate of entanglement ( q ) is the sole factor which can be controlled by management or fishers and is the focus of this report. There are numerous options to effect the interaction rate, with a number of these identified by Lunow et al. (2013) and categorised previously (see pg 22 Methods; Mitigation options identified in industry workshop).
Spatial and temporal closures to fishing during the whale migration were identified as options to reduce whale entanglements. A temporal closure for all pot and line fisheries for the complete duration of the whale migration would be highly effective measures to almost eliminate whale entanglements, though would have a significant (~$50 – 100 million) impact on the fisheries. However, the humpback whale population does not occupy the entirety of the West Australian coast, or even the mid-west coast where fishing occurs, for the entire duration of the migration. As such, there is the potential to institute closures, temporal and spatial, during the migration that protect areas and times of higher potential interaction and permit fishing during low risk times or area.
The predictive spatial model developed as part of this project provides the foundation for the establishment of tailored temporal or spatial closures, or indeed use of gear restrictions. The current models identified relatively narrow ranges in water depth (highest probability between 16 and 28 m) and distance from the coast (highest probability at 10 km) that could indicate specific patterns in the distribution of the whales. This depth range (16-28 m; approx. 10-20 fathoms) of highest probability of occurrence was the depth range with the second highest rate of entanglements where the location of entanglement could be identified (Figure 16b). It is also the depth range where there has been a consistent increase in the fishing effort in the DOF from 2010-2013. During this period the number of entanglement reports in the DOF fishery has increased from one in 2010 to three in 2013.
76 Fisheries Research Report [Western Australia] No. 267, 2015
Spatially, the model identified core areas of higher habitat suitability (>0.7 probability of occurrence). These were; Jurien south to Lancelin, offshore of Perth and Fremantle and offshore of the Cape Range near Exmouth. When the locations of known entanglements were examined spatially, there were a number of entanglement reports which were identified to occur between Jurien and Lancelin (Figure 26). There were also entanglement reports in octopus gear off Fremantle (Figure 26), which was an area of expanding effort in the DOF fishery (Figure 28).
Whilst the predictive spatial model is based on presence only data from a single coast-wide survey in 1993 (Jenner et al. 2001), it does highlight the value of the model in providing a cost-effective approach for informing on the relationship between the distribution and environmental features for humpback whales along the West Australian west coast. The identification of important geographical and environmental data which concurs with entanglement and effort data not assessed in the model highlights the applicability and importance of future modelling of humpback whale movement.
There are several means by which the spatial model can be improved, namely more structured sighting data with known sampling effort, more contemporary data and validated by extrapolating the results of the movements of a small number of tagged whales to the greater population. The re-running of this spatial habitat model has been highlighted as an area of future research (see pg 87 Recommendations; Re-run spatial analysis with increased data availability) highlighting how these additional data sources are to be collected and incorporated into the model re-run. Finally the spatial habitat model used data combined form both the northern and southern migrations, and thus produced an average distribution map of migrating whales over these two periods The behaviour of whales during these two migrations is thought to be quite different (D. Coughran pers. comm.). Future refinement of the model will be aimed at producing separate models for the two migrations as additional suitable data becomes available.
Temporally, there appears to be differences in the time that humpback whales occupy the west coast of Western Australia. The apparent late arrival of humpbacks on the coast in 2012 from commercial whale watching data from Augusta (Figure 18) corresponded to a later first record of whale entanglement recorded in 2012 (Figure 11). With variation in the timing of whale migrations being evident from commercial whale watching and possibly entanglement records, there is the possibility to tailor closures to periods when whales occupy the southern part of the state where fishing activities occur. Commercial whale watching data will continue to be assessed annually and ultimately compared to environmental conditions around Antarctica, with a view to establishing any possible environmental cue to the migration (see pg 88 Recommendations; Environmental cues for the initiation of humpback whale migration from Antarctica). Should such a cue to be identified, future management may choose to use this as a means by which to establish any temporal closures or temporal components to gear restrictions.
Most of the gear which could be examined from entanglement reports were mainlines, float and header rigs. Thinner ropes (8 and 10 mm) were statistically over-represented in the entanglement reports compared to their surveyed use in the fishery. The thinner ropes may be involved in entanglements at a greater rate than thicker ropes for several reasons. Thinner rope is less rigid that thicker rope, providing the ability to tangle far easier as the rope bends over the whale. Also, thinner (and hence lighter in weight) rope may provide less of a tactile cue that the whale has come in contact with the rope. Therefore it may take less evasive action, or longer to instigate evasive action, resulting in more time for the rope to become entangled.
Finally, thinner rope, due to its diameter may be less visible with a thicker rope providing a greater area of cross section with which it can be observed. The visibility of the rope may also
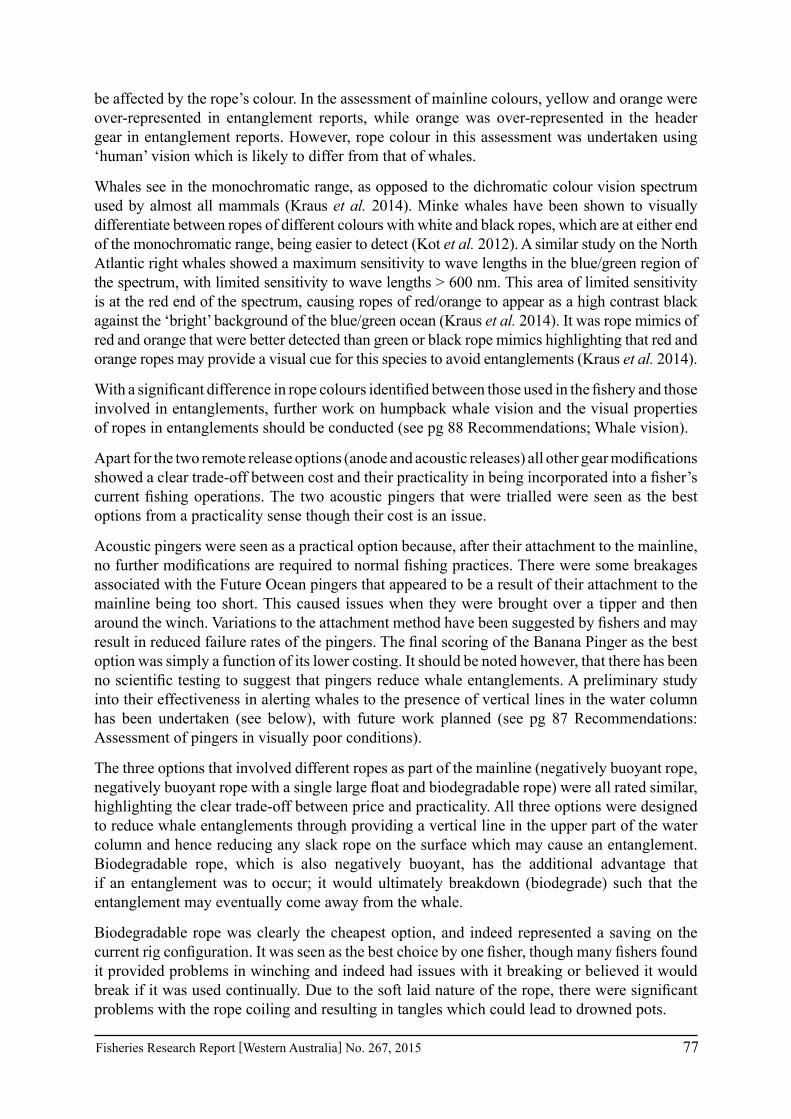
Fisheries Research Report [Western Australia] No. 267, 2015 77
be affected by the rope’s colour. In the assessment of mainline colours, yellow and orange were over-represented in entanglement reports, while orange was over-represented in the header gear in entanglement reports. However, rope colour in this assessment was undertaken using ‘human’ vision which is likely to differ from that of whales.
Whales see in the monochromatic range, as opposed to the dichromatic colour vision spectrum used by almost all mammals (Kraus et al. 2014). Minke whales have been shown to visually differentiate between ropes of different colours with white and black ropes, which are at either end of the monochromatic range, being easier to detect (Kot et al. 2012). A similar study on the North Atlantic right whales showed a maximum sensitivity to wave lengths in the blue/green region of the spectrum, with limited sensitivity to wave lengths > 600 nm. This area of limited sensitivity is at the red end of the spectrum, causing ropes of red/orange to appear as a high contrast black against the ‘bright’ background of the blue/green ocean (Kraus et al. 2014). It was rope mimics of red and orange that were better detected than green or black rope mimics highlighting that red and orange ropes may provide a visual cue for this species to avoid entanglements (Kraus et al. 2014).
With a significant difference in rope colours identified between those used in the fishery and those involved in entanglements, further work on humpback whale vision and the visual properties of ropes in entanglements should be conducted (see pg 88 Recommendations; Whale vision).
Apart for the two remote release options (anode and acoustic releases) all other gear modifications showed a clear trade-off between cost and their practicality in being incorporated into a fisher’s current fishing operations. The two acoustic pingers that were trialled were seen as the best options from a practicality sense though their cost is an issue.
Acoustic pingers were seen as a practical option because, after their attachment to the mainline, no further modifications are required to normal fishing practices. There were some breakages associated with the Future Ocean pingers that appeared to be a result of their attachment to the mainline being too short. This caused issues when they were brought over a tipper and then around the winch. Variations to the attachment method have been suggested by fishers and may result in reduced failure rates of the pingers. The final scoring of the Banana Pinger as the best option was simply a function of its lower costing. It should be noted however, that there has been no scientific testing to suggest that pingers reduce whale entanglements. A preliminary study into their effectiveness in alerting whales to the presence of vertical lines in the water column has been undertaken (see below), with future work planned (see pg 87 Recommendations: Assessment of pingers in visually poor conditions).
The three options that involved different ropes as part of the mainline (negatively buoyant rope, negatively buoyant rope with a single large float and biodegradable rope) were all rated similar, highlighting the clear trade-off between price and practicality. All three options were designed to reduce whale entanglements through providing a vertical line in the upper part of the water column and hence reducing any slack rope on the surface which may cause an entanglement. Biodegradable rope, which is also negatively buoyant, has the additional advantage that if an entanglement was to occur; it would ultimately breakdown (biodegrade) such that the entanglement may eventually come away from the whale.
Biodegradable rope was clearly the cheapest option, and indeed represented a saving on the current rig configuration. It was seen as the best choice by one fisher, though many fishers found it provided problems in winching and indeed had issues with it breaking or believed it would break if it was used continually. Due to the soft laid nature of the rope, there were significant problems with the rope coiling and resulting in tangles which could lead to drowned pots.
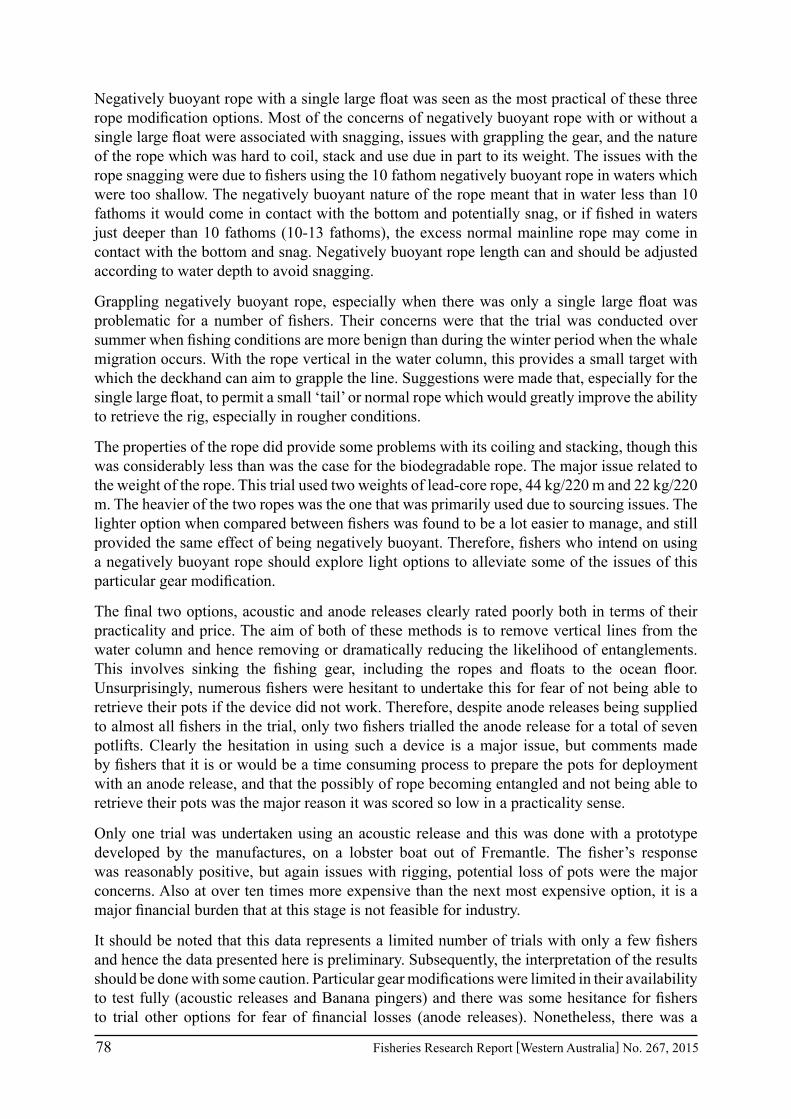
78 Fisheries Research Report [Western Australia] No. 267, 2015
Negatively buoyant rope with a single large float was seen as the most practical of these three rope modification options. Most of the concerns of negatively buoyant rope with or without a single large float were associated with snagging, issues with grappling the gear, and the nature of the rope which was hard to coil, stack and use due in part to its weight. The issues with the rope snagging were due to fishers using the 10 fathom negatively buoyant rope in waters which were too shallow. The negatively buoyant nature of the rope meant that in water less than 10 fathoms it would come in contact with the bottom and potentially snag, or if fished in waters just deeper than 10 fathoms (10-13 fathoms), the excess normal mainline rope may come in contact with the bottom and snag. Negatively buoyant rope length can and should be adjusted according to water depth to avoid snagging.
Grappling negatively buoyant rope, especially when there was only a single large float was problematic for a number of fishers. Their concerns were that the trial was conducted over summer when fishing conditions are more benign than during the winter period when the whale migration occurs. With the rope vertical in the water column, this provides a small target with which the deckhand can aim to grapple the line. Suggestions were made that, especially for the single large float, to permit a small ‘tail’ or normal rope which would greatly improve the ability to retrieve the rig, especially in rougher conditions.
The properties of the rope did provide some problems with its coiling and stacking, though this was considerably less than was the case for the biodegradable rope. The major issue related to the weight of the rope. This trial used two weights of lead-core rope, 44 kg/220 m and 22 kg/220 m. The heavier of the two ropes was the one that was primarily used due to sourcing issues. The lighter option when compared between fishers was found to be a lot easier to manage, and still provided the same effect of being negatively buoyant. Therefore, fishers who intend on using a negatively buoyant rope should explore light options to alleviate some of the issues of this particular gear modification.
The final two options, acoustic and anode releases clearly rated poorly both in terms of their practicality and price. The aim of both of these methods is to remove vertical lines from the water column and hence removing or dramatically reducing the likelihood of entanglements. This involves sinking the fishing gear, including the ropes and floats to the ocean floor. Unsurprisingly, numerous fishers were hesitant to undertake this for fear of not being able to retrieve their pots if the device did not work. Therefore, despite anode releases being supplied to almost all fishers in the trial, only two fishers trialled the anode release for a total of seven potlifts. Clearly the hesitation in using such a device is a major issue, but comments made by fishers that it is or would be a time consuming process to prepare the pots for deployment with an anode release, and that the possibly of rope becoming entangled and not being able to retrieve their pots was the major reason it was scored so low in a practicality sense.
Only one trial was undertaken using an acoustic release and this was done with a prototype developed by the manufactures, on a lobster boat out of Fremantle. The fisher’s response was reasonably positive, but again issues with rigging, potential loss of pots were the major concerns. Also at over ten times more expensive than the next most expensive option, it is a major financial burden that at this stage is not feasible for industry.
It should be noted that this data represents a limited number of trials with only a few fishers and hence the data presented here is preliminary. Subsequently, the interpretation of the results should be done with some caution. Particular gear modifications were limited in their availability to test fully (acoustic releases and Banana pingers) and there was some hesitance for fishers to trial other options for fear of financial losses (anode releases). Nonetheless, there was a

Fisheries Research Report [Western Australia] No. 267, 2015 79
clear trade-off in price and practicality for the gear tested, providing various options for fishers depending on their personal preference in the price-practicality options examined.
With acoustic pingers being ranked very highly among the gear modifications trialled, an initial effectiveness trail of pingers as a gear modification to reduce entanglements was conducted.
There was no significant effect measured of the pinger status on the behaviour of humpback whales within the area around the array. The vast majority of whales tracked continued to move on their original course either through or around the array with no apparent effect of the pinger being active or not. This indicates that the pingers were not effective in causing an obvious response in humpback whale movements. This was despite the array having two pingers on each vertical line, twice that recommended by the manufacturer, and a mean spacing of 40 m, which is 10 m less than the maximum recommended pinger spacing and well within the detection range of these pingers for humpback whales (Erbe and McPherson 2012). This is similar to the response found when testing the same acoustic pinger on humpback whales’ behaviour on Australia’s east coast, where humpback whale tracks were not significantly different in the presence of an active or inactive pinger (Harcourt et al. 2014). However, it should be noted that for both of these studies it does not mean that the pingers are ineffective in alerting the whales to the presence of fishing gear.
The pingers used in this study were not of the range whereby an adverse reaction may occur following the criteria of acoustic harassment devices being of a greater output than 150 dB re 1µP @ 1 m (Dawson et al. 2013), with the Future Ocean F3 having a power output of 135 dB re 1µP @ 1 m (Erbe and McPherson 2012). Therefore, while there was no significant difference in whale behaviour depending on pinger activity, an obvious deviation around the array as a response to an active pinger may not be the behavioural response the pinger is designed to achieve. As the pingers sound output level is designed to alert the whale to the presence of gear, it may use visual cues to negotiate between the lines in the array. Therefore, movements around the array and through the array may equally demonstrate that a pinger is serving to alert the whale to the fishing gear and thereby avoid it.
Pingers tested on migrating humpbacks on the east coast of Australia did result in a reduction in swimming velocity when they were in the vicinity of an active pinger (Harcourt et al. 2014). The reduced swimming speed may in fact be an alert response elicited by the pinger, whereby the whales slows to determine the source of the noise and thereby noting the location of ropes in the water. A similar slowing in swimming speed was noted in Minke whales as they approached a series of vertical lines which simulated fishing gear, though no pingers were present on these lines (Kot et al. 2012). It was proposed that acoustic cues created by water movement past ropes in a moderate to strong currents aided whales negotiate around fishing lines (Kot et al. 2012). They also noted that visual cues from white and black ropes which are at either end of the monochromatic range in which whales see (Kraus et al. 2014) were better detected by Minke whales, though these colours effectiveness for other whale species required further testing (Kot et al. 2012).
In total, 22 whales moved through the array and produced no interaction with the modified fishing gear, with six of these negotiating the array when there were no pingers active to alert the whale to their presence. Whales were also sighted moving through actively fishing commercial rock lobster gear without interaction with the fishing gear which had no gear modifications or pingers attached. Due to the ‘alerting’ nature of the pingers, and whales’ ability to move through an array of vertical lines with or without pingers, demonstrates that pingers may be most effective in periods of either low visibility or when the whale is not fully ‘conscious’ to its

80 Fisheries Research Report [Western Australia] No. 267, 2015
surrounds. Some cetacean species have been shown to have unihemispheric slow wave sleep, whereby half of the brain is asleep (Lyamin et al. 2002). It is during these periods of potentially reduced consciousness that pingers may serve to alert the whale of fishing gear in the area, though it was noted that unihemispheric sleep may still permit monitoring, particularly visual monitoring of the environment (Lyamin et al. 2002). Despite alerting a whale to the presence of gear, it is unlikely that all entanglements are the result of an inability to detect the fishing gear, and rather may be the result of attraction to the gear for play or for feeding (Lien et al. 1992).
Despite an increase in whale entanglement reports in Western Australia, the rate of entanglement in WRLF gear is still low, at approximately five entanglement reports per 106 rope days. Therefore, to establish if pingers are effective with such a low entanglement rate, large scale experiments are required or intensive targeted surveys of pinger properties and whales responses to them, including underwater acoustic recordings. A whole of industry trial would be needed to test pingers, which could be prohibitively expensive. While pingers may be an effective entanglement mitigation device, they would require considerably more testing. Also, other mitigation options which can provide acoustic and visual cues should also be examined. Future work is currently being planned to address this (see pg 87 Recommendations; Assessment of pingers in visually poor conditions). This will provide a more robust assessment of acoustic pingers as a possible mitigation device to reduce whale entanglements in trap fisheries.
Entanglements of large cetaceans have been a long-standing issue in the United States of America, and in particular the north-east of the country. This area has seen conflicting water use between several fisheries and a number of large cetacean species, leading to considerable research on whales, the fishing industry and the ways to reduce their interactions. The dominant conflict, and the one of most relevance to the pot and line based fisheries interacting with humpback whales off the West Australian coast, is between the North Atlantic right whale (NARW) and the lobster fisheries of the north-east USA, predominantly the Maine Rock Lobster Fishery. This section represents a synopsis of relevant research that has been conducted on this issue, as well as insights gained from interviews and practical experience with researchers, industry bodies, managers and fishers working in Maine and surrounding area, gained as part of a two week trip to North Carolina, Massachusetts and Maine in May 2014.
The NARW populations is endangered and thought to currently comprise around 400-500 individuals (Kraus et al. 2014), and is experiencing a very slow population recovery. The population migrate long the USA’s eastern seaboard from calving and breeding grounds in Florida and the Caribbean to the feeding grounds in the north-east USA (Kraus et al. 2005). Their low population size, and slow rate of recovery has resulted in this population of right whales being classified as ‘Endangered’ by the IUCN (http://www.iucnredlist.org/details/41712/0; accessed 21 October 2014). One proposed reason for the slow recovery of the population is due to interactions and entanglements with the commercial fishing gear in the north-east USA.
The dominant fishery in the north-east USA is the pot based fishery targeting Homarus americanus in Massachusetts and Maine. Using plastic coated wire traps, fishers target the clawed lobster by setting the pots as either singles, double or long lines. Long lines can be fished with up to 20 pots which are connected by a ground line, and are commonly used in deeper water, and heavily congested (high fishing effort) areas. Pot densities in this fishery have the potential to be staggeringly large. There are over 5000 licenses for lobster fishing in Maine and 1000 which appear to land quantities that would constitute full time fishing. With most full time fishers having 800 pots, this results in a conservatively estimate of 800 000 pots which may be fished in the fishery at peak times. Therefore, the use of long lines with two end lines

Fisheries Research Report [Western Australia] No. 267, 2015 81
marking up to 20 pots, serves to reduce the number of end (vertical) lines in the fishery.
The mechanism for the instigation of gear modification into the lobster fishery has been the on-set of litigation – law suits of the Federal fisheries regulators (NMFS) on behalf of the ‘whales’ by environmental non-government organisations (ENGOs). The first legal action resulted in the introduction of a ‘weak link’ with a maximum breaking stain of 600 lbs. Weak links are designed to break if a whale becomes entangled. Being located just below the float (Plate 1), they break permitting the float to come free, and the knotless attachment pass through the point of whale entanglement.
Plate 1 Two different types of weak links used in the Maine Lobster Fishery
As the fishery is located in the feeding grounds of the NARW, entanglements often involve baleen in the mouth. The entanglement usually begins to be exacerbated when the float comes into contact with the baleen. Therefore, by having a weak link below the float, the link should break, allowing the float to pop back out one side of the baleen and the rope continue to pull through the baleen, and hopefully result in the entanglement being removed. It is believed that the instigation of this gear modification was in response to one particular entanglement report involving the situation described above where a float became lodged in the baleen.
The next gear modification to be introduced into the fishery was sinking groundlines in 2009. Due to long lining with a normal rope which is positively buoyant, underwater loops would form as the rope floated into the water column between pots. This provided a potential point of entanglement as whales swam close to the bottom (Figure 39). Through instigating a negatively buoyant (sinking) groundline, these mid-water loops would be eliminated.

82 Fisheries Research Report [Western Australia] No. 267, 2015
Figure 39 Diagrammatic representation of floating groundlines in the Maine Lobster Fishery and how they may serve to entangle humpback whales (©Centre for Coastal Studies)
Replacement of the original positively buoyant groundline with the mandatory sinking groundline required a changeover of significant amounts of gear. This was a costly exercise, though was mitigated by a buy-back program which was instituted by the Gulf of Maine Lobster Foundation. This is where fishers could have their existing ropes purchased back at $1.40 per pound to partially assist in the purchase of the new sinking groundlines.
Finally, there is to be an introduction of a vertical line strategy into the fishery which is due to be introduced in June 2015. This aims to regulate the minimum ‘trawl’ (a long line of pots) lengths in certain areas, hence reducing the number of vertical lines. With a reduction in the number of vertical lines, similar to what has been suggested in the WRLF and DOF it reduces the number of likely entanglement points within an area.
There have been other measures which have been introduced into the fishery to assist in understanding the nature of entanglements. As gear identifiers on floats and pots are likely to be lost as part of the entanglement process, a colour marking system was introduced. The rope colouring system will assist in the identification of gear from different regions along the US north-eastern seaboard, with each region having a different colour located at the top, middle and bottom of their mainlines (Plate 2).
Fisheries Research Report [Western Australia] No. 267, 2015 83
Plate 2 Colour marking (red) on the mainline of lobster gear signifying it was from the northern management areas of the fishery
There have been gear modifications introduced into the NE Lobster Fishery and the lobster fishery for Sagmariasus verrauxi in New South Wales that have been implemented into the fisheries to reduce pot losses to other vessels, that may assist in reducing whale entanglements. In NE USA, fishers use a negatively buoyant top to their mainline resulting in no surface rope. There is also a limit on the number of floats that are used, with most operations using a single float, while in areas of very strong currents, two floats are used however are connected by negatively buoyant rope (Plate 3). The elimination of surface rope and fewer larger floats were tested as part of the gear trials in this study with the benefits to reduced whale entanglements explained previously (see pg 57 Results; Gear modifications to reduce whale entanglement rates or subsequent disentanglement).

84 Fisheries Research Report [Western Australia] No. 267, 2015
Plate 3 Float rig used in Cutler (NE Maine) showing the two buoy system used due to the strong current conditions. There is no floating line between the buoys
Acoustic releases, which were scored so unfavourably in this study (Table 11) were assessed in the New South Wales Eastern Rock Lobster (NSWERL) fishery. The FRDC project (2012/504) “Tactical Research Fund: industry-extension of acoustic release technology for at-call access to submerged head-gear in the NSW rocklobster fishery” examined the design and operating characteristics of the Desert Star ARC-1XD acoustic release system to help address the loss of pots through shipping and theft. The NSWERL fishery uses large traps which have longer set times. This contrasts markedly with the fishing styles of the WRFL where a typical vessel has approximately 100 pots which would be pulled every 2-3 days. Therefore, the magnitude of effort and pots makes what is a viable option in the NSWERL fishery, currently impractical in the WRLF.

Fisheries Research Report [Western Australia] No. 267, 2015 85
6.0 Conclusion
This project objectives (i. Start to collect additional information required to determine the spatial and temporal extent of migrating whales and how this overlaps with commercial fishing gear; ii. Examine the effectiveness of potential gear modifications to the float rigs of fishing pots/traps to reduce their likelihood of entangling whales) have been met. However, the actual effectiveness of various mitigation measures in reducing entanglements is being examined as part of FRDC 2014-004.
There were a range of findings from this project which have management implications to reduce humpback whale entanglements in commercial fishing gear off the west coast of West Australia.
• There is temporal variation in the peak abundances of whales sighted during commercial whale watching activities which shows a good initial relationship with the onset of whale entanglement reports
• The release of a whale sightings logbook and followed by an ‘App’ has provided an avenue for increased spatial data collection on humpback whale migration
• A preliminary predictive habitat model has highlights a range of depths, and distances from the coast which show high predictive measures for whale presence
• Several preliminary areas of high probability of occurrence were identified through the spatial model: the central coast (Jurien-Lancelin), offshore of Fremantle and Cape Range (Exmouth)
• An increase in entanglement reports in the DOF may be a result of increasing effort through the central coast and in the 10-19 fathom range where whales are more likely to occur
• The increase in entanglement reports in the WRLF is more complex, as it has generally been associated with a decrease in effort levels, though an extension to the season length
• WRLF entanglement reports in the ‘traditional’ part of the season (May & June) have increased in-line with an increase in the whale population size
• Assessment of a range of gear modifications highlighted, with the exception of remote releases, that there is a clear trade-off between price and practicality for a number of gear modifications to reduce whale entanglements.
• An initial assessment of the acoustic pingers as a mitigation device for humpback whales was inconclusive due to the trials being conducted under optimal conditions for visual identification of the vertical lines
• Rope reported to be involved in entanglements was thinner than was expected from surveys of fishers’ gear, and yellow and orange ropes were disproportionately involved in entanglements compared to their use in industry
• International gear modifications appear to have limited applicability to mitigation options for the WRLF and DOF with the possible exception of sinking groundlines in the DOF fishery
This project has highlighted several promising avenues for reducing whale entanglements in commercial fishing gear off the west coast of Western Australia. However, due to the tactical nature of the project, not all research areas were able to be fully explored and future work should focus on some of these areas (see pg 87 Recommendations).

86 Fisheries Research Report [Western Australia] No. 267, 2015
7.0 Implications
This project has significant implication for managers and fishers alike for both the WRLF and DOF. However, due to the worldwide issue of whale entanglements, and the numerous pot and line fisheries which have the possibility of interacting with them, the findings of this research could be more far-reaching than the two fisheries that were the focus of this project.
In the re-assessment of the WRLF by the federal government environmental department (Department of the Environment; DE), the fishery was granted a wildlife trade operation, with five conditions related to whale entanglements (see pg 108 Appendix 9). In response to this, and subsequent correspondence from the DE to the West Australian Department of Fisheries, fishers were informed that without approved gear modifications, fishing may not be permitted during the whale migration period (see pg 110 Appendix 10). This would essentially represent a seasonal closure which was estimated at between $50-100 million to the WRLF.
As a result, the outcomes of the research conducted in this project, gear modifications were introduced into the WRLF and DOF in June 2014. Their introduction provided the approved measures by which fishing could continue year round. The rationale for the selection of the gear modifications which was introduced is as follows.
Acoustic or anode releases were not introduced due to their expense and impracticality as highlighted by the gear survey (see pg 59 Results; Pilot trials of gear modifications that may mitigate entanglements with whales) which were conducted. Acoustic pingers were also seen as an expensive options and with no conclusive proof as to their effectiveness in reducing entanglements (see pg 62 Results; Preliminary assessment of acoustic pingers as a by-catch mitigation option for humpback whales in trap fisheries), gear modifications focusing on rope and float modifications were ultimately adopted.
Whilst there were some practicality issues associated with the use of negatively buoyant rope, the gear modification requirements were structured such that there was a need for a removal of slack line of the surface. This enabled fishers to try various options more suited to their mode of fishing operations and still accomplish the same result of no surface line. Similarly, the additional cost for single large floats, and some issues with grappling lines lead to fishers being able to use their existing float rigs, though with constraints on their number such that there was a reduction on the amount of floats, and float line on the surface.
This project, by it’s tactical nature was able to provide initial advice for gear modification for the 2014 season, hence meeting the federal government conditions on the fishery. As such the fishery maintained access to the winter fishing market during the 2014 season, and potentially beyond pending the results of the 2014 industry gear trial, which is worth between $50-100 million per year. It should also be noted, that the nature of the project precluded the ability to test the effectiveness of the adopted gear modifications on reducing whale entanglements. This will be the focus of FRDC 2014-004

Fisheries Research Report [Western Australia] No. 267, 2015 87
8.0 Recommendations
This project was designed to provide preliminary advice on potential gear modifications that could be incorporated into the fishery for the 2014 whale migration season, and compile existing data and initiate new data streams to better understand the migration of humpback whales off the West Australian coast. Therefore, it was well outside the scope of the project to provide definitive data on either gear modification or spatial and temporal dynamics of whale migration. This TRF project has been continued by a FRDC project (2014-004 “Mitigation measures to reduce entanglements of migrating whales with commercial fishing gear”) which is aimed at addressing the following objectives
• Determine and implement appropriate gear modifications to reduce entanglements with migrating humpback whales
• Produce fine-scale spatial and temporal information on whale migrations along the west coast of Western Australia necessary for a tailored spatio-temporal closures and/or areas for gear modifications.
• Provide clear scientific methods behind the testing of selected gear modifications to reduce whale entanglements
• Incorporate any new practices that may reduce entanglements with migrating whales in the CoP for the fishery and ensure its extension and adoption
Some of these aspects have been identified below as areas of future development, though there are additional areas of development which have been subsequently identified through the process of this project
8.1 Further development
Assessment of effectiveness of currently trialled gear modifications
The gear modifications that have been introduced for the 2014 migration season require assessment as to their effectiveness in reducing whale entanglements. This will be assessed as part of FRDC 2014-004.
Assessment of pingers in visually poor conditions
Predominantly pingers for baleen whaled, including in this project, have been assessed under good visibility conditions. As highlighted previously, pingers as an alert to reduce whale entanglements are most likely to be effective under poor light / visibility conditions. This will be assessed as part of FRDC 2014-004.
Re-run spatial analysis with increased data availability
This project was tasked with the creation of the new data sources informing on whale migrations. While these have occurred (see pg 42 Results; Initiate collection of additional spatial and temporal information through a whale sighting logbook and ‘app’), they are limited in terms of data due to their recent creation. As additional data becomes available from Whale Sighting WA, and also through satellite tracking of whales as part of FRDC 2014-004, it will provide valuable additional data against which to model whale movements and potential interactions with fishing activities. This modelling is necessary to inform decisions as to possible future spatial or temporal alterations to fishing activities or gear restrictions.

88 Fisheries Research Report [Western Australia] No. 267, 2015
Environmental cues for the initiation of humpback whale migration from Antarctica
The changes in the arrival of peak abundances of humpback whales at Augusta identified through commercial whale watching logbooks, provides a means by which the migration cues of humpback whales can be identified. Further years of data will permit robust comparisons between years of potential environmental correlates with humpback migration. This will give the potential to predict the likely time of arrival of the bulk of the humpback whale population and instigate possible management actions to mitigate entanglements.
Whale vision
This project, and FRDC 2014-004 are examining the possibility of utilising one of the whales primary senses, hearing, to aide in the reduction of entanglements through acoustic pingers. However, vision has been identified previously as a possible means by which whales may identify ropes in the water column, with different species appearing to having different sensitivities to rope colours (Kot et al. 2012, Kraus et al. 2014). The significantly different rope proportions in entanglements compared to their use in the fishery highlights that vision could be an important aspect in entanglements.
If humpback whales have a similar visual sensitivity to the North Atlantic right whales (Kraus et al. 2014), the over-representation of yellow and orange ropes may represent humpback whales actively targeting ropes. This is a belief held by fishers that whales seek out ropes to scratch. However, should the visual sensitivity be different for humpback whales, it may indicate that these colours are less visually detectable and may be the reason for their over representation in entanglements. This could therefore highlight rope colours which may be more visually detectable for humpback whales and hence reduce whale entanglements.
Modelled dynamics of entanglements through computer simulation.
There are now numerous images of whale entanglements taken as part of disentanglement attempts (Plate 4). However, the mechanism by which the entanglement occurred is as yet unknown. Vital information such as the point of first contact (where in the water column) the interaction occurs, the functioning of slack line or float rigs in the entanglement are unable to be adequately understood. Understanding the dynamics of entanglements is important as current gear management is focused around alterations to gear configurations (e.g. subsurface slack line through a negatively buoyant top to the mainline and reductions to float numbers).
Plate 4 Two images of ropes involved in humpback whale entanglements

Fisheries Research Report [Western Australia] No. 267, 2015 89
Work by Dr Laurens Howle (Duke University/Bellequant Engineering) has resulted in a computer simulation model developed to ‘reverse engineer’ entanglements. Through the use of a Xbox 360 ™ controller, an anatomically correct model of a North Atlantic right whale can be ‘flown’ into fishing gear. The fishing gear is modelled such that the breaking strain, rope diameter and specific gravity and can replicate these in the model. Through altering the whale’s behaviour using the controller, entanglements (such as shown in Plate 4) can be replicated, and thereby understand the dynamics and contributing factors to the entanglements. This will provide vital information on how future gear modifications may impact on entanglement rates, or indeed severity.
Preliminary discussions with Dr Howle regarding the predominantly peduncle entanglements seen in humpback whales off Western Australia may be the result of the whale seeing the rope but turning and hitting the rope at 90o and then getting wrapped in the tail or by a body and pectoral wrap, with the pectoral wrap getting free before sliding down the whale to the tail. This modelling would complement work on whale vision to start to understand the dynamics of an entanglement and how simple gear modifications may reduce overall entanglement rates.
One example of this is the possibility of using biodegradable rope within the fishing rig to cause the entanglement to break-free should a whale become entangled. It is not clear though, where the biodegradable component of the rig should be situated or indeed the length required allowing the biodegradable component to completely free the whale. Computer modelling would provide a great insight into both of these questions.
Biodegradable rope times
Biodegradable ropes were seen as a positive gear modification that could be incorporated into the WRLF and vertical lines of the DOF. Its negatively buoyant nature, and capacity to breakdown serves two purposes. By being negatively buoyant it reduces slack rope on the surface, and by being biodegradable it will breakdown should it be involved in an entanglement.
However, to be effective, the rope must breakdown in such a time as to remove the entanglement before it becomes fatal, but also last such a time as to be practical for the fishers. Mortalities from entanglements can occur with free swimming whales by four months (Moore et al. 2006), though there are several reports of humpback whales off the West Australian coast which may have had entanglements which are approximately 12 months old. Therefore there is the capacity for a rope which degrades over several months to be used such that it is practical for fishers and effective in removing whale entanglements.
To accomplish this, trials need to be conducted on the duration of biodegradable rope to degrade such that entanglements will release, but also their durability in commercial fishing operations.

90 Fisheries Research Report [Western Australia] No. 267, 2015
9.0 Extension and Adoption
The results of this project have been disseminated to industry, government and other scientists through a range of forums. Industry has been presented the information numerous times at annual coastal tour meetings for the WRLF, at AGMs and professional fisherman’s forums at several locations along the coast as well as presentations to the board of the Western Rock Lobster Council.
Presentations to scientists have occurred as part of a trip to the north-east USA where the issue of whale entanglements is a significant one on an endangered population. Also informal presentations have occurred with researchers in Perth which has resulted in the release of their spatial and temporal information on whale migrations for inclusion in the analysis for this report.
Informal discussions have occurred with managers as results came to hand, but were also communicated to state and federal managers at Ministerial Whale Entanglement Taskforce meetings which occurred throughout the project. The communications of these results to the taskforce resulted in the implementation of a range of gear mitigation measures that were introduced during the 2014 whale migration season.
9.1 Project coverage
There has been considerable media coverage of the issue of whale entanglements off the West Australian coast of which, reference to this project has been made. However, specific media coverage of this project has primarily been attributed to the release of the Whale Sighting WA app. An indication of the media coverage is provided in Figure 20.

Fisheries Research Report [Western Australia] No. 267, 2015 91
10.0 Project materials developed
‘Whale Sightings WA’
This is an iPhone application that was developed by Spatial Vision as part of this project. It has been outlined in Results; Initiate collection of additional spatial and temporal information through a whale sighting logbook and ‘app’ and an illustration of the screen flow for the app can be found in Figure 6. To view/download this app, simply search for Whale Sighting WA on the App Store.
How & Coughran
A journal note has been submitted to Marine Mammal Science “Impact of entanglements in fishing gear on the movement patterns of migrating humpback whales off the Western Australian coast” and dealt with the change in movement patterns associated with entangled whale compared to the general population
Logbooks
Two logbooks were either developed or modified as part of these projects, for either Whale Sightings or Commercial Whale Watching. They are included in Appendix 3 and Appendix 4 respectively
92 Fisheries Research Report [Western Australia] No. 267, 2015
11.0 ReferencesBannister JL, Hedley SL. 2001. Southern hemisphere Group IV humpback whales: their status from
recent aerial surveys. Memoirs of the Queensland Museum 47: 587–598.
Bannister JL. 1980. Report on aerial survey for humpback whales off Western Australia, 1980. 9.
Bannister JL. 1991. Report on aerial survey for humpback whales Western Australia 1991. 9.
Chittleborough R. 1953. Aerial Observations on the Humpback Whale, Megaptera nodosa (Bonnaterre), with Notes on Other Species. Marine and Freshwater Research 4: 219–228.
Chittleborough R. 1965. Dynamics of two populations of the humpback whale. megaptera no vaeangliae (borowski). Australian Journal of Marine and Freshwater Research 1964: 33–128.
Dawson S, Northridge S, Waples D, Read A. 2013. To ping or not to ping: the use of active acoustic devices in mitigating interactions between small cetaceans and gillnet fisheries. Endangered Species Research 19: 201–221.
Elith J, Phillips SJ, Hastie T, Dudı´k M, Chee YE, Yates CJ. 2010. A statistical explanation of MaxEnt for ecologists. Diversity and Distributions 1–5.
Erbe C, McPherson C. 2012. Acoustic characterisation of bycatch mitigation pingers on shark control nets in Queensland, Australia. Endangered Species Research 19: 109–121.
Ersts PJ, Rosenbaum HC. 2003. Habitat preference reflects social organization of humpback whales (Megaptera novaeangliae) on a wintering ground. Journal of Zoology 260: 337–345.
Fielding AH, Bell JF. 1997. A review of methods for the assessment of prediction errors in conservation presence/absence models. Environmental Conservation 24: 38–49.
Groom, C. J., & Coughran, D. K. (2012). Entanglements of baleen whales off the coast of Western Australia between 1982 and 2010 : patterns of occurrence , outcomes and management responses. Pacific Conservation Biology, 18, 203–214.
Gulesserian M, Slip D, Heller G, Harcourt R. 2011. Modelling the behaviour state of humpback whales Megaptera novaeangliae in response to vessel presence off Sydney, Australia. Endangered Species Research 15: 255–264.
Harcourt R, Pirotta V, Heller G, Peddemors V, Slip D. 2014. A whale alarm fails to deter migrating humpback whales: an empirical test. Endangered Species Research 25: 35–42.
Hart A, Murphy D, Joll L, Walters S, Pickles L. 2014. Octopus Fishery Status Report. In: WJ Fletcher and K Santoro, editor. Status Reports of the Fisheries and Aquatic Resources of Western Australia 2013/14: The State of the Fisheries Perth: Department of Fisheries, Western Australia. p. 98–102.
Hasan K, Rahman M, Haque A. 2009. Cost effective GPS-GPRS based object tracking system. Proceedings of the International Multi Conference of Engineers and Computer Scientists I: .
Van der Hoop JM, Moore MJ, Barco SG, Cole TVN, Daoust P-Y, Henry AG, McAlpine DF, McLellan W a, Wimmer T, Solow AR. 2013. Assessment of management to mitigate anthropogenic effects on large whales. Conservation Biology 27: 121–33.
Jenner KCS, Jenner MM, McCabe KA. 2001. Geographical and temporal movements of humpback whales in Western Australian waters. Appea Journal 2001: 749–765.
Johnson A, Salvador G, Kenney J, Robbins J, Kraus SD, Landry S, Clapham P. 2005. Fishing gear involved in entanglements of right and humpback whales. Marine Mammal Science 21: 635–645.
Johnston DW, Chapla ME, Williams LE, Mattila DK. 2007. Identification of humpback whale Megaptera novaeangliae wintering habitat in the Northwestern Hawaiian Islands using spatial habitat modelling. Endangered Species Research 3: 249–257.
Knowlton A, Hamilton P, Marx M, Pettis H, Kraus S. 2012. Monitoring North Atlantic right whale Eubalaena glacialis entanglement rates: a 30 yr retrospective. Marine Ecology Progress Series 466: 293–302.

Fisheries Research Report [Western Australia] No. 267, 2015 93
Knowlton AR, Kraus SD. 2001. Mortality and serious injury of northern right whales (Eubalaena glacialis ) in the western North Atlantic Ocean. 193–208.
Kot BW, Sears R, Anis A, Nowacek DP, Gedamke J, Marshall CD. 2012. Behavioral responses of minke whales (Balaenoptera acutorostrata) to experimental fishing gear in a coastal environment. Journal of Experimental Marine Biology and Ecology 413: 13–20.
Kraus SD, Brown MW, Caswell H, Clark CW, Fujiwara M, Hamilton PK, Kenney RD, Knowlton AR, Landry S, Mayo CA, Mclellan WA, Moore MJ, Nowacek DP, Pabst DA, Read AJ, Rolland RM. 2005. North Atlatic Right Whales in Crisis. Science 561–562.
Kraus SD, Fasick J, Werner T, McFarron P. 2014. Enhancing the Visibility of Fishing Ropes to Reduce Right Whale Entanglements. 67–75.
De Lestang S, Caputi N, How J, Melville-Smith R, Thomson A, Stephenson P. 2012. Stock assessment for the west coast rock lobster fishery. 200.
De Lestang S, Rossbach M, Baudains G, Trinnie F. 2014. West Coast Rock Lobster Fishery Status Report. In: WJR Fletcher and K Santoro, editor. Status Reports of the Fisheries and Aquatic Resources of Western Australia 2013/14: The State of the Fisheries Perth: Department of Fisheries, Western Australia. p. 32–41.
Lien J, Barney W, Todd S, Seton R, Guzzwell J. 1992. Effects of Adding Sounds to Cod Traps on the Probability of Collisions by Humpback Whales. In: J Thomas, R Kastelein, and A Supin, editor. Marine Mammal Sensory Systems SE - 43 Springer US. p. 701–708.
Lunow CP, Tucek M, Harrison J. 2013. Western Australian Fishing Industry Council Inc. and Western Rock Lobster Council Inc., Western Rock Lobster Fishery and Developmental Octopus Fishery Whale Interaction Mitigation Workshop, 12 February 2013, Hillary’s Research Centre. 20.
Lyamin OI, Mukhametov LM, Siegel JM, Nazarenko E a, Polyakova IG, Shpak O V. 2002. Unihemispheric slow wave sleep and the state of the eyes in a white whale. Behavioural brain research 129: 125–9.
Moore M, Bogomolni A, Bowman R, Hamilton P, Harry C, Knowlton A, Landry S, Rotstein D, Touhey K. 2006. Fatally entangled right whales can die extremely slowly. Oceans 2006 4: 1–3.
Oviedo L, Solís M. 2008. Underwater topography determines critical breeding habitat for humpback whales near Osa Peninsula, Costa Rica: implications for marine protected areas. Revista de Biología Tropical 56: 591–602.
Phillips SJ, Anderson RP, Schapire RE. 2006. Maximum entropy modeling of species geographic distributions. Ecological Modelling 190: 231–259.
Rasmussen K, Palacios DM, Calambokidis J, Saborı´o MT, Rosa LD, Secchi ER, Steiger GH, Allen JM, Stone GS. 2007. Southern Hemisphere humpback whales wintering off Central America: insights from water temperature into the longest mammalian migration. Biology Letters 3: 302–305.
Salgado Kent C, Jenner C, Jenner M, Bouchet P, Rexstad E. 2012. Southern Hemisphere Breeding Stock D humpback whale population estimates from North West Cape , Western Australia. Journal of Cetacean Research Management 12: 29–38.
Smith JN, Grantham HS, Gales N, Double MC, Noad MJ, Paton D. 2012. Identification of humpback whale breeding and calving habitat in the Great Barrier Reef. Marine Ecology Progress Series 447: 259–272.
Spiegelhalter D, Thomas A, Best N, Lunn D. 2002. WinBUGS Version 1.2 User manual 1.5. .
Whiteway TG. 2009. Australian Bathymetry and Topography Grid. .
Wiley EO, McNyset KM, Peterson AT, Robins CR, Stewart AM. 2003. Niche modeling and geographic range predictions in the marine environment using a machine-learning algorithm. Oceanography 16: 120–127.
Wright DJ, Pendleton M, Boulware J, Walbridge S, Gerlt B, Eslinger D, Sampson D, Huntley E. 2012. ArcGIS Benthic Terrain Modeler. .
Zar J. 2010. Biostatistical Analysis. New Jersey, USA: Pearson Prentice Hall Inc.
94 Fisheries Research Report [Western Australia] No. 267, 2015
Appendices
Appendix 1
Staff List
Jason How Department of Fisheries, WADouglas Coughran Department of Parks and Wildlife, WAJoshua Smith Murdoch UniversityMichael Double Australian Antarctic DivisionJohn Harrison West Australian Fishing Industry CouncilJohn McMath Western Rock Lobster CouncilBenjamin Hebiton Department of Fisheries, WAAinslie Denham Department of Fisheries, WA

Fisheries Research Report [Western Australia] No. 267, 2015 95
Appendix 2
Original Commercial Whale Watching Logbook (Example)

96 Fisheries Research Report [Western Australia] No. 267, 2015
Appendix 3
Paper based whale sighting logbook

Fisheries Research Report [Western Australia] No. 267, 2015 97
Appendix 4
Modified Commercial Whale Watching Logbook

98 Fisheries Research Report [Western Australia] No. 267, 2015
Appendix 5
Whale Entanglement Gear Trial (Pilot)
Thank you for offering to be a part of the trial testing various gear types to reduce the likelihood of whale entanglements. Your feedback on how this gear can be incorporated into your normal fishing activities is very important, and will be communicated to the rest of industry. While your name will be acknowledged for the help you have provided in trialling the gear, the individual scores that you give for each question on each gear type will be combined with all other fishers in the trial, so your actual score is not known to all of industry
How the trial should run
You will be given a sample of each of five possible gear modifications that were identified during the whale entanglement mitigation workshop run by WAFIC and the WRLC in February 2013. The options are:
1. Negatively buoyant rope (10 fathoms) with a large Polyform ™ float
2. Negatively buoyant rope (10 fathoms) with normal floats
3. Biodegradable rope (10 fathoms)
4. Anode Releases (2 or 3 day release times)
5. Acoustic Pingers (White and Yellow)
All options should be incorporated into your normal fishing operations. For example where 10 fathoms of experimental rope is provided, please attach this to the top of your normal rope and adjust the overall rope length to adjust for the depth you are fishing in. For options two and three, please use your current float configurations, and option five, attach the pingers to your mainline approximately five meters underwater. There is a separate information sheet on how you may wish to use the anode release, though if you can devise a simpler measure please give it a go and let us know.
Ideally we would like you to fish with this gear as you do your normal gear for approximately two weeks. After this time we will contact you to get the gear off you and also the survey form.
The Survey form
This is a way for you to quickly tell us how you think the gear performed as part of your normal fishing operations. Any comments would be greatly appreciated so we can pass them onto other fishers in the trial.
Thank you once again for your help in hopefully finding a simple and cost-effective measure to reduce whale entanglements in the fishery.
Kindest Regards,
Jason How Research Scientist – Rock Lobster November 2013

Fisheries Research Report [Western Australia] No. 267, 2015 99
YOUR PACK OF GEAR SHOULD INCLUDE:
• An instruction sheet on how to possibly use anode releases
• Gear survey form (to be filled at the end of the trial)
• 5 Red Polyform floats
• 10 lots of 10 fathom negatively buoyant rope These are to be used as such:
• 5 lots of 10 fathom rope with 5 Polyform floats
• 5 lots of 10 fathom rope with your normal header gear
• 5 lots of 10 fathom sisal (biodegradable)
• 5 white whale pingers
• 1 yellow whale pinger
• 25 (5 pots for 5 pulls) anode release
Potential attachment method for whale pingers to mainline
Lay the cord through the trap rope main line until the cord is exhausted (minimum of six tucks)
Note: Leave bitter end of tail of the cord inside the trap rope main line.
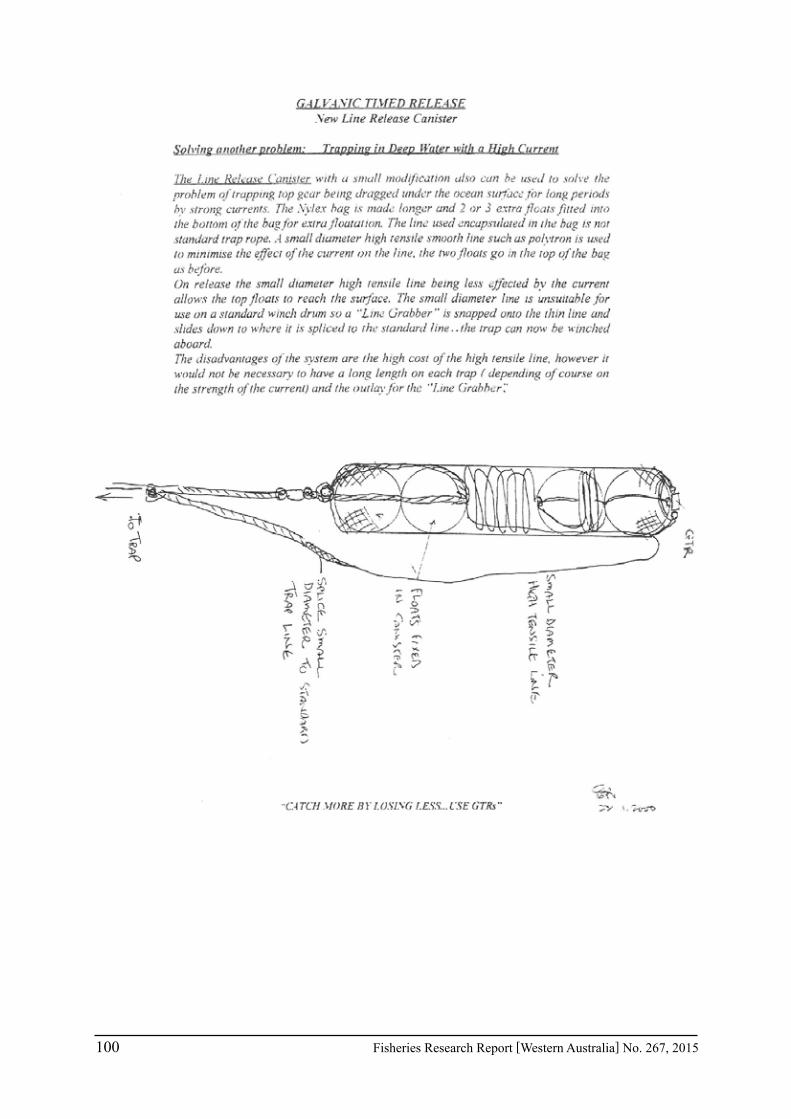
100 Fisheries Research Report [Western Australia] No. 267, 2015

Fisheries Research Report [Western Australia] No. 267, 2015 101
Appendix 6
Whale Entanglement Gear Trial Questionnaire
Whale Entanglement Mitigation – Gear TrialPlease circle where appropriate
Name _____________________________ Mobile # __________________________ LFB _____________________
Anchorage________________________ Dates Fishing ___________________ Depth Range (fms) ___________
Negatively Buoyant Rope with Polyform FloatsTotal number pulls during trial_________________ Number lost pots______________
How difficult was the experimental gear to: Harder → Easierinclude in your normal fishing operations? 1 2 3 4 5grapple? 1 2 3 4 5winch? 1 2 3 4 5coil on deck? 1 2 3 4 5stack? 1 2 3 4 5set? 1 2 3 4 5
Do you think the modified gear affected catch? Improved Reduced No Effect
Comments: ______________________________________________________________
Negatively Buoyant Rope
Total number pulls during trial_________________ Number lost pots______________
How difficult was the experimental gear to: Harder → Easierinclude in your normal fishing operations? 1 2 3 4 5grapple? 1 2 3 4 5winch? 1 2 3 4 5coil on deck? 1 2 3 4 5stack? 1 2 3 4 5set? 1 2 3 4 5
Do you think the modified gear affected catch? Improved Reduced No Effect
Comments: ______________________________________________________________
Biodegradable Rope
Total number pulls during trial_________________ Number lost pots______________
How difficult was the experimental gear to: Harder → Easierinclude in your normal fishing operations? 1 2 3 4 5grapple? 1 2 3 4 5winch? 1 2 3 4 5coil on deck? 1 2 3 4 5stack? 1 2 3 4 5set? 1 2 3 4 5
Do you think the modified gear affected catch? Improved Reduced No Effect
Comments: ______________________________________________________________

102 Fisheries Research Report [Western Australia] No. 267, 2015
Anode Release
Total number pulls during trial_________________ Number lost pots______________
How difficult was the experimental gear to: Harder → Easierinclude in your normal fishing operations? 1 2 3 4 5grapple? 1 2 3 4 5winch? 1 2 3 4 5coil on deck? 1 2 3 4 5stack? 1 2 3 4 5set? 1 2 3 4 5
Do you think the modified gear affected catch? Improved Reduced No Effect
Comments: ______________________________________________________________
Yellow Pingers
Total number pulls during trial_________________ Number lost pots______________
How difficult was the experimental gear to: Harder → Easierinclude in your normal fishing operations? 1 2 3 4 5grapple? 1 2 3 4 5winch? 1 2 3 4 5coil on deck? 1 2 3 4 5stack? 1 2 3 4 5set? 1 2 3 4 5
Do you think the modified gear affected catch? Improved Reduced No Effect
Comments: ______________________________________________________________
White Pingers
Total number pulls during trial_________________ Number lost pots______________
How difficult was the experimental gear to: Harder → Easierinclude in your normal fishing operations? 1 2 3 4 5grapple? 1 2 3 4 5winch? 1 2 3 4 5coil on deck? 1 2 3 4 5stack? 1 2 3 4 5set? 1 2 3 4 5
Do you think the modified gear affected catch? Improved Reduced No Effect
Comments: ______________________________________________________________
General comments: (e.g. difficulties experienced with gear / alternative suggestions) __________ _______________________________________________________________________________________________________________________________________________________________________________________________________________________________________________________________________________________________________________________________________________________

Fisheries Research Report [Western Australia] No. 267, 2015 103
Appendix 7
Gear survey sent to fishers
Western Rock Lobster and Octopus Gear Survey
Background
As you are no doubt aware there has been a large increase in the number of whale entanglements in commercial fishing gear. As a result there is a need to fish with some gear modifications during the next whale migration season (2014). This project is aiming to establish the most cost effective gear modifications that can be implemented to allow fishers to fish year round, whilst still reducing whale entanglements.
We have examined 25 fishing rigs that have been removed from entangled whales. As part of this process we looked at a range of factors such as the colour, thickness and type of rope, number of floats and how they are attached amongst others factors. What we are now looking to do, is see if there is something about the rigs that we have cut free from the whales that is different from what is normally being fished. Therefore, we need to know how you rig your fishing gear.
We are asking as many fishers as possible to fill out the survey to enable us to understand how fishers construct their pot rigs across the fishery. This may enable us to find a very simple method (e.g. change the way floats are tied on, or use a different rope colour etc.), that may reduce the whale entanglement rate. This of course would be a very cost effective measure compared to a number of other options that are currently on the market.
The Survey
There a series of questions that we would like you to answer regarding your gear. There is space for three options, so if you fish with a number of different gear types within a category then there is the option to record this. To establish if some aspects of the gear are over-represented in the gear from dis-entangled whales, we need an estimate of what proportion of your gear has each or any of the options. If you are unclear of what we are looking for, please call me (92030247). For some of the categories, there are a number of common options which we have identified. These are pictured below the relevant questions. If you fish with option that is not identified there, please note down what you fish with.
While this survey may be an inconvenience, it potentially may highlight a very simple and inexpensive change to the way that you fish, which will allow you to fish freely during the whale migration period.
Thank you for your help and I look forward to getting your survey back
Cheers
Jason How
Research Scientist - Rock Lobster

104 Fisheries Research Report [Western Australia] No. 267, 2015
Name
Boat LFB
Phone Number
Number of Pots fished during winter May to November (number in the water, not entitlement) Depths Fished during winter (i.e. >10fm 80% 10-20fm 20%)
0 – 10 fm 11 – 20 fm 20 + fm % % %
Mainline Rope Type (Polypropylene (PP), Polyetheylyne (PE)
PP PE Other (specify)
% gear with this rope type % % % Rope Thickness mm mm mm % ropes with this rope thickness % % % Colour (main colour of rope) % ropes with this colour % % % Does this change often due to what suppliers have in stock? Yes/No
Joins (between) Join between two mainlines Standard Eyed Standard Other (specify) % ropes with this join % % % Join between mainline and header gear Standard Eyed Standard Other (specify) % ropes with this join % % % Standard Knot: A pot knot (Double Sheet Bend) through an eye splice
Eyed Standard Knot A pot knot (Double Sheet Bend) using an eye spliced end, through an eye splice

Fisheries Research Report [Western Australia] No. 267, 2015 105
Header Rig Rope Type (Polypropylene (PP), Polyetheylyne (PE)
PP PE Other
% ropes with this rope type % % % Rope Thickness mm mm mm % ropes with this rope thickness % % % Colour (main colour of rope) % ropes with this colour % % %
Float Rigs Depth Range Number of floats of each type used in each rig by depth.
Number of Oblong 8" (200mm) 130mm 110mm
<10fm
10-20fm
20-30fm
30fm+
Oblong 8” 130mm 110mm
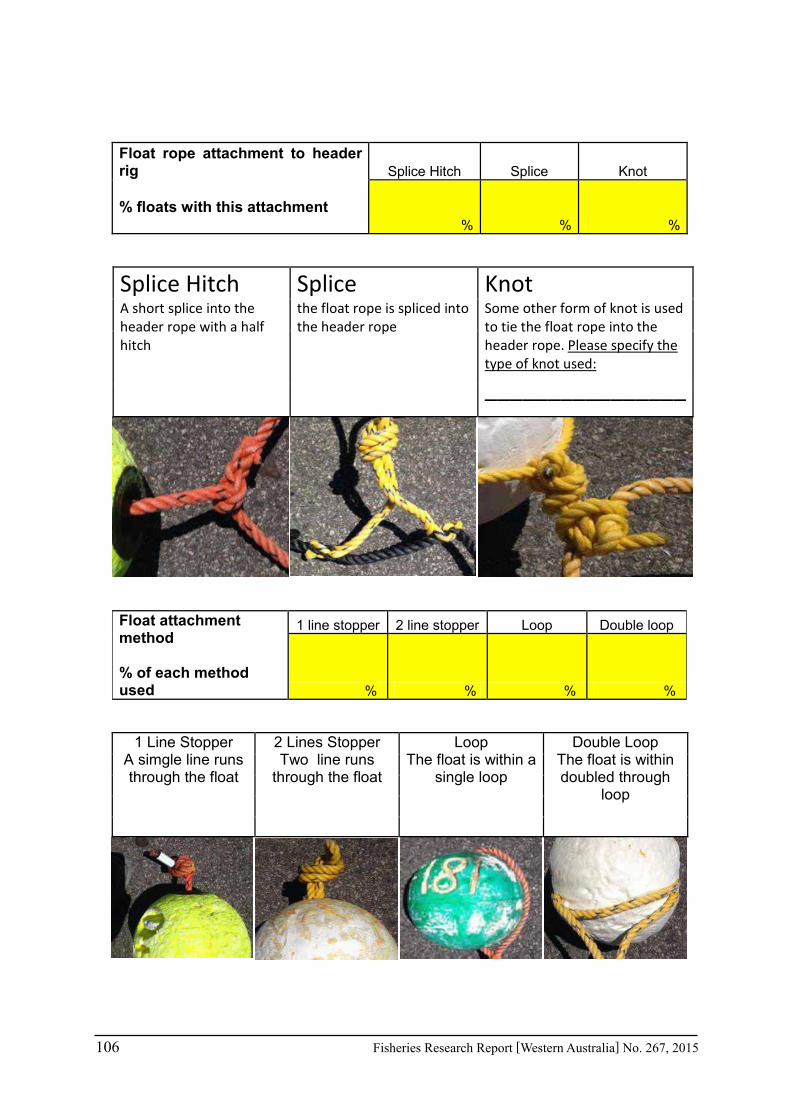
106 Fisheries Research Report [Western Australia] No. 267, 2015
Float rope attachment to header rig Splice Hitch Splice Knot
% floats with this attachment % % %
Splice Hitch A short splice into the header rope with a half hitch
Splice the float rope is spliced into the header rope
Knot Some other form of knot is used to tie the float rope into the header rope. Please specify the type of knot used:
________________
Float attachment method % of each method used
1 line stopper 2 line stopper Loop Double loop
% % % %
1 Line Stopper A simgle line runs through the float
2 Lines Stopper Two line runs
through the float
Loop The float is within a
single loop
Double Loop The float is within doubled through
loop

Fisheries Research Report [Western Australia] No. 267, 2015 107
Appendix 8
Updated Code of Practice for the Western Rock Lobster Fishery

108 Fisheries Research Report [Western Australia] No. 267, 2015
Appendix 9
Conditions on the Western Rock Lobster Fishery

Fisheries Research Report [Western Australia] No. 267, 2015 109

110 Fisheries Research Report [Western Australia] No. 267, 2015
Appendix 10
Letter from Department of Fisheries Regarding Whale Mitigation Measures
Fisheries Research Report [Western Australia] No. 267, 2015 111

112 Fisheries Research Report [Western Australia] No. 267, 2015