Assessment of startup period at coal-fired electric generating units
19
1 Assessment of startup period at coal‐fired electric generating units U.S. Environmental Protection Agency, Office of Air and Radiation Peter Kokopeli, Jeremy Schreifels, Reynaldo Forte June 17, 2013 1. Purpose This analysis explores the time and gross load levels (electricity generation as a percentage of nameplate capacity) that may be needed for coal‐fired electric generating units (EGUs) to control emissions with air pollution control devices (APCDs). The analysis uses historical electric output, heat input, and emission data from 2011 and 2012 as indicators to assess operation of APCDs at coal‐fired EGUs. This information can aid in determining the end of startup and start of pollution control at coal‐fired EGUs. Abbreviations APCD air pollution control device(s) mmBtu million British thermal units (unit of energy) CFB circulating fluidized bed – boiler type MW megawatt(s) – one million watts CO 2 carbon dioxide NO X nitrogen oxides EGU electric generating unit PC pulverized coal – boiler type EPA (U.S.) Environmental Protection Agency SCR selective catalytic reduction – NO X control FGD flue gas desulfurization – SO 2 and acid gases control SO 2 sulfur dioxide Definitions Emission rates: average mass emissions (in pounds) released per million British thermal unit (mmBtu) of heat input Failed start: a startup event in which the EGU begins combusting fossil fuel and subsequently ceases combusting fossil fuel without generating any electricity. Failed starts may be planned or unplanned, and often occur when bringing a plant online after a maintenance outage. Normal start: a startup event in which the EGU begins combusting fossil fuel and generates some measurable amount of electricity before ceasing fossil fuel combustion. Startup event: initiation of fossil fuel combustion at an EGU following one or more hours of non‐operation (i.e., no combustion) Hot start a : A startup event in which the EGU was offline for 24 hours or less before starting to combust fossil fuels Warm start a : A startup event in which the EGU was offline for 25 ‐ 119 hours before starting to combust fossil fuels Cold start a : A startup event in which the EGU was offline for 120 hours or more before starting to combust fossil fuels a Hot, warm, and cold starts are defined using turbine metrics presented in Lefton SA and Hilleman D, 2011. Make Your Plant Ready for Cycling Operation. Power Magazine. August 1. (http://www.powermag.com/issues/features/Make‐Your‐Plant‐Ready‐ for‐Cycling‐Operations_3885.html).
Transcript of Assessment of startup period at coal-fired electric generating units
1
Assessment of startup period at coal‐fired electric generating units
U.S. Environmental Protection Agency, Office of Air and Radiation
Peter Kokopeli, Jeremy Schreifels, Reynaldo Forte
June 17, 2013
1. Purpose
This analysis explores the time and gross load levels (electricity generation as a percentage of nameplate
capacity) that may be needed for coal‐fired electric generating units (EGUs) to control emissions with air
pollution control devices (APCDs). The analysis uses historical electric output, heat input, and emission data
from 2011 and 2012 as indicators to assess operation of APCDs at coal‐fired EGUs. This information can aid in
determining the end of startup and start of pollution control at coal‐fired EGUs.
Abbreviations
APCD air pollution control device(s) mmBtu million British thermal units (unit of energy)
CFB circulating fluidized bed – boiler type MW megawatt(s) – one million watts
CO2 carbon dioxide NOX nitrogen oxides
EGU electric generating unit PC pulverized coal – boiler type
EPA (U.S.) Environmental Protection Agency SCR selective catalytic reduction – NOX control
FGD flue gas desulfurization – SO2 and acid gases control SO2 sulfur dioxide
Definitions
Emission rates: average mass emissions (in pounds) released per million British thermal unit (mmBtu) of heat input
Failed start: a startup event in which the EGU begins combusting fossil fuel and subsequently ceases combusting
fossil fuel without generating any electricity. Failed starts may be planned or unplanned, and often occur
when bringing a plant online after a maintenance outage.
Normal start: a startup event in which the EGU begins combusting fossil fuel and generates some measurable amount
of electricity before ceasing fossil fuel combustion.
Startup event: initiation of fossil fuel combustion at an EGU following one or more hours of non‐operation (i.e., no
combustion)
Hot starta: A startup event in which the EGU was offline for 24 hours or less before starting to combust fossil
fuels
Warm starta: A startup event in which the EGU was offline for 25 ‐ 119 hours before starting to combust
fossil fuels
Cold starta: A startup event in which the EGU was offline for 120 hours or more before starting to combust
fossil fuels a Hot, warm, and cold starts are defined using turbine metrics presented in Lefton SA and Hilleman D, 2011. Make Your Plant
Ready for Cycling Operation. Power Magazine. August 1. (http://www.powermag.com/issues/features/Make‐Your‐Plant‐Ready‐
for‐Cycling‐Operations_3885.html).

2
2. Introduction
EPA received several comments concerning our definition of the end of startup in response to the proposed
reconsideration for the Mercury and Air Toxics (MATS) Rule. Several commenters advocated that the startup
period should not end when the EGU begins generating electricity or useful thermal energy as EPA proposed.
Rather, commenters argued that startup should end at different times depending on whether the unit was
subcritical or supercritical, and what types of controls were installed. Commenters stated that some APCDs,
such as SCR, need up to 12 hours after electricity generation begins before they become operational. They also
stated that CFB units become stable only after they reach approximately 40 percent load.
EPA examined available data concerning the types of EGUs on which the commenters focused: subcritical and
supercritical units with FGD and SCR, and CFB units. This assessment required an hour‐by‐hour analysis of
startup events using emissions, heat input, and electric output data from the EPA’s Clean Air Markets
Database1 for the types of units identified by the commenters. Using this data, we calculated the average time,
in hours, for specific types of units to achieve decile and quartile load bins (e.g., 10%, 20% and 25% of
nameplate capacity) and for SO2 and NOx APCDs to begin reducing SO2 and NOx emission rates, respectively.
This analysis offers insights into the startup process and the time required for SO2 and NOx APCDs to become
effective at coal‐fired EGUs. EPA believes that the removal efficacy of APCDs, as evidenced by hourly emission
rates well below uncontrolled levels, may be used as an indicator of the end of the startup period for the
purpose of the MATS rule.
3. Data and methodology
EPA collects the emission data analyzed in this paper under 40 CFR §75 (Part 75).2 Most fossil fuel‐fired EGUs
report hourly emissions (e.g., SO2, NOX, CO2) and operations (e.g., operating time, heat input, gross electricity
generation) data on a quarterly basis.3 We used these data to identify all startup events at 414 PC EGUs with
FGD and/or SCR APCDs and CFB boiler EGUs4 during calendar years 2011 and 2012.
The purpose of this paper is to assess commenters’ claims that there are performance differences among
combustion technologies and APCDs as they relate to startup events. In light of the comments received and to
facilitate this assessment, we examined operating data by boiler type (PC supercritical, PC subcritical and CFB
boilers) and control type. For SO2 emissions, we examined PC boilers with FGD and CFB units. For NOX
emissions, we examined PC supercritical and PC subcritical boilers with SCR.
We excluded cogeneration units from this analysis because adequate steam production data were not
available. In addition, because the focus of the analysis is on the performance of the APCDs, coal‐fired EGUs
1 The aggregated data set used in this analysis is included in the docket EPA‐HQ‐OAR‐2009‐0234; full data are available from the Clean Air Markets Database at http://ampd.epa.gov/ampd. 2 Supercritical boiler type is drawn from EIA form 860 and EPA research. The analysis data set noted above includes this field. Form 860 (2011) data are available at http://www.eia.gov/electricity/data/eia860/index.html. 3 Sources report data at the monitor (stack) level but this study used data apportioned to the unit. For more information about Part 75, see the Plain English Guide to the Part 75 Rule at www.epa.gov/airmarkets/emissions/docs/plain_english_guide_part75_rule.pdf. 4 CFB boiler technologies are capable of controlling SO2 by injecting limestone in the combustion bed. For purposes of this paper, a CFB boiler is considered an SO2 APCD.

3
without FGD and/or SCR APCDs as of January 1, 2011, were excluded from the analysis.5 Finally, we excluded
data during operating hours with the most conservative substitute data (i.e., maximum potential concentration,
maximum potential flow)6 because these data may not be true representations of emissions.
For purposes of conducting this analysis, we defined a startup event as the initiation of fossil fuel combustion
following one or more hours of non‐operation (i.e., no combustion), which is consistent with the proposed
definition of startup in the MATS reconsideration notice. For each startup event, we calculated the following
values:
Number of non‐operating hours prior to the startup event (i.e., hours between previous cessation of
combustion and start of combustion).
Number of hours between start of combustion and start of electricity generation.7
Gross electricity generation as a percent of nameplate capacity by hour following start of generation.
Emission rates and heat input by hour after start of combustion and start of electricity generation.
For “normal” startup events – when an EGU begins generating electricity following the start of fossil fuel
combustion – we calculated hourly emission rates, time to achieve specific gross load levels (e.g., 10%, 20%
and 25% of nameplate generating capacity), and hourly emission rates after achieving specific gross load levels
(e.g., 25% of nameplate capacity).
4. Results
During calendar years 2011 and 2012, there were 9,719 distinct startup events (see Table 1)8 – 9,467 at PC
EGUs and 252 at CFB EGUs. Of these startup events, 2,147, or approximately 20%, were “failed” starts – a
startup event in which an EGU begins combusting fossil fuel and subsequently ceases combusting fossil fuel
without generating any electricity. Failed starts may be planned or unplanned, and often occur when bringing
a plant online after a maintenance outage.
5 When a comparison is made between “uncontrolled” and “controlled” units, the uncontrolled data represent startup events at EGUs that did not have the relevant APCD. In other words, uncontrolled SO2 emission rates are based on PC EGUs that have installed SCR, and therefore are a part of the data set, but have not installed an FGD APCD. For NOX, “non‐SCR” startup events are based on PC EGUs that have installed FGD but do not have an SCR. These units may, however, have other NOX controls such as low‐NOX burners, overfired air, and/or selective non‐catalytic reduction APCDs. 6 Part 75 requires the use of substitute data when a monitor is not working properly or has not been quality assured. See http://www.epa.gov/airmarkets/emissions/continuous‐factsheet.html. 7 Reporting instructions for Part 75 allow the use of default megawatt values, typically 1 or 2, when combustion is underway but gross load is zero. For this study, we conservatively set the start of electricity generation from the hour where gross load exceeded 2. 8 Because startup events are grouped by boiler and control, a startup event may be counted more than once. For example, each startup event at a PC EGU with an FGD and SCR would be counted as a startup event at an FGD‐equipped EGU and at an SCR‐equipped EGU.

4
Table 1: Number of normal and failed starts by boiler and APCD types, years 2011 and 2012.
The average EGU had between 9 and 10 startup events per year during 2011 – 2012, but data from a small
number of EGUs indicated significantly more startup events, over 100 startup events in 2011 and 83 in 2012.
For the 414 coal‐fired EGUs in this analysis, the overall number of startup events remains reasonably
consistent across both years.
4.1 Operations between start of combustion and start of generation
We analyzed emissions and operations data for each startup event from the start of fossil fuel combustion to
the start of electricity generation. Specifically, we examined the length of time an EGU combusts fossil fuel
before initiating electricity generation, giving consideration to the period of time the unit was offline and
whether or not the unit successfully initiated electricity generation.
We explored these data to examine commenters’ claims that starting a coal‐fired EGU is a complicated process
that can take several hours to complete. Generally, during startup of a coal‐fired boiler the operator slowly
heats the boiler to avoid problems with boiler expansion and overheating of equipment (e.g., reheaters,
superheaters).9 If the boiler is offline for a short time and does not experience significant temperature declines,
the time between start of combustion and start of electricity generation may be very short. During a “cold
start” – a startup event following an extended outage of 120 hours or more since the last instance of fuel
combustion – Babcock and Wilcox10 states that larger coal‐fired EGUs “may need four to six hours for startup.”
Generally, natural gas or fuel oil is combusted during this time to slowly raise the temperature in the boiler.
Natural gas and oil are used because of their low ignition temperature and ignition stability.
Approximately 20% of the startup events examined in this study failed to successfully generate electricity
following the start of fossil fuel combustion. These failed starts can occur for a variety of safety and operating
reasons. In general, these failed starts have a short duration—the average failed start combusted fossil fuel for
less than 8 hours with a median of 4 hours. Figure 1 shows the distribution of hours of fossil fuel combustion
during failed starts. Fossil fuel combustion during approximately 75% of the failed starts lasted 10 hours or less.
The failed starts that combusted fossil fuel for more than 10 hours generally followed longer periods of
downtime (e.g., extended maintenance events). The average time offline before such failed starts is
approximately 360 hours.
9 Lefton SA and Hilleman D, 2011. Make Your Plant Ready for Cycling Operation. Power Magazine. August 1. (http://www.powermag.com/issues/features/Make‐Your‐Plant‐Ready‐for‐Cycling‐Operations_3885.html) 10 Kitto JB, Stultz SC, editors, 2005. Steam: Its Generation and Use. 41st ed. Barberton, Ohio: Babcock & Wilcox Company. P. 11‐14.
Boiler‐control Normal starts
Failed starts
Total starts
PC EGU 7,364 2,103 9,467
Supercritical w/ FGD 1,612 369 1,981
Supercritical w/ SCR 1,413 324 1,737
Subcritical w/ FGD 4,827 1,335 6,162
Subcritical w/ SCR 2,578 823 3,401
CFB EGU 208 44 252

5
Figure 1: Duration of fossil fuel combustion during failed startup events
More than 97% of the normal starts – a startup event in which an EGU begins combusting fossil fuel and
subsequently generating electricity during at least one operating hour before the EGU ceases combusting fossil
fuel – in this database were at PC EGUs. Following the start of fossil fuel combustion, PC EGUs began
generating electricity in a relatively short period of time. On average, the time between start of fossil fuel
combustion and start of generation was less than 9 hours (see Figure 2).
Figure 2: Duration of fossil fuel combustion prior to electricity generation during normal startup events at PC EGUs
Approximately 3% of the normal startup events in this analysis were at CFB boiler EGUs. For these startup
events, the average time between start of fossil fuel combustion and start of generation was approximately 10
hours with a median of 8 hours, comparable to the study population as a whole. However, over 40% of startup
events at CFB boiler EGUs had extended periods (10‐75 hours) of fossil fuel combustion before electricity
generation commenced. It is not evident why these CFB boiler EGUs combusted fuel for so many hours before
generating electricity, but the hourly heat input during these “slow to generate” startup events (greater than
10 hours between start of fossil fuel combustion and start of electricity generation) is considerably lower than
0
50
100
150
200
250
300
350
400
1 3 5 7 9 11 13 15 17 19 21 23 >24
Number of failed starts
Hours of fossil fuel combustion
Cold
Warm
Hot
0
100
200
300
400
500
600
700
800
900
1 3 5 7 9 11 13 15 17 19 21 23 >24
Number of norm
al starts
Hours of fossil fuel combustion before generation
Cold
Warm
Hot

6
the heat input during “fast to generate” starts (less than or equal to 10 hours between start of fossil fuel
combustion and start of electricity generation) (see Figure 3).
Figure 3: Heat input per hour following start of fossil fuel combustion at CFB boiler EGUs
4.2 Operations following the start of generation
4.2.1 Pulverized coal EGUs
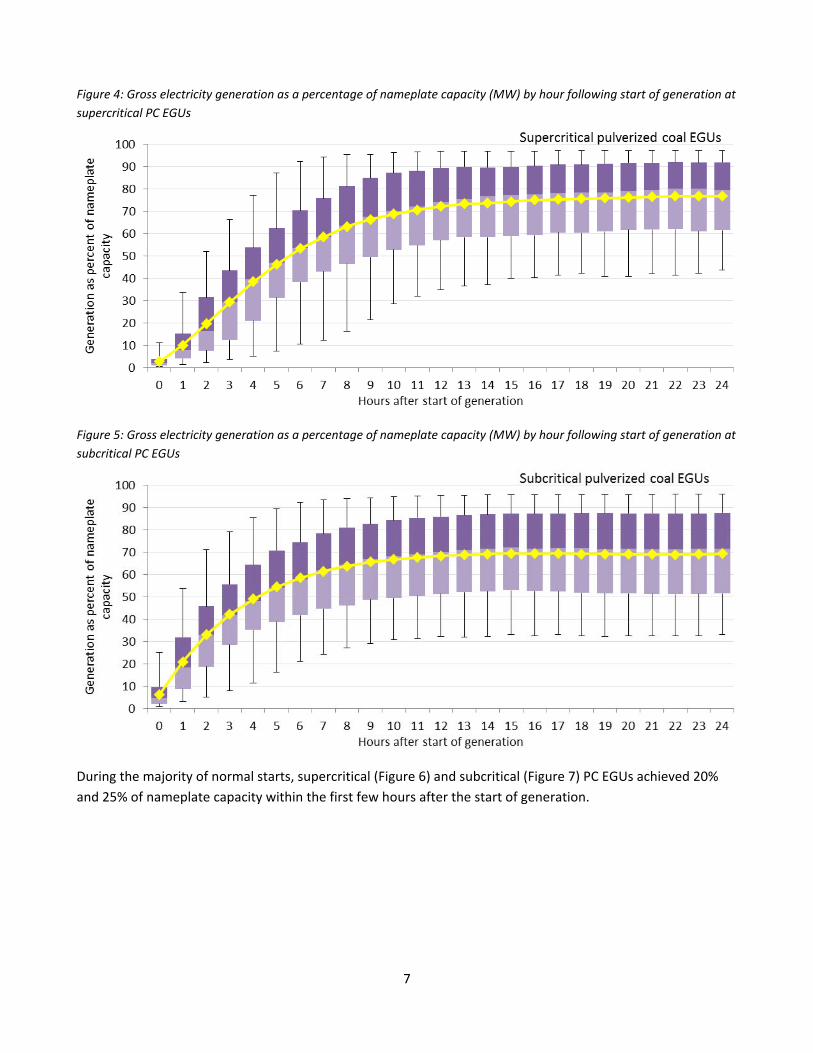
Following the start of generation, both supercritical and subcritical PC EGUs increased generation rapidly,
achieving higher loads within the first few hours. Figure 4 shows that across startup events at supercritical PC
EGUs, generation averaged approximately 30% of nameplate capacity by hour 3 and approximately 38% of
nameplate capacity by hour 4. (Note: the yellow line is the average gross load as a percentage of nameplate
capacity across all startup events at supercritical PC EGUs; the purple boxes and black whiskers are the quartile
ranges.) Figure 5 shows that across startup events at subcritical PC EGUs, generation averaged approximately
33% of nameplate capacity by hour 2, 42% of nameplate capacity by hour 3, and 49% of nameplate capacity by
hour 4.
7
Figure 4: Gross electricity generation as a percentage of nameplate capacity (MW) by hour following start of generation at
supercritical PC EGUs
Figure 5: Gross electricity generation as a percentage of nameplate capacity (MW) by hour following start of generation at
subcritical PC EGUs
During the majority of normal starts, supercritical (Figure 6) and subcritical (Figure 7) PC EGUs achieved 20%
and 25% of nameplate capacity within the first few hours after the start of generation.
8
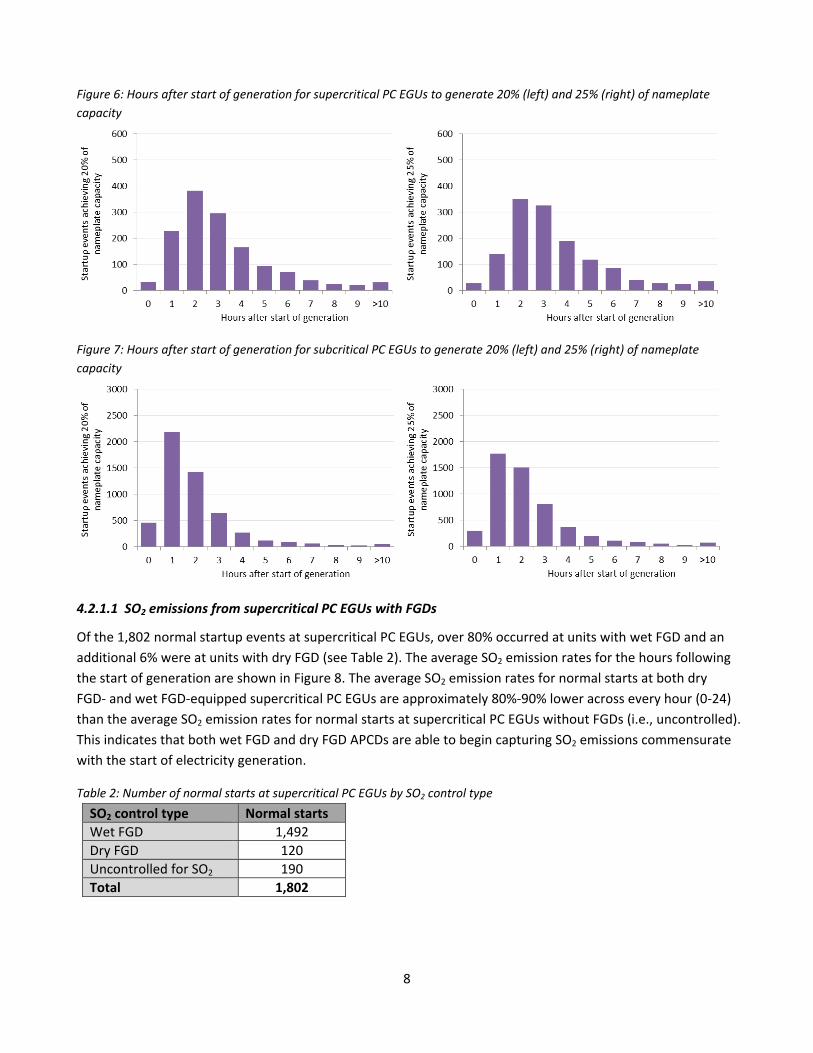
Figure 6: Hours after start of generation for supercritical PC EGUs to generate 20% (left) and 25% (right) of nameplate
capacity
Figure 7: Hours after start of generation for subcritical PC EGUs to generate 20% (left) and 25% (right) of nameplate
capacity
4.2.1.1 SO2 emissions from supercritical PC EGUs with FGDs
Of the 1,802 normal startup events at supercritical PC EGUs, over 80% occurred at units with wet FGD and an
additional 6% were at units with dry FGD (see Table 2). The average SO2 emission rates for the hours following
the start of generation are shown in Figure 8. The average SO2 emission rates for normal starts at both dry
FGD‐ and wet FGD‐equipped supercritical PC EGUs are approximately 80%‐90% lower across every hour (0‐24)
than the average SO2 emission rates for normal starts at supercritical PC EGUs without FGDs (i.e., uncontrolled).
This indicates that both wet FGD and dry FGD APCDs are able to begin capturing SO2 emissions commensurate
with the start of electricity generation.
Table 2: Number of normal starts at supercritical PC EGUs by SO2 control type
SO2 control type Normal starts
Wet FGD 1,492
Dry FGD 120
Uncontrolled for SO2 190
Total 1,802

9
Figure 8: Average SO2 emission rates following start of generation at supercritical PC EGUs by SO2 control type
Figures 9 and 10 show the distribution of SO2 emission rates during normal starts at supercritical PC EGUs with
wet FGD (Figure 9) and dry FGD (Figure 10). (Note: the top and bottom 5% of emission rates are excluded from
the chart;11 the yellow line is the average emission rate across starts at supercritical PC EGUs with FGD; the red
boxes and black whiskers are the quartile ranges.) The figures show that average and median SO2 emission
rates are low at the start of generation for the majority of normal starts, indicating that both wet FGD and dry
FGD are likely operating at the start of generation.
Figure 9: Average SO2 emission rates following start of generation at supercritical PC EGUs with wet FGDs
11 A number of PC EGUs shut down in 2011 and 2012. Several startup events at these units had high SO2 emissions for more than 24 hours after the start of generation indicating the FGD equipment was not in use. By excluding the top 5% of values, these outliers do not bias the analysis. For parity, we also excluded the bottom 5%.

10
Figure 10: Average SO2 emission rates following start of generation at supercritical PC EGUs with dry FGDs
Following gross load levels greater than or equal to 25% of nameplate capacity, supercritical PC EGUs’ SO2
emission rates are relatively low and stable (see Figure 11 for wet FGD and Figure 12 for dry FGD). Both types
of FGDs show declining average SO2 emission rates by the third hour after reaching 25% load.
Figure 11: Average SO2 emission rates following gross load levels greater than or equal to 25% of nameplate capacity at
supercritical PC EGUs with wet FGDs
11
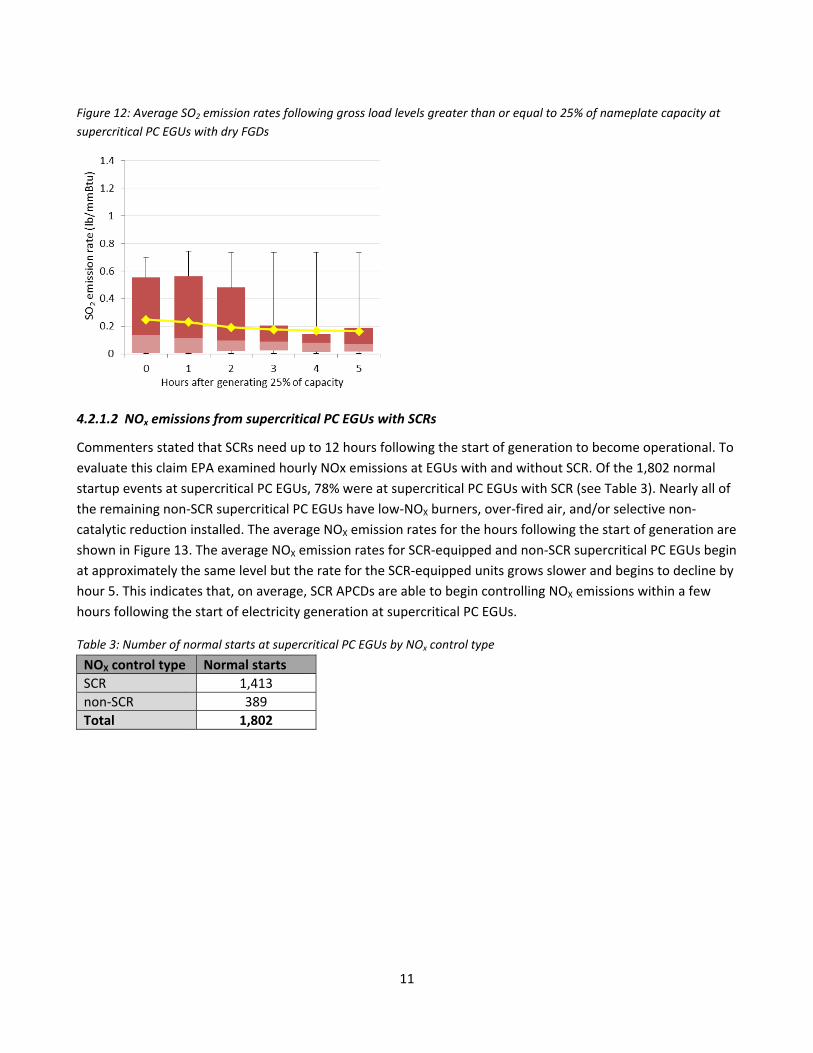
Figure 12: Average SO2 emission rates following gross load levels greater than or equal to 25% of nameplate capacity at
supercritical PC EGUs with dry FGDs
4.2.1.2 NOx emissions from supercritical PC EGUs with SCRs
Commenters stated that SCRs need up to 12 hours following the start of generation to become operational. To
evaluate this claim EPA examined hourly NOx emissions at EGUs with and without SCR. Of the 1,802 normal
startup events at supercritical PC EGUs, 78% were at supercritical PC EGUs with SCR (see Table 3). Nearly all of
the remaining non‐SCR supercritical PC EGUs have low‐NOX burners, over‐fired air, and/or selective non‐
catalytic reduction installed. The average NOX emission rates for the hours following the start of generation are
shown in Figure 13. The average NOX emission rates for SCR‐equipped and non‐SCR supercritical PC EGUs begin
at approximately the same level but the rate for the SCR‐equipped units grows slower and begins to decline by
hour 5. This indicates that, on average, SCR APCDs are able to begin controlling NOX emissions within a few
hours following the start of electricity generation at supercritical PC EGUs.
Table 3: Number of normal starts at supercritical PC EGUs by NOx control type
NOX control type Normal starts
SCR 1,413
non‐SCR 389
Total 1,802
12
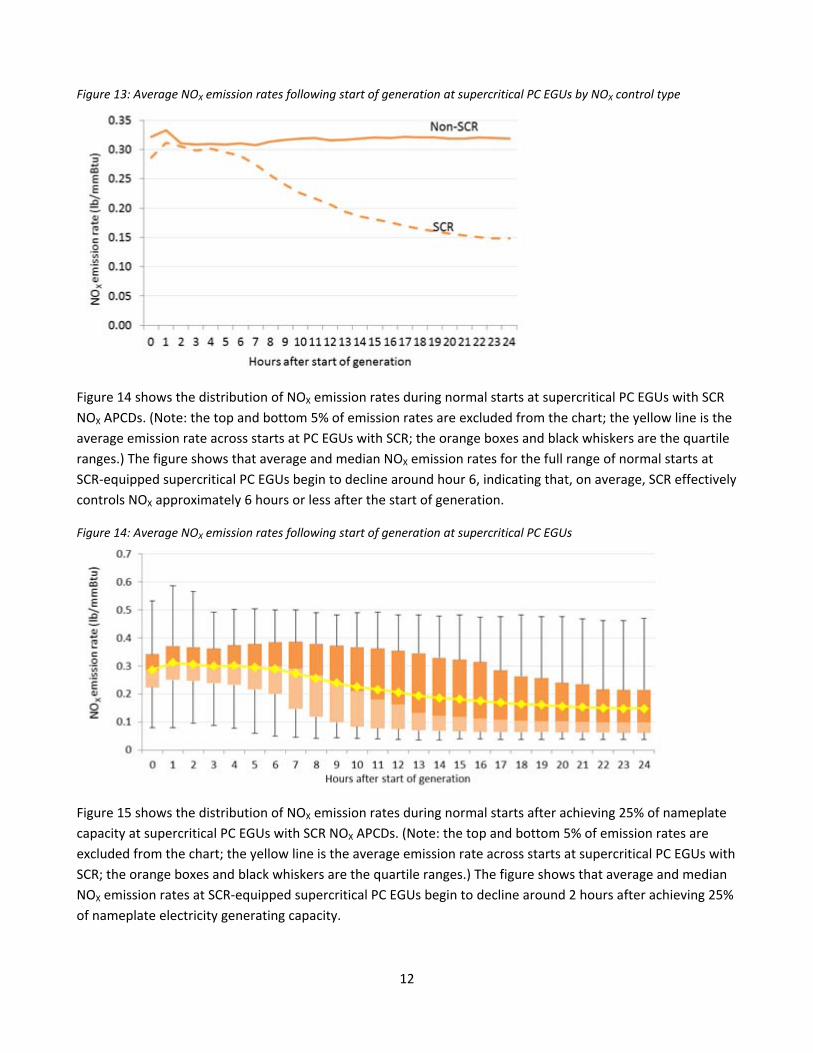
Figure 13: Average NOX emission rates following start of generation at supercritical PC EGUs by NOX control type
Figure 14 shows the distribution of NOX emission rates during normal starts at supercritical PC EGUs with SCR
NOX APCDs. (Note: the top and bottom 5% of emission rates are excluded from the chart; the yellow line is the
average emission rate across starts at PC EGUs with SCR; the orange boxes and black whiskers are the quartile
ranges.) The figure shows that average and median NOX emission rates for the full range of normal starts at
SCR‐equipped supercritical PC EGUs begin to decline around hour 6, indicating that, on average, SCR effectively
controls NOX approximately 6 hours or less after the start of generation.
Figure 14: Average NOX emission rates following start of generation at supercritical PC EGUs
Figure 15 shows the distribution of NOX emission rates during normal starts after achieving 25% of nameplate
capacity at supercritical PC EGUs with SCR NOX APCDs. (Note: the top and bottom 5% of emission rates are
excluded from the chart; the yellow line is the average emission rate across starts at supercritical PC EGUs with
SCR; the orange boxes and black whiskers are the quartile ranges.) The figure shows that average and median
NOX emission rates at SCR‐equipped supercritical PC EGUs begin to decline around 2 hours after achieving 25%
of nameplate electricity generating capacity.

13
Figure 15: Average NOX emission rates following gross load levels greater than or equal to 25% of nameplate capacity at
supercritical PC EGUs with SCRs
4.2.1.3 SO2 emissions from subcritical PC EGUs with FGDs
Of the 5,770 normal startup events at subcritical PC EGUs, 70% were at subcritical PC EGUs with wet FGD and
an additional 14% were at subcritical PC EGUs with dry FGD (see Table 4). The average SO2 emission rates for
the hours following the start of generation are shown in Figure 16. The average SO2 emission rates for normal
starts at wet FGD‐equipped subcritical PC EGUs are approximately 75%‐80% lower across every hour (0‐24)
than the average SO2 emission rates for normal starts at subcritical PC EGUs without FGDs (i.e., uncontrolled).
The average SO2 emission rates for normal starts at dry FGD‐equipped subcritical PC EGUs are approximately
40%‐70% lower across every hour (0‐24) than the average SO2 emission rates for normal starts at subcritical PC
EGUs without FGDs.
Table 4: Number of normal starts at subcritical PC EGUs by SO2 control type
SO2 control type Normal starts
Wet FGD 4,024
Dry FGD 803
Uncontrolled for SO2 943
Total 5,770

14
Figure 16: Average SO2 emission rates following start of generation at subcritical PC EGUs by SO2 control type
Figures 17 and 18 show the distribution of SO2 emission rates during normal starts at subcritical PC EGUs with
wet FGD (17) and dry FGD (18). (Note: the top and bottom 5% of emission rates are excluded from the chart;
the yellow line is the average emission rate across starts at subcritical PC EGUs with FGD; the red boxes and
black whiskers are the quartile ranges.) The figures show that average and median SO2 emission rates are low
at the start of generation for the majority of normal starts, indicating that wet FGD are likely operating at the
start of electricity generation and dry FGD begin controlling emissions within the first 3 to 4 hours after the
start of electricity generation.
Figure 17: Average SO2 emission rates following start of generation at subcritical PC EGUs with wet FGDs

15
Figure 18: Average SO2 emission rates following start of generation at subcritical PC EGUs with dry FGDs
Following gross load levels greater than or equal to 25% of nameplate capacity, subcritical PC EGUs with wet
FGD have relatively low and stable average and median SO2 emission rates (see Figure 19) while subcritical PC
EGUs with dry FGD reduce average SO2 emission rates (see Figure 20) by over 30 percent in the first 3 hours
following gross load levels of 25% of nameplate capacity. Average and median SO2 emission rates at dry FGD‐
equipped subcritical PC EGUs begin declining within the first hour of achieving gross load equal to or greater
than 25% of nameplate capacity.
Figure 19: Average SO2 emission rates following gross load levels greater than or equal to 25% of nameplate capacity at
subcritical PC EGUs with wet FGDs

16
Figure 20: Average SO2 emission rates following gross load levels greater than or equal to 25% of nameplate capacity at
subcritical PC EGUs with dry FGDs
4.2.1.4 NOx emissions from subcritical PC EGUs with SCRs
Of the 5,770 normal startup events at subcritical PC EGUs, nearly 47% were at subcritical PC EGUs with SCR
(see Table 5). Nearly all of the remaining non‐SCR subcritical PC EGUs have installed low‐NOX burners, over‐
fired air, and/or selective non‐catalytic reduction. The average NOX emission rates for the hours following the
start of generation are shown in Figure 21. The average NOX emission rates for SCR‐equipped and non‐SCR
supercritical PC EGUs begin at approximately the same level but the rate for the SCR‐equipped units begins to
decline around hour 2.
Table 5: Number of normal starts at subcritical PC EGUs by NOx control type
NOX control type Normal starts
SCR 2,578
non‐SCR 3,192
Total 5,770

17
Figure 21: Average NOX emission rates following start of generation at subcritical PC EGUs by NOX control type
Figure 22 shows the distribution of NOX emission rates during normal starts at subcritical PC EGUs with SCR
NOX APCDs. (Note: the top and bottom 5% of emission rates are excluded from the chart; the yellow line is the
average emission rate across starts at PC EGUs with SCR; the orange boxes and black whiskers are the quartile
ranges.) The figure shows that average and median NOX emission rates for the full range of normal starts at
SCR‐equipped subcritical PC EGUs begin to decline around hour 2, indicating that SCR are likely starting to
control NOX 2 to 3 hours after the start of generation.
Figure 22: Average NOX emission rates following start of generation at subcritical PC EGUs
4.2.2 Circulating fluidized bed boiler EGUs
Commenters stated that CFB boiler EGUs are subject to different constraints during startup procedures and
that they must achieve approximately 40% load before becoming stable. CFB boiler EGUs typically do not have
post‐combustion FGD APCDs installed since they achieve significant SO2 capture by adding lime or limestone to
the bed of the boiler. To address the issues raised by commenters, EPA evaluated CFB boiler EGU starts
separately from PC EGUs.

18
Figure 23 shows that across startup events at CFB boiler EGUs, generation averaged approximately 30% of
nameplate capacity by hour 2 and 40% of nameplate capacity by hour 3. (Note: the yellow line is the average
gross load as a percentage of nameplate capacity across all startup events at CFB boiler EGUs; the purple boxes
and black whiskers are the quartile ranges.) We found that CFBs achieve 25% and 40% load bins, on average,
as fast as subcritical and supercritical PC EGUs (see Figures 4 and 5).
Figure 23: Gross electricity generation as a percentage of nameplate capacity (MW) by hour following start of generation
at CFB boiler EGUs
During the majority of normal startup events, CFB boiler EGUs achieved 20% and 25% of nameplate capacity
within the first few hours (see Figure 24).
Figure 24: Hours after start of generation for CFB boiler EGUs to generate 20% (left) and 25% (right) of nameplate capacity
Because CFB boiler EGUs generally do not have separate FGD APCDs, there is no need to compare uncontrolled
and controlled emission rates. Figure 25 shows that average and median SO2 emission rates during startup
events at CFB boiler EGUs begin to decline at hours 4 to 6 following the start of electricity generation. (Note:
the top and bottom 5% of emission rates are excluded from the chart; the yellow line is the average emission
rate across startup events at CFB boiler EGUs with FGD; the red boxes and black whiskers are the quartile
ranges.)

19
Figure 25: Average SO2 emission rates following start of generation at CFB boiler EGUs
5. Conclusion
In this analysis of supercritical and subcritical PC EGUs with FGD and/or SCR and CFB boiler EGUs, EPA
examined several indicators that can aid in assessing the time required to achieve operating benchmarks.
These indicators show that, on average, all types of EGUs in this study:
can reach 25% of nameplate capacity in 3 hours or less after the start of generation;
can begin controlling SO2 and NOx emissions 3 hours or less after reaching 25% of nameplate capacity
or 6 hours or less following the start of electricity generation
We found no significant difference in performance related to startup events between the different boiler types
and APCD technologies assessed in this analysis.