ASSESSMENT OF RF EXPOSURES FROM EMERGING … · times below the ICNIRP reference levels for...
39
1 Abstract- In-situ electromagnetic (EM) radio frequency (RF) exposure to base stations of emerging wireless technologies is assessed at 311 locations, 68 indoor and 243 outdoor, spread over 35 areas in three European countries (Belgium, The Netherlands, and Sweden) by performing narrowband spectrum analyzer measurements. The locations are selected to characterize 6 different environmental categories (rural, residential, urban, suburban, office, and industrial). The maximal total field value was measured in a residential environment and equal to 3.9 V/m, mainly due to GSM900 signals and 11 ASSESSMENT OF RF EXPOSURES FROM EMERGING WIRELESS COMMUNICATION TECHNOLOGIES IN DIFFERENT ENVIRONMENTS Wout, Joseph*, Leen, Verloock*, Francis, Goeminne*, Günter, Vermeeren*, and Luc, Martens* (email:[email protected], fax:+32 9 33 14899) *Department of Information Technology, Ghent University / IBBT Gaston Crommenlaan 8, B-9050 Ghent, Belgium Manuscript (Abstract, Text, References, Footnotes, List of Figure Captions)
Transcript of ASSESSMENT OF RF EXPOSURES FROM EMERGING … · times below the ICNIRP reference levels for...

1
Abstract- In-situ electromagnetic (EM) radio frequency (RF) exposure to base stations of
emerging wireless technologies is assessed at 311 locations, 68 indoor and 243 outdoor,
spread over 35 areas in three European countries (Belgium, The Netherlands, and
Sweden) by performing narrowband spectrum analyzer measurements. The locations
are selected to characterize 6 different environmental categories (rural, residential,
urban, suburban, office, and industrial). The maximal total field value was measured in
a residential environment and equal to 3.9 V/m, mainly due to GSM900 signals and 11
ASSESSMENT OF RF EXPOSURES FROM
EMERGING WIRELESS COMMUNICATION
TECHNOLOGIES IN DIFFERENT
ENVIRONMENTS
Wout, Joseph*, Leen, Verloock*, Francis, Goeminne*, Günter, Vermeeren*, and Luc, Martens*
(email:[email protected], fax:+32 9 33 14899)
*Department of Information Technology, Ghent University / IBBT
Gaston Crommenlaan 8, B-9050 Ghent, Belgium
Manuscript (Abstract, Text, References, Footnotes, List of Figure Captions)

2
times below the ICNIRP reference levels for electric field strength. Exposure ratios for
maximal electric field values with respect to ICNIRP reference levels, range from 0.5 %
(WiMAX) to 9.3 % (GSM900) for the 311 measurement locations. Exposure ratios for
total field values vary from 3.1 % for rural environments to 9.4 % for residential
environments. Exposures are lognormally distributed and are the lowest in rural
environments and the highest in urban environments. Highest median exposures were
obtained in urban environments (0.74 V/m), followed by office (0.51 V/m), industrial
(0.49 V/m), suburban (0.46 V/m), residential (0.40 V/m), and rural (0.09 V/m)
environments. The average contribution to the total electric field is for GSM more than
60 %. Except for the rural environment, average contributions of UMTS-HSPA are
more than 3 %. Contributions of the emerging technologies LTE and WiMAX are on
average less than 1 %. The dominating outdoor source is GSM900 (95th
percentile of
1.9 V/m), indoor DECT dominates (95th
percentile of 1.5 V/m).
Key Words- RF exposure, base station, exposure of general public, measurement,
telecommunication, UMTS, HSPA, LTE, WiMAX, DECT, environment, emerging
technology.
I. INTRODUCTION
The WHO International EMF Project’s RF Research Agenda identified as a research topic a need
for measurement surveys to characterize population exposures from all radio-frequency (RF)
sources, with a particular emphasis on new wireless technologies (WHO 2010). There is a need
3
to conduct measurements to assess the typical range of exposures from existing and emerging
wireless network technologies such as WiMAX (Worldwide Interoperability for Microwave
Access), HSPA (High Speed Packet Access), and LTE (Long Term Evolution) in a range of
common locations (outside public areas, within buildings, homes, etc.) and compare the exposure
contributions to existing exposures from e.g., FM, TV, GSM, etc.
Procedures for measurements in the vicinity of GSM (Global System for Mobile
Communications) and UMTS (Universal Mobile Telecommunications System) base stations
have been developed in (Kim et al. 2008, Lehmann et al. 2002, Joseph et al. 2006, Neubauer
et al. 2002, Olivier and Martens 2007). Bornkessel et al. 2007 provided results of temporal
and spatial measurements of GSM and UMTS signals. Measurements in the neighborhood of
WiMAX base stations are investigated in Joseph et al. 2008. Foster 2007 investigated
exposure of Wi-Fi access points and checked compliance with international guidelines
(ICNIRP 1998, IEEE C95.1 2005, FCC 2001). Also Kühn et al. 2007, Myhr 2004, Schmid et
al. 2007, and Verloock et al. 2010 investigated short-period exposures caused by Wi-Fi access
points. Exposures from TV and radio transmitters have been studied in e.g., Joseph and
Martens 2006 and Sirav and Seyhan 2009. Tomitsch et al. 2010 measured exposures in
bedrooms of residences: highest values were caused by DECT telephone base stations
(3.31 V/m or 28,979 W/m2) and mobile phone base stations (1.36 V/m or 4,872 W/m
2).
Finally, exposures from LTE have recently been investigated in Joseph et al. 2010b.
Procedures for RF exposure measurements in the vicinity of base stations have thus already
been developed and a standard has been written for the in-situ measurement of
electromagnetic-field strength related to human exposure in the vicinity of base stations
4
(CENELEC, 2008) but assessment of exposure to electromagnetic fields of emerging wireless
systems such as HSPA, LTE, and mobile WiMAX and the characterization of exposure
distributions and variability in different environments are missing.
Measurement campaigns of RF exposures using personal exposimeters and their results have
been presented (Frei et al. 2009, Joseph et al. 2008b, 2010c, Knafl et al. 2008, Neubauer et al.
2007, Roösli et al. 2008, Viel et al. 2009). Exposimeters are not suitable for accurate field
assessment and current personal exposimeters cannot measure accurately e.g., LTE and
WiMAX (Bolte et al. 2011), but one can use these to obtain an idea about exposure
distributions.
In this paper a methodology and design of measurement campaign will be presented to
experimentally determine in-situ electromagnetic field exposure of general public due to new
wireless sources in various environments. The purpose of this study is to provide a range of
typical RF exposure values from base stations, investigate the exposure distributions, compare
the contribution of the various RF sources, and check compliance with the ICNIRP guidelines
for general public exposure (ICNIRP 1998). Moreover, LTE exposures in the first commercial
deployment (Stockholm, Sweden) and mobile WiMAX exposure (IEEE 802.16e 2005)
(Amsterdam, The Netherlands) were assessed during this measurement campaign. Only
exposures due to base stations are considered here and not due to mobile handsets. The
results, procedures, and methodologies of this paper can be used by authorities and
epidemiologists to estimate the exposure from RF emitting sources and gain insight in which
environments highest exposures occur and due to which sources. Moreover, the exposure
5
variability that can be expected between different environments is presented here. Knowledge
about these exposure distributions and variability is useful for the planning of future studies.
II. MATERIALS AND METHOD
A. Measurement locations
The 311 different measurement locations, spread over 35 areas or sites, are subdivided into 6
different categories depending on the type of environment, population density, the available
wireless technologies (e.g., mobile WiMAX in the urban environment of Amsterdam, The
Netherlands and LTE in Stockholm, Sweden), and the expected amount and time of traffic:
rural, residential, urban, suburban, office, and industrial environments. Table 1 summarizes
the categories and the number of indoor and outdoor measurement locations per category.
Also a short description of the categories is added. These sites are geographically spread
across Belgium, The Netherlands, and Sweden. 243 outdoor locations and 68 indoor locations
were selected. Fig. 1 shows the measurement locations on different maps: in Fig. 1 (a) the
numbers 1-35 represent areas or sites in Belgium and The Netherlands where about 8-10
measurements are performed per site (corresponding with measurements executed during a
day, Joseph et al. 2008, 2010b), Fig. 1 (b) shows the 30 measurement locations in and around
Stockholm, Sweden. In order to compare base station exposure of different sources, these
measurement locations were randomly selected, spread over the three countries. The
measurements were performed in the period September 2009 - April 2010.
6
B. Measurement procedure
Electromagnetic-field measurements in the band 80 MHz – 6 GHz were performed at 311
different locations with a spectrum analyzer (SA) (noted as narrowband measurements).
“Max-hold measurements” of all present signals are executed for about 30 minutes at each
location, depending on the number of frequency bands to be measured. A max-hold
measurement is defined here as a narrowband measurement of a signal with the maximum-
hold setting kept during a time interval until the SA reading stabilizes. Typically, narrowband
measurements (in- and outdoor) are executed at 8 to 10 locations per site. The measurement
probe is positioned at 1.5 m above the ground (CENELEC 2008).
The measurement setup of the narrowband measurements consisted of tri-axial Rohde and
Schwarz R&S TS-EMF Isotropic Antennas (dynamic range of 1 mV/m – 100 V/m for the
frequency range of 80 MHz – 3 GHz, and 2.5 mV/m – 200 V/m for the frequency range of
2 GHz – 6 GHz) in combination with a spectrum analyzer (SA) of type R&S FSL6 (frequency
range of 9 kHz – 6 GHz) (http://www2.rohde-schwarz.com, R&S Belgium, Excelsiorlaan 31
1930 Zaventem Belgium). The measurement uncertainty for the electric field is ± 3 dB for the
considered setup (CENELEC 2008). This uncertainty represents the expanded uncertainty
evaluated using a confidence interval of 95 %.
Current wireless RF sources are mainly operating in the frequency range of 80 MHz up to
6 GHz. After allocating the present signals by a spectral survey, these signals were measured
more in detail. Base station exposures of the 12 following different RF signals in the band
80 MHz – 6 GHz are determined (explanation of abbreviations is listed below Table 2),
namely FM, T-DAB, TETRA, PMR, DVB-T, GSM900 and GSM1800, DECT, UMTS-HSPA,
WiFi, LTE, and WiMAX. The narrowband measurements were executed during daytime at

7
weekdays. The used setup for narrowband measurements enables the most accurate
assessment of in-situ exposure from various sources (CENELEC, 2008).
Table 2 lists the different RF signals, while the sensitivities of the measurement system for the
various signals are provided in Table 3: they vary from 0.002 V/m for TETRA/PMR/GSM900
to 0.013 V/m for WiMAX. These sensitivities depend upon the frequency due to the varying
antenna factor (sensitivity) of the tri-axial measurement probes in the considered frequency
range.
C. Settings of measurement equipment
If the SA-settings for narrowband max-hold measurements are discussed in literature, almost
never all parameters (and certainly not the sweep time) are discussed or only vaguely
specified. These settings have a huge influence on the measurement results. Therefore, it is
very important to specify these (Verloock et al. 2010). To determine the (optimal) settings to
check compliance of the different signals with the ICNIRP guidelines, the method of
Verloock et al. 2010 is used. After investigations, we obtained the settings listed in Table 3 to
perform exposure assessment of the various signals. The most important settings are these of
detector mode (rms or root-mean-square), resolution bandwidth RBW, and sweep time SWT.
Concerning the video bandwidth VBW, CENELEC 2008 recommends that VBW > 3·RBW.
These settings have been determined and tested in-lab and in-situ. Methods and details for
these settings can be found in CENELEC, 2008, in recommendation ITU-R. 1708 of
ITU 2005, Joseph et al. 2008, Verloock et al. 2010, and Joseph et al. 2010b. These references
for optimal exposure assessment of the different technologies are also provided in Table 3.
8
We have to remark that the use of max-hold measurements may result in larger
overestimations for GSM and DECT than for other signals. The SA’s maximum-hold setting
retains the maximum measured values, resulting in an overestimation of e.g., hopping GSM
signals because it is assumed that all maxima are simultaneously present using this setting
(this is thus a kind of worst-case measurement). Also base station exposure to DECT is
overestimated as DECT is a TDD system (Time-Division Duplex) and thus uplink traffic due
to DECT mobile phones is also measured.
D. Data analysis
We consider in this paper as exposure metrics the electric-field strength E [V/m] of an RF
signal, the total electric field Etot [V/m] of all RF signals present, and the power density S
[W/m2]. Furthermore exposure ratios ER and average (AC) and maximal (MC) contributions
are defined.
The exposure ratio ER of an RF signal is defined as the ratio between the maximal measured
electric field value for the considered signal type over the 311 locations and the corresponding
ICNIRP reference level:
[%] (1)
With max() the maximum value over N locations (N = 311 when considering all data), Esignal,i
[V/m] the field strength of an RF signal (e.g., FM, GSM, LTE, etc.) at location i, respectively,
LE the corresponding ICNIRP reference levels for electric-field strength in V/m. A ratio
smaller than 100 % means that the ICNIRP reference levels are satisfied.
The exposure ratio can also be defined with respect to power densities (denoted as ERS):
E
isignalNi
L
EER
)(max100
,...1

9
[%] (2)
With max() the maximum value over N locations, Ssignal,i [W/m2] the power density of an RF
signal at location i, and LS the corresponding ICNIRP reference levels for power density in
W/m2.
The exposure ratio is defined as the maximal cumulative ratio between total electric
field values in an environment and the corresponding ICNIRP reference levels:
[%] (3)
With max() the maximum value over Nenv locations per environment (env), Ej,i [V/m] the total
field strength of RF signal j present at location i and Lj the corresponding ICNIRP reference
level. is thus the maximal cumulative ratio for multiple frequencies per environment in
ICNIRP, 1998.
The average (AC) and maximal (MC) power density contribution [%] of each signal to the
total power density value are defined as the average and maximum of the ratio of the power
density of each signal and the total signal:
[%] (4)
With X = AC or MC, u(.) representing a function: maximum or average, Ssignal,i [W/m2] the
power density of an RF signal (e.g., FM, GSM, LTE, etc.) at a location i (i = 1,…, N), N is the
considered number of measurement locations, and Stot,i the total power density for all signals
at the considered measurement location i.
2
,...1
,...1
)(max100
)(max100
E
isignalNi
S
isignalNi
SL
E
L
SER
env
totER
j j
ij
Ni
env
totL
EER
env2
2
,
...1max100
env
totER
itot
isignal
Ni S
SuX
,
,
...1100

10
III. RESULTS AND DISCUSSION
A. General overview of measurements
Fig. 1 (a) shows the maximal measured total electric-field strengths [V/m] per area on
the map Belgium and The Netherlands, respectively. The maximal total value Etot is 3.9 V/m
(residential site 7). Fig. 1 (b) illustrates the total electric field exposures in Stockholm (urban
environment) with a maximal field value of 2.6 V/m.
Table 2 lists the ranges of the different RF exposures for all 311 measurement
locations. Emin denotes the minimal electric field values above the sensitivity of the equipment,
Emax represents the maximal values for each RF signal type. Total (cumulative) exposure
varies between 0.023 and 3.9 V/m. Highest average fields Eavg are obtained for GSM900
(0.5 V/m) and GSM1800 (0.2 V/m). Average total exposures over 311 locations are equal to
Eavg = 0.7 V/m (Table 2). Maximal contributions MC range from 6.9 % (T-DAB) to 100.0 %
(GSM900). Average contributions AC range from 0.2 % (WiMAX, T-DAB) to 53.2 %
(GSM900).
Table 4 summarizes the narrowband measurements for the different environments: the 50th
percentile (p50), 95th
percentile, maximum (max) and the standard deviation (σ) of the electric-
field values are listed. For each environment also the percentage of the number of locations
(n) where a certain signal was above the sensitivity of the measurement system (and thus
present), is mentioned. All measured electric-field values satisfy the ICNIRP guidelines
(ICNIRP 1998). The maximal total value was measured in a residential environment and
equals 3.9 V/m (Table 4). This value is 11 times below the ICNIRP guidelines and mainly due
to the GSM900 signal (3.85 V/m). From Table 4 it can be seen that mobile telecommunication

11
signals (GSM, UMTS-HSPA) were measured almost at all locations in each environment and
dominate the RF-exposures in all environments due to the presence of the high amount of
base station antennas nowadays and the common mobile phone use among people. For the
GSM900 signal n equals 100 % in every environment and n is more than 70 % for the
GSM1800 signal. The UMTS-HSPA signal was also measured more than 70 % in all
environments except in the rural environment. GSM dominates the wireless
telecommunication exposures from base stations. Because of the use of frequency hopping an
overestimation is made for these signals by performing max-hold measurements (see
Section II.B). Standard deviations σ of total exposures vary from 7 to 10 dB for all
environments. These are typical standard deviations σ for large sets of field values (Plets et al.
2009).
B. Field distributions per environment
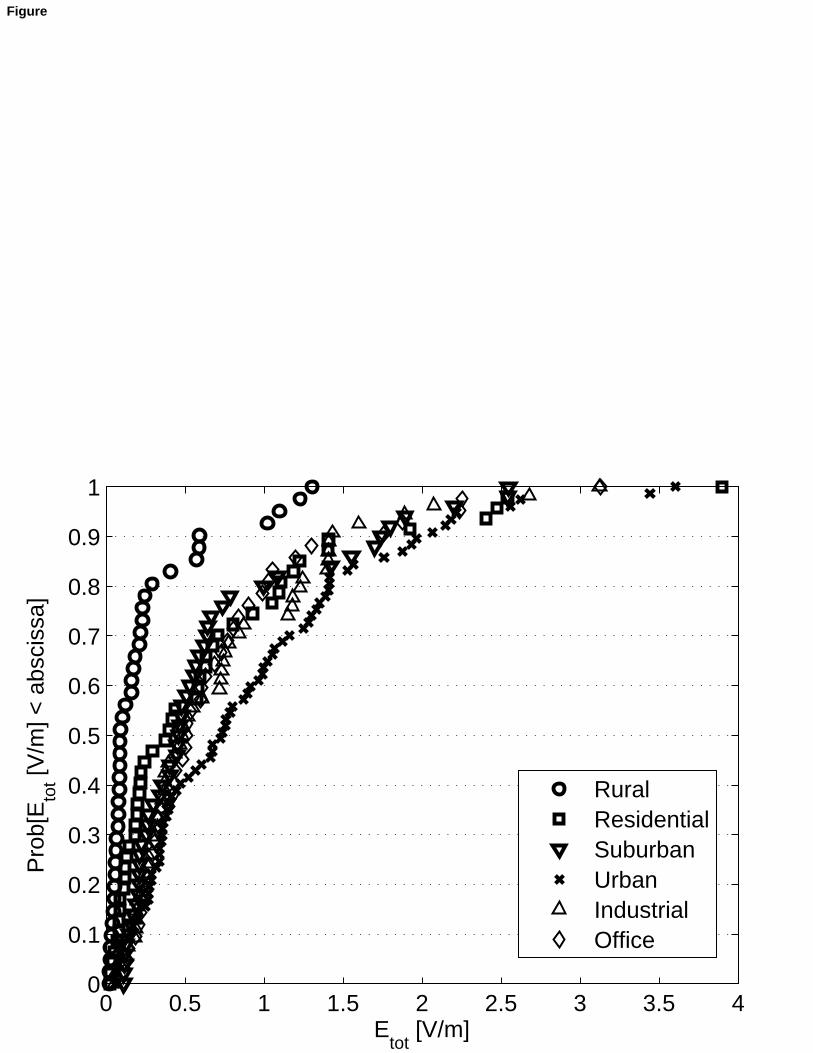
Fig. 2 shows the cumulative distribution functions (CDF) of the total exposures (all RF
sources) for the different environments (i.e., Prob[Etot [V/m] < abscissa]). Clearly lowest
exposures occur for the rural areas, as this distribution is situated most to the left. Highest
exposures occur in general in urban environments as much more RF sources and base stations
are present in these environments. Differences between residential, suburban, industrial, and
office environments are limited. These distributions are in between the rural (lowest) and
urban (highest) exposures.
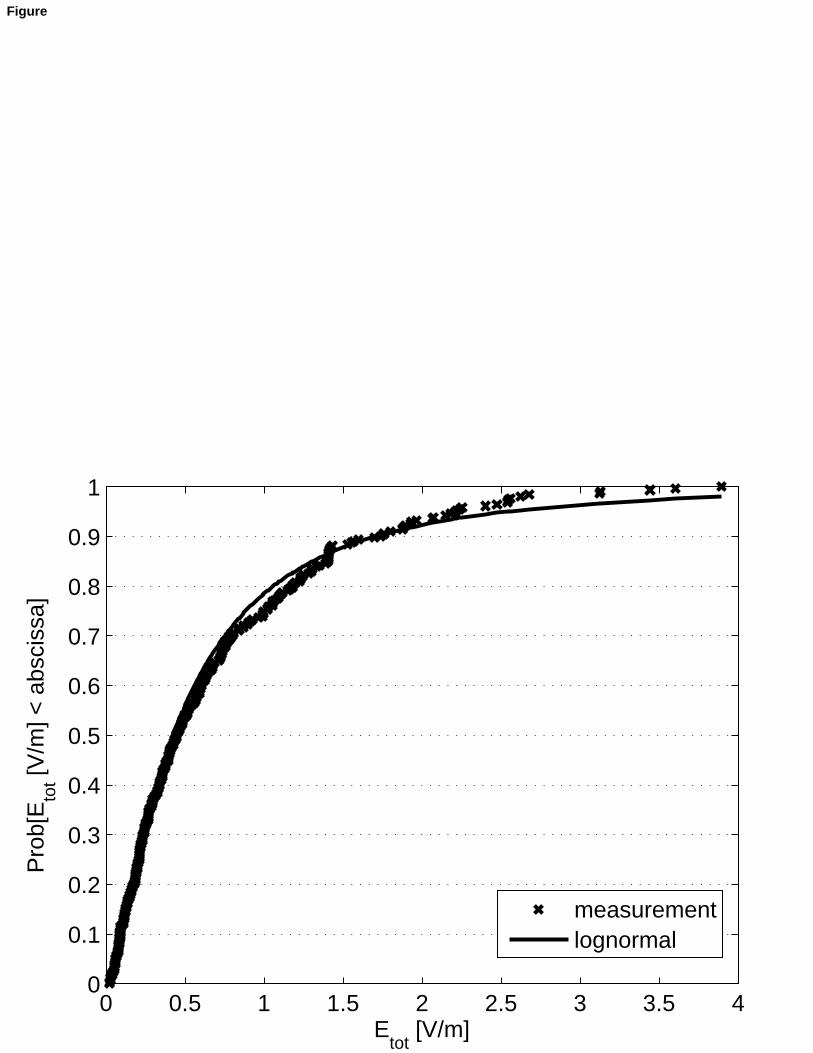
Exposure data in dBV/m (per environment) passed a Lilliefors test for normality at
significance level of 5 %. (Kutner et al. 2005) The exposure values in V/m are converted to
dBV/m values and maximum likelihood estimates of the mean and standard deviation of a
12
normal distribution are calculated. Fig. 3 shows, based on this procedure, the excellent
agreement between empirical and estimated lognormal CDF for Etot (all data). Different
distributions were compared (lognormal, exponential, Rayleigh, Rice, etc.) and for the
lognormal distribution the best agreement was obtained. This results for Etot in estimates
est = -7.4 dBV/m of the mean value and est = 9.4 dB of the standard deviation of the
lognormal distribution function. Table 5 summarizes est, est for the different environments.
These values are listed in dBV/m and dB because of the lognormal behavior. The mean values
vary from -4.1 dBV/m (urban) to -17.3 dBV/m (rural) and standard deviations vary from 7.0
to 10.6 dB. These distribution functions provide a basis for classification of future
measurements (Tomitsch et al. 2010). Moreover, this is very useful for epidemiological
studies.
C. Exposures and ER per environment
Fig. 4 shows a histogram with median p50 and 95th
percentile p95 exposures for the different
environments. The error bars in Fig. 4 are calculated from the uncertainties of the experimental
values. Exposures are clearly the lowest in the rural environment. This can be explained by the
fact that less RF (telecommunication) signals and base stations are present in rural areas due to
the lower population density. For the median values, highest exposures were measured in
urban environments (0.74 V/m), followed by office (0.51 V/m), industrial (0.49 V/m),
suburban (0.46 V/m), residential (0.40 V/m), and rural environments (0.09 V/m). These values
are comparable with those of Tomitsch et al. 2010 where median values in bedrooms of houses
for the RF frequency range of 40.3 μW/m2 (0.12 V/m) are obtained, which agrees well with
the rural exposures of 0.09 V/m. The majority of the houses in Tomitsch et al. 2010 were
13
located in rural areas (154 of the 226 houses). Tomitsch et al. 2010 also obtained significant
lower exposures in rural areas.
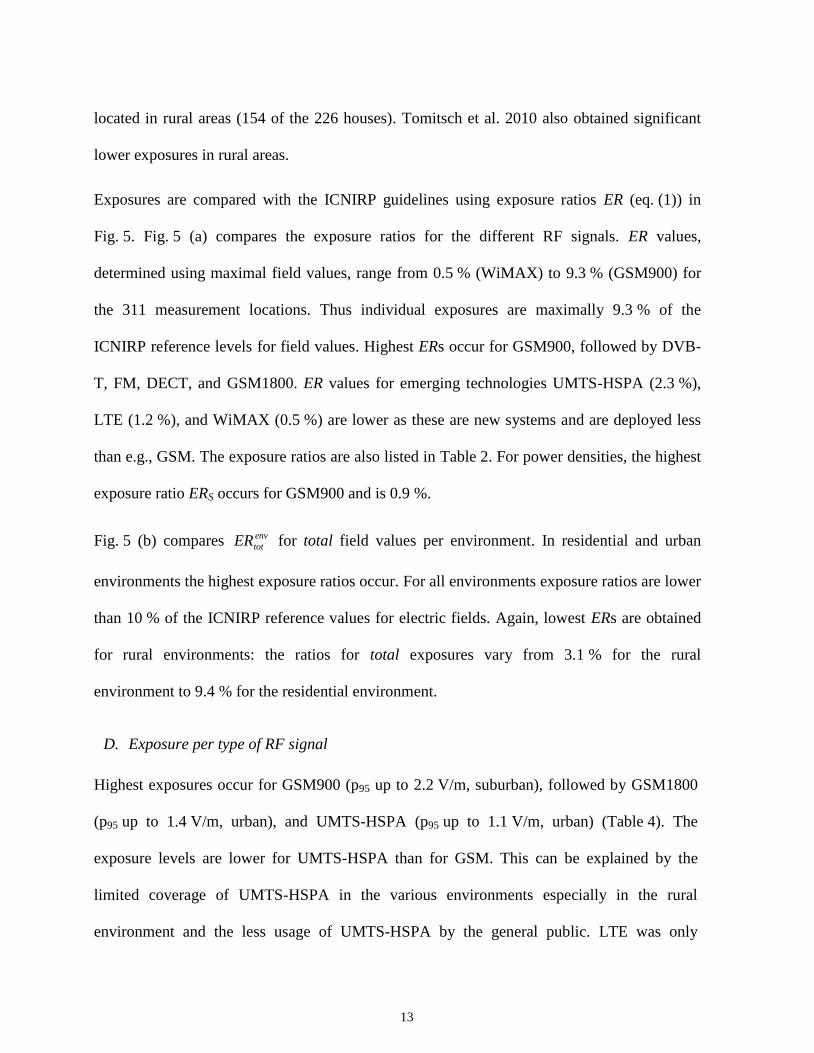
Exposures are compared with the ICNIRP guidelines using exposure ratios ER (eq. (1)) in
Fig. 5. Fig. 5 (a) compares the exposure ratios for the different RF signals. ER values,
determined using maximal field values, range from 0.5 % (WiMAX) to 9.3 % (GSM900) for
the 311 measurement locations. Thus individual exposures are maximally 9.3 % of the
ICNIRP reference levels for field values. Highest ERs occur for GSM900, followed by DVB-
T, FM, DECT, and GSM1800. ER values for emerging technologies UMTS-HSPA (2.3 %),
LTE (1.2 %), and WiMAX (0.5 %) are lower as these are new systems and are deployed less
than e.g., GSM. The exposure ratios are also listed in Table 2. For power densities, the highest
exposure ratio ERS occurs for GSM900 and is 0.9 %.
Fig. 5 (b) compares for total field values per environment. In residential and urban
environments the highest exposure ratios occur. For all environments exposure ratios are lower
than 10 % of the ICNIRP reference values for electric fields. Again, lowest ERs are obtained
for rural environments: the ratios for total exposures vary from 3.1 % for the rural
environment to 9.4 % for the residential environment.
D. Exposure per type of RF signal
Highest exposures occur for GSM900 (p95 up to 2.2 V/m, suburban), followed by GSM1800
(p95 up to 1.4 V/m, urban), and UMTS-HSPA (p95 up to 1.1 V/m, urban) (Table 4). The
exposure levels are lower for UMTS-HSPA than for GSM. This can be explained by the
limited coverage of UMTS-HSPA in the various environments especially in the rural
environment and the less usage of UMTS-HSPA by the general public. LTE was only
env
totER
14
measured in Stockholm (Sweden) in an urban, office, and suburban environment where the
first commercial LTE network is deployed (Joseph et al. 2010b). LTE exposures (max
0.8 V/m) are significantly higher than the exposure due to WiMAX (max 0.3 V/m) for the
urban, the suburban and the office environment. WiMAX (fixed and mobile) was mainly
measured in the urban environment (n = 16.9 %) and at some locations in the suburban
(n = 10.0 %), the office (n = 2.4 %), and the industrial environment (n = 1.9 %). Only in
Amsterdam, The Netherlands, mobile WiMAX (IEEE 802.16e 2005) is present while
elsewhere fixed WiMAX (IEEE 802.16d 2004) and WiMAX-like technologies (proprietary
systems) are deployed. WiMAX causes lower exposures because coverage is limited and only
for a few cities in Belgium and The Netherlands.
Exposures to WiFi (p95 up to 0.1 V/m, urban) and DECT (p95 up to 1.3 V/m, residential),
which are indoor sources, were measured in each environment in- and outdoor. Exposure to
DECT is overestimated here as DECT is a TDD system and thus uplink traffic is also
measured (Section II.C). In Tomitsch et al. 2010 median exposures to DECT of 2.68 μW/m2
(0.032 V/m) and to WiFi of 0.84 μW/m2 (0.018 V/m) were measured in houses. These values
agree again well with the results for rural areas in Table 4, where median values of 0.03 V/m
were obtained for DECT and WiFi in rural areas.
In each environment the majority of the signals FM, T-DAB, TETRA, PMR and
Analogue TV – DVB-T were measured (and thus present). From these signals, the highest
exposure was obtained for the FM (maximally 1.4 V/m) and Analogue TV – DVB-T
(maximally 1.7 V/m) in residential and urban environments (Table 4). Although the FM

15
signal was present at each location in the different environments, the signal could not be
measured at some locations (n does not equal 100 % in every environment, Table 4). At these
locations the signal level of FM was below the sensitivity of the measurement equipment
(Table 3).
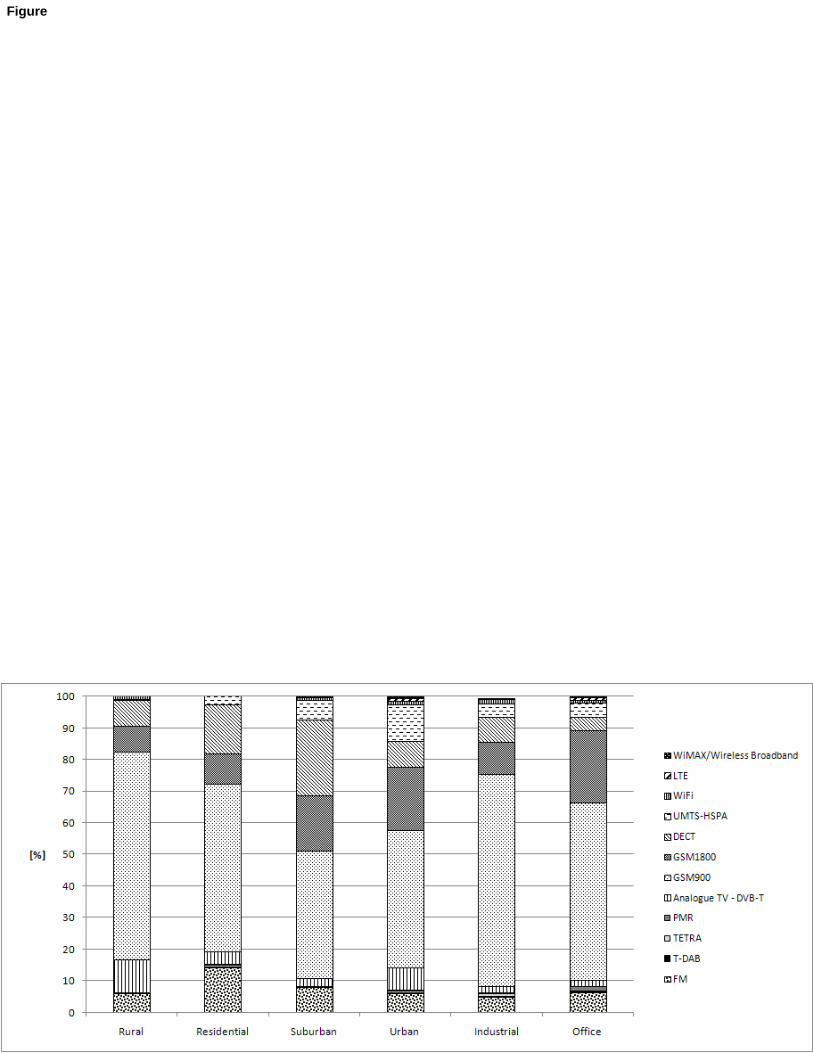
E. Exposure contributions per category/environment
Fig. 6 shows the average power density contribution of each signal in the various
environments. It can clearly be seen that the main contribution in all environments is due to
the GSM signals as these telecommunication signals are most used up to now, and use
typically higher powers than the newer technologies such as UMTS, HSPA, and LTE. The
average contribution (AC) for GSM (900+1800) is more than 60 % (Table 2, Fig. 6). Except
for the rural environment, average contributions of UMTS-HSPA are more than 3 % (from
3.7 % in residential environments to 11.4 % in urban environments). The average
contributions of LTE and WiMAX are less than 1 % (Table 2) (Joseph et al. 2010b). As these
technologies are new and emerging, their deployment and resulting exposures are limited.
In residential and suburban environments DECT results in the second highest exposure
contributions (after GSM900) of 15.7 and 23.8 %, respectively (Fig. 6). Average contributions
due to WiFi are limited and lower than 2 % for all environments. Furthermore in each
environment the DECT and WiFi signals are present. Fig. 6 illustrates again that the exposure
to DECT is significantly higher than to WiFi. Also in Tomitsch et al. 2010, DECT caused the
highest exposures in bedrooms: a maximal value of 4872 μW/m2 (1.4 V/m) was measured.
Here we obtained values up to 2.7 V/m: in our study more different types of environments and
both indoor and outdoor exposures are considered.
16
In each environment the FM, T-DAB, PMR, and Analogue TV – DVB-T signals were
measured, these signals contribute on average less than 20 % to the total value.
F. Outdoor versus indoor exposure
In this section indoor and outdoor exposures are discussed. Table 6 lists the 50th
percentile
(p50) and the 95th
percentile (p95) of the different signals in all environments. The dominating
outdoor source is GSM900 (p95 = 1.9 V/m), indoor DECT dominates (p95 = 1.5 V/m). 95th
percentiles for total indoor and outdoor exposures do not differ much and are about 2.2 V/m.
Higher total outdoor values (p50 and p95) of mobile telecommunication signals were obtained
than at indoor locations (last row of Table 6). For the emerging technologies UMTS-HSPA
(outdoor p95 = 0.6 V/m, indoor p95 = 0.4 V/m) and LTE (outdoor p95 = 0.7 V/m and indoor
p95 = 0.1 V/m), similar conclusions can be drawn. Total outdoor exposure of mobile
telecommunications is higher than indoor exposure because only exposure of base stations is
considered (handset exposures are not included in the study), which are outdoor sources and
are dominant outdoor. The propagation of base station signals into houses and buildings is
subject to penetration losses (Plets et al. 2009).
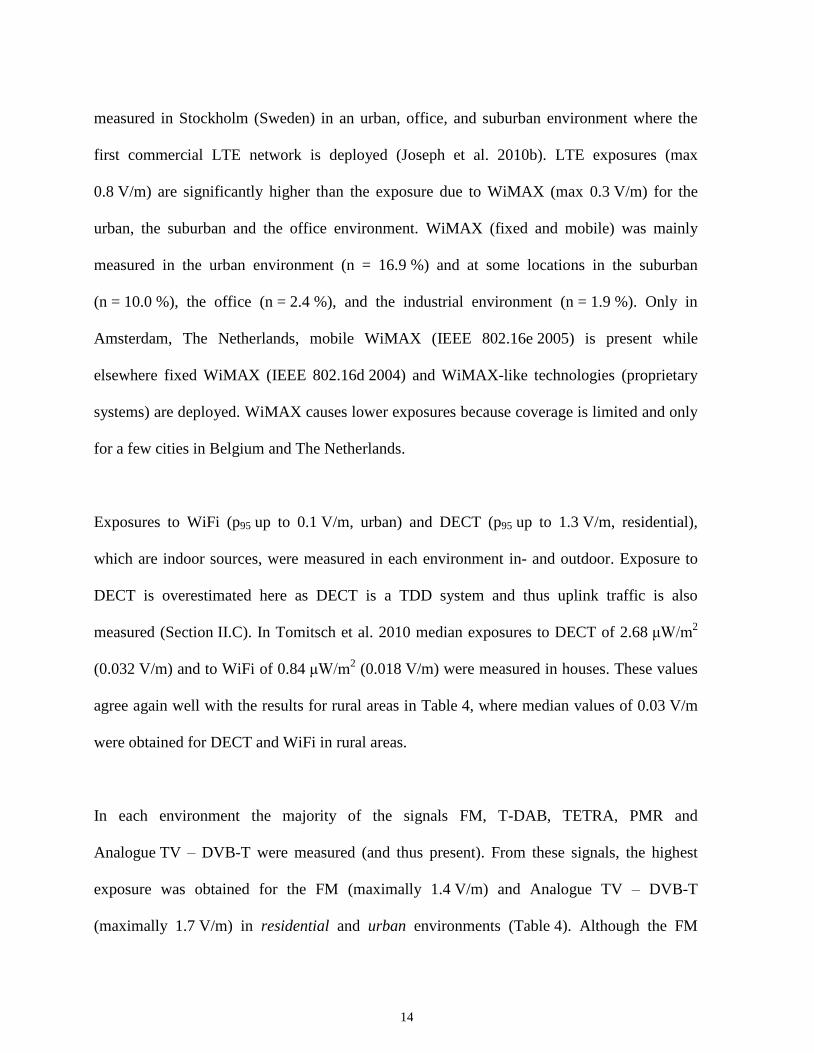
Fig. 7 shows the average power density contribution of each signal for the indoor and outdoor
measurements. Outdoor as well as indoor, the mobile telecommunication signals produce the
highest contributions: on average GSM900 (out: 57.5 %, in: 42.4 %) produced the highest
contribution followed by GSM1800 (out: 16.9 %, in: 7.2 %), UMTS-HSPA (out: 5.4 %, in:
3.5 %), LTE (< 1 %) and WiMAX (< 1 %). DECT is important at indoor locations (28.9 %,
also Table 6).
17
For DECT and WiFi higher percentiles in Table 6 are obtained indoor than outdoor: DECT
and WiFi signals are indoor sources and the access points for these technologies are installed
indoor. The average contribution of DECT equals 6.2% outdoor while indoor the contribution
is 28.9 % (Fig. 7). For WiFi the average contribution is 0.4 % outdoor while indoor 3.4 %.
Fig. 7 shows that the FM, T-DAB, TETRA, PMR and Analogue TV – DVB-T signals were
measured indoor as well as outdoor. There is no significant difference between the
contributions of these signals indoor and outdoor.
G. Comparison with related research
Median RF exposures in Tomitsch et al. 2010, where exposure in bedrooms of mainly rural
houses was investigated, agree well with the values of Table 4 in rural areas. In Tomitsch et
al. 2010 the following median exposures were obtained: 4.42 μW/m2 (0.041 V/m) for
GSM900, 0.81 μW/m2 (0.018 V/m) for GSM1800, 0.60 μW/m
2 (0.015 V/m) for UMTS. We
obtained 0.08, 0.03, and 0.02 V/m for GSM900, GSM1800, and UMTS, respectively (p50
values for rural environments in Table 4). According to Bornkessel et al. 2007, exposures in
the surrounding of GSM and UMTS base stations are mainly in the range below 2 % of
ICNIRP field strength limits and may reach more than 10 %. This agrees with our results for
GSM (max 9.3 %) and UMTS-HSPA (2.3 %). Highest values of about 5 V/m were measured
for both GSM and UMTS for 11 specific scenarios (not randomly as in our study). Also GSM
exposures are mostly higher than UMTS in Bornkessel et al. 2007 (85 %), as in our
measurements. Electric-field values for WiMAX up to 0.8 V/m were found in Bornkessel et
al. 2008, which is higher than in our study (0.3 V/m, Table 2) but of the same order. The
higher fields in Bornkessel et al. 2008 can be explained by the fact that fields around specific

18
WiMAX base station sites were investigated. Exposures to the different signals are
comparable to results in literature, but will not be discussed here in detail (Lehmann et al.
2002, Joseph et al. 2006, Neubauer et al. 2002). Higher exposures to TV and radio
transmitters are possible in specific regions (Sirav and Seyhan, 2009). Field distributions have
not been modelled in Tomitsch et al. 2010, in contrary to our results of Section III.B.
Here we obtained significant lower exposures in rural areas. This is consistent with Tomitsch
et al. 2010 and Lönn et al. 2004, where higher mobile phone output powers were found in rural
compared to urban areas, indicating lower base station signal intensity in rural areas.
Measurement campaigns of RF exposures using personal exposimeters and their results have
been presented in Frei et al., 2009, Joseph et al., 2008b, 2010, 2010c, Knafl et al., 2008,
Neubauer et al., 2007, Roösli et al., 2008, Viel et al., 2009. Exposimeters are not suitable for
accurate field assessment and current personal exposimeters cannot measure LTE, but one can
use these to obtain a rough idea about exposure distributions. Also in Joseph et al., 2008b and
Viel et al., 2009 it was concluded that exposures and especially downlink GSM exposures are
higher in urban areas than in rural areas.
IV. CONCLUSIONS
In-situ electromagnetic radio frequency exposure to existing and emerging wireless
technologies is accurately assessed using spectrum analyzer measurements at 311 locations
(68 indoor, 243 outdoor), subdivided into 6 different categories (rural, residential, urban,
suburban, office, and industrial) and geographically spread across Belgium, The Netherlands,
and Sweden. Measurement procedures and settings of measurement equipment are provided.
19
The maximal total value was measured in a residential environment and equals 3.9 V/m
mainly due to the GSM900 signal (11 times below the ICNIRP reference levels). Exposure
ratios for maximal electric-field values, range from 0.5 % (WiMAX) to 9.3 % (GSM900) for
the 311 measurement locations. The exposure ratios for total exposures vary from 3.1 % for
the rural environment to 9.4 % for the residential environment. Exposures are lognormally
distributed and are in general the lowest in rural environments and the highest in urban
environments. The dominating outdoor source is GSM900 (95th
percentile of 1.9 V/m), indoor
DECT dominates (95th
percentile 1.5 V/m) if present.
The average contribution to the total electric field is for GSM more than 60 %. Except for the
rural environment average contributions of UMTS-HSPA are more than 3 %. The
contributions of LTE and WiMAX are on average less than 1 %.
Future research will consist of the investigation of the temporal behavior of RF signals and
the influence of usage traffic. As exposures vary during time, future exposure assessment will
have to take this into account. Also comparison of narrowband measurements with
exposimeter data is part of future research.
REFERENCES
Bolte J, Van der Zande G, Kamer J. Calibration and Uncertainties in Personal Exposure
Measurementsof Radiofrequency Electromagnetic Fields. Bioelectromagnetics; 2011
DOI 10.1002/bem.20677.
20
Bornkessel C, Schubert M, Wuschek M, Schmidt P. Determination of the general public
exposure around GSM and UMTS base stations. Radiat Prot Dosimetry (124):40-47;
2007.
Bornkessel C, Schubert M, Wuschek M. Determination of the public's exposure caused by
WiMAX transmitters. German Mobile Telecommunication Research Programme
(DMF); 2008. Available at www.emf-
forschungsprogramm.de/akt_emf_forschung.html/dosi_HF_001.html Accessed 25
June 2010.
CENELEC European Committee for Electrotechnical Standardisation TC 106x WG1 EN
50492 in situ. Basic standard for the in-situ measurement of electromagnetic field
strength related to human exposure in the vicinity of base stations; 2008.
Federal Communications Commission (FCC). Evaluating Compliance with FCC Guidelines
for Human Exposure to Radiofrequency Electromagnetic Fields. Washington, DC,
Tech. Rep. Suppl. C to OET Bulletin 65; 2001.
Foster KR. Radiofrequency exposure from wireless LANs using Wi-Fi technology. Health
Phys 92(3):280-289; 2007.
Frei P, Mohler E. Neubauer G, Theis G, Burgi A, Frohlich J, Braun-Fahrlander C, Bolte J,
Egger M, Roösli, M. Temporal and spatial variability of personal exposure to
radiofrequency electromagnetic fields. Environmental Research (109):779–785; 2009.
International Commission on Non-ionizing Radiation Protection (ICNIRP). Guidelines for
limiting exposure to time-varying electric, magnetic, and electromagnetic fields (up
300 GHz). Health Phys 74(4):494-522; 1998.

21
Institute of Electrical and Electronics Engineers IEEE 802.16d – 2004. IEEE Standard for
Local and metropolitan area networks Part 16: Air interface for fixed broadband
wireless access systems. Piscataway New York: IEEE; 2004.
Institute of Electrical and Electronics Engineers IEEE 802.16e-2005. IEEE Standard for Local
and Metropolitan Area Networks Part 16: Air Interface for Fixed and Mobile Broadband
Wireless Access Systems Amendment 2: Physical and Medium Access Control Layers
for Combined Fixed and Mobile Operation in Licensed Bands and Corrigendum 1
Corrigendum to IEEE Std 802.16-2004 (Revision of IEEE Std 802.16-2001).
Piscataway New York: IEEE; 2005.
Institute of Electrical and Electronics Engineers IEEE C95.1-2005. IEEE Standard for Safety
Levels with Respect to Human Exposure to Radio Frequency Electromagnetic Fields,
3 kHz to 300 GHz. Piscataway New York: IEEE; 2005.
International Telecommunication Union ITU-R Recommendation SM.1708. Field-strength
measurements along a route with geographical coordinate registrations. Geneva,
Switzerland ITU-R. 1708; 2005.
Joseph W, Verloock L, Martens L. Reconstruction of the Polarization Ellipse of the EM field
of Base Station Antennas by a Fast and Low-cost Measurement Method. IEEE Trans.
Electromag. Compat, 48(2): 385 – 396; 2006.
Joseph W, Verloock L, Martens L. Accurate determination of the electromagnetic field due to
WiMAX base station antennas. IEEE Trans. Electromag. Compat. 50(3):730-735;
2008.

22
Joseph W, Vermeeren G, Verloock L, Heredia MM, Martens L. Characterization of personal
RF electromagnetic field exposure and actual absorption for the general public. Health
Phys 95(3):317-30; 2008b.
Joseph W, Vermeeren G, Verloock L, Martens L. Estimation of whole-body SAR from
electromagnetic fields using personal exposure meters. Bioelectromagnetics 31(4): 286-
295; 2010.
Joseph W, Verloock L, Goeminne F, Vermeeren G, Martens L. Assessment of general public
exposure to LTE and RF sources present in an urban environment.
Bioelectromagnetics 31(7):576-579; 2010b.
Joseph W., Frei P., Roösli M., Thuróczy G., Gajsek P., Trcek T., Bolte J., Vermeeren G.,
Mohler E., Juhasz P., Finta V., Martens L. Comparison of personal radio frequency
electromagnetic field exposure in different urban areas across Europe. Environmental
Research 110(2010):658 – 663; 2010c.
Kim BC, Choi H-D, Park S-O. Methods of evaluating human exposure to electromagnetic
fields radiated from operating base stations in Korea. Bioelectromagnetics 29(7):579-
582; 2008.
Knafl U, Lehmann H, and Riederer, M. Electromagnetic Field Measurements Using Personal
Exposimeters, Bioelectromagnetics 29:160-162; 2008.
Kuhn S, Lott U, Kramer A, Kuster N. Assessment Methods for Demonstrating Compliance
With Safety Limits of Wireless Devices Used in Home and Office Environments. IEEE
Trans. Electromag. Compat. 49(3): 519-525; 2007.
Kutner M H, Nachtsheim C, Neter J, and Li W. Applied Linear Statistical Models 5th ed.
McGraw-Hill/Irwin; 2005.

23
Lehmann H, Fritschi P, Eicher B. Indoor measurements of the electrical field close to mobile
phone base stations. Proceedings of 27th triennial General Assembly of the International
Union of Radio Science, Maastricht, The Netherlands, URSI: paper 2112; 2002.
Lönn S, Forssen U, Vecchia P, Ahlbom A, Feychting M. Output power levels from mobile
phones in different geographical areas: Implications for exposure assessment. Occup
Environ Med 61: 769–772; 2004.
Myhr J. Measurement method for the exposure to electromagnetic field strength from WLAN
systems. Master thesis, Chalmers University of Technology, Goteborg, Sweden; 2004.
Neubauer G, Giczi W, Schmid G. An optimized method to determine exposure due to GSM
base stations applied in the city of Salzburg. Proceedings 24rd Annual Meeting of the
Bioelectromagnetics Society, Quebec, Canada, BEMS: 46-47; 2002.
Neubauer G, Feychting M, Hamnerius Y, Kheifets L, Kuster N, Ruiz I, Schuz J, Uberbacher
R, Wiart J, Röösli M. Feasibility of future epidemiological studies on possible health
effects of mobile phone base stations. Bioelectromagnetics 28:224-230; 2007.
Olivier C and Martens L. Optimal settings for frequency-selective measurements used for the
exposure assessment around UMTS base stations. IEEE Trans. on Instr. Meas. 56(5):
1901-1909; 2007.
Plets D, Joseph W, Verloock L, Tanghe E, Martens L, Gauderis H, and Deventer E. Extensive
Penetration Loss Measurements and Models for Different Building Types for DVB-H in
the UHF Band., IEEE Transactions on Broadcasting 55(3):213-222; 2009.
Röösli M, Frei P, Mohler E, Braun-Fahrländer C, Burgi A, Fröhlich J, Neubauer G, Theis G,
Egger M. Statistical analysis of personal radiofrequency electromagnetic field
measurements with nondetects. Bioelectromagnetics 29(6):471-478; 2008.
24
Schmid G., Preiner P., Lager D., Überbacher R., and Georg R. Exposure of the general public
due to wireless LAN applications in public places. Radiation Protection Dosimetry
124(1): 48-52; 2007.
Sirav B and Seyhan N. Radio frequency radiation (RFR) from TV and radio transmitters at a
pilot region in Turkey. Radiat Prot Dosimetry 136(2):114-117; 2009.
Tomitsch J, Dechant E, and Frank W. Survey of Electromagnetic Field Exposure in Bedrooms
of Residences in Lower Austria. Bioelectromagnetics 31: 200-208; 2010.
Verloock L, Joseph W, Vermeeren G, and Martens L. Procedure for assessment of general
public exposure from WLAN in offices and in wireless sensor network testbed. Health
Physics 98(4): 628-638; 2010.
Viel JF, Cardis E, Moissonnier M, de Seze R, Hours M. Radiofrequency exposure in the
French general population: Band, time, location and activity variability. Environ Int.
35(8): 1150-1154; 2009.
WHO World Health Organization. Available at http://www.who.int/peh-
emf/research/agenda/en/index.html Accessed 17 May 2010.
25
Author affiliations
Wout, Joseph *, Leen, Verloock *, Francis, Goeminne *, Günter Vermeeren *, and Luc,
Martens *
*Department of Information Technology, Ghent University / IBBT
Gaston Crommenlaan 8, B-9050 Ghent, Belgium, fax: +32 9 33 14899
(email:[email protected])
Acknowledgement: W. Joseph is a Post-Doctoral Fellow of the FWO-V (Research
Foundation–Flanders). The authors wish to thank the GSMA and WiMAX forum for the
financial support.

26
List of captions
Table 1: Considered environments, description, and number of measurement locations.
Table 2: Electric-field strengths [V/m] for the different RF signals for the different locations,
the exposure ratio, and the average and maximal power density contribution.
Table 3: Settings of spectrum analyzer for exposure assessment of different RF signals using
max-hold setting.
Table 4: Summary of narrowband measurements with spectrum analyzer in different
environments.
Table 5: Average value and standard deviation for lognormal fits (all data and per
environment).
Table 6: Comparison of indoor and outdoor exposures.
Figure 1: (a) Indication of the measurement locations on a map of Belgium and The
Netherlands and (b) indication of the measured total electric-field strength (E [V/m]) on the
map of the Stockholm, Sweden.
Figure 2: CDF of total exposures for different environments.
Figure 3: CDF of total exposure for all data: measurement versus fit.
Figure 4: Median and 95th
percentiles of total exposures Etot for the different environments.
Figure 5: (a) Exposure ratio ER for the different RF signals and (b) ER for total values per
environment.
Figure 6: Average contributions [%] of the different signals measured in the various
environments.
Figure 7: Average contributions [%] of the different signals measured indoor and outdoor.
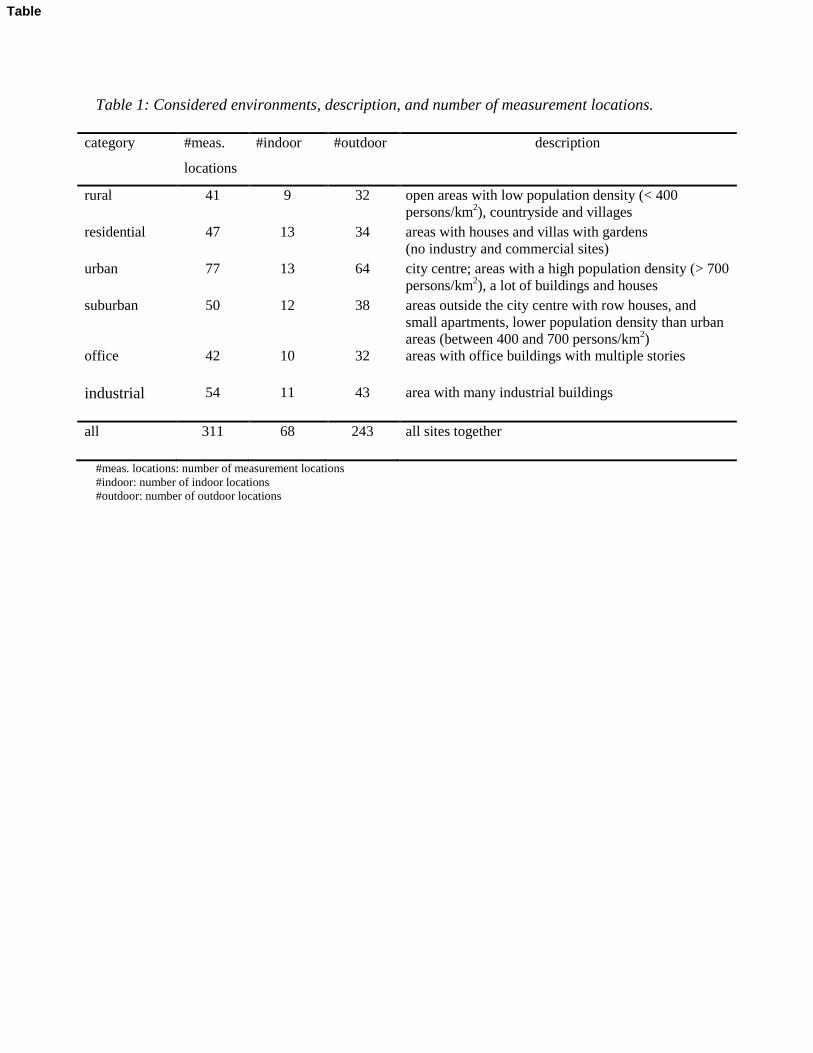
Table 1: Considered environments, description, and number of measurement locations.
category #meas.
locations
#indoor #outdoor description
rural 41 9 32 open areas with low population density (< 400
persons/km2), countryside and villages
residential 47 13 34 areas with houses and villas with gardens
(no industry and commercial sites)
urban 77 13 64 city centre; areas with a high population density (> 700
persons/km2), a lot of buildings and houses
suburban 50 12 38 areas outside the city centre with row houses, and
small apartments, lower population density than urban
areas (between 400 and 700 persons/km2)
office 42 10 32 areas with office buildings with multiple stories
industrial 54 11 43 area with many industrial buildings
all 311 68 243 all sites together
#meas. locations: number of measurement locations
#indoor: number of indoor locations
#outdoor: number of outdoor locations
Table

Table 2: Electric-field strengths [V/m] for the different RF signals for the different locations, the
exposure ratio, and the average and maximal power density contribution.
RF signal Frequency
band
[MHz]
Variation 311
meas. locations ICNIRP
ref. level
[V/m]
Eavg
[V/m]
Exposure
ratio ER1
[%]
ERS2
[%]
AC3
[%]
MC4
[%]
Emin
[V/m]
Emax
[V/m]
FM 100 0.005 1.44 28 0.15 5.14 0.26 7.6 96.7
T-DAB 220 0.011 0.28 28 0.04 1.01 0.01 0.1 6.9
TETRA 390 0.002 0.45 28 0.04 1.59 0.03 0.5 19.0
PMR 146 – 174
406 – 470 0.002 0.29 28-29.8 0.03 0.99 0.01 0.3 39.2
Analogue TV
– DVB-T
174 – 223
470 – 830 0.003 1.65 28-39.6 0.09 4.17 0.35 4.7 92.0
GSM900 900 0.013 3.85 41.3 0.49 9.33 0.87 53.2 100.0
GSM1800 1800 0.007 2.15 58.3 0.24 3.68 0.14 15.1 86.8
DECT 1880 0.008 2.67 59.6 0.15 4.48 0.20 11.3 99.9
UMTS-HSPA 2100 0.011 1.41 61 0.16 2.31 0.05 5.7 89.5
WiFi 2400 0.000 0.54 61 0.03 0.88 0.01 1.1 72.6
LTE 2600 0.024 0.76 61 0.19 1.24 0.02 0.4 23.2
WiMAX 3500 0.014 0.28 61 0.07 0.46 0.002 0.2 38.8
Total all
signals - 0.023 3.90 - 0.71 - - - -
1 Exposure ratio ER = maximal field value/ICNIRP reference level. 2 Exposure ratio ERS = maximal power density/ICNIRP reference level. 3 AC = average power density contribution over 30 locations. 4 MC = maximal power density contribution over 30 locations.
FM = frequency modulation, T-DAB = Terrestrial - Digital Audio Broadcasting, TETRA = Terrestrial Trunked Radio, PMR =
Private Mobile Radio, DVB-T = Digital Video Broadcasting - Terrestrial, GSM = Global System for Mobile Communications,
UMTS = Universal Mobile Telecommunications System, DECT = Digital Enhanced Cordless Telecommunications, HSPA =
High Speed Packet Access, WiFi = Wireless Fidelity 802.11, LTE = Long Term Evolution, WiMAX = Worldwide
Interoperability for Microwave Access
Table
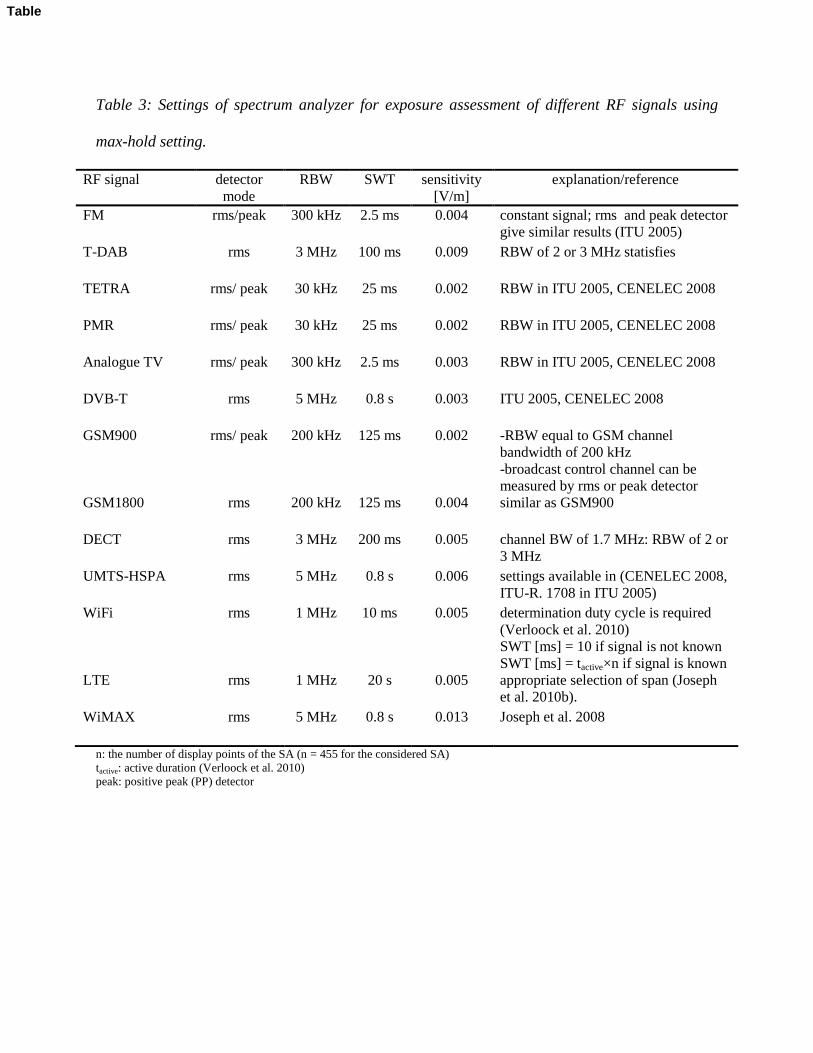
Table 3: Settings of spectrum analyzer for exposure assessment of different RF signals using
max-hold setting.
RF signal detector
mode
RBW SWT sensitivity
[V/m]
explanation/reference
FM rms/peak 300 kHz 2.5 ms 0.004 constant signal; rms and peak detector
give similar results (ITU 2005)
T-DAB rms 3 MHz 100 ms 0.009 RBW of 2 or 3 MHz statisfies
TETRA rms/ peak 30 kHz 25 ms 0.002 RBW in ITU 2005, CENELEC 2008
PMR rms/ peak 30 kHz 25 ms 0.002 RBW in ITU 2005, CENELEC 2008
Analogue TV rms/ peak 300 kHz 2.5 ms 0.003 RBW in ITU 2005, CENELEC 2008
DVB-T rms 5 MHz 0.8 s 0.003 ITU 2005, CENELEC 2008
GSM900 rms/ peak 200 kHz 125 ms 0.002 -RBW equal to GSM channel
bandwidth of 200 kHz
-broadcast control channel can be
measured by rms or peak detector
GSM1800 rms 200 kHz 125 ms 0.004 similar as GSM900
DECT rms 3 MHz 200 ms 0.005 channel BW of 1.7 MHz: RBW of 2 or
3 MHz
UMTS-HSPA rms 5 MHz 0.8 s 0.006 settings available in (CENELEC 2008,
ITU-R. 1708 in ITU 2005)
WiFi rms 1 MHz 10 ms 0.005 determination duty cycle is required
(Verloock et al. 2010)
SWT [ms] = 10 if signal is not known
SWT [ms] = tactive×n if signal is known
LTE rms 1 MHz 20 s 0.005 appropriate selection of span (Joseph
et al. 2010b).
WiMAX rms 5 MHz 0.8 s 0.013 Joseph et al. 2008
n: the number of display points of the SA (n = 455 for the considered SA)
tactive: active duration (Verloock et al. 2010)
peak: positive peak (PP) detector
Table
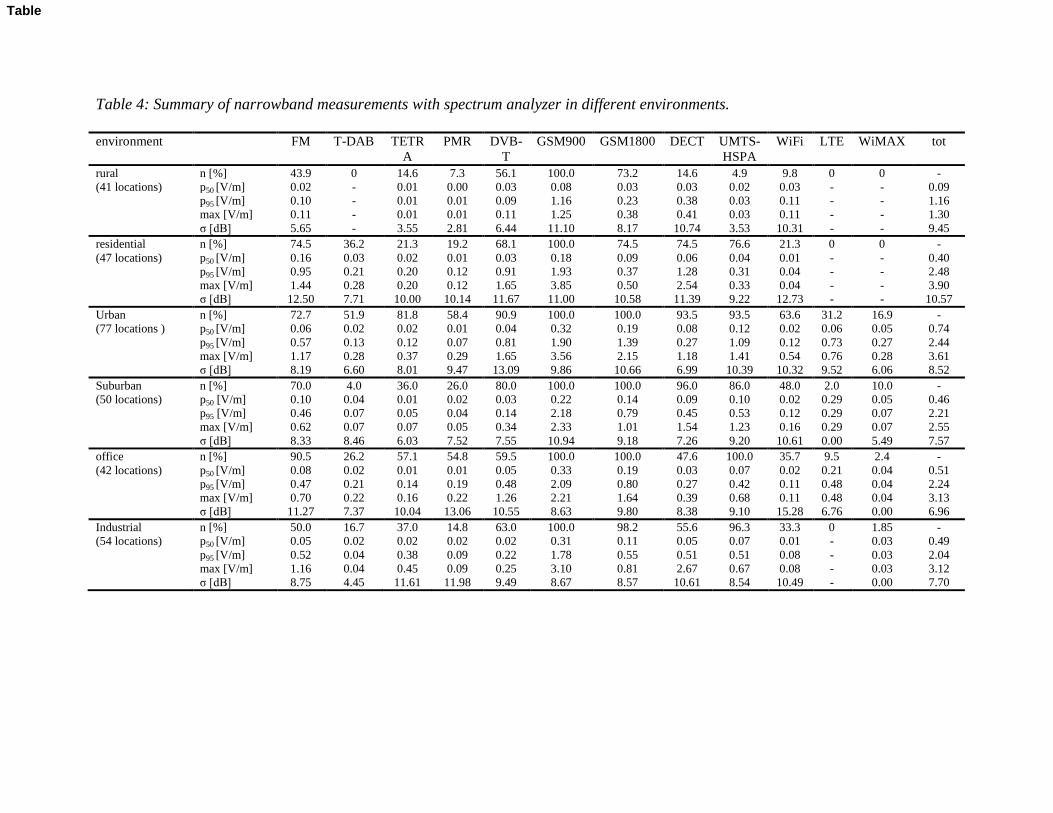
Table 4: Summary of narrowband measurements with spectrum analyzer in different environments.
environment FM T-DAB TETR
A
PMR DVB-
T
GSM900 GSM1800 DECT UMTS-
HSPA
WiFi LTE WiMAX tot
rural n [%] 43.9 0 14.6 7.3 56.1 100.0 73.2 14.6 4.9 9.8 0 0 -
(41 locations) p50 [V/m] 0.02 - 0.01 0.00 0.03 0.08 0.03 0.03 0.02 0.03 - - 0.09
p95 [V/m] 0.10 - 0.01 0.01 0.09 1.16 0.23 0.38 0.03 0.11 - - 1.16
max [V/m] 0.11 - 0.01 0.01 0.11 1.25 0.38 0.41 0.03 0.11 - - 1.30
σ [dB] 5.65 - 3.55 2.81 6.44 11.10 8.17 10.74 3.53 10.31 - - 9.45
residential n [%] 74.5 36.2 21.3 19.2 68.1 100.0 74.5 74.5 76.6 21.3 0 0 -
(47 locations) p50 [V/m] 0.16 0.03 0.02 0.01 0.03 0.18 0.09 0.06 0.04 0.01 - - 0.40
p95 [V/m] 0.95 0.21 0.20 0.12 0.91 1.93 0.37 1.28 0.31 0.04 - - 2.48
max [V/m] 1.44 0.28 0.20 0.12 1.65 3.85 0.50 2.54 0.33 0.04 - - 3.90
σ [dB] 12.50 7.71 10.00 10.14 11.67 11.00 10.58 11.39 9.22 12.73 - - 10.57
Urban n [%] 72.7 51.9 81.8 58.4 90.9 100.0 100.0 93.5 93.5 63.6 31.2 16.9 -
(77 locations ) p50 [V/m] 0.06 0.02 0.02 0.01 0.04 0.32 0.19 0.08 0.12 0.02 0.06 0.05 0.74
p95 [V/m] 0.57 0.13 0.12 0.07 0.81 1.90 1.39 0.27 1.09 0.12 0.73 0.27 2.44
max [V/m] 1.17 0.28 0.37 0.29 1.65 3.56 2.15 1.18 1.41 0.54 0.76 0.28 3.61
σ [dB] 8.19 6.60 8.01 9.47 13.09 9.86 10.66 6.99 10.39 10.32 9.52 6.06 8.52
Suburban n [%] 70.0 4.0 36.0 26.0 80.0 100.0 100.0 96.0 86.0 48.0 2.0 10.0 -
(50 locations) p50 [V/m] 0.10 0.04 0.01 0.02 0.03 0.22 0.14 0.09 0.10 0.02 0.29 0.05 0.46
p95 [V/m] 0.46 0.07 0.05 0.04 0.14 2.18 0.79 0.45 0.53 0.12 0.29 0.07 2.21
max [V/m] 0.62 0.07 0.07 0.05 0.34 2.33 1.01 1.54 1.23 0.16 0.29 0.07 2.55
σ [dB] 8.33 8.46 6.03 7.52 7.55 10.94 9.18 7.26 9.20 10.61 0.00 5.49 7.57
office n [%] 90.5 26.2 57.1 54.8 59.5 100.0 100.0 47.6 100.0 35.7 9.5 2.4 -
(42 locations) p50 [V/m] 0.08 0.02 0.01 0.01 0.05 0.33 0.19 0.03 0.07 0.02 0.21 0.04 0.51
p95 [V/m] 0.47 0.21 0.14 0.19 0.48 2.09 0.80 0.27 0.42 0.11 0.48 0.04 2.24
max [V/m] 0.70 0.22 0.16 0.22 1.26 2.21 1.64 0.39 0.68 0.11 0.48 0.04 3.13
σ [dB] 11.27 7.37 10.04 13.06 10.55 8.63 9.80 8.38 9.10 15.28 6.76 0.00 6.96
Industrial n [%] 50.0 16.7 37.0 14.8 63.0 100.0 98.2 55.6 96.3 33.3 0 1.85 -
(54 locations) p50 [V/m] 0.05 0.02 0.02 0.02 0.02 0.31 0.11 0.05 0.07 0.01 - 0.03 0.49
p95 [V/m] 0.52 0.04 0.38 0.09 0.22 1.78 0.55 0.51 0.51 0.08 - 0.03 2.04
max [V/m] 1.16 0.04 0.45 0.09 0.25 3.10 0.81 2.67 0.67 0.08 - 0.03 3.12
σ [dB] 8.75 4.45 11.61 11.98 9.49 8.67 8.57 10.61 8.54 10.49 - 0.00 7.70
Table
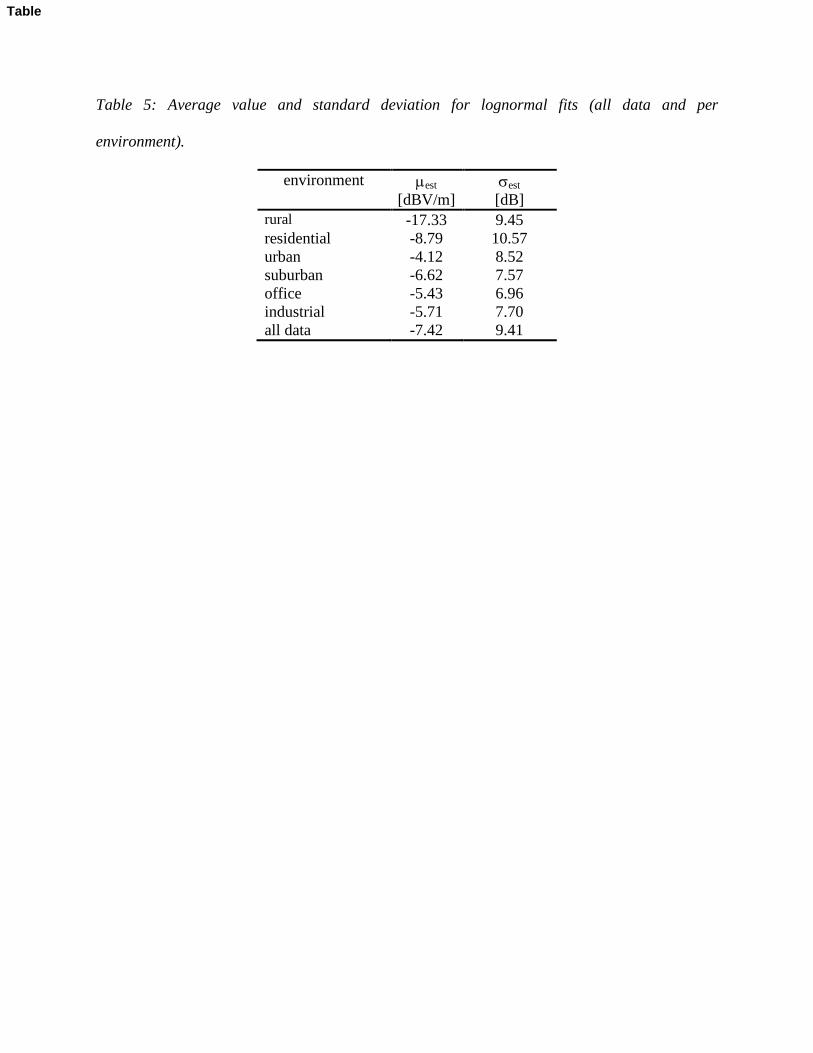
Table 5: Average value and standard deviation for lognormal fits (all data and per
environment).
environment est
[dBV/m]
est
[dB]
rural -17.33 9.45
residential -8.79 10.57
urban -4.12 8.52
suburban -6.62 7.57
office -5.43 6.96
industrial -5.71 7.70
all data -7.42 9.41
Table

Table 6: Comparison of indoor and outdoor exposures.
indoor outdoor all
frequency band p50
[V/m]
p95
[V/m]
p50
[V/m]
p95
[V/m]
p50
[V/m]
p95
[V/m]
FM 0.06 0.71 0.07 0.59 0.07 0.59
T-DAB 0.02 0.11 0.02 0.16 0.02 0.13
TETRA 0.01 0.17 0.01 0.17 0.01 0.17
PMR 0.01 0.19 0.01 0.13 0.01 0.13
Analogue TV – DVB-T 0.02 0.47 0.03 0.32 0.03 0.33
GSM900 0.10 0.91 0.29 1.90 0.24 1.85
GSM1800 0.04 0.49 0.15 0.81 0.13 0.79
DECT 0.12 1.50 0.06 0.22 0.07 0.49
UMTS-HSPA 0.03 0.44 0.10 0.61 0.08 0.54
WiFi 0.04 0.16 0.01 0.10 0.02 0.11
LTE 0.10 0.12 0.07 0.73 0.08 0.72
WiMAX 0.18 0.28 0.05 0.15 0.05 0.24
Total GSM/UMTS-
HSPA/LTE/WiMAX 0.11 1.31 0.40 2.20 0.32 2.14
Total all signals 0.28 2.18 0.51 2.22 0.45 2.22
Table

Figure
0 0.5 1 1.5 2 2.5 3 3.5 40
0.1
0.2
0.3
0.4
0.5
0.6
0.7
0.8
0.9
1
Etot
[V/m]
Pro
b[E
tot [V
/m] <
abs
ciss
a]
RuralResidentialSuburbanUrbanIndustrialOffice
Figure
0 0.5 1 1.5 2 2.5 3 3.5 40
0.1
0.2
0.3
0.4
0.5
0.6
0.7
0.8
0.9
1
Etot
[V/m]
Pro
b[E
tot [V
/m] <
abs
ciss
a]
measurementlognormal
Figure

0
0.5
1
1.5
2
2.5
3
3.5
4
environment
Eto
t [V/m
]
rura
l
resid
entia
l
subu
rban
urba
n
indus
trial
offic
e
medianp
95
Figure

(a)
(b)
Figure
Figure

Figure

![A Compact Dual-Band Rectenna for GSM900 and GSM1800 … · ious dual-band rectennas [3], broadband rectennas [4, 5], and multiband rectennas [6] are reported in recent years. Several](https://static.fdocuments.in/doc/165x107/60d53f7e76b1547e045b0c36/a-compact-dual-band-rectenna-for-gsm900-and-gsm1800-ious-dual-band-rectennas-3.jpg)