ASSESSMENT OF NITROGEN FLOW PATHWAYS AND ITS …
14
Collins, S. B., Singh, R., Rivas, A., Palmer, A., Horne, D., Roygard, J. & Matthews, A., 2016. Assessment of nitrogen flow pathways and its potential attenuation in shallow groundwaters in the Lower Rangitikei catchment. In: Integrated nutrient and water management for sustainable farming. (Eds L. D. Currie and R. Singh). http://flrc.massey.ac.nz/publications.html. Occasional Report No. 29. Fertilizer and Lime Research Centre, Massey University, Palmerston North, New Zealand. 14 pages. 1 ASSESSMENT OF NITROGEN FLOW PATHWAYS AND ITS POTENTIAL ATTENUATION IN SHALLOW GROUNDWATERS IN THE LOWER RANGITIKEI CATCHMENT Collins, S 1,2 ; Singh, R 2 ; Rivas, A 2 ; Palmer, A 2 ; Horne, D 2 , Roygard, J 1 & Matthews, A 1 1 Horizons Regional Council, Palmerston North, New Zealand 2 Massey University, Palmerston North, New Zealand Email: [email protected] Abstract We assessed surface water and groundwater interactions, and nitrogen flow and its potential attenuation in shallow groundwater in the lower Rangitikei catchment. The study area covers about 850 km 2 between the townships of Bulls and Sanson in the east, Tangimoana in the south and Santoft in the north. A piezometric map, developed from measured depths to groundwater in about 100 wells in October 2014, suggests that groundwater flow, in particular the shallow groundwater (<30 m), is heavily influenced by the regional topography. Shallow groundwater flows mostly from elevated areas, such as Marton, in a south-westerly direction towards the Rangitikei River, whereas deeper groundwater (>30 m) showed relatively less topographic influence. Groundwater discharges to the river upstream and downstream of Bulls, while groundwater recharge or no interaction with the river is more likely to occur near the coast. The groundwater redox characterisation, based on sampling and analysis of 15 groundwater wells, suggests that in general the groundwater across the lower Rangitikei catchment is under anoxic/reduced conditions. The groundwater typically has low dissolved oxygen concentrations (<1 mg/L) and elevated levels of electron donors (particularly DOC and Fe 2+ ) that are suitable for denitrification. We further measured NO 3 - -N attenuation in shallow groundwater piezometers (3-6 m bgl) using the single-well push-pull tests. The push-pull tests showed NO 3 - -N reduction at four of the five piezometers, with the rates of reduction varying from 0.04 mg N L -1 hr -1 to 1.57 mg N L -1 hr -1 . Keywords Agriculture, Denitrification, Nitrate-nitrogen (NO 3 - -N), Groundwater flow, Groundwater – surface water interactions, Redox reactions, and Push-pull test. 1. Introduction Excess nutrients in surface water bodies can lead to a sudden growth in plants and algae, a process known as eutrophication. The impacts of eutrophication can include algal blooms, oxygen deficiency, loss of habitat, loss of ecosystem functioning and a loss of biodiversity (Rabalais, 2002). The Australian and New Zealand Environment Conservation Council has determined the trigger value for eutrophication of surface water to be just 0.44 mg/L NO 3 - -N (Stenger et al., 2008). Intensive agricultural activities are generally associated with nitrogen leaching from soils which have the potential to percolate to groundwater (Harter et al., 2014). Fertiliser use, cow urine patches (Di & Cameron, 2002), irrigated agriculture and effluent spreading all have the potential to leach nitrate (NO 3 - ) over a large area and are therefore considered a diffuse source of contamination. In the New Zealand context, the increased use of fertilizers and intensification of agricultural activities have occurred in tandem with a
Transcript of ASSESSMENT OF NITROGEN FLOW PATHWAYS AND ITS …
Collins, S. B., Singh, R., Rivas, A., Palmer, A., Horne, D., Roygard, J. & Matthews, A., 2016. Assessment of nitrogen flow pathways and its
potential attenuation in shallow groundwaters in the Lower Rangitikei catchment. In: Integrated nutrient and water management for
sustainable farming. (Eds L. D. Currie and R. Singh). http://flrc.massey.ac.nz/publications.html. Occasional Report No. 29. Fertilizer and
Lime Research Centre, Massey University, Palmerston North, New Zealand. 14 pages.
1
ASSESSMENT OF NITROGEN FLOW PATHWAYS AND ITS
POTENTIAL ATTENUATION IN SHALLOW GROUNDWATERS IN
THE LOWER RANGITIKEI CATCHMENT
Collins, S1,2
; Singh, R2; Rivas, A
2; Palmer, A
2; Horne, D
2, Roygard, J
1 & Matthews, A
1
1Horizons Regional Council, Palmerston North, New Zealand
2Massey University, Palmerston North, New Zealand
Email: [email protected]
Abstract
We assessed surface water and groundwater interactions, and nitrogen flow and its potential
attenuation in shallow groundwater in the lower Rangitikei catchment. The study area covers
about 850 km2 between the townships of Bulls and Sanson in the east, Tangimoana in the
south and Santoft in the north. A piezometric map, developed from measured depths to
groundwater in about 100 wells in October 2014, suggests that groundwater flow, in
particular the shallow groundwater (<30 m), is heavily influenced by the regional topography.
Shallow groundwater flows mostly from elevated areas, such as Marton, in a south-westerly
direction towards the Rangitikei River, whereas deeper groundwater (>30 m) showed
relatively less topographic influence. Groundwater discharges to the river upstream and
downstream of Bulls, while groundwater recharge or no interaction with the river is more
likely to occur near the coast. The groundwater redox characterisation, based on sampling and
analysis of 15 groundwater wells, suggests that in general the groundwater across the lower
Rangitikei catchment is under anoxic/reduced conditions. The groundwater typically has low
dissolved oxygen concentrations (<1 mg/L) and elevated levels of electron donors
(particularly DOC and Fe2+
) that are suitable for denitrification. We further measured NO3--N
attenuation in shallow groundwater piezometers (3-6 m bgl) using the single-well push-pull
tests. The push-pull tests showed NO3--N reduction at four of the five piezometers, with the
rates of reduction varying from 0.04 mg N L-1
hr-1
to 1.57 mg N L-1
hr-1
.
Keywords
Agriculture, Denitrification, Nitrate-nitrogen (NO3--N), Groundwater flow, Groundwater –
surface water interactions, Redox reactions, and Push-pull test.
1. Introduction
Excess nutrients in surface water bodies can lead to a sudden growth in plants and algae, a
process known as eutrophication. The impacts of eutrophication can include algal blooms,
oxygen deficiency, loss of habitat, loss of ecosystem functioning and a loss of biodiversity
(Rabalais, 2002). The Australian and New Zealand Environment Conservation Council has
determined the trigger value for eutrophication of surface water to be just 0.44 mg/L NO3--N
(Stenger et al., 2008). Intensive agricultural activities are generally associated with nitrogen
leaching from soils which have the potential to percolate to groundwater (Harter et al., 2014).
Fertiliser use, cow urine patches (Di & Cameron, 2002), irrigated agriculture and effluent
spreading all have the potential to leach nitrate (NO3-) over a large area and are therefore
considered a diffuse source of contamination. In the New Zealand context, the increased use
of fertilizers and intensification of agricultural activities have occurred in tandem with a

2
change in land use over the last two or three decades. Over the period 1990-2007, the area
occupied by sheep and beef farming contracted 2.2 M ha as lowlands were converted to
dairying, arable cropping and horticulture, while steeper hill country areas were planted into
forestry (Quinn et al., 2009). Since 1990 there had been a major expansion in the dairy
industry, with 515,000 hectares of sheep and beef farms converted to dairy farming and a
17% increase in the stocking rate (Quinn et al., 2009). The more intensive nature of dairy
farming has meant a greater potential for NO3--N leaching to groundwater and surface waters
(Verloop et al., 2006).
Though fertiliser use in New Zealand has increased in recent decades, the biggest source of
NO3--N leaching is understood to be from cow urine patches (Di & Cameron, 2002). Only a
small amount of nitrogen ingested by a grazing animal is actually removed from the pasture in
animal products; a large proportion (between 60-90%) of the nitrogen ingested is returned to
the soil in the form of urine and manure (Haynes & Williams, 1993; Jarvis et al., 1995). The
nitrogen loading rate under a cow urine patch is equivalent to approximately 1000 kg N ha-1
(Di & Cameron, 2002). Some of this nitrogen gets lost through volatilisation, but most of it
gets nitrified, resulting in the accumulation of NO3--N in the soil. Because of the high loading
rate under the urine patch, and being well above the biological needs of the plant, there is a
high potential for the NO3--N to leach (Di & Cameron, 2002). The leaching potential is
particularly high during the autumn-winter-spring period in New Zealand (May to September)
when the soil is wet and excess water drains from the root zone (Di & Cameron, 2002).
Groundwater can contribute to the eutrophication of surface waters where they have some
degree of connection and the groundwater is nutrient rich (Smith et al., 1999). However,
leached NO3--N may be reduced, or ‘attenuated’, through a process of denitrification if
favourable conditions exist in the groundwater system (Korom, 1992). Under reducing
conditions, the process of denitrification breaks down NO3- (5+ oxidation state) to N2 (0
oxidation state) through intermediate compounds including NO2-, NO, and N2O (van der Perk,
2012).
The rate of denitrification is most often related to the amount of dissolved organic carbon
(DOC) in groundwater. DOC levels in most aquifers are relatively low, but sufficient for
denitrification, at <5 mg/L (Rivett et al., 2007). If DOC is too low and becomes a limiting
factor, other electron donors can take the place of DOC for electron transfer. In these cases,
reduced inorganic species such as Mn2+
, Fe2+
and HS- can serve as electron donors and
denitrification is carried out by autotrophic microbes (Korom, 1992). Reduction of NO3--N by
Fe2+
can proceed either abiotically or biotically. In abiotic reduction, it is thought Fe2+
acts to
promote denitrification where Fe2+
reduces NO3- to NO2
- and is subsequently regenerated by
the oxidation of organic carbon. NO2- can then be abiotically reduced in DOC-poor
environments by the further oxidation of iron (Rivett et al., 2008).
In New Zealand there is now a growing body of literature on nitrate attenuation in the
subsurface of agricultural catchments. Much of this work has taken place under the
Groundwater Assimilative Capacity programme in partnership between ESR, Lincoln
Ventures and AquaLinc Research (e.g. Stenger et al, 2012; Stenger et al., 2013). This work
has also been complemented by the work the Massey University Fertilizer and Lime Research
Centre (Massey FLRC) and Horizons Regional Council (HRC) has done in recent years on
NO3--N attenuation in shallow groundwater in the Horizons region (Rivas et al., 2014). As
yet, no such studies have been carried out on the Lower Rangitikei catchment to estimate the
denitrification capacity of the shallow groundwater.
3
The main objective of this study was to understand the groundwater flow pattern including its
interactions with the river, and determine the extent to which NO3--N could be potentially
being attenuated in shallow groundwaters in the Lower Rangitikei catchment. Specifically,
the objectives of this research were to:
Conduct river and groundwater surveys to map groundwater flow direction and its
interactions with the Rangitikei River;
Survey groundwater quality to assess redox conditions of groundwater; and
Measure ‘denitrification’ potential using groundwater monitoring and conducting
single well ‘push-pull’ tests in shallow groundwaters in the Lower Rangitikei river
catchment.
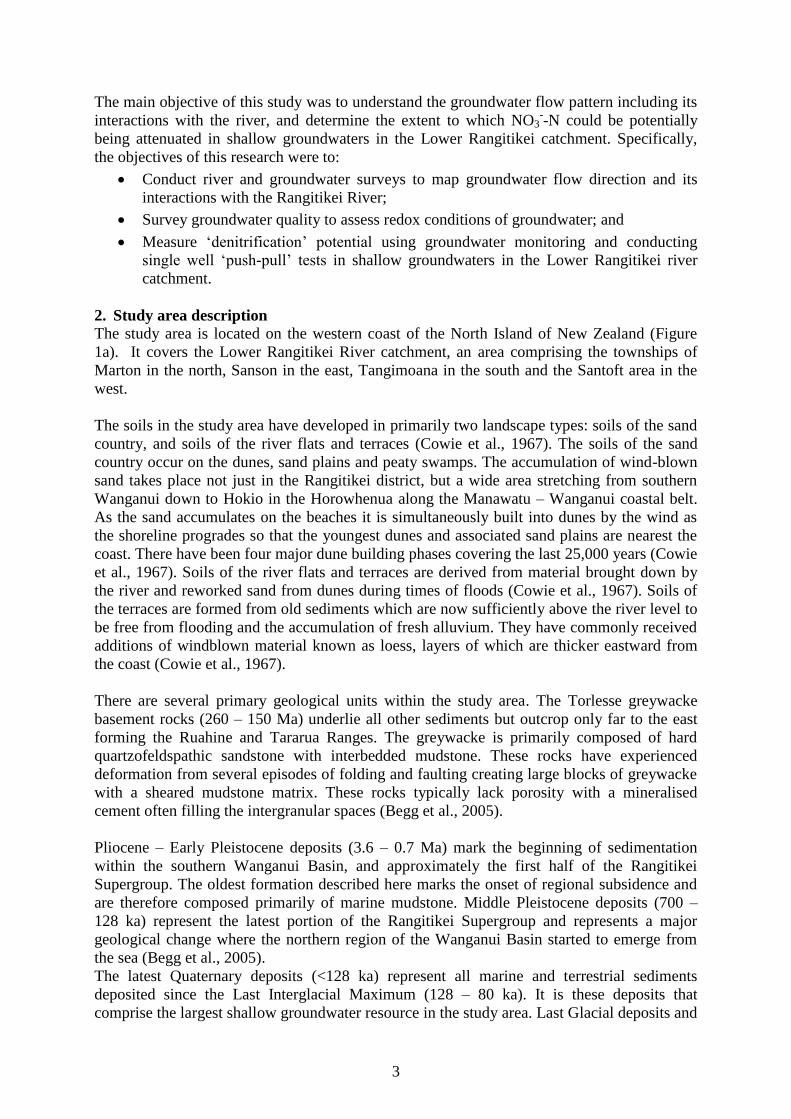
2. Study area description
The study area is located on the western coast of the North Island of New Zealand (Figure
1a). It covers the Lower Rangitikei River catchment, an area comprising the townships of
Marton in the north, Sanson in the east, Tangimoana in the south and the Santoft area in the
west.
The soils in the study area have developed in primarily two landscape types: soils of the sand
country, and soils of the river flats and terraces (Cowie et al., 1967). The soils of the sand
country occur on the dunes, sand plains and peaty swamps. The accumulation of wind-blown
sand takes place not just in the Rangitikei district, but a wide area stretching from southern
Wanganui down to Hokio in the Horowhenua along the Manawatu – Wanganui coastal belt.
As the sand accumulates on the beaches it is simultaneously built into dunes by the wind as
the shoreline progrades so that the youngest dunes and associated sand plains are nearest the
coast. There have been four major dune building phases covering the last 25,000 years (Cowie
et al., 1967). Soils of the river flats and terraces are derived from material brought down by
the river and reworked sand from dunes during times of floods (Cowie et al., 1967). Soils of
the terraces are formed from old sediments which are now sufficiently above the river level to
be free from flooding and the accumulation of fresh alluvium. They have commonly received
additions of windblown material known as loess, layers of which are thicker eastward from
the coast (Cowie et al., 1967).
There are several primary geological units within the study area. The Torlesse greywacke
basement rocks (260 – 150 Ma) underlie all other sediments but outcrop only far to the east
forming the Ruahine and Tararua Ranges. The greywacke is primarily composed of hard
quartzofeldspathic sandstone with interbedded mudstone. These rocks have experienced
deformation from several episodes of folding and faulting creating large blocks of greywacke
with a sheared mudstone matrix. These rocks typically lack porosity with a mineralised
cement often filling the intergranular spaces (Begg et al., 2005).
Pliocene – Early Pleistocene deposits (3.6 – 0.7 Ma) mark the beginning of sedimentation
within the southern Wanganui Basin, and approximately the first half of the Rangitikei
Supergroup. The oldest formation described here marks the onset of regional subsidence and
are therefore composed primarily of marine mudstone. Middle Pleistocene deposits (700 –
128 ka) represent the latest portion of the Rangitikei Supergroup and represents a major
geological change where the northern region of the Wanganui Basin started to emerge from
the sea (Begg et al., 2005).
The latest Quaternary deposits (<128 ka) represent all marine and terrestrial sediments
deposited since the Last Interglacial Maximum (128 – 80 ka). It is these deposits that
comprise the largest shallow groundwater resource in the study area. Last Glacial deposits and
4
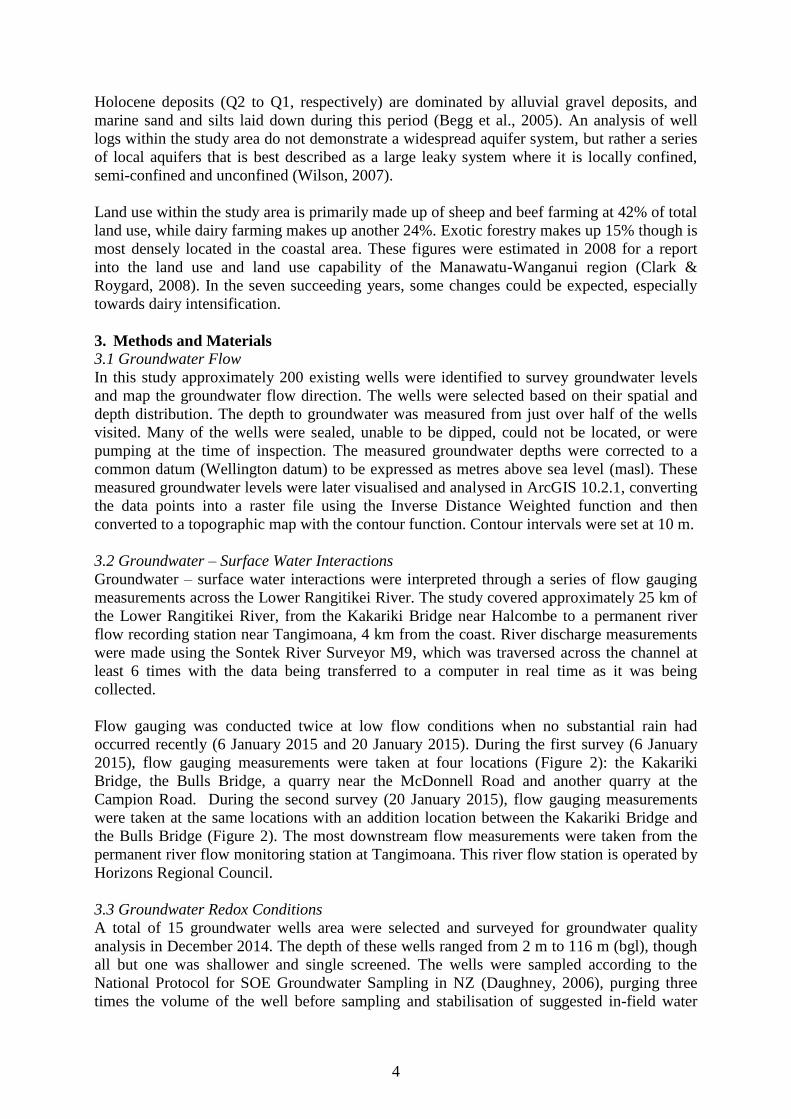
Holocene deposits (Q2 to Q1, respectively) are dominated by alluvial gravel deposits, and
marine sand and silts laid down during this period (Begg et al., 2005). An analysis of well
logs within the study area do not demonstrate a widespread aquifer system, but rather a series
of local aquifers that is best described as a large leaky system where it is locally confined,
semi-confined and unconfined (Wilson, 2007).
Land use within the study area is primarily made up of sheep and beef farming at 42% of total
land use, while dairy farming makes up another 24%. Exotic forestry makes up 15% though is
most densely located in the coastal area. These figures were estimated in 2008 for a report
into the land use and land use capability of the Manawatu-Wanganui region (Clark &
Roygard, 2008). In the seven succeeding years, some changes could be expected, especially
towards dairy intensification.
3. Methods and Materials
3.1 Groundwater Flow
In this study approximately 200 existing wells were identified to survey groundwater levels
and map the groundwater flow direction. The wells were selected based on their spatial and
depth distribution. The depth to groundwater was measured from just over half of the wells
visited. Many of the wells were sealed, unable to be dipped, could not be located, or were
pumping at the time of inspection. The measured groundwater depths were corrected to a
common datum (Wellington datum) to be expressed as metres above sea level (masl). These
measured groundwater levels were later visualised and analysed in ArcGIS 10.2.1, converting
the data points into a raster file using the Inverse Distance Weighted function and then
converted to a topographic map with the contour function. Contour intervals were set at 10 m.
3.2 Groundwater – Surface Water Interactions
Groundwater – surface water interactions were interpreted through a series of flow gauging
measurements across the Lower Rangitikei River. The study covered approximately 25 km of
the Lower Rangitikei River, from the Kakariki Bridge near Halcombe to a permanent river
flow recording station near Tangimoana, 4 km from the coast. River discharge measurements
were made using the Sontek River Surveyor M9, which was traversed across the channel at
least 6 times with the data being transferred to a computer in real time as it was being
collected.
Flow gauging was conducted twice at low flow conditions when no substantial rain had
occurred recently (6 January 2015 and 20 January 2015). During the first survey (6 January
2015), flow gauging measurements were taken at four locations (Figure 2): the Kakariki
Bridge, the Bulls Bridge, a quarry near the McDonnell Road and another quarry at the
Campion Road. During the second survey (20 January 2015), flow gauging measurements
were taken at the same locations with an addition location between the Kakariki Bridge and
the Bulls Bridge (Figure 2). The most downstream flow measurements were taken from the
permanent river flow monitoring station at Tangimoana. This river flow station is operated by
Horizons Regional Council.
3.3 Groundwater Redox Conditions
A total of 15 groundwater wells area were selected and surveyed for groundwater quality
analysis in December 2014. The depth of these wells ranged from 2 m to 116 m (bgl), though
all but one was shallower and single screened. The wells were sampled according to the
National Protocol for SOE Groundwater Sampling in NZ (Daughney, 2006), purging three
times the volume of the well before sampling and stabilisation of suggested in-field water
5
quality parameters. Major ions and nutrients were analysed in a commercial laboratory, while
standard water quality parameters including dissolved oxygen (DO), specific electrical
conductivity, redox potential (ORP) and temperature were measured in the field using a multi
parameter water quality YSI probe with flow cell. These parameters were used to assess and
interpret the groundwater redox processes using the framework and concentrations thresholds
developed by McMahon & Chapelle (2008) (Table 1).
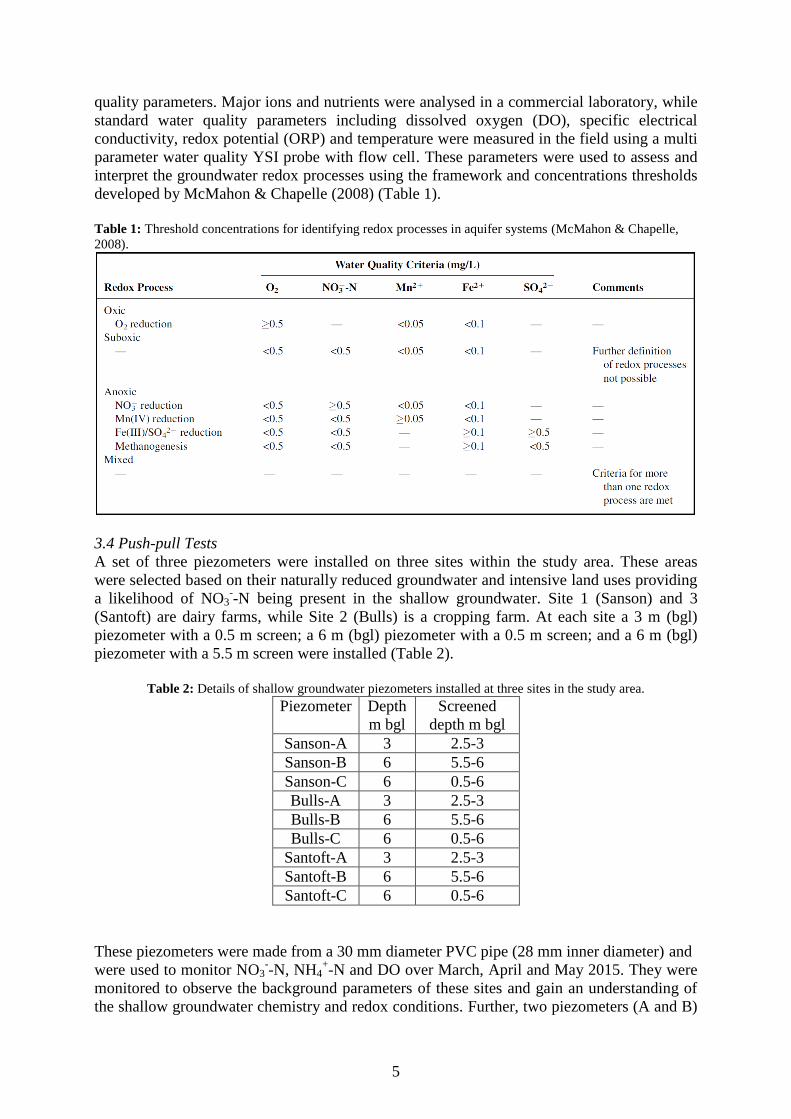
Table 1: Threshold concentrations for identifying redox processes in aquifer systems (McMahon & Chapelle,
2008).
3.4 Push-pull Tests
A set of three piezometers were installed on three sites within the study area. These areas
were selected based on their naturally reduced groundwater and intensive land uses providing
a likelihood of NO3--N being present in the shallow groundwater. Site 1 (Sanson) and 3
(Santoft) are dairy farms, while Site 2 (Bulls) is a cropping farm. At each site a 3 m (bgl)
piezometer with a 0.5 m screen; a 6 m (bgl) piezometer with a 0.5 m screen; and a 6 m (bgl)
piezometer with a 5.5 m screen were installed (Table 2).
Table 2: Details of shallow groundwater piezometers installed at three sites in the study area.
Piezometer Depth
m bgl
Screened
depth m bgl
Sanson-A 3 2.5-3
Sanson-B 6 5.5-6
Sanson-C 6 0.5-6
Bulls-A 3 2.5-3
Bulls-B 6 5.5-6
Bulls-C 6 0.5-6
Santoft-A 3 2.5-3
Santoft-B 6 5.5-6
Santoft-C 6 0.5-6
These piezometers were made from a 30 mm diameter PVC pipe (28 mm inner diameter) and
were used to monitor NO3--N, NH4
+-N and DO over March, April and May 2015. They were
monitored to observe the background parameters of these sites and gain an understanding of
the shallow groundwater chemistry and redox conditions. Further, two piezometers (A and B)

6
at each site were subjected to a push-pull test to measure rate of denitrification in the shallow
groundwater (Istok, 2013). The push-pull test involved two primary steps. The ‘push’ phase
of the test involved injecting a prepared solution of 10 mg L-1
Br-, 10 mg L
-1 NO3
--N and 50
mg L-1
acetylene into the piezometer. The solution was made up of groundwater taken from
the piezometer the day before, and mixed with these chemicals in the morning of the test. This
was followed by the ‘pull’ phase where the mix of solution and groundwater were sampled
every 30 minutes for two hours, then every hour for the final four hours. The collected
samples were analysed for Br-, NO3
--N, and N2O using ion chromatography at Massey
University. These measurements were used to calculate the denitrification rate by considering
how the NO3--N tracer declined over several hours relative to the decline in the Br
- tracer. The
decline in Br- concentrations represents the dilution effects. This assumes that both tracers
naturally dilutes at same rate over time due to dispersion and advection influences (dilution)
in the subsurface (Istok, 2013). Once these dilution effects are taken into account, the
difference between the two tracers could be attributed to NO3--N reduction, i.e. denitrification.
This was further assessed by measuring the N2O produced during the push-pull tests.
4. Results and Discussion
4.1 Groundwater flow
Figure 1a reproduces the water table elevation for shallow groundwater (< 30 m), ranging
from 1.58 m to 168.7 m above sea level (masl). The highest water table elevations are found
in the northern part of the catchment in the Marton area.
Figure 1a: Shallow groundwater flow from wells
screened less than 30 m deep. Contours are masl.
Figure 1b: Deep groundwater flow from wells screened
greater than 30 m deep. Contours are masl.

7
Groundwater flows from this topographical high down in a mostly southerly direction towards
the Rangitikei River, suggesting some part of the groundwater flow interacts with the river
water, most likely just upstream of Bulls. From Marton to Turakina, groundwater flows in a
westerly direction, directly to the sea. From Marton to Bulls, the groundwater flows in a
southerly direction, before gradually flowing to the south-west, reflecting the general
topography of the area. As the topography flattens out, from Bulls and Sanson, the
groundwater flow gradient also flattens out (indicated by the increasing gap between the
groundwater contour lines) and groundwater flows towards the sea. Where the groundwater
flows beneath the Rangitikei River, the contour lines appear to refract, possibly indicating
interaction between the river water and groundwater.
For deep groundwater flow (Figure 1b), the water table elevation ranged from 1.32 m to 167.1
masl. The highest water table elevation was found further inland near Rewa, where
groundwater is 160 masl. From here the trend shows a reasonably consistent south-west flow
direction, where groundwater appears to discharge to the sea. Topographic influences are
much gentler in the deep groundwater flow system, compared with the shallow groundwater
flow. Groundwater flow gradients are also more consistent and evenly spaced in the deeper
groundwater than the shallow, reflecting less influence from the surface topography.
4.2 Groundwater - surface water interactions
The flow gauging surveys reveal a dynamic relationship between the Rangitikei River and the
alluvial aquifer beneath it (Figure 2). The surveys were taken two weeks apart, though they
suggest a similar pattern of groundwater recharge and discharge along the river reaches. The
reach between the Kakariki Bridge and the Bulls Bridge is gaining from groundwater,
particularly just upstream of the Bulls Bridge. Downstream from this the Bulls Bridge is
likely an area of groundwater recharge, as the measured river flow decreased on both survey
dates. Further downstream the river appears to be gaining again slightly before losing
towards the coast.
4.3 Groundwater redox conditions
Applying the framework developed by McMahon & Chapelle (2008), the dissolved
concentration of five groundwater quality parameters (dissolved O2, NO3--N, Mn
2+, Fe
2+, and
SO42-
) were used to interpret the redox condition of groundwater. Figure 3 and Table 3
displays the various redox processes that are active in the study area. Ten out of 15 the sites
surveyed showed a purely anoxic condition, where the DO concentration is less than 0.5
mg/L. A further two sites were classed as anoxic, but could have more than one redox process
occurring. Another three sites were assessed as mixed, having both oxic and anoxic redox
categories, with a range of redox processes occurring.
Aerobic respiration
Using the threshold values provided in Table 1, aerobic respiration is expected to take place at
three locations: 322071, 333005, and 323077 in the study area. According to the ecological
succession of terminal electron acceptors (Rivett et al., 2008), dissolved oxygen is first
depleted before other electron acceptors, due to its higher oxidation status. In this study, the
wells 322071 and 333005 have high DO levels and also have relatively high NO3--N levels.
As expected at these sites, the NO3--N has remained in favour of DO being reduced, thereby
preserving the NO3--N in the shallow groundwater. However, at well 323077, DO was
available in the groundwater, but there was very little NO3--N present.

8
Table 3: Redox assignment of 15 groundwater wells surveyed in December 2014 in the Lower Rangitikei
catchment.
Redox
Variables
DO NO3--N Mn
2+ Fe
2+ SO4
2-
Redox
Category Redox Process Unit mg/L mg/L mg/L mg/L mg/L
Threshold
Value
0.5 0.5 0.05 0.1 0.5
312004 0.02 0.40 0.26 9.80 0.01 Anoxic CH4
312020 0.00 0.02 0.19 0.39 109.01 Anoxic Fe(III)/SO4
312001 0.00 0.01 1.33 9.90 <0.01 Anoxic CH4
324067 0.02 0.02 0.33 20.37 118.55 Anoxic Fe(III)/SO4
332025 0.01 0.04 0.70 8.87 2.41 Anoxic Fe(III)/SO4
332009 0.07 0.01 0.63 0.32 <0.01 Anoxic CH4
322045 0.00 1.17 1.03 0.01 43.10 Mixed (anoxic) NO3-Mn(IV)
322071 0.59 4.47 0.11 0.51 33.98 Mixed O2-Fe(III)/SO4
323097 0.00 <0.01 0.24 0.02 12.24 Anoxic Mn(IV)
333005 0.93 1.90 0.02 0.86 127.69 Mixed O2-Fe(III)/SO4
313009 0.00 0.35 0.42 1.38 2.07 Anoxic Fe(III)/SO4
343119 0.43 <0.01 0.25 4.20 10.32 Anoxic Fe(III)/SO4
323091 0.39 1.78 0.46 1.29 58.34 Mixed (anoxic) NO3-Fe(III)/SO4
323077 0.76 <0.01 1.10 0.31 15.18 Mixed O2-Fe(III)/SO4
314065 0.44 <0.01 0.38 0.87 124.07 Anoxic Fe(III)/SO4
Denitrification
Once DO has been depleted, NO3--N becomes the terminal electron acceptor (Rivett et al.,
2008). This is expected to occur at well sites 322045 and 323091. These two sites have the
only other relatively high NO3--N levels, compared with the other sites sampled in the study
area. Nitrate at these two sites potentially may be being denitrified as the measured DO levels
were lower than the suggested threshold of 0.5 mg/L (Table 3). These two sites, as well as
322071 and 333005, were the only sites with NO3--N levels above 1 ppm, with all other sites
having less than half this level.
Manganese and Iron/Sulphate reduction
Once NO3--N has been exhausted, Mn
4+ will become the primary electron acceptor the
product of which is Mn2+
. This is expected to occur at 323097 and 322045. Mn is commonly
in the form of MnO2. Iron/Sulphate reduction occurs at six locations: 312020; 324067;
332025; 313009; 343119; 314065. Fe3+
and SO42-
reduction do not actually occur
simultaneously. Rather it is one limitation of the framework that it cannot distinguish between
the two reduction processes.
Methanogenesis
Methanogenesis occur at three locations in the study area: 312004, 312001, and 332009.
Methanogenesis is the reduction of CO2 by methanogens, typically occurring when all other
9
electron acceptors have been consumed. It is the least efficient metabolic process for
converting oxygen into energy and implies all other acceptors have been rejected.
4.4 Push-Pull Tests
Shallow groundwater chemistry and redox conditions
NO3--N had mostly low concentrations at all the sites monitored, with the exception of Bulls-
C and Santoft-C. These piezometers showed elevated NO3--N concentrations in April, well
above other readings, but also had elevated DO concentrations at the same time. In both these
cases the groundwater level had risen since the previous sampling. NH4+-N was generally
around 1 mg/L or less at all the sites, though it was lowest at the Bulls and Santoft sites. DO
was also generally low at <0.5 mg/L at all sites, with the exception of Bulls-C and Santoft-C,
where DO reached around 2 mg/L, with associated elevated NO3--N. The redox potential was
generally between 0 and -150 mV over the monitoring period except in April where Bulls-C
gave a result of 70.
Shallow Groundwater Denitrification
Figure 4 shows the dilution of both NO3--N and Br
- over the course of the test, with NO3
--N
usually showing a greater decline as the time progressed. The NO3--N/Br
- ratio is a more
visual guide to the decline in NO3--N relative to Br
-, with a decreasing trend showing a
widening gap between the two tracers. The dilution-corrected NO3--N concentration shows
the reduction of NO3--N after dilution effects have been taken into account. It is the slope of
this line that gives the zero-order reaction rate for NO3--N reduction. The red value in bold is
the estimated rate of denitrification per hour.
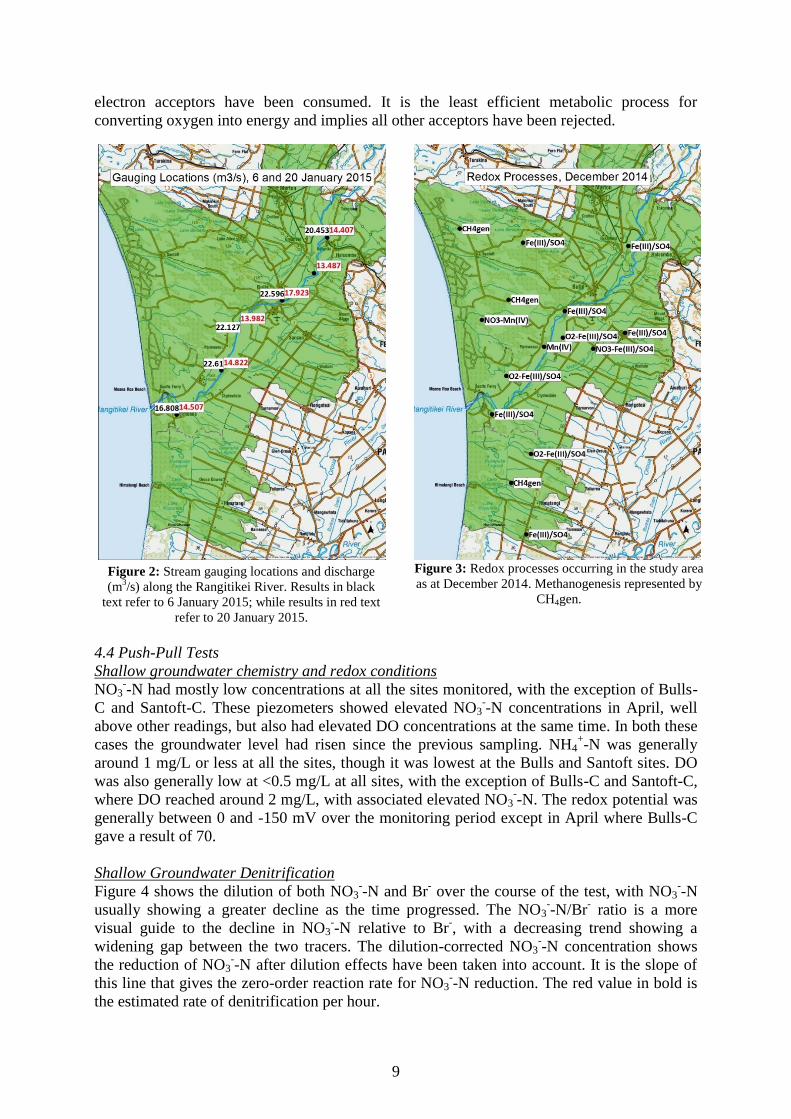
Figure 2: Stream gauging locations and discharge
(m3/s) along the Rangitikei River. Results in black
text refer to 6 January 2015; while results in red text
refer to 20 January 2015.
Figure 3: Redox processes occurring in the study area
as at December 2014. Methanogenesis represented by
CH4gen.

10
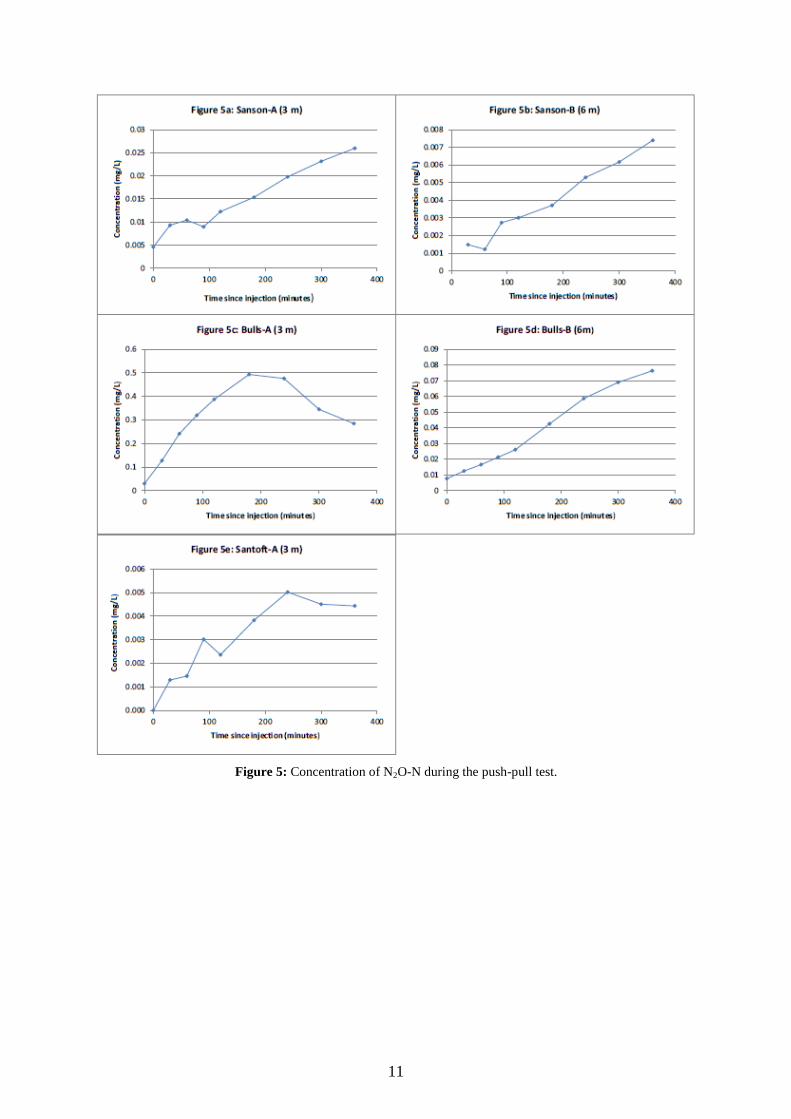
Figure 5 shows how N2O concentrations changed over time as the test progressed. The N2O
concentrations provide a supplementary indication of denitrification as NO3--N is denitrified.
The occurrence of denitrification was inconclusive at only one piezometer (Sanson-A), while
all other test piezometers showed some level of denitrification. According to these results, the
rate ranged from 0.04 mg N L-1
hr-1
to 1.57 mg N L-1
hr-1
. Depth did not seem to be an
indicator of the rate of denitrification, with the fastest and slowest rates (Bulls-A and Santoft-
A respectively) occurring at the 3 m depth. Though at the Bulls site NO3--N
was consistently
observed at a higher concentration at 3 m, compared with 6 m, suggesting NO3--N
is being
reduced as it percolates down through the subsurface environment. The accumulation of N2O
has also provided a further indication of denitrification occurring and seems to accumulate in
proportion to the rate of denitrification.
Figure 4: Results of push-pull tests showing Bromide and Nitrate-N concentrations, the dilution corrected
Nitrate-N concentration and the Nitrate-N/Bromide ratio. The denitrification rate is shown in red.
11
Figure 5: Concentration of N2O-N during the push-pull test.

12
Conclusions and Recommendations
A sound understanding of the sources, transport, transformation and fate of nutrients leached
from farms is a key component of managing and mitigating the likely impacts of these
nutrients on water quality and ecosystem health in agricultural catchments.
Both the shallow and deep groundwater systems had similar flow patterns, though there is
greater topographic influence occurring on the shallow groundwater. The piezometric maps
demonstrate groundwater is generally flowing in the same direction as the Rangitikei River,
essentially providing shallow groundwater opportunity for NO3--N from upstream areas to
enter the river and its tributaries. Gauging results suggest a dynamic relationship between the
river and the underlying aquifer. Upstream of Bulls, groundwater likely discharges into the
river, particularly just upstream of the bridge. Downstream of here, the river mostly provides
for an area of groundwater recharge.
Using a range of common water quality measurements (DO, NO3--N, Mn
2+, Fe
2+ and SO4
2-),
the redox condition of groundwater was determined, revealing a mostly reduced groundwater
environment. Not only is DO generally low in the area, providing no initial barrier or delay to
NO3--N reduction, but a range of suitable electron donors are available in the form of DOC
and, potentially, Mn4+
and Fe3+
.
Having assessed the redox status of groundwater, actual shallow groundwater denitrification
was tested using the single-well push-pull tests. Piezometers were installed at three locations
(two dairy and one cropping farm) to observe how NO3--N behaves in shallow groundwater
relative to a conservative tracer, Br-. The push-pull tests were conducted at each site, at two
different depths, with a total of five tests performed. While one of the tests showed
inconclusive results (Sanson-A), the other tests showed denitrification occurring, although at
different rates. Under the test conditions, NO3--N was reduced at a rate between 0.04 mg N L
-
1 hr
-1 to 1.57 mg N L-1 hr-1. The intermediate product N2O was also measured during the
push-pull test. N2O was found to increase at all sites, consistent with what is expected during
denitrification, though interestingly N2O also increased where results seemed inconclusive at
Sanson-A.
Our results suggest that groundwater is likely connected with some reaches of the lower
Rangitikei River. However, NO3--N concentrations in the river and groundwater were
generally low, especially at low flows. This suggests NO3--N may be undergoing reduction
within shallow groundwater before it has a chance to seep into the river. This is evident in the
redox characterisation of reduced groundwater and observed NO3--N reduction during the
push-pull tests conducted. However, more spatial and temporal surveys and in-situ
measurements of denitrification occurrence in the shallow groundwater of the study area are
required.

13
References
Begg, J. G., Palmer, A., & Gyopari, M. (2005). Geological synopsis of the Manawatu-
Horowhenua area for a review of the region’s hydrogeology, GNS Science Consultancy
Report 2005/172. 36p.
Clark, M., & Roygard, J. (2008). Land Use Capability in the Manawatu-Wanganui Region.
Palmerston North.
Cowie, J. D., Fitzgerald, P., & Owers, W. (1967). Soils of the Manawatu-Rangitikei sand
country, North Island, New Zealand Sheet 1. New Zealand Soil Bureau Bulletin, 29.
Wellington, New Zealand: Department of Scientific and Industrial Research.
Daughney, C. J. (2006). A National Protocol for State of the Environment Groundwater
Sampling in New Zealand. Wellington, New Zealand: Ministry for the Environment.
Di, H. J., & Cameron, K. C. (2002). Nitrate leaching in temperate agroecosystems: Sources,
factors and mitigating strategies. Nutrient Cycling in Agroecosystems, 64(3), 237–256.
Harter, T., Rosenstock, T. S., Liptzin, D., Dzurella, K., Fryjoff-Hung, A., Hollander, A., …
Tomich, T. P. (2014). Agriculture’s contribution to nitrate contamination of Californian
groundwater (1945–2005). Journal of Environment Quality, 43(3), 895–907.
doi:10.2134/jeq2013.10.0411
Haynes, R. J., & Williams, P. H. (1993). Nutrient cycling and soil fertility in the grazed
pasture ecosystem. Advanced Agronomy, 46, 119–199.
Istok, J. D. (2013). Push-Pull Tests for Site Characterisation. Berlin, Germany: Springer-
Verlag.
Jarvis, S. C., Scholefield, D., & Pain, B. (1995). Nitrogen cycling in grazing systems. In P. E.
Bacon (Ed.), Nitrogen cycling in grazing systems. New York: NY, Marcel Dekker.
Korom, S. F. (1992). Natural denitrification in the saturated zone: a review. Water Resources
Research, 28(6), 1657–1668.
McMahon, P. B., & Chapelle, F. H. (2008). Redox processes and water quality of selected
principal aquifer systems. Ground Water, 46(2), 259–71. doi:10.1111/j.1745-
6584.2007.00385.x
Quinn, J. M., Wilcock, R. J., Monaghan, R. M., McDowell, R. W., & Journeaux, P. R. (2009).
Grassland farming and water quality in New Zealand. Irish Journal of Agri-Environmental
Research, 7, 69–88.
Rabalais, N. N. (2002). Nitrogen in Aquatic Ecosystems. Royal Swedish Academy of Sciences,
31(2), 102–112.
Rivas, A., Singh, R., Bishop, P., Horne, D., Roygard, J., & Hedley, M. (2014). Measuring
denitrification in the subsurface environment of the Manawatu River catchment. In:
Nutrient management for the farm, catchment and community. (Eds L.D. Currie and C L.
Christensen). http://flrc.massey.ac.nz/publications.html. Occasional Report No. 27.
Fertilizer and Lime Research Centre, Massey University, Palmerston North, New Zealand.
Rivett, M. O., Buss, S. R., Morgan, P., Smith, J. W. N., & Bemment, C. D. (2008). Nitrate
attenuation in groundwater: A review of biogeochemical controlling processes. Water
Research, 42(16), 4215–4232. doi:10.1016/j.watres.2008.07.020
Rivett, M. O., Smith, J. W. N., Buss, S. R., & Morgan, P. (2007). Nitrate occurrence and
attenuation in the major aquifers of England and Wales. Quarterly Journal of Engineering
Geology & Hydrogeology, 40(4), 335–352.
14
Smith, V. H., Tilman, G. D., & Nekola, J. C. (1999). Eutrophication: impacts of excess
nutrient inputs on freshwater, marine, and terrestrial ecosystems. Environmental Pollution,
100, 179–196.
Stenger, R., Barkle, G., Burgess, C., Wall, A., & Clague, J. (2008). Low nitrate contamination
of shallow groundwater in spite of intensive dairying: The effect of reducing conditions in
the vadose zone-aquifer continuum. Journal of Hydrology (New Zealand), 47(1), 1–24.
Stenger, R., Clague, J., Woodward, S., Moorhead, B., Burbery, L. F., & Canard, H. (2012).
Groundwater assimilative capacity - an untapped opportunity for catchment-scale nitrogen
management? In: Advanced Nutrient Management: Gains from the Past - Goals for the
Future. (Eds L.D. Currie and C L. Christensen). http://flrc.massey.ac.nz/publications.html.
Occasional Report No. 25. Fertilizer and Lime Research Centre, Massey University,
Palmerston North, New Zealand.
Stenger, R., Clague, J., Woodward, S., Moorhead, B., Wilson, S., Shokri, A., … Canard, H.
(2013). Denitrification - the key component of a groundwater system’s assimilative
capacity for nitrate. In: Accurate and efficient use of nutrients on farms. (Eds L.D. Currie
and C L. Christensen). http://flrc.massey.ac.nz/publications.html. Occasional Report No.
26. Fertilizer and Lime Research Centre, Massey University, Palmerston North, New
Zealand.
van der Perk, M. (2012). Soil and Water Contamination. Leiden, The Netherlands: CRC
Press/Balkema.
Verloop, J., Boumans, L. J. M., Van Keulen, H., Oenema, J., Hilhorst, G. J., Aarts, H. F. M.,
& Sebek, L. B. J. (2006). Reducing nitrate leaching to groundwater in an intensive dairy
farming system. Nutrient Cycling in Agroecosystems, 74(1), 59–74. doi:10.1007/s10705-
005-6241-9
Wilson, S. (2007). Reconnaissance Vertical Electrical Sounding Survey of the Rangitikei-
Manawatu-Horowhenua Area. Palmerston North, New Zealand: Horizons Regional
Council.