SOC as indicator of progress towards achieving Land Degradation Neutrality (LDN)
O. Terwayt Beyouli, B. Essifi, and M. Ouessar
(1) Institut des Regions Arides (IRA) – Tunisia
Assessment of Land Degradation
Neutrality (LDN) Using Earth
Observation Datasets in Southern
Tunisia
United Nations/Romania Conference on Agriculture
06-10 May 2019, Cluj-Napoca, Romania

TUNISIA
Long.: 7° - 12°E
Lat.: 32° - 38°N
Area: 165 000 km²
Population: 12 M
Climate variabilityMediterranean Sea
Sahara
Coastline spans: 1300 km
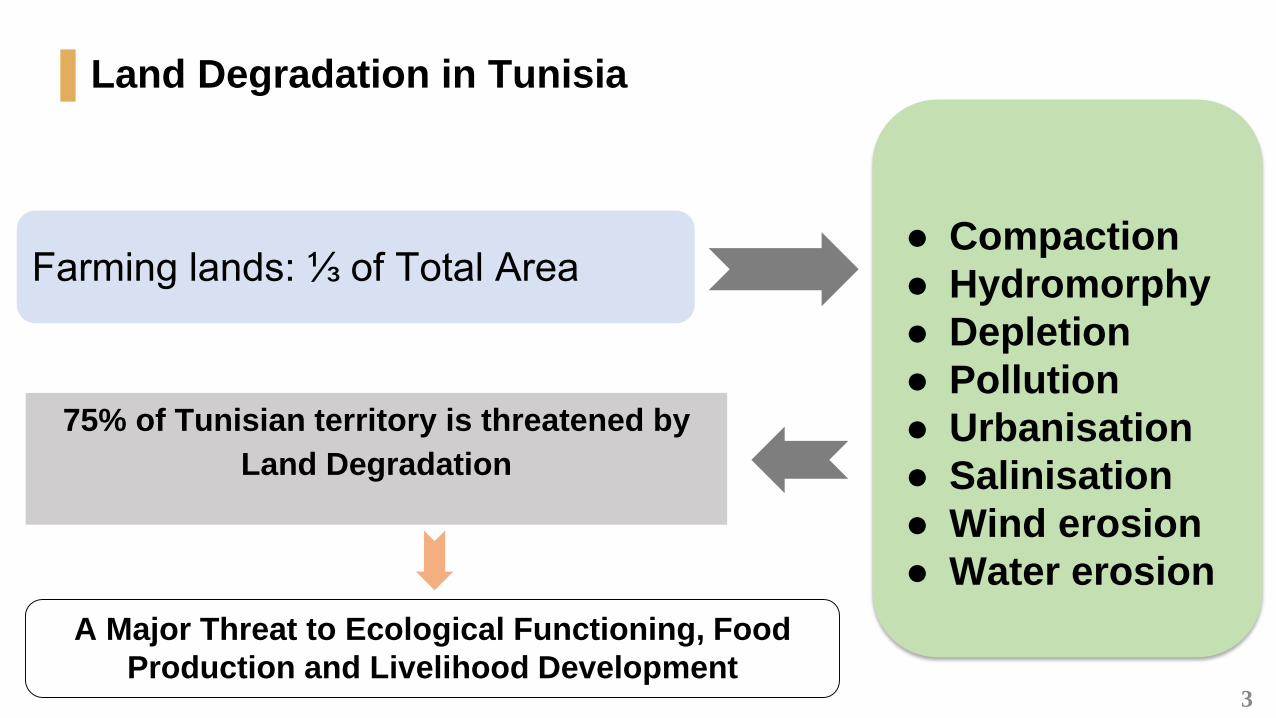
Farming lands: ⅓ of Total Area
3
75% of Tunisian territory is threatened by
Land Degradation
● Compaction
● Hydromorphy
● Depletion
● Pollution
● Urbanisation
● Salinisation
● Wind erosion
● Water erosion
A Major Threat to Ecological Functioning, Food
Production and Livelihood Development
Land Degradation in Tunisia
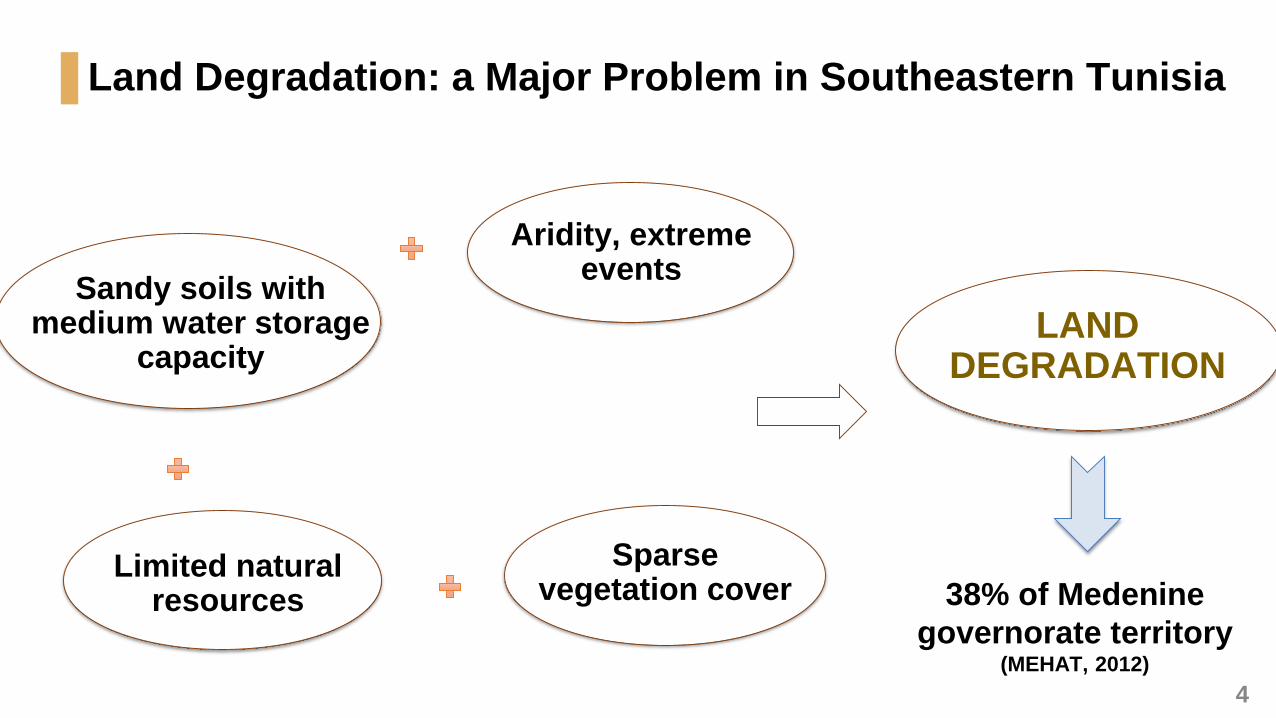
Aridity, extreme events
Limited natural resources
LAND DEGRADATION
Sparse vegetation cover 38% of Medenine
governorate territory(MEHAT, 2012)
Sandy soils with medium water storage
capacity
4
Land Degradation: a Major Problem in Southeastern Tunisia
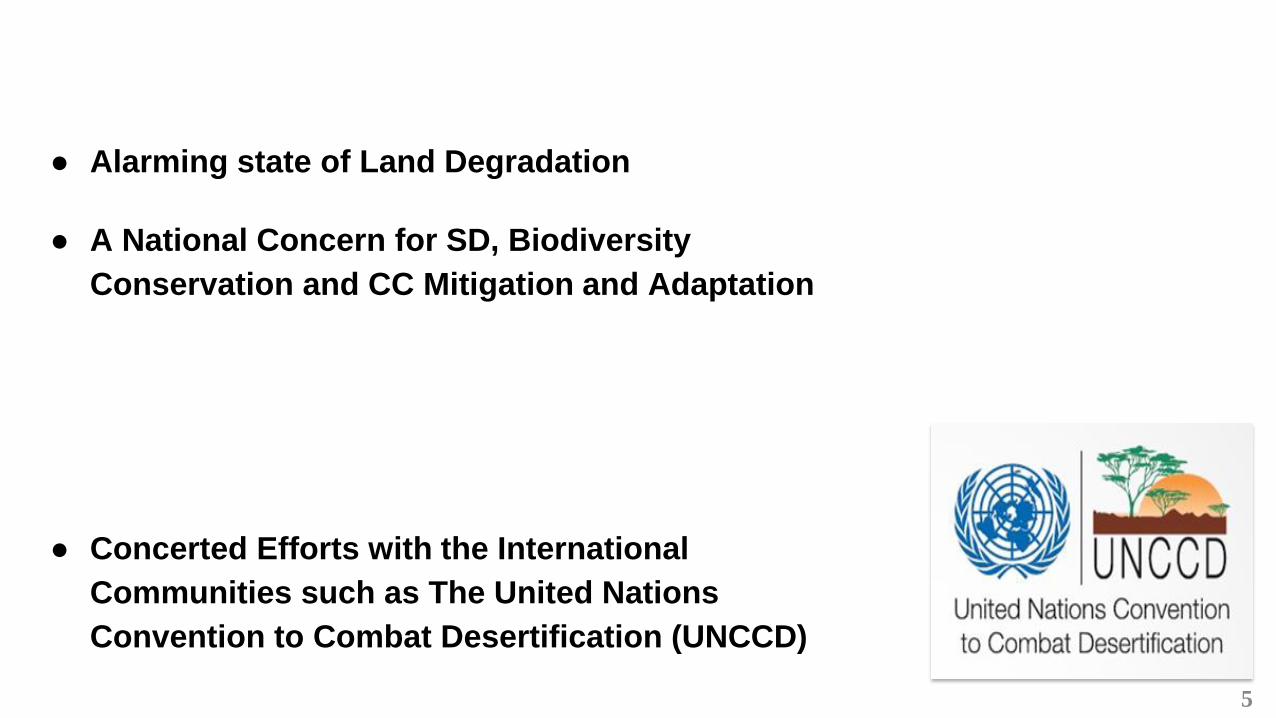
● Alarming state of Land Degradation
● A National Concern for SD, Biodiversity
Conservation and CC Mitigation and Adaptation
● Concerted Efforts with the International
Communities such as The United Nations
Convention to Combat Desertification (UNCCD)
5

Goal SDG 15.3
“By 2030, combat desertification,
restore degraded land and soil,
including land
affected by desertification, drought
and floods, and strive to achieve a
land degradation neutral world”
(UN, 2017).
Land Degradation Neutrality
(LDN)
UN 2030 Agenda for SD
A state of No Net Loss of healthy and
productive land
ImprovementDegradation
NEUTRALITY
Avoidance of the land degradation:
- Reducing or reversing destruction,
- Conservation and improvement of
ecosystem services
LDN: Balancing Gains and Losses

LDN Indicators Computation
Land Productivity
Land Cover Carbon Stock● Tier 1 (default method):
Global/regional earth
observation, geospatial
information and modelling.
● Tier 2: National statistics and
national earth observation.
● Tier 3 (most detailed method):
ground measurements (field
trips, GPS points collect…)
Application of a tiered approach (UNCCD, 2016):
7

LDN assessment: Setting an LDN baseline: 2015
Identifying trends, drivers of LD, and LDN hotspots
Monitoring and reporting on progress towards LDN
8

Study area in southeastern Tunisia
• Climate: upper arid to lower
arid
• Rainfall: less than 200
mm/year
• Vegetation: Chamaephytes
• Farming System: agriculture
using rainwater
9
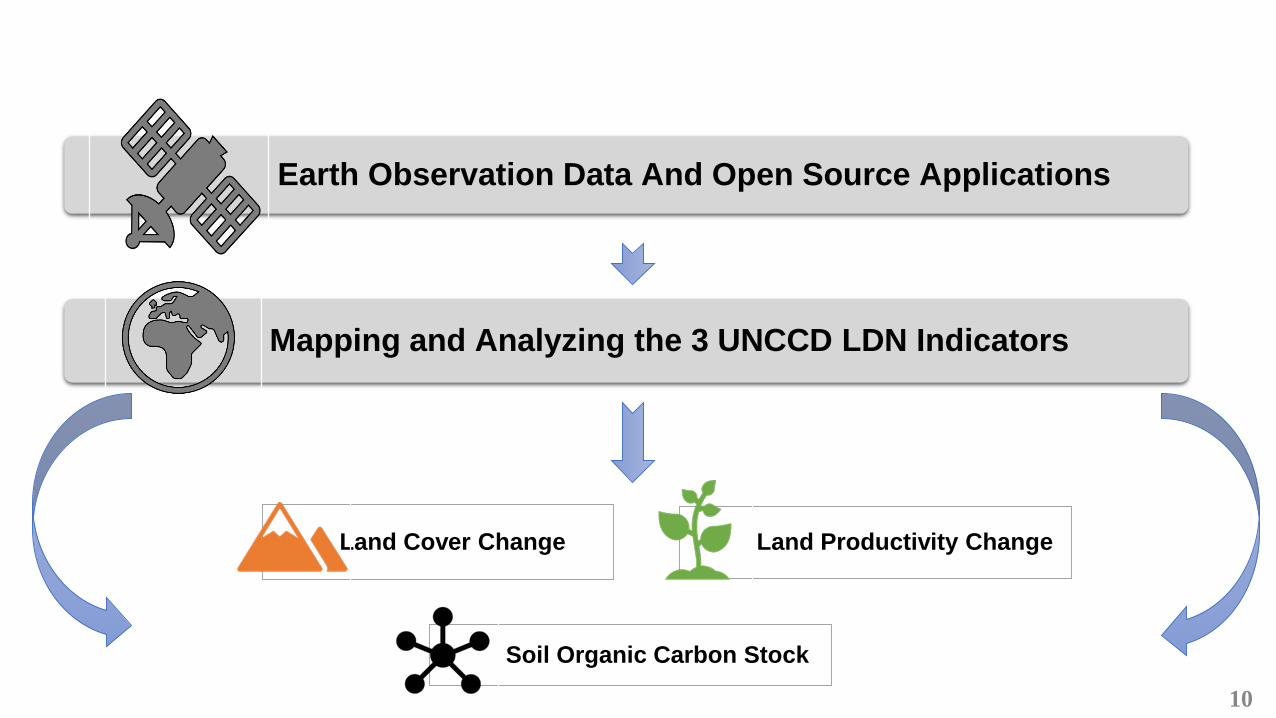
Earth Observation Data And Open Source Applications
Mapping and Analyzing the 3 UNCCD LDN Indicators
Land Cover Change Land Productivity Change
Soil Organic Carbon Stock
10

Flowchart of the Methodology
ND : not degraded
D : degraded
1OAO : “one-out, all-out” approach 11
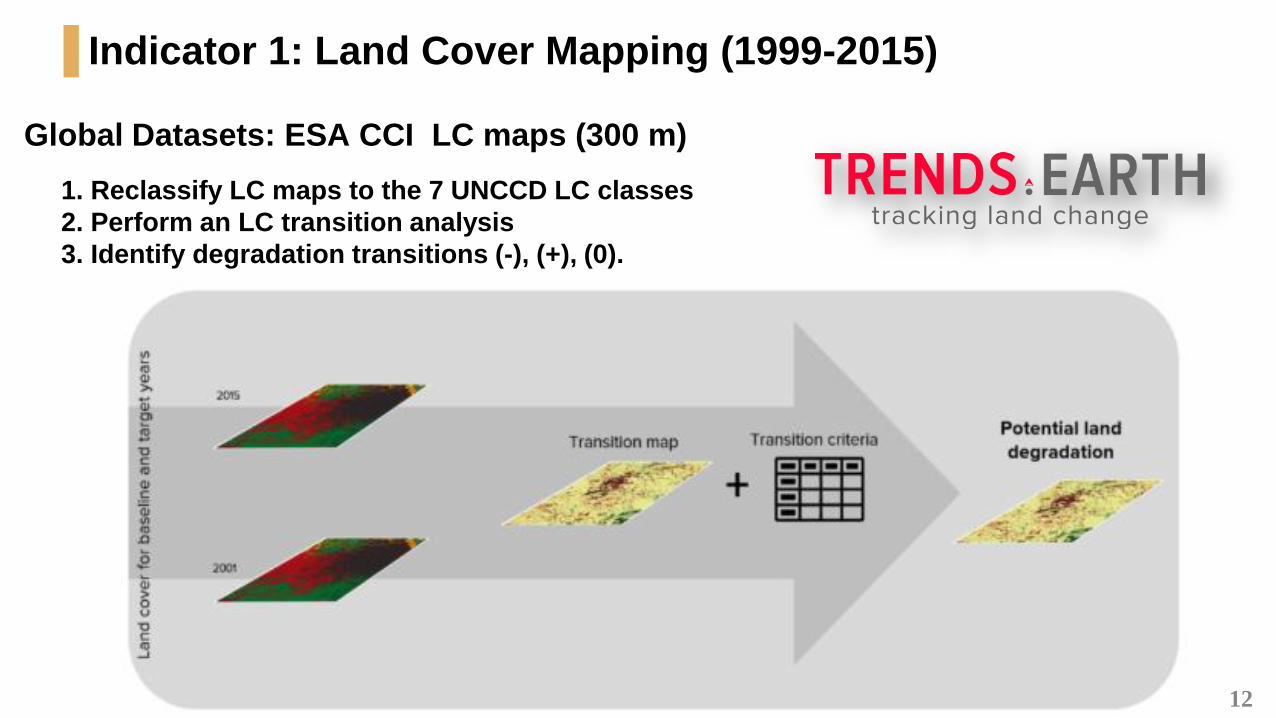
Global Datasets: ESA CCI LC maps (300 m)
1. Reclassify LC maps to the 7 UNCCD LC classes
2. Perform an LC transition analysis
3. Identify degradation transitions (-), (+), (0).
12
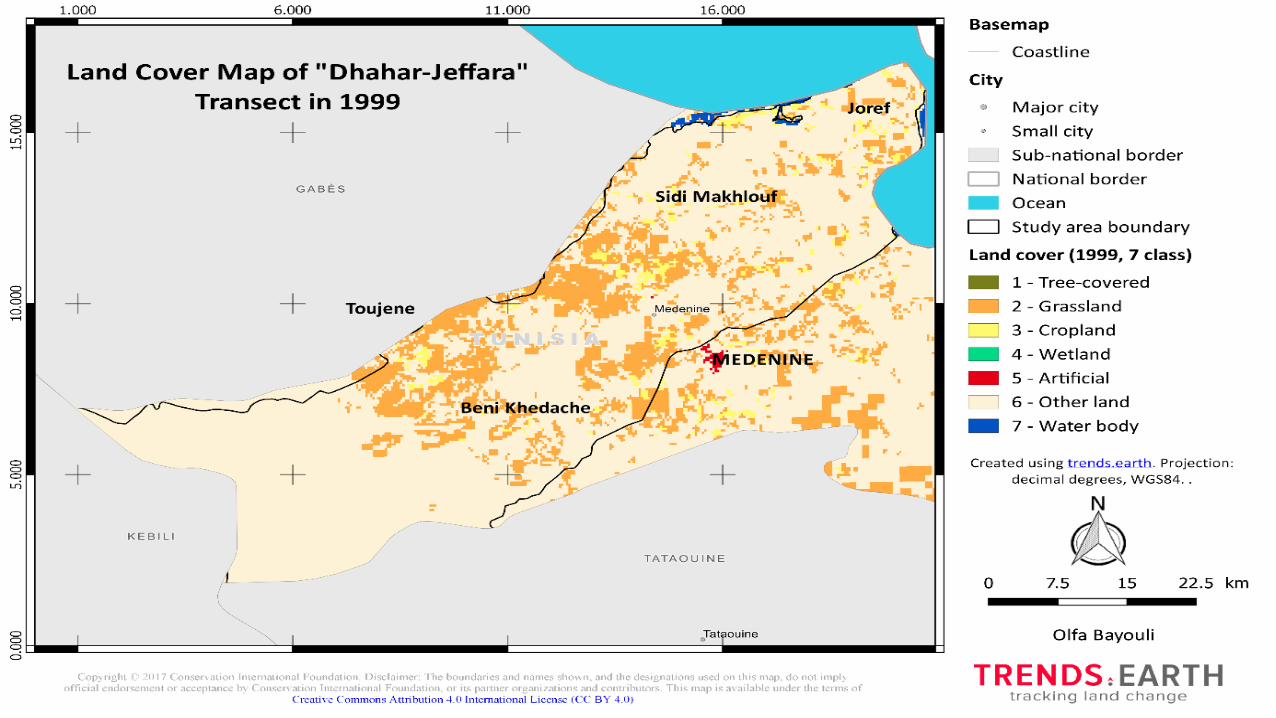
Indicator 1: Land Cover Mapping (1999-2015)

Trend
State
PerformanceLand Productivity (annual integrals NDVI)
Indicator 2: Land Productivity

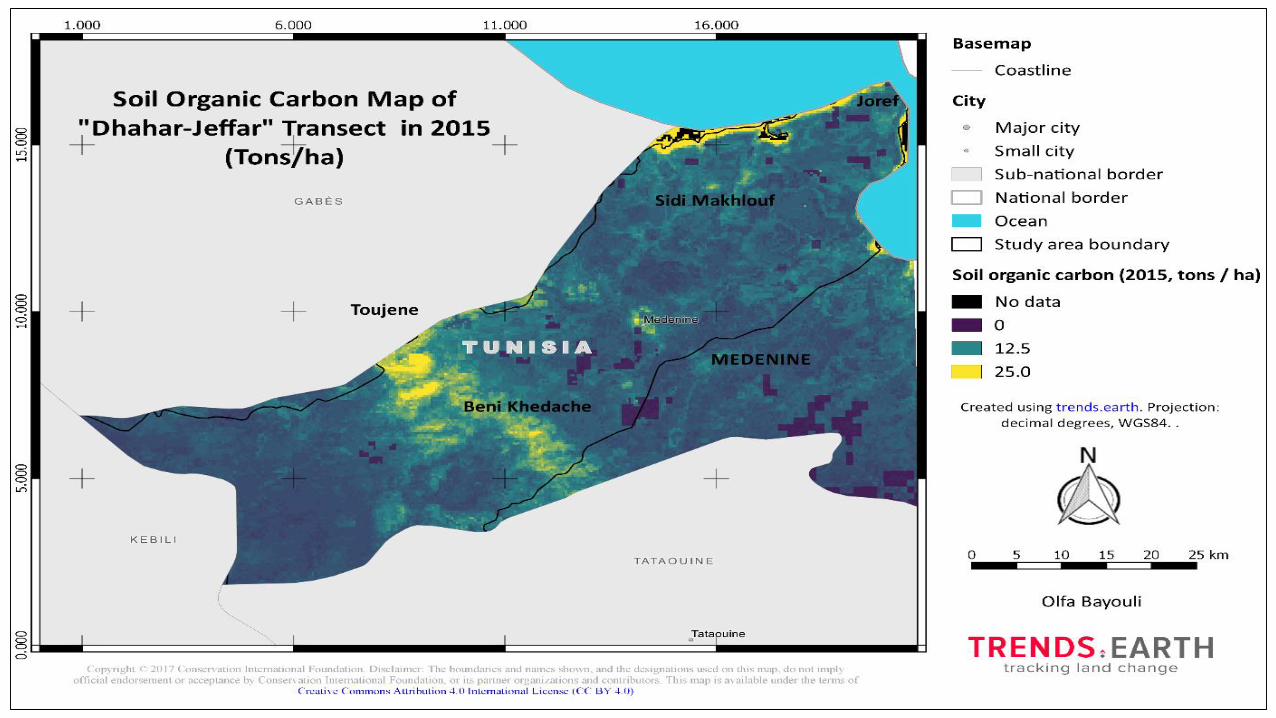
Indicator 3: Soil Organic Carbon (SOC)
14

LDN Monitoring Indicators Combination
The integration of the 3 LDN
indicators: ONE-OUT ALL-OUT
rule.
Area: potentially degraded by any
of the sub-indicators 🡪 considered
potentially degraded for reporting
purposes (Kust et al., 2017).
15
Indicator 1: Land Cover Mapping
(1999-2015)
16
Introduction ObjectivesMaterials &
MethodsResults &
DiscussionsConclusion

Introduction ObjectivesMaterials &
MethodsResults &
DiscussionsConclusion

Baseline area
(sq. km)
Target area
(sq. km)
Change in area
(sq. km)
Change in area
(percent)
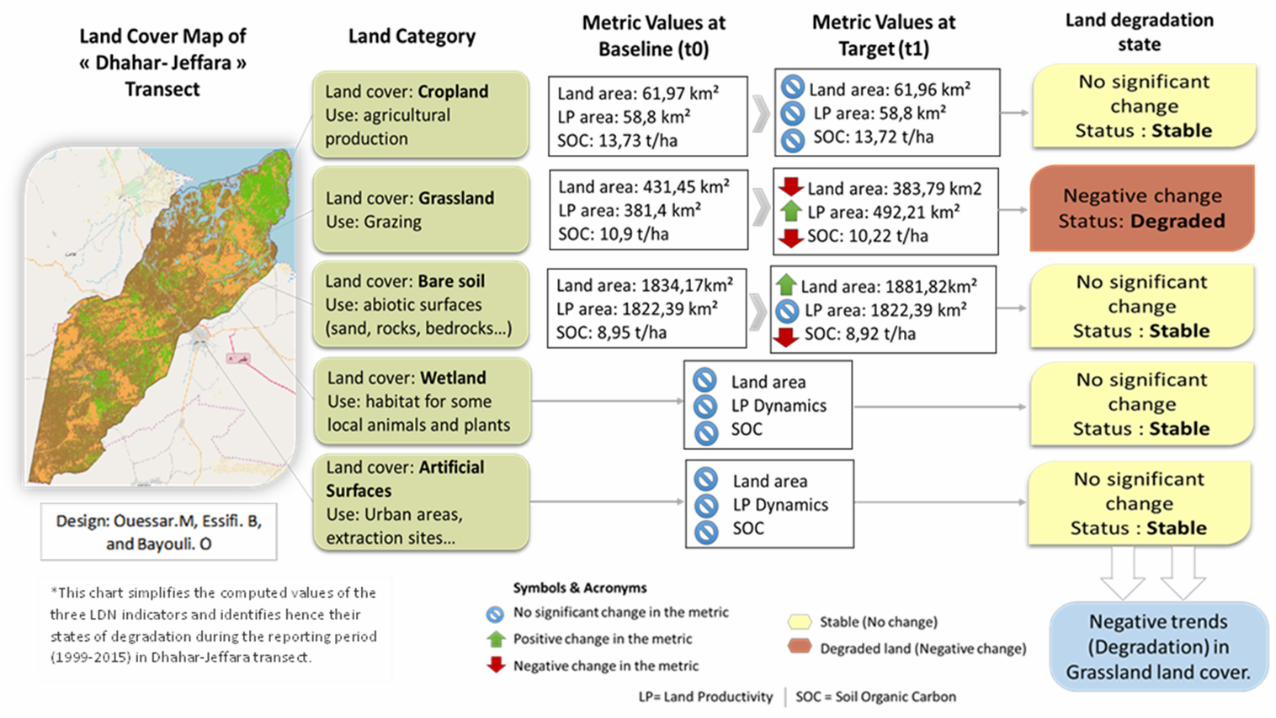
Grasslands 431,45 383,79 -47,65 -11,05%
Croplands 61,97 61,97 0,00 0,00%
Wetlands 0,00 0,00 0,00 0.00
Artificial areas 0,05 0,05 0,00 0,00%
Other lands 1 834,17 1 881,82 47,65 2,60%
Water bodies 7,73 7,73 0,00 0,00%
Land Cover Change by Cover Class (1999-2015)
19

Introduction ObjectivesMaterials &
MethodsResults &
DiscussionsConclusion
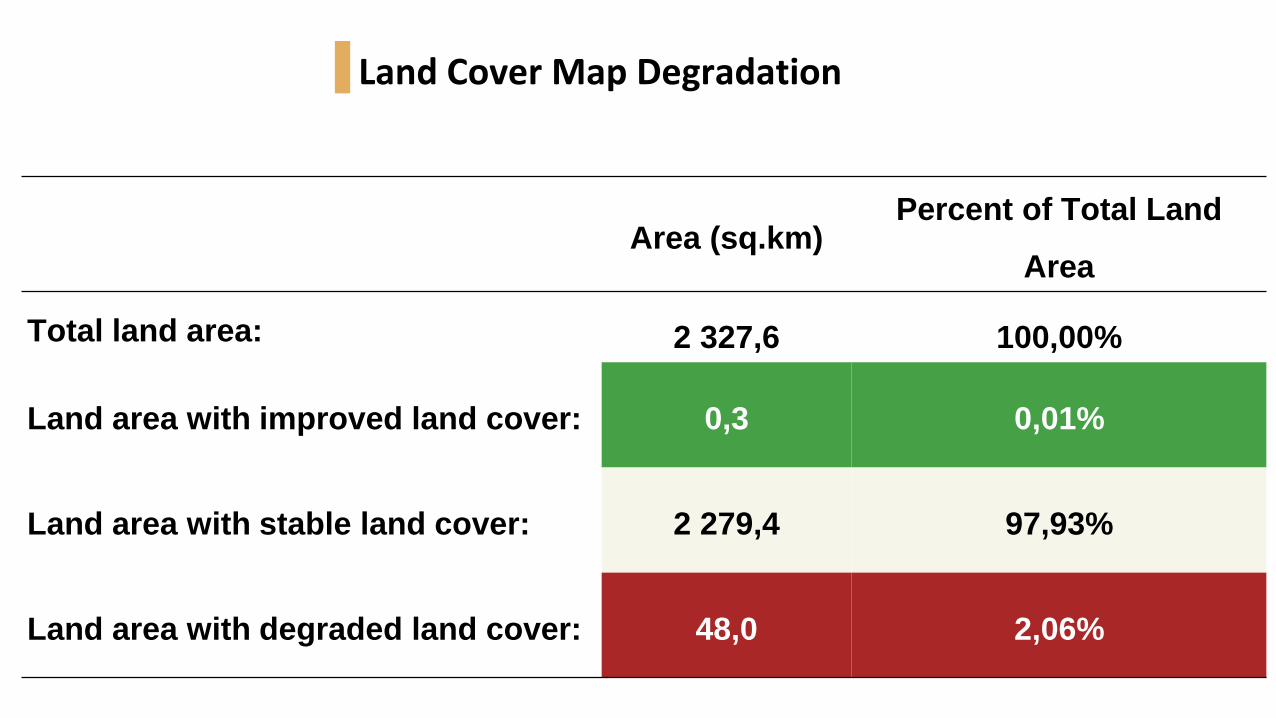
Land Cover Map Degradation
Area (sq.km)Percent of Total Land
Area
Total land area: 2 327,6 100,00%
Land area with improved land cover: 0,3 0,01%
Land area with stable land cover: 2 279,4 97,93%
Land area with degraded land cover: 48,0 2,06%
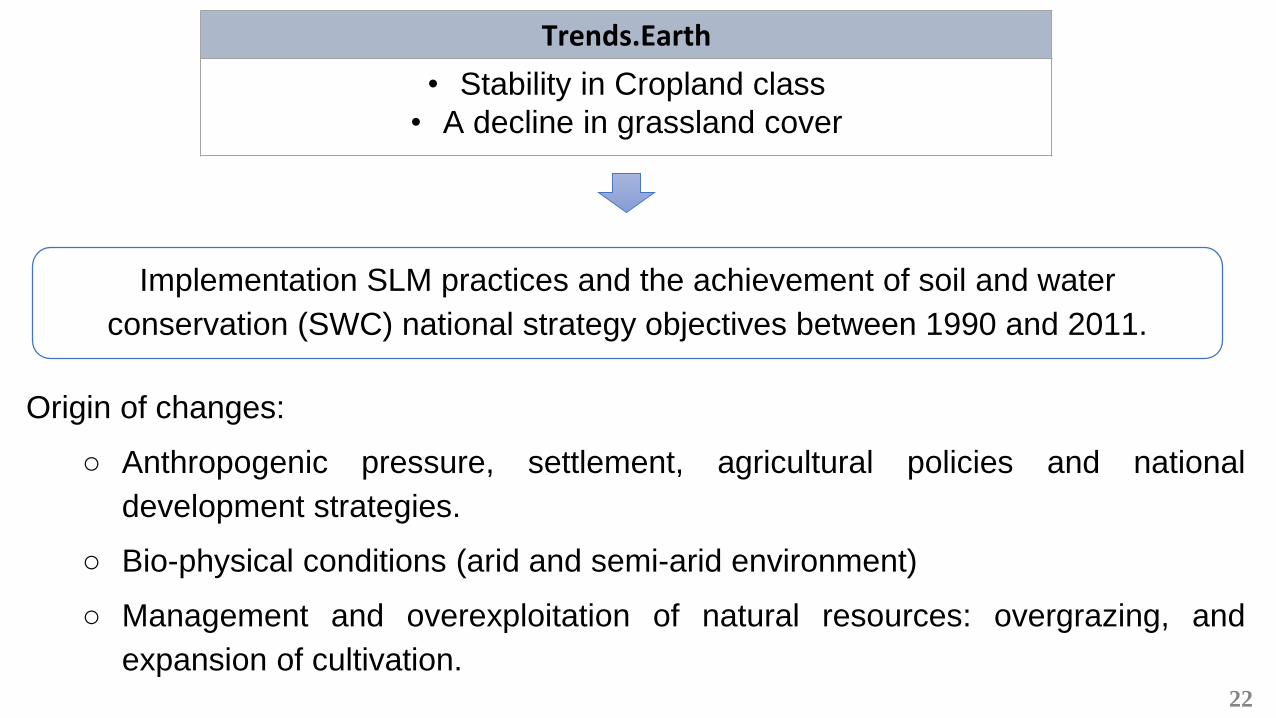
Trends.Earth
• Stability in Cropland class
• A decline in grassland cover
Implementation SLM practices and the achievement of soil and water
conservation (SWC) national strategy objectives between 1990 and 2011.
Origin of changes:
○ Anthropogenic pressure, settlement, agricultural policies and national
development strategies.
○ Bio-physical conditions (arid and semi-arid environment)
○ Management and overexploitation of natural resources: overgrazing, and
expansion of cultivation.22

Indicator 2: Land Productivity Trend
(1999-2015)
23


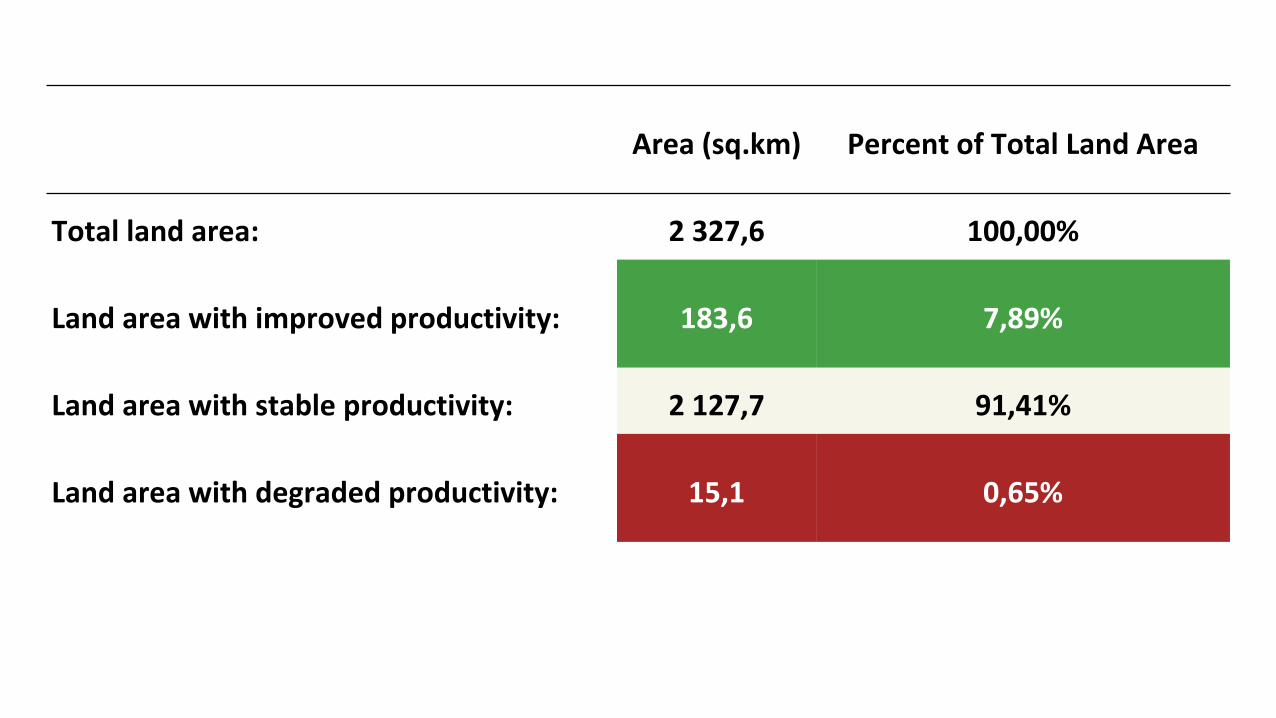
Area (sq.km) Percent of Total Land Area
Total land area: 2 327,6 100,00%
Land area with improved productivity: 183,6 7,89%
Land area with stable productivity: 2 127,7 91,41%
Land area with degraded productivity: 15,1 0,65%

Grasslands
36,71 km²
0,21 km²
392.71 Km²
Croplands
11,75
km²
47,05 km²
• Impacts of seasonal and yearly precipitation
changes on vegetation covers.
• Anthropic pressures: land use changes (further
degradation in sensitive areas).
Results obtained from TE approaches:
🡪 A stable productivity from 2001 to 2017
29

Indicator 3: Soil Organic Carbon
(SOC)
30


Baseline
SOC
(tons/ha)
Target
SOC
(tons/ha)
Baseline
area
(sq. km)
Target area
(sq. km)
Baseline
SOC (tons)
Target SOC
(tons)
Change in
SOC (tons)
Change in
SOC
(percent)
Tree-covered
areas0,00 0,00 0,00 0,00 0,00 0,00 0,00 0
Grasslands 10,90 10,22 431,45 383,79 470285,75 392306,36 -77979,39 -16,58%
Croplands 13,73 13,73 61,97 61,97 85090,24 85053,62 -36,62 -0,04%
Wetlands 0,00 0,00 0,00 0,00 0,00 0,00 0,00 0
Artificial
Areas14,00 14,00 0,05 0,05 72,84 72,84 0,00 0
Other lands 8,95 8,93 1834,17 1881,82 1641 797,55 1680 215,53 38417,98 2,34%
Soil Organic Carbon Change from Baseline to Target (1999-2015)
33

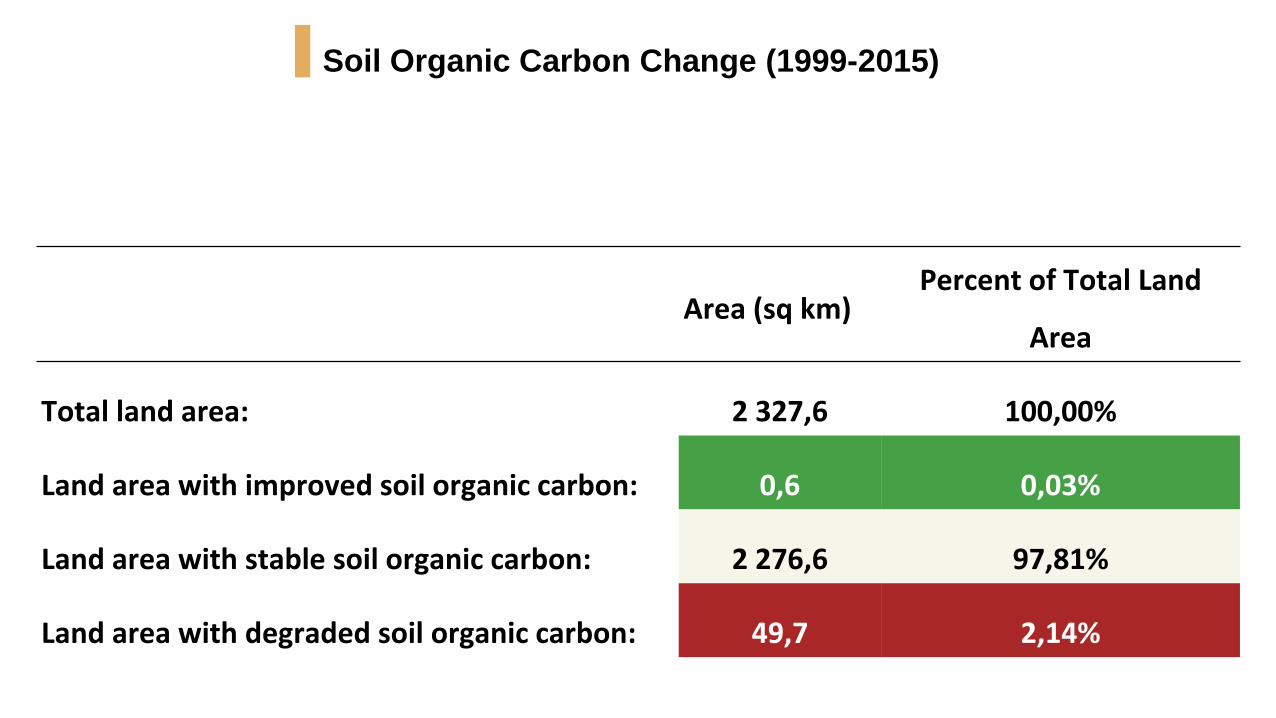
Soil Organic Carbon Change (1999-2015)
Area (sq km)Percent of Total Land
Area
Total land area: 2 327,6 100,00%
Land area with improved soil organic carbon: 0,6 0,03%
Land area with stable soil organic carbon: 2 276,6 97,81%
Land area with degraded soil organic carbon: 49,7 2,14%

Land Degradation Dynamics

Land Degradation Dynamics
Area (sq km) Percent of Total Land Area
Total land area: 2 327,6 100,00%
Land area improved: 178,6 7,68%
Land area stable:2 074,2 89,11%
Land area degraded: 73,3 3,15%

Combination of the Indicators: LDN Status Assessment
Local LDN Indicators Framework Dhahar-Jeffara transect
Grassland Cropland Wetlands Bare soilArtificial
areas
Land Cover Degraded Stable Stable Improved Stable
Land
Productivity
Not
degraded
Not
degraded
Not
degradedNot degraded Not degraded
Soil Organic
CarbonDegraded Stable Stable Stable Stable
State Degraded Stable Stable Stable Stable
38
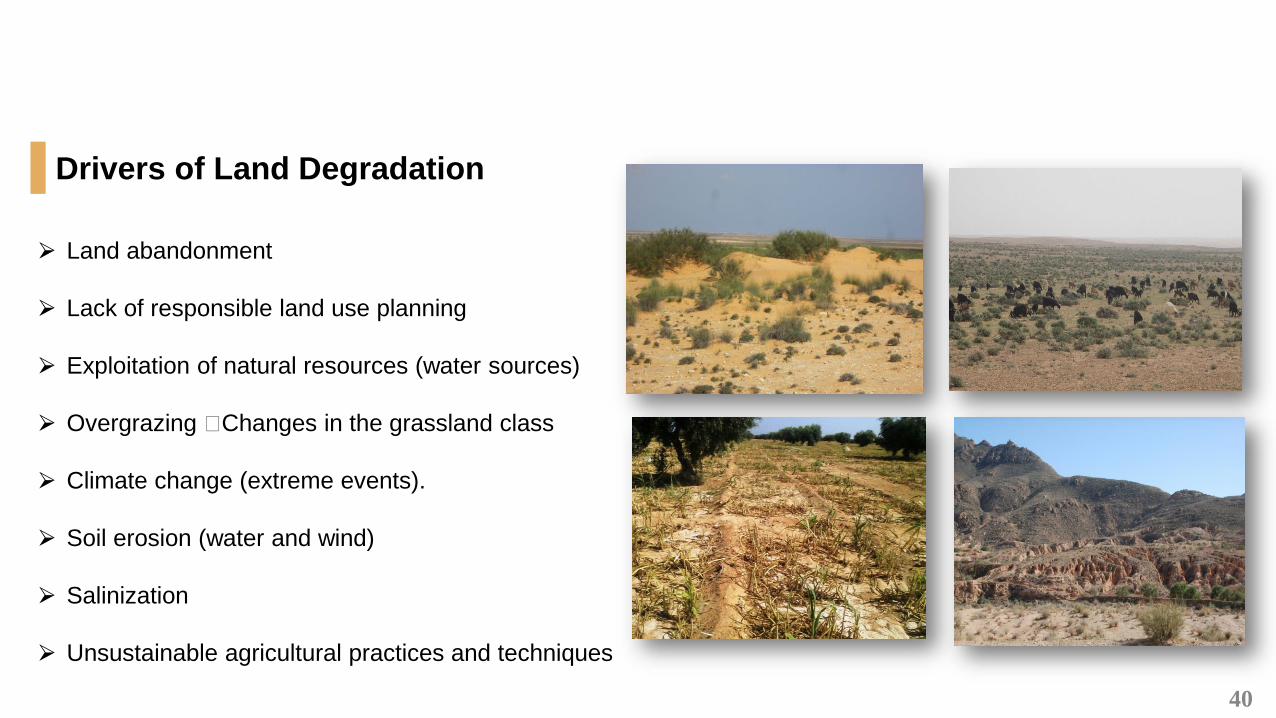
Drivers of Land Degradation
⮚ Land abandonment
⮚ Lack of responsible land use planning
⮚ Exploitation of natural resources (water sources)
⮚ Overgrazing 🡪Changes in the grassland class
⮚ Climate change (extreme events).
⮚ Soil erosion (water and wind)
⮚ Salinization
⮚ Unsustainable agricultural practices and techniques
40
● Geospatial data under GIS Open Source environment
● Analyzing and evaluating LD status
● Weighing the progress towards LDN at a local scale
● Dahar-Jeffara transect:
○ Stable state towards LD in the last 20 years (89,11%).
○ Improved land: 7.68% of total area.
○ Degraded land: 3.15% of the transect area.
41
- Effective management of LD risks,
- Achieving LDN by planning degradation control and integrating restoration
actions
- Track the impact of land use, human activity and development.

Thanks! شكرا
Institut des Régions Arides (IRA)
Laboratory of Eremology and Combating Desertification
El Fje 4119 Medenine - TUNISIA
Tel: (+216) 75633005 | Fax: (+216) 75633006
E-mail: [email protected] | [email protected]