Assessment of Impacts of Artisanal and Small-Scale … · activities are; mercury pollution, water...
13
ISSN(Online) : 2319 - 8753 ISSN (Print) : 2347 - 6710 International Journal of Innovative Research in Science, Engineering and Technology (An ISO 3297: 2007 Certified Organization) Vol. 4, Issue 4, April 2015 Copyright to IJIRSET DOI: 10.15680/IJIRSET.2015.0404072 2194 Assessment of Impacts of Artisanal and Small-Scale Mining Activities on Groundwater Quality of Ijero-Ekiti, South- Western Nigeria Talabi, A. O* 1 ., Afolagboye L. O 1 ., Aladejana, J. A 2 , Akinola, O. O 1, Aturamu, A. O 1 . Department of Geology, Ekiti State University, Ado-Ekiti, Nigeria 1 Department of Geology, University of Ibadan, Ibadan, Nigeria 2 ABSTRACT: This study focused on assessment of possible impacts of artisanal and small scale mining activities on groundwater in Ijero-Ekiti. Thirty groundwater samples (2 from the mining pits, 5 in the vicinity of the mining pits and the remaining 23 randomly selected from other parts of the study area) were collected and analysed for the anions and cations using Ion Chromatography and Atomic Absorption Mass Spectrometer methods respectively. Physical parameters (Temp.°C, pH, ECμS/cm) were measured in-situ using a Multi-parameter TestrTm 35 series Meter. The average values of pH (8.36), EC (371.40μS/cm) and average ionic concentrations in mg/L {Ca 2+ (18.21), Mg 2+ (7.45), Na + (43.10), K + (28.56), HCO 3 - (20.15), SO 4 2- (8.41), Cl - (256.34) and NO 3 - (0.38)} for the samples (7) from the mining pits and their vicinity showed no significant difference from the average concentrations of groundwater samples from the remaining 23 samples randomly selected from other parts of the study area except that more solutes were introduced into the groundwater system as residence time and length of transportation increase. The 23 samples have average values of pH (8.41), EC (558.91μS/cm) and average ionic concentrations in mg/L {Ca 2+ (53.94), Mg 2+ (20.49), Na + (45.79), K + (64.98) HCO 3 - (29.62), SO 4 2- (13.82), Cl - (304.63) and NO 3 - (0.38)}. Increase in solute input into the groundwater system as shown by the 23 samples from other parts of the study area might equally arise from lithological variations. The order of cations concentration in the study area is Ca 2+ >Na > K + > Mg 2+ while that of anions is Cl - > HCO 3 - > SO 4 2- > NO 3 - . All ions concentrations are within WHO standard for drinking water quality except chloride that exceeded it in few locations due to local anthropogenic contamination. The Piper trilinear diagram indicated Ca–(Mg)- Cl-(SO 4 ) and Na-(K)-Cl-(SO 4 as the dominant water. All water samples have low sodium hazard as well as low– medium salinity hazard while all irrigation indices (sodium absorption ratio, residual sodium bicarbonate and Kelly ratio) showed that the groundwater is suitable for irrigation. This study revealed that the groundwater of Ijero is low mineralized, chemically potable and suitable for irrigation while artisanal and small-scale mining activities have no significant impact on the groundwater. KEYWORDS: Artisanal, low mineralized, anthropogenic contamination, salinity hazard. I. INTRODUCTION Artisanal Miners, in the absence of the required safe mining knowledge or any regulations or standards operate in difficult and often very hazardous conditions whereby toxic materials can be released into the environment, posing large health risks to the Miners, their families and surrounding communities. Some environmental hazards of mining activities are; mercury pollution, water pollutions, landscape degradation, destruction of habitats, loss of organic soil and deforestation. A special mention must be made of the environmental degradation caused by the illegal mining of gemstone. Because of the uncontrolled manner the illegal Miners operate, a lot of damage is done to the environment by haphazard pitting and trenching of the ground [1], [2] and [3].
Transcript of Assessment of Impacts of Artisanal and Small-Scale … · activities are; mercury pollution, water...
ISSN(Online) : 2319 - 8753
ISSN (Print) : 2347 - 6710
International Journal of Innovative Research in Science,
Engineering and Technology
(An ISO 3297: 2007 Certified Organization)
Vol. 4, Issue 4, April 2015
Copyright to IJIRSET DOI: 10.15680/IJIRSET.2015.0404072 2194
Assessment of Impacts of Artisanal and
Small-Scale Mining Activities on
Groundwater Quality of Ijero-Ekiti, South-
Western Nigeria
Talabi, A. O*1., Afolagboye L. O
1., Aladejana, J. A
2, Akinola, O. O
1, Aturamu, A. O
1.
Department of Geology, Ekiti State University, Ado-Ekiti, Nigeria1
Department of Geology, University of Ibadan, Ibadan, Nigeria2
ABSTRACT: This study focused on assessment of possible impacts of artisanal and small scale mining activities on
groundwater in Ijero-Ekiti. Thirty groundwater samples (2 from the mining pits, 5 in the vicinity of the mining pits and
the remaining 23 randomly selected from other parts of the study area) were collected and analysed for the anions and
cations using Ion Chromatography and Atomic Absorption Mass Spectrometer methods respectively. Physical
parameters (Temp.°C, pH, ECµS/cm) were measured in-situ using a Multi-parameter TestrTm 35 series Meter. The
average values of pH (8.36), EC (371.40µS/cm) and average ionic concentrations in mg/L {Ca2+
(18.21), Mg2+
(7.45),
Na+(43.10), K
+(28.56), HCO3
-(20.15), SO4
2-(8.41), Cl
-(256.34) and NO3
-(0.38)} for the samples (7) from the mining
pits and their vicinity showed no significant difference from the average concentrations of groundwater samples from
the remaining 23 samples randomly selected from other parts of the study area except that more solutes were
introduced into the groundwater system as residence time and length of transportation increase. The 23 samples have
average values of pH (8.41), EC (558.91µS/cm) and average ionic concentrations in mg/L {Ca2+
(53.94), Mg2+
(20.49),
Na+(45.79), K
+(64.98) HCO3
-(29.62), SO4
2-(13.82), Cl
-(304.63) and NO3
-(0.38)}. Increase in solute input into the
groundwater system as shown by the 23 samples from other parts of the study area might equally arise from lithological
variations. The order of cations concentration in the study area is Ca2+
>Na > K+
> Mg2+
while that of anions is Cl->
HCO3-> SO4
2-> NO3
-. All ions concentrations are within WHO standard for drinking water quality except chloride that
exceeded it in few locations due to local anthropogenic contamination. The Piper trilinear diagram indicated Ca–(Mg)-
Cl-(SO4) and Na-(K)-Cl-(SO4 as the dominant water. All water samples have low sodium hazard as well as low–
medium salinity hazard while all irrigation indices (sodium absorption ratio, residual sodium bicarbonate and Kelly
ratio) showed that the groundwater is suitable for irrigation. This study revealed that the groundwater of Ijero is low
mineralized, chemically potable and suitable for irrigation while artisanal and small-scale mining activities have no
significant impact on the groundwater.
KEYWORDS: Artisanal, low mineralized, anthropogenic contamination, salinity hazard.
I. INTRODUCTION
Artisanal Miners, in the absence of the required safe mining knowledge or any regulations or standards operate in
difficult and often very hazardous conditions whereby toxic materials can be released into the environment, posing
large health risks to the Miners, their families and surrounding communities. Some environmental hazards of mining
activities are; mercury pollution, water pollutions, landscape degradation, destruction of habitats, loss of organic soil
and deforestation. A special mention must be made of the environmental degradation caused by the illegal mining of
gemstone. Because of the uncontrolled manner the illegal Miners operate, a lot of damage is done to the environment
by haphazard pitting and trenching of the ground [1], [2] and [3].
ISSN(Online) : 2319 - 8753
ISSN (Print) : 2347 - 6710
International Journal of Innovative Research in Science,
Engineering and Technology
(An ISO 3297: 2007 Certified Organization)
Vol. 4, Issue 4, April 2015
Copyright to IJIRSET DOI: 10.15680/IJIRSET.2015.0404072 2195
Ijero-Ekiti and environ has been considered a mineralized area in Ekiti State southwestern Nigeria. Records indicated
that the area has diverse mineral deposits including metallic (cassiterite, tantalite, columbite), industrial (kaoline and
marble), ceramic (clay and feldspar), speciality metal (lepidolite) and gem stone (aquamarine, smoky quartz and
tourmaline), [4]. Ijero – Ekiti has estimated feldspar deposit of 3.76 million metric tons [5] apart from unestimated talc
deposits in the area. Natural resources exploitation, exploration, mining and processing have caused different types of
environmental damages which include ecological disturbances, destruction of natural flora and fauna, pollution of air,
water and land, instability of soil and rock masses, landscape degradation, desertification and global warming. The
environmental damage has in turn resulted in waste of arable land as well as economic crops and trees [6]. The current
state of mining in Ijero area is being carried out by Artisanal, Small scale and Illegal miners whose operations are
executed in haphazard manner without supporting infrastructure. Many of the Miners have low level of education and
they do not know their environmental obligations under the Minerals and Mining Act, and that the adherence to best
global practices in mining is a vital tool for the promotion of sustainable growth in the industry. In view of this
development, little attention was paid to safety and environmental degradation. These actions have untold story on
groundwater system as the debris arising from the illegal mining activities are washed off by surface run-off especially
during rainy season. Invariably, some of the particulates end up in the groundwater aquifers of the area. In addition, the
geological complexities of rock units (migmatite gneiss and metasediments of the Basement complex, pegmatite bodies
associated with the schist belt and Basement gneiss intruded by pegmatites and quartz veins) in the study area are prone
to differential weathering. The highlighted crystalline rocks formed by interlocking silicate minerals such as quartz,
feldspars, micas, hornblende, pyroxenes, olivine and a host of minor accessories are exposed or made culpable to
weathering through exploration and illegal mining of mineral deposits in the area. Chemical weathering involves the
dissolution of these minerals resulting in the formation of both soluble as well as solid phase products. Some of the
dissolved solids got infiltrated into the groundwater system of the study area resulting in modification of its
composition. Although mining provides a variety of socio-economic benefits but its environmental costs, if not well
handled can be massive in terms of land conversion and degradation, habitat alteration, water and air pollution [3].
Hence, this study assesses only the impact of mineral exploration and exploitation on the groundwater system of the
study area paying attention to groundwater potability and irrigation quality assessments.
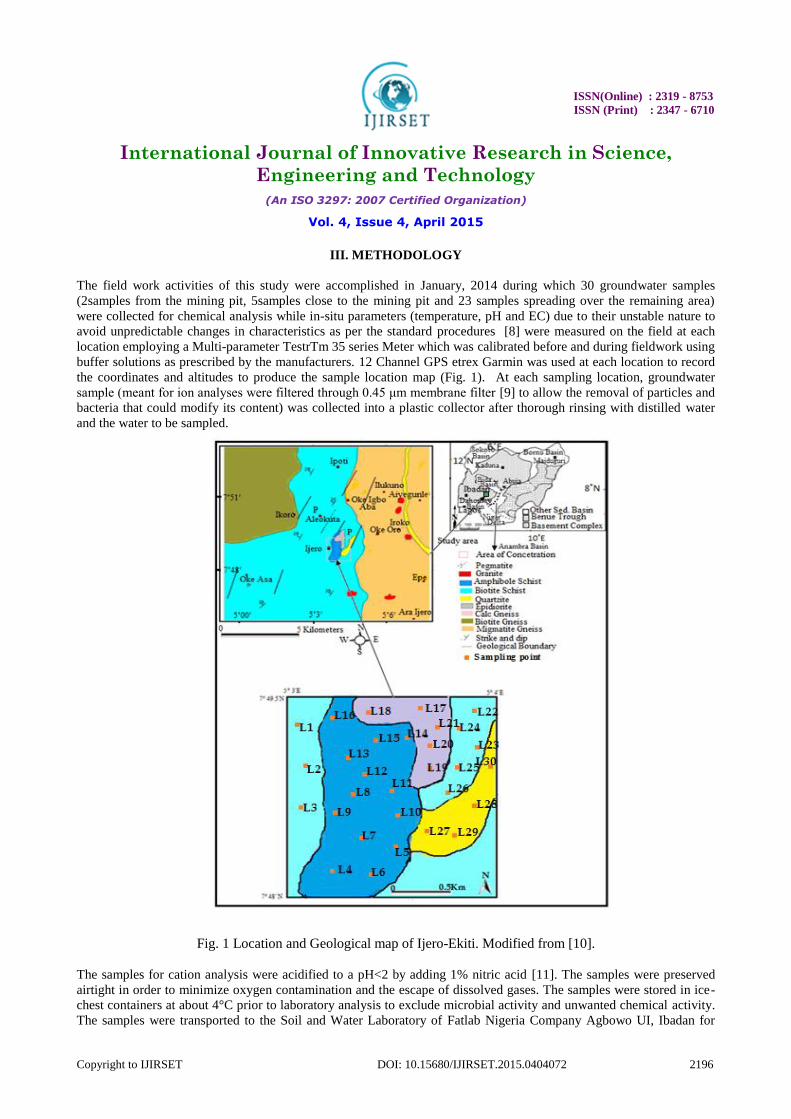
II. LOCATION AND GEOLOGY
Ijero area comprises of Ijero-Ekiti with other component towns including Ikoro- Ekiti, Iroko- Ekiti, Ayegunle-Ekiti,
Ipoti-Ekiti, Iloro-Ekiti, Temidire-Ekiti, Ilukuno-Ekiti and others are Epe-Ekiti, Ara-Ekiti, Araromi-Ekiti, Oke Oro-Ekiti
and Odo Owa -Ekiti. The area covers 473.5km2. This study is limited to Ijero-Ekiti where most of the mineral
exploration and exploitation activities were carried out. The study area falls within the Basement Complex of
Southwestern Nigeria. It lies within Latitudes7° 48' to7° 49.5' North and Longitudes 5° 3' to 5° 4' East (Fig. 1). The
topography is rugged characterized with low lying hills that are generally 250m above sea level. Geologically, the
study area is underlain by crystalline rocks of Precambrian Basement Complex of southwestern Nigeria. The crystalline
rocks have been categorized into the migmatite gneiss complex, the schist belts and the Pan African granites [7]. The
crystalline rocks have suffered polycyclic deformations which were as a result of several techtenothermal events
including the Liberian, Eburnean, Kiberian and Pan African orogenies. The Pan African orogeny witnessed the
emplacement of the older granites and affected the pre-existing meta-igneous and metasedimentary rocks. The
lithologic assemblages include migmatite gneisses, schists, quartzite and pegmatites all of which are Precambrian –
Cambrian age. [4] indicated in his paper delivered at Ekiti State Economic Development Summit that minerals
occurred in specific geologic rocks in the study area. Marble, an industrial mineral occurs in the migmatitic gneisses
and metasediments while cassiterite, columbite, lepidolite and tantalite (metallic minerals) occur in pegmatite bodies
associated with schist and amphibolite schists. Other mineral components in varied rock units of the study area include
kaolin formed from gneiss intruded by pegmatite and quartz veins, feldspars associated with pegmatite bodies as well
as disseminated gemstone (tourmaline, aquamarine and smoky quartz) in pegmatite.
ISSN(Online) : 2319 - 8753
ISSN (Print) : 2347 - 6710
International Journal of Innovative Research in Science,
Engineering and Technology
(An ISO 3297: 2007 Certified Organization)
Vol. 4, Issue 4, April 2015
Copyright to IJIRSET DOI: 10.15680/IJIRSET.2015.0404072 2196
III. METHODOLOGY
The field work activities of this study were accomplished in January, 2014 during which 30 groundwater samples
(2samples from the mining pit, 5samples close to the mining pit and 23 samples spreading over the remaining area)
were collected for chemical analysis while in-situ parameters (temperature, pH and EC) due to their unstable nature to
avoid unpredictable changes in characteristics as per the standard procedures [8] were measured on the field at each
location employing a Multi-parameter TestrTm 35 series Meter which was calibrated before and during fieldwork using
buffer solutions as prescribed by the manufacturers. 12 Channel GPS etrex Garmin was used at each location to record
the coordinates and altitudes to produce the sample location map (Fig. 1). At each sampling location, groundwater
sample (meant for ion analyses were filtered through 0.45 μm membrane filter [9] to allow the removal of particles and
bacteria that could modify its content) was collected into a plastic collector after thorough rinsing with distilled water
and the water to be sampled.
Fig. 1 Location and Geological map of Ijero-Ekiti. Modified from [10].
The samples for cation analysis were acidified to a pH<2 by adding 1% nitric acid [11]. The samples were preserved
airtight in order to minimize oxygen contamination and the escape of dissolved gases. The samples were stored in ice-
chest containers at about 4°C prior to laboratory analysis to exclude microbial activity and unwanted chemical activity.
The samples were transported to the Soil and Water Laboratory of Fatlab Nigeria Company Agbowo UI, Ibadan for
ISSN(Online) : 2319 - 8753
ISSN (Print) : 2347 - 6710
International Journal of Innovative Research in Science,
Engineering and Technology
(An ISO 3297: 2007 Certified Organization)
Vol. 4, Issue 4, April 2015
Copyright to IJIRSET DOI: 10.15680/IJIRSET.2015.0404072 2197
ions analysis employing the Flame Technique in a High Resolution Continuum Source AAS (ContrAA700) for cations
and Ion Chromatography (Dionex ICS-900) for anions determinations.
DATA EVALUATION
Data obtained from the analyses were subjected to statistical evaluation employing SPSS 17. Other graphical plots
employed in this study include Piper tri-linear diagram [12], Schoeller diagram [13], Gibb’s plots [14] and [15] plot.
Rockwork software was employed for the plot of the Piper and Schoeller diagrams while Gibb’s and Chadha diagrams
were plotted employing Microsoft excel. Irrigation quality parameters including sodium adsorption ratio, residual
sodium bicarbonate and magnesium absorption ratio were estimated employing the following under listed equations:
The Sodium Adsorption Ratio (SAR) was calculated by the following equation given by [16] as:
(1)
The Residual Sodium Bicarbonate (RSBC) was calculated according to [17]:
RSBC = HCO3 – Ca2+
(2)
where, RSBC and the concentration of the constituents are expressed in meq/L.
The Magnesium absorption ratio (MAR) was calculated by the equation [18] as:
(3)
Kelly’s Ratio (KR) was calculated [19] as:
( 4)
The concentrations of the constituents are expressed in meq/L.
IV. RESULTS AND DISCUSSIONS
HYDROGEOCHEMISTRY
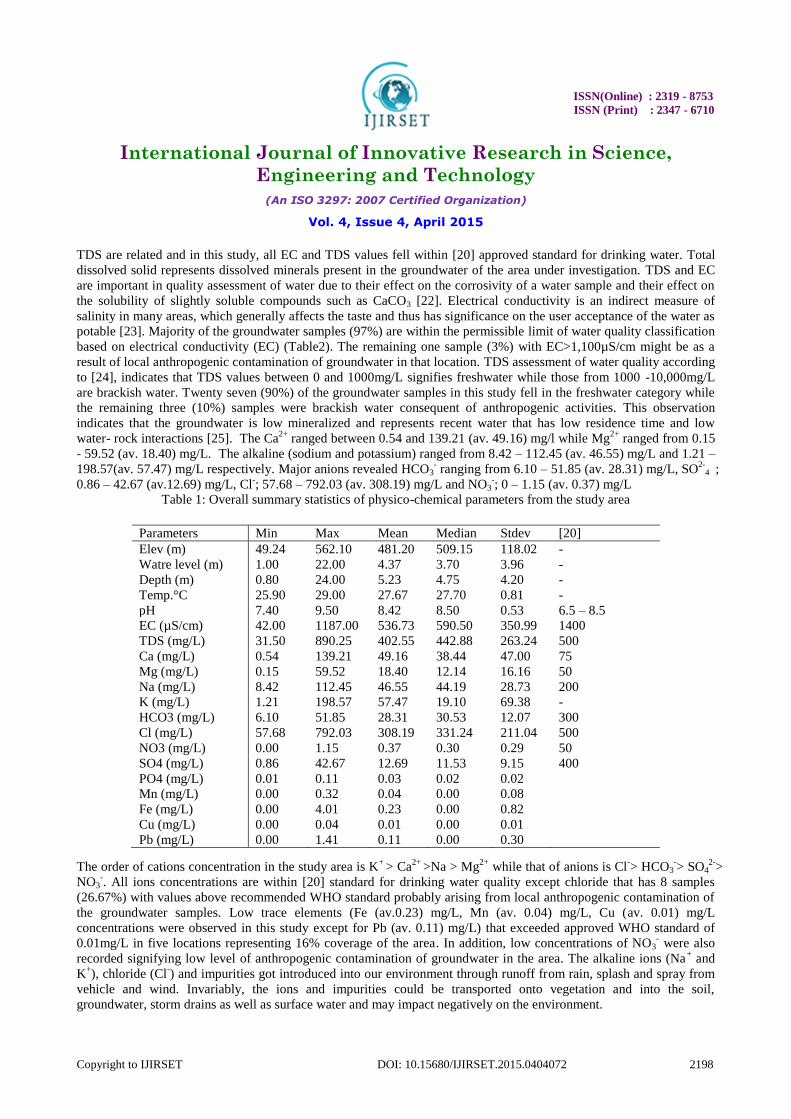
The overall statistical summary of results of measured parameters of groundwater in the study area along with [20]
approved standard for drinking water quality is presented in Table 1. Generally, pH of groundwater in the study area
ranged from 7.40 – 9.50 (av. 8.42), indicating alkaline water. However, 50% of the groundwater has pH (pH > 8.5)
values outside the range of approved WHO standard for drinking water (pH > 8.50). Corrosion effects may become
significant below pH 6.5 and the frequency of incrustation and scaling problems may be increased above pH 8.5.
Insofar as pH affects the unit processes in water treatment that contribute to the removal of viruses, bacteria and other
harmful organisms, it could be argued that pH has an indirect effect on health. The acceptable range for drinking water
pH is herefore from 6.5 to 8.5. In general, waters with a pH within this range can be stabilized with respect to corrosion
and incrustation by simple pH adjustment. By keeping the pH below 8.5, the rate of chlorine disinfection is increased
and the production of trihalomethanes is reduced [21]. The results further revealed low solute input into the
groundwater system as exemplified by EC that ranged from 42.00 – 1187.00 (av. 536.73) µS/cm. The wide variations
in EC were expected in view of the terrain of study with varied elevation (49.24 – 562.10m) which signified rugged
topography where bedrocks response to differential weathering and other geologic agents also varied exceedingly. Thus,
movement and distribution of ionic constituents in the groundwater was guided by the nature of the terrain. EC and
NaKR
Ca Mg
( )
2
NaSAR
Ca Mg
ISSN(Online) : 2319 - 8753
ISSN (Print) : 2347 - 6710
International Journal of Innovative Research in Science,
Engineering and Technology
(An ISO 3297: 2007 Certified Organization)
Vol. 4, Issue 4, April 2015
Copyright to IJIRSET DOI: 10.15680/IJIRSET.2015.0404072 2198
TDS are related and in this study, all EC and TDS values fell within [20] approved standard for drinking water. Total
dissolved solid represents dissolved minerals present in the groundwater of the area under investigation. TDS and EC
are important in quality assessment of water due to their effect on the corrosivity of a water sample and their effect on
the solubility of slightly soluble compounds such as CaCO3 [22]. Electrical conductivity is an indirect measure of
salinity in many areas, which generally affects the taste and thus has significance on the user acceptance of the water as
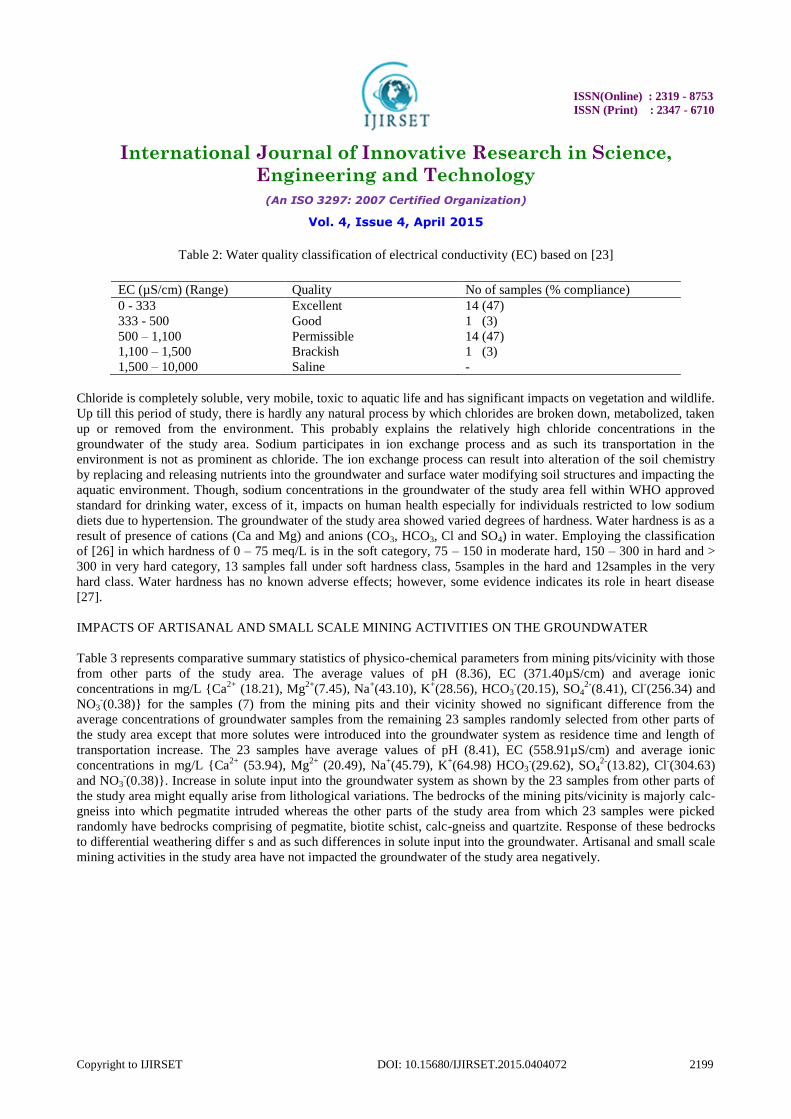
potable [23]. Majority of the groundwater samples (97%) are within the permissible limit of water quality classification
based on electrical conductivity (EC) (Table2). The remaining one sample (3%) with EC>1,100µS/cm might be as a
result of local anthropogenic contamination of groundwater in that location. TDS assessment of water quality according
to [24], indicates that TDS values between 0 and 1000mg/L signifies freshwater while those from 1000 -10,000mg/L
are brackish water. Twenty seven (90%) of the groundwater samples in this study fell in the freshwater category while
the remaining three (10%) samples were brackish water consequent of anthropogenic activities. This observation
indicates that the groundwater is low mineralized and represents recent water that has low residence time and low
water- rock interactions [25]. The Ca2+
ranged between 0.54 and 139.21 (av. 49.16) mg/l while Mg2+
ranged from 0.15
- 59.52 (av. 18.40) mg/L. The alkaline (sodium and potassium) ranged from 8.42 – 112.45 (av. 46.55) mg/L and 1.21 –
198.57(av. 57.47) mg/L respectively. Major anions revealed HCO3- ranging from 6.10 – 51.85 (av. 28.31) mg/L, SO
2-4 ;
0.86 – 42.67 (av.12.69) mg/L, Cl-; 57.68 – 792.03 (av. 308.19) mg/L and NO3
-; 0 – 1.15 (av. 0.37) mg/L
Table 1: Overall summary statistics of physico-chemical parameters from the study area
The order of cations concentration in the study area is K+
> Ca2+
>Na > Mg2+
while that of anions is Cl-> HCO3
-> SO4
2->
NO3-. All ions concentrations are within [20] standard for drinking water quality except chloride that has 8 samples
(26.67%) with values above recommended WHO standard probably arising from local anthropogenic contamination of
the groundwater samples. Low trace elements (Fe (av.0.23) mg/L, Mn (av. 0.04) mg/L, Cu (av. 0.01) mg/L
concentrations were observed in this study except for Pb (av. 0.11) mg/L) that exceeded approved WHO standard of
0.01mg/L in five locations representing 16% coverage of the area. In addition, low concentrations of NO3- were also
recorded signifying low level of anthropogenic contamination of groundwater in the area. The alkaline ions (Na+ and
K+), chloride (Cl
-) and impurities got introduced into our environment through runoff from rain, splash and spray from
vehicle and wind. Invariably, the ions and impurities could be transported onto vegetation and into the soil,
groundwater, storm drains as well as surface water and may impact negatively on the environment.
Parameters Min Max Mean Median Stdev [20]
Elev (m) 49.24 562.10 481.20 509.15 118.02 -
Watre level (m) 1.00 22.00 4.37 3.70 3.96 -
Depth (m) 0.80 24.00 5.23 4.75 4.20 -
Temp.°C 25.90 29.00 27.67 27.70 0.81 -
pH 7.40 9.50 8.42 8.50 0.53 6.5 – 8.5
EC (µS/cm) 42.00 1187.00 536.73 590.50 350.99 1400
TDS (mg/L) 31.50 890.25 402.55 442.88 263.24 500
Ca (mg/L) 0.54 139.21 49.16 38.44 47.00 75
Mg (mg/L) 0.15 59.52 18.40 12.14 16.16 50
Na (mg/L) 8.42 112.45 46.55 44.19 28.73 200
K (mg/L) 1.21 198.57 57.47 19.10 69.38 -
HCO3 (mg/L) 6.10 51.85 28.31 30.53 12.07 300
Cl (mg/L) 57.68 792.03 308.19 331.24 211.04 500
NO3 (mg/L) 0.00 1.15 0.37 0.30 0.29 50
SO4 (mg/L) 0.86 42.67 12.69 11.53 9.15 400
PO4 (mg/L) 0.01 0.11 0.03 0.02 0.02
Mn (mg/L) 0.00 0.32 0.04 0.00 0.08
Fe (mg/L) 0.00 4.01 0.23 0.00 0.82
Cu (mg/L) 0.00 0.04 0.01 0.00 0.01
Pb (mg/L) 0.00 1.41 0.11 0.00 0.30
ISSN(Online) : 2319 - 8753
ISSN (Print) : 2347 - 6710
International Journal of Innovative Research in Science,
Engineering and Technology
(An ISO 3297: 2007 Certified Organization)
Vol. 4, Issue 4, April 2015
Copyright to IJIRSET DOI: 10.15680/IJIRSET.2015.0404072 2199
Table 2: Water quality classification of electrical conductivity (EC) based on [23]
Chloride is completely soluble, very mobile, toxic to aquatic life and has significant impacts on vegetation and wildlife.
Up till this period of study, there is hardly any natural process by which chlorides are broken down, metabolized, taken
up or removed from the environment. This probably explains the relatively high chloride concentrations in the
groundwater of the study area. Sodium participates in ion exchange process and as such its transportation in the
environment is not as prominent as chloride. The ion exchange process can result into alteration of the soil chemistry
by replacing and releasing nutrients into the groundwater and surface water modifying soil structures and impacting the
aquatic environment. Though, sodium concentrations in the groundwater of the study area fell within WHO approved
standard for drinking water, excess of it, impacts on human health especially for individuals restricted to low sodium
diets due to hypertension. The groundwater of the study area showed varied degrees of hardness. Water hardness is as a
result of presence of cations (Ca and Mg) and anions (CO3, HCO3, Cl and SO4) in water. Employing the classification
of [26] in which hardness of 0 – 75 meq/L is in the soft category, 75 – 150 in moderate hard, 150 – 300 in hard and >
300 in very hard category, 13 samples fall under soft hardness class, 5samples in the hard and 12samples in the very
hard class. Water hardness has no known adverse effects; however, some evidence indicates its role in heart disease
[27].
IMPACTS OF ARTISANAL AND SMALL SCALE MINING ACTIVITIES ON THE GROUNDWATER
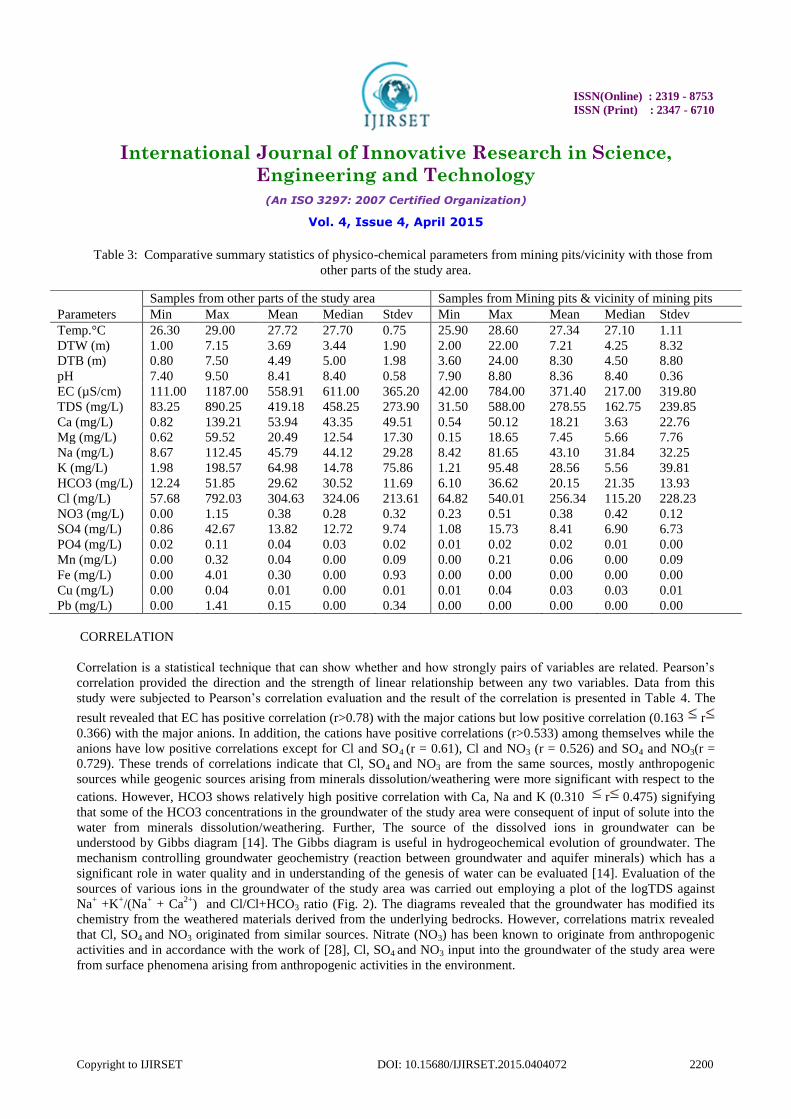
Table 3 represents comparative summary statistics of physico-chemical parameters from mining pits/vicinity with those
from other parts of the study area. The average values of pH (8.36), EC (371.40µS/cm) and average ionic
concentrations in mg/L {Ca2+
(18.21), Mg2+
(7.45), Na+(43.10), K
+(28.56), HCO3
-(20.15), SO4
2-(8.41), Cl
-(256.34) and
NO3-(0.38)} for the samples (7) from the mining pits and their vicinity showed no significant difference from the
average concentrations of groundwater samples from the remaining 23 samples randomly selected from other parts of
the study area except that more solutes were introduced into the groundwater system as residence time and length of
transportation increase. The 23 samples have average values of pH (8.41), EC (558.91µS/cm) and average ionic
concentrations in mg/L {Ca2+
(53.94), Mg2+
(20.49), Na+(45.79), K
+(64.98) HCO3
-(29.62), SO4
2-(13.82), Cl
-(304.63)
and NO3-(0.38)}. Increase in solute input into the groundwater system as shown by the 23 samples from other parts of
the study area might equally arise from lithological variations. The bedrocks of the mining pits/vicinity is majorly calc-
gneiss into which pegmatite intruded whereas the other parts of the study area from which 23 samples were picked
randomly have bedrocks comprising of pegmatite, biotite schist, calc-gneiss and quartzite. Response of these bedrocks
to differential weathering differ s and as such differences in solute input into the groundwater. Artisanal and small scale
mining activities in the study area have not impacted the groundwater of the study area negatively.
EC (µS/cm) (Range) Quality No of samples (% compliance)
0 - 333 Excellent 14 (47)
333 - 500 Good 1 (3)
500 – 1,100 Permissible 14 (47)
1,100 – 1,500 Brackish 1 (3)
1,500 – 10,000 Saline -
ISSN(Online) : 2319 - 8753
ISSN (Print) : 2347 - 6710
International Journal of Innovative Research in Science,
Engineering and Technology
(An ISO 3297: 2007 Certified Organization)
Vol. 4, Issue 4, April 2015
Copyright to IJIRSET DOI: 10.15680/IJIRSET.2015.0404072 2200
Table 3: Comparative summary statistics of physico-chemical parameters from mining pits/vicinity with those from
other parts of the study area.
CORRELATION
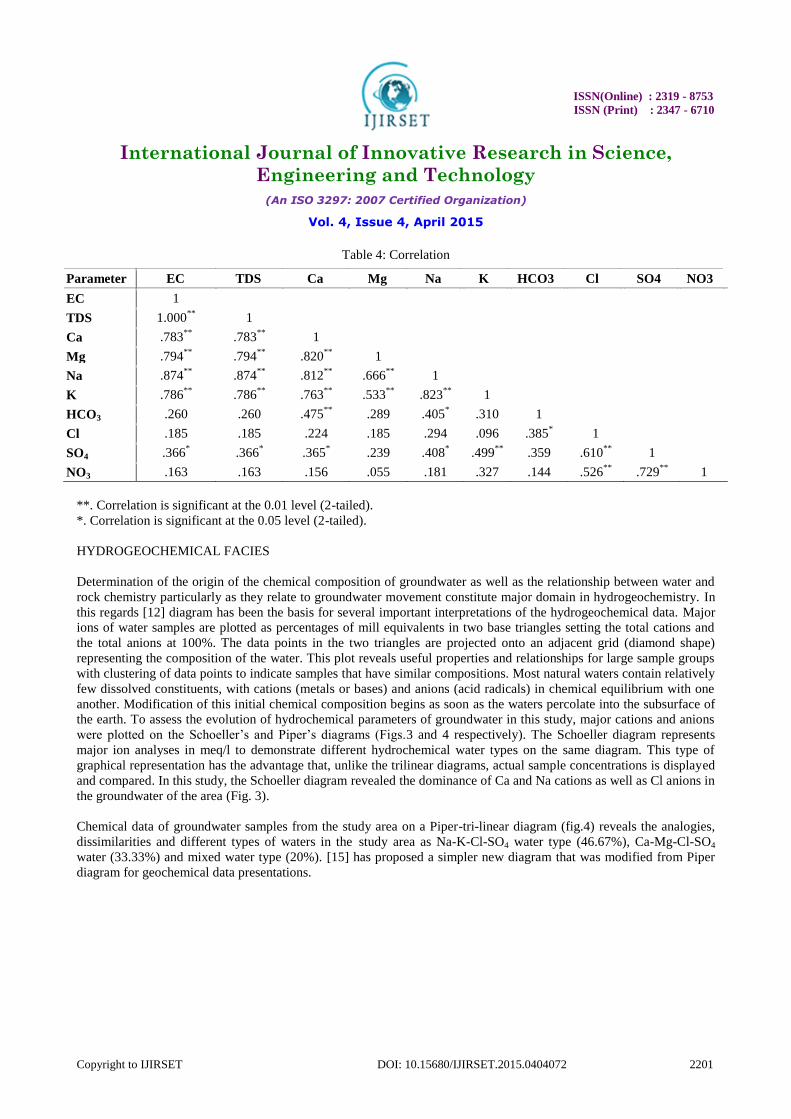
Correlation is a statistical technique that can show whether and how strongly pairs of variables are related. Pearson’s
correlation provided the direction and the strength of linear relationship between any two variables. Data from this
study were subjected to Pearson’s correlation evaluation and the result of the correlation is presented in Table 4. The
result revealed that EC has positive correlation (r>0.78) with the major cations but low positive correlation (0.163 r
0.366) with the major anions. In addition, the cations have positive correlations (r>0.533) among themselves while the
anions have low positive correlations except for Cl and SO4 (r = 0.61), Cl and NO3 (r = 0.526) and SO4 and NO3(r =
0.729). These trends of correlations indicate that Cl, SO4 and NO3 are from the same sources, mostly anthropogenic
sources while geogenic sources arising from minerals dissolution/weathering were more significant with respect to the
cations. However, HCO3 shows relatively high positive correlation with Ca, Na and K (0.310 r 0.475) signifying
that some of the HCO3 concentrations in the groundwater of the study area were consequent of input of solute into the
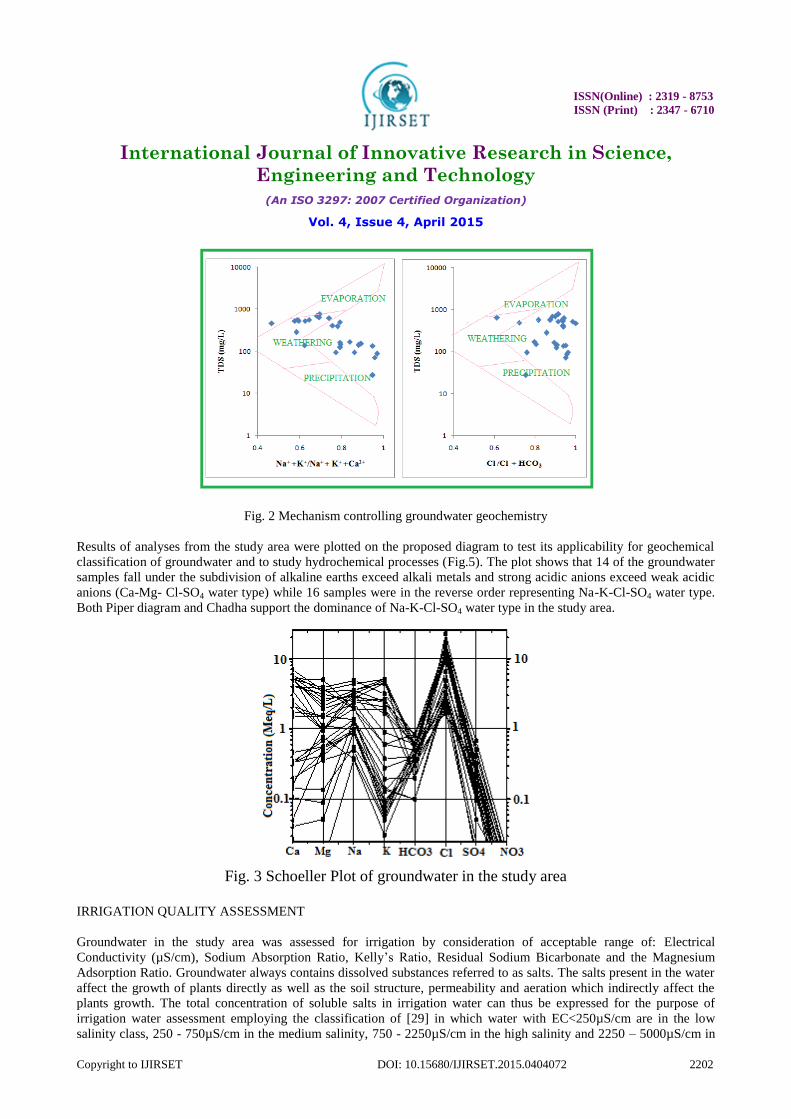
water from minerals dissolution/weathering. Further, The source of the dissolved ions in groundwater can be
understood by Gibbs diagram [14]. The Gibbs diagram is useful in hydrogeochemical evolution of groundwater. The
mechanism controlling groundwater geochemistry (reaction between groundwater and aquifer minerals) which has a
significant role in water quality and in understanding of the genesis of water can be evaluated [14]. Evaluation of the
sources of various ions in the groundwater of the study area was carried out employing a plot of the logTDS against
Na+ +K
+/(Na
+ + Ca
2+) and Cl/Cl+HCO3 ratio (Fig. 2). The diagrams revealed that the groundwater has modified its
chemistry from the weathered materials derived from the underlying bedrocks. However, correlations matrix revealed
that Cl, SO4 and NO3 originated from similar sources. Nitrate (NO3) has been known to originate from anthropogenic
activities and in accordance with the work of [28], Cl, SO4 and NO3 input into the groundwater of the study area were
from surface phenomena arising from anthropogenic activities in the environment.
Samples from other parts of the study area Samples from Mining pits & vicinity of mining pits
Parameters Min Max Mean Median Stdev Min Max Mean Median Stdev
Temp.°C 26.30 29.00 27.72 27.70 0.75 25.90 28.60 27.34 27.10 1.11
DTW (m) 1.00 7.15 3.69 3.44 1.90 2.00 22.00 7.21 4.25 8.32
DTB (m) 0.80 7.50 4.49 5.00 1.98 3.60 24.00 8.30 4.50 8.80
pH 7.40 9.50 8.41 8.40 0.58 7.90 8.80 8.36 8.40 0.36
EC (µS/cm) 111.00 1187.00 558.91 611.00 365.20 42.00 784.00 371.40 217.00 319.80
TDS (mg/L) 83.25 890.25 419.18 458.25 273.90 31.50 588.00 278.55 162.75 239.85
Ca (mg/L) 0.82 139.21 53.94 43.35 49.51 0.54 50.12 18.21 3.63 22.76
Mg (mg/L) 0.62 59.52 20.49 12.54 17.30 0.15 18.65 7.45 5.66 7.76
Na (mg/L) 8.67 112.45 45.79 44.12 29.28 8.42 81.65 43.10 31.84 32.25
K (mg/L) 1.98 198.57 64.98 14.78 75.86 1.21 95.48 28.56 5.56 39.81
HCO3 (mg/L) 12.24 51.85 29.62 30.52 11.69 6.10 36.62 20.15 21.35 13.93
Cl (mg/L) 57.68 792.03 304.63 324.06 213.61 64.82 540.01 256.34 115.20 228.23
NO3 (mg/L) 0.00 1.15 0.38 0.28 0.32 0.23 0.51 0.38 0.42 0.12
SO4 (mg/L) 0.86 42.67 13.82 12.72 9.74 1.08 15.73 8.41 6.90 6.73
PO4 (mg/L) 0.02 0.11 0.04 0.03 0.02 0.01 0.02 0.02 0.01 0.00
Mn (mg/L) 0.00 0.32 0.04 0.00 0.09 0.00 0.21 0.06 0.00 0.09
Fe (mg/L) 0.00 4.01 0.30 0.00 0.93 0.00 0.00 0.00 0.00 0.00
Cu (mg/L) 0.00 0.04 0.01 0.00 0.01 0.01 0.04 0.03 0.03 0.01
Pb (mg/L) 0.00 1.41 0.15 0.00 0.34 0.00 0.00 0.00 0.00 0.00
ISSN(Online) : 2319 - 8753
ISSN (Print) : 2347 - 6710
International Journal of Innovative Research in Science,
Engineering and Technology
(An ISO 3297: 2007 Certified Organization)
Vol. 4, Issue 4, April 2015
Copyright to IJIRSET DOI: 10.15680/IJIRSET.2015.0404072 2201
Table 4: Correlation
**. Correlation is significant at the 0.01 level (2-tailed).
*. Correlation is significant at the 0.05 level (2-tailed).
HYDROGEOCHEMICAL FACIES
Determination of the origin of the chemical composition of groundwater as well as the relationship between water and
rock chemistry particularly as they relate to groundwater movement constitute major domain in hydrogeochemistry. In
this regards [12] diagram has been the basis for several important interpretations of the hydrogeochemical data. Major
ions of water samples are plotted as percentages of mill equivalents in two base triangles setting the total cations and
the total anions at 100%. The data points in the two triangles are projected onto an adjacent grid (diamond shape)
representing the composition of the water. This plot reveals useful properties and relationships for large sample groups
with clustering of data points to indicate samples that have similar compositions. Most natural waters contain relatively
few dissolved constituents, with cations (metals or bases) and anions (acid radicals) in chemical equilibrium with one
another. Modification of this initial chemical composition begins as soon as the waters percolate into the subsurface of
the earth. To assess the evolution of hydrochemical parameters of groundwater in this study, major cations and anions
were plotted on the Schoeller’s and Piper’s diagrams (Figs.3 and 4 respectively). The Schoeller diagram represents
major ion analyses in meq/l to demonstrate different hydrochemical water types on the same diagram. This type of
graphical representation has the advantage that, unlike the trilinear diagrams, actual sample concentrations is displayed
and compared. In this study, the Schoeller diagram revealed the dominance of Ca and Na cations as well as Cl anions in
the groundwater of the area (Fig. 3).
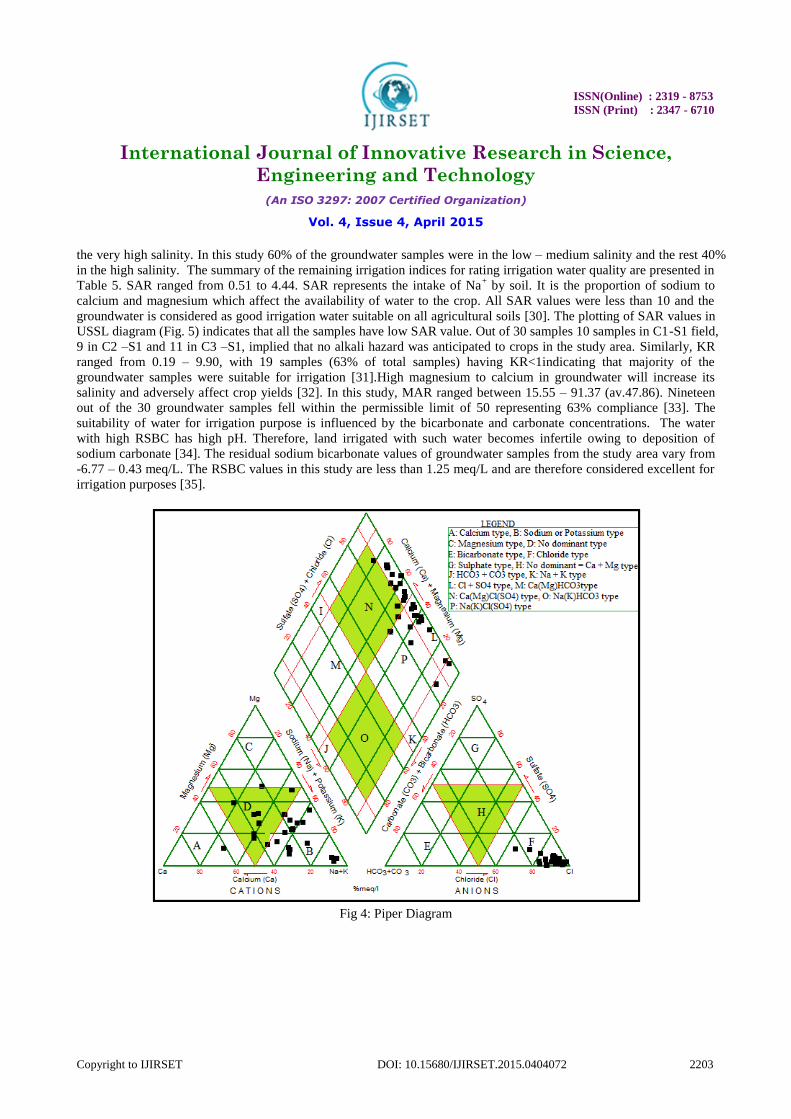
Chemical data of groundwater samples from the study area on a Piper-tri-linear diagram (fig.4) reveals the analogies,
dissimilarities and different types of waters in the study area as Na-K-Cl-SO4 water type (46.67%), Ca-Mg-Cl-SO4
water (33.33%) and mixed water type (20%). [15] has proposed a simpler new diagram that was modified from Piper
diagram for geochemical data presentations.
Parameter EC TDS Ca Mg Na K HCO3 Cl SO4 NO3
EC 1
TDS 1.000**
1
Ca .783**
.783**
1
Mg .794**
.794**
.820**
1
Na .874**
.874**
.812**
.666**
1
K .786**
.786**
.763**
.533**
.823**
1
HCO3 .260 .260 .475**
.289 .405* .310 1
Cl .185 .185 .224 .185 .294 .096 .385* 1
SO4 .366* .366
* .365
* .239 .408
* .499
** .359 .610
** 1
NO3 .163 .163 .156 .055 .181 .327 .144 .526**
.729**
1
ISSN(Online) : 2319 - 8753
ISSN (Print) : 2347 - 6710
International Journal of Innovative Research in Science,
Engineering and Technology
(An ISO 3297: 2007 Certified Organization)
Vol. 4, Issue 4, April 2015
Copyright to IJIRSET DOI: 10.15680/IJIRSET.2015.0404072 2202
Fig. 2 Mechanism controlling groundwater geochemistry
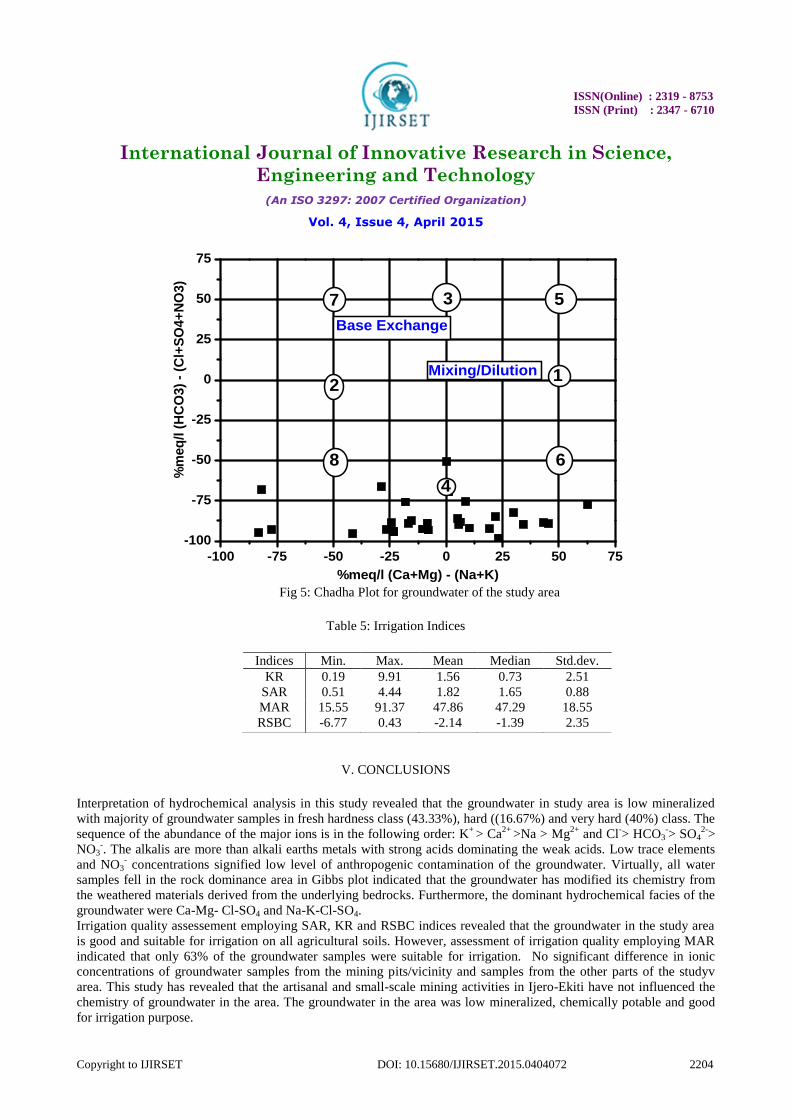
Results of analyses from the study area were plotted on the proposed diagram to test its applicability for geochemical
classification of groundwater and to study hydrochemical processes (Fig.5). The plot shows that 14 of the groundwater
samples fall under the subdivision of alkaline earths exceed alkali metals and strong acidic anions exceed weak acidic
anions (Ca-Mg- Cl-SO4 water type) while 16 samples were in the reverse order representing Na-K-Cl-SO4 water type.
Both Piper diagram and Chadha support the dominance of Na-K-Cl-SO4 water type in the study area.
Fig. 3 Schoeller Plot of groundwater in the study area
IRRIGATION QUALITY ASSESSMENT
Groundwater in the study area was assessed for irrigation by consideration of acceptable range of: Electrical
Conductivity (µS/cm), Sodium Absorption Ratio, Kelly’s Ratio, Residual Sodium Bicarbonate and the Magnesium
Adsorption Ratio. Groundwater always contains dissolved substances referred to as salts. The salts present in the water
affect the growth of plants directly as well as the soil structure, permeability and aeration which indirectly affect the
plants growth. The total concentration of soluble salts in irrigation water can thus be expressed for the purpose of
irrigation water assessment employing the classification of [29] in which water with EC<250µS/cm are in the low
salinity class, 250 - 750µS/cm in the medium salinity, 750 - 2250µS/cm in the high salinity and 2250 – 5000µS/cm in
ISSN(Online) : 2319 - 8753
ISSN (Print) : 2347 - 6710
International Journal of Innovative Research in Science,
Engineering and Technology
(An ISO 3297: 2007 Certified Organization)
Vol. 4, Issue 4, April 2015
Copyright to IJIRSET DOI: 10.15680/IJIRSET.2015.0404072 2203
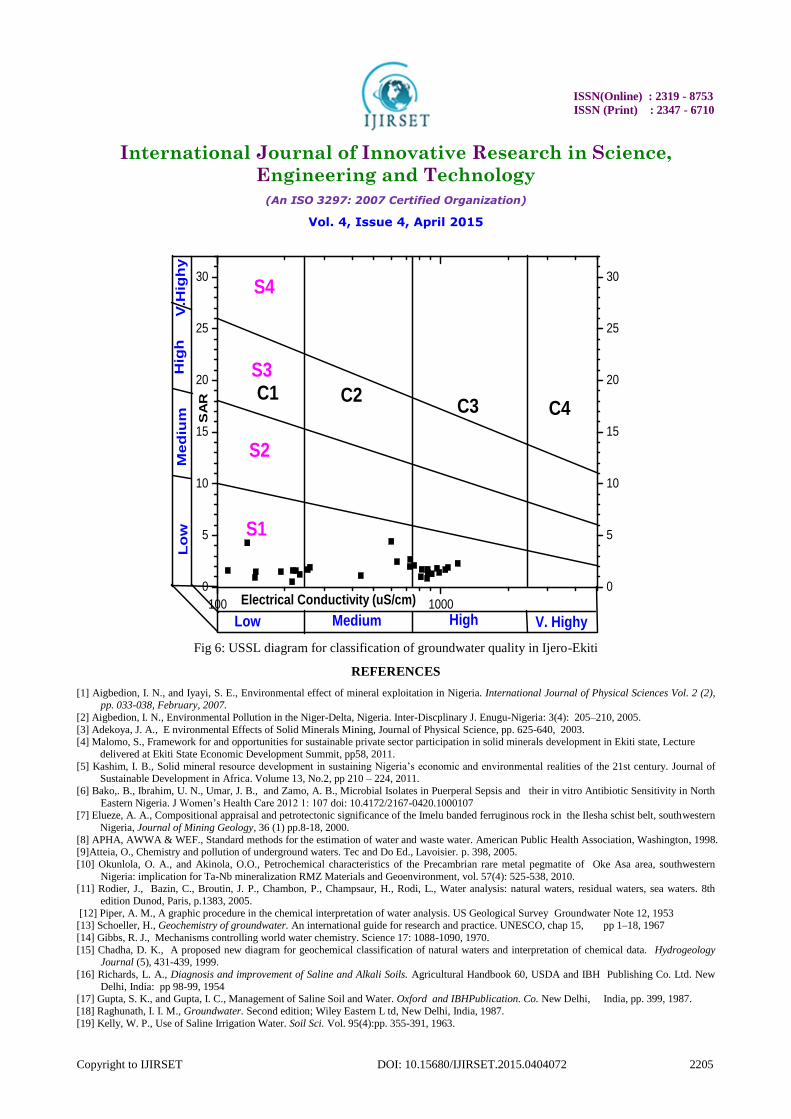
the very high salinity. In this study 60% of the groundwater samples were in the low – medium salinity and the rest 40%
in the high salinity. The summary of the remaining irrigation indices for rating irrigation water quality are presented in
Table 5. SAR ranged from 0.51 to 4.44. SAR represents the intake of Na+ by soil. It is the proportion of sodium to
calcium and magnesium which affect the availability of water to the crop. All SAR values were less than 10 and the
groundwater is considered as good irrigation water suitable on all agricultural soils [30]. The plotting of SAR values in
USSL diagram (Fig. 5) indicates that all the samples have low SAR value. Out of 30 samples 10 samples in C1-S1 field,
9 in C2 –S1 and 11 in C3 –S1, implied that no alkali hazard was anticipated to crops in the study area. Similarly, KR
ranged from 0.19 – 9.90, with 19 samples (63% of total samples) having KR<1indicating that majority of the
groundwater samples were suitable for irrigation [31].High magnesium to calcium in groundwater will increase its
salinity and adversely affect crop yields [32]. In this study, MAR ranged between 15.55 – 91.37 (av.47.86). Nineteen
out of the 30 groundwater samples fell within the permissible limit of 50 representing 63% compliance [33]. The
suitability of water for irrigation purpose is influenced by the bicarbonate and carbonate concentrations. The water
with high RSBC has high pH. Therefore, land irrigated with such water becomes infertile owing to deposition of
sodium carbonate [34]. The residual sodium bicarbonate values of groundwater samples from the study area vary from
-6.77 – 0.43 meq/L. The RSBC values in this study are less than 1.25 meq/L and are therefore considered excellent for
irrigation purposes [35].
Fig 4: Piper Diagram
ISSN(Online) : 2319 - 8753
ISSN (Print) : 2347 - 6710
International Journal of Innovative Research in Science,
Engineering and Technology
(An ISO 3297: 2007 Certified Organization)
Vol. 4, Issue 4, April 2015
Copyright to IJIRSET DOI: 10.15680/IJIRSET.2015.0404072 2204
Fig 5: Chadha Plot for groundwater of the study area
Table 5: Irrigation Indices
V. CONCLUSIONS
Interpretation of hydrochemical analysis in this study revealed that the groundwater in study area is low mineralized
with majority of groundwater samples in fresh hardness class (43.33%), hard ((16.67%) and very hard (40%) class. The
sequence of the abundance of the major ions is in the following order: K+
> Ca2+
>Na > Mg2+
and Cl-> HCO3
-> SO4
2->
NO3-. The alkalis are more than alkali earths metals with strong acids dominating the weak acids. Low trace elements
and NO3- concentrations signified low level of anthropogenic contamination of the groundwater. Virtually, all water
samples fell in the rock dominance area in Gibbs plot indicated that the groundwater has modified its chemistry from
the weathered materials derived from the underlying bedrocks. Furthermore, the dominant hydrochemical facies of the
groundwater were Ca-Mg- Cl-SO4 and Na-K-Cl-SO4.
Irrigation quality assessement employing SAR, KR and RSBC indices revealed that the groundwater in the study area
is good and suitable for irrigation on all agricultural soils. However, assessment of irrigation quality employing MAR
indicated that only 63% of the groundwater samples were suitable for irrigation. No significant difference in ionic
concentrations of groundwater samples from the mining pits/vicinity and samples from the other parts of the studyv
area. This study has revealed that the artisanal and small-scale mining activities in Ijero-Ekiti have not influenced the
chemistry of groundwater in the area. The groundwater in the area was low mineralized, chemically potable and good
for irrigation purpose.
-100 -75 -50 -25 0 25 50 75
-100
-75
-50
-25
0
25
50
75
Base Exchange
Mixing/Dilution
8
2
4
6
1
537
%m
eq
/l (
HC
O3)
- (C
l+S
O4+
NO
3)
%meq/l (Ca+Mg) - (Na+K)
Indices Min. Max. Mean Median Std.dev.
KR 0.19 9.91 1.56 0.73 2.51
SAR 0.51 4.44 1.82 1.65 0.88
MAR 15.55 91.37 47.86 47.29 18.55
RSBC -6.77 0.43 -2.14 -1.39 2.35
ISSN(Online) : 2319 - 8753
ISSN (Print) : 2347 - 6710
International Journal of Innovative Research in Science,
Engineering and Technology
(An ISO 3297: 2007 Certified Organization)
Vol. 4, Issue 4, April 2015
Copyright to IJIRSET DOI: 10.15680/IJIRSET.2015.0404072 2205
Fig 6: USSL diagram for classification of groundwater quality in Ijero-Ekiti
REFERENCES
[1] Aigbedion, I. N., and Iyayi, S. E., Environmental effect of mineral exploitation in Nigeria. International Journal of Physical Sciences Vol. 2 (2), pp. 033-038, February, 2007.
[2] Aigbedion, I. N., Environmental Pollution in the Niger-Delta, Nigeria. Inter-Discplinary J. Enugu-Nigeria: 3(4): 205–210, 2005.
[3] Adekoya, J. A., E nvironmental Effects of Solid Minerals Mining, Journal of Physical Science, pp. 625-640, 2003. [4] Malomo, S., Framework for and opportunities for sustainable private sector participation in solid minerals development in Ekiti state, Lecture
delivered at Ekiti State Economic Development Summit, pp58, 2011.
[5] Kashim, I. B., Solid mineral resource development in sustaining Nigeria’s economic and environmental realities of the 21st century. Journal of Sustainable Development in Africa. Volume 13, No.2, pp 210 – 224, 2011.
[6] Bako,. B., Ibrahim, U. N., Umar, J. B., and Zamo, A. B., Microbial Isolates in Puerperal Sepsis and their in vitro Antibiotic Sensitivity in North
Eastern Nigeria. J Women’s Health Care 2012 1: 107 doi: 10.4172/2167-0420.1000107 [7] Elueze, A. A., Compositional appraisal and petrotectonic significance of the Imelu banded ferruginous rock in the Ilesha schist belt, southwestern
Nigeria, Journal of Mining Geology, 36 (1) pp.8-18, 2000.
[8] APHA, AWWA & WEF., Standard methods for the estimation of water and waste water. American Public Health Association, Washington, 1998. [9]Atteia, O., Chemistry and pollution of underground waters. Tec and Do Ed., Lavoisier. p. 398, 2005.
[10] Okunlola, O. A., and Akinola, O.O., Petrochemical characteristics of the Precambrian rare metal pegmatite of Oke Asa area, southwestern
Nigeria: implication for Ta-Nb mineralization RMZ Materials and Geoenvironment, vol. 57(4): 525-538, 2010. [11] Rodier, J., Bazin, C., Broutin, J. P., Chambon, P., Champsaur, H., Rodi, L., Water analysis: natural waters, residual waters, sea waters. 8th
edition Dunod, Paris, p.1383, 2005.
[12] Piper, A. M., A graphic procedure in the chemical interpretation of water analysis. US Geological Survey Groundwater Note 12, 1953 [13] Schoeller, H., Geochemistry of groundwater. An international guide for research and practice. UNESCO, chap 15, pp 1–18, 1967
[14] Gibbs, R. J., Mechanisms controlling world water chemistry. Science 17: 1088-1090, 1970.
[15] Chadha, D. K., A proposed new diagram for geochemical classification of natural waters and interpretation of chemical data. Hydrogeology Journal (5), 431-439, 1999.
[16] Richards, L. A., Diagnosis and improvement of Saline and Alkali Soils. Agricultural Handbook 60, USDA and IBH Publishing Co. Ltd. New
Delhi, India: pp 98-99, 1954 [17] Gupta, S. K., and Gupta, I. C., Management of Saline Soil and Water. Oxford and IBHPublication. Co. New Delhi, India, pp. 399, 1987.
[18] Raghunath, I. I. M., Groundwater. Second edition; Wiley Eastern L td, New Delhi, India, 1987.
[19] Kelly, W. P., Use of Saline Irrigation Water. Soil Sci. Vol. 95(4):pp. 355-391, 1963.
100 1000
0
5
10
15
20
25
30
0
5
10
15
20
25
30
V.H
igh
yH
igh
Med
ium
Lo
w
V. HighyHighMediumLow
C4C3C2C1
S4
S3
S2
S1
SA
R
Electrical Conductivity (uS/cm)
ISSN(Online) : 2319 - 8753
ISSN (Print) : 2347 - 6710
International Journal of Innovative Research in Science,
Engineering and Technology
(An ISO 3297: 2007 Certified Organization)
Vol. 4, Issue 4, April 2015
Copyright to IJIRSET DOI: 10.15680/IJIRSET.2015.0404072 2206
[20] WHO Guidelines for drinking water quality (3rd ed.).Geneva, pp 540, 2008.
[21] Taylor, F. B., Eagen, J. H.., Smith, H. F.D.., Jr.., and Coene, R. F., The case for water-borne infectious hepatitis. Am. J. Public Health, 56: 2093,
1966. [22] Bilgehan, N., and, Ali., B., Groundwater quality mapping in urban groundwater using GIS, Environ.moni. Assessment.160:215–227, 2010.
[23] Langenegger, O., Ground water quality in rural areas of western Africa, UNDP project INT/81/026:10, 1990.
[24] Caroll, D., Rainwater as a chemical agent of geological processes are view. USGS water supply. 1533:18–20, 1962. [25] Freeze R. A., and Cherry J. A., Groundwater, Prentice-Hall Inc. Englewood Cliffs, N.J. 1979.
[26] Sawyer G. N., McCarthy D. L., Chemistry of sanitary Engineers, 2nd ed, McGraw Hill, New York, p-518, 1967
[27] Schroeder. H. A., Relations between hardness of water and death rates from certain chronic and degenerative diseases in the United States, J. Chron disease, 12:586-591, 1960
[28] Adeyemi, G. O., Adesile, A. O., and Obayomi, O. M.., Chemical characteristics of some well waters in Ikire, Southwestern Nigeria.Water Resources Journal of the Nigerian Association of Hydrogeologists (NAH) Vol. 14, pp.12-18, 2003.
[29] Durbude, D. G., Varadrajan, N, and Purandara, B. K., Mapping of groundwater quality parameters in GIS environment. Proceedings of
international conference on hydrology and watershed management: with a focal theme on water quality and conservation for sustainable development, Hyderabad, A.P, India, 1, 568-577, 2002.
[30] Mandel, S., and Shiftan, Z. I.., Groundwater Resources Investigation and Development,Academic Press, Inc, 1991.
[31] Raihan, F., and Alam, J. B., Assessment of groundwater quality in Sunamganj of Banglidesh. Iran J. Environ. Health. Sci. Eng. Vol.5 (3), pp. 155- 156, 2008.
[32] Joshi, D. M., Kumar, A., and Agrawal, N., Assessment of the irrigation water quality of River Ganga in Haridwar District India. J. Chem., 2(2):
285-292, 2009. [33] Paliwal, K.V., Irrigation with saline water, Monogram no. 2 (New series). New Delhi, IAR1, p198, 1972.
[34] Eaton, F. M., Significance of carbonate in Irrigation waters. Soil Sci., 67(3): 128-133, 1950.
[35] Wilcox, L.V., Classification and Use of Irrigation Waters. Department of Agriculture, United States, Circular No. 696, Washington D.C., pp: 16, 1950.