6 Genetic Diversity – Understanding Conservation at Genetic Levels
BioOne sees sustainable scholarly publishing as an inherently collaborative enterprise connecting authors, nonprofit publishers, academic institutions, researchlibraries, and research funders in the common goal of maximizing access to critical research.
Assessment of Genetic Diversity in Wild and Aquaculture Stocks of Mercenariamercenaria in FloridaAuthor(s): John S. Hargrove, Leslie Sturmer, John Scarpa and James D. AustinSource: Journal of Shellfish Research, 34(2):355-365.Published By: National Shellfisheries AssociationDOI: http://dx.doi.org/10.2983/035.034.0218URL: http://www.bioone.org/doi/full/10.2983/035.034.0218
BioOne (www.bioone.org) is a nonprofit, online aggregation of core research in the biological, ecological, andenvironmental sciences. BioOne provides a sustainable online platform for over 170 journals and books publishedby nonprofit societies, associations, museums, institutions, and presses.
Your use of this PDF, the BioOne Web site, and all posted and associated content indicates your acceptance ofBioOne’s Terms of Use, available at www.bioone.org/page/terms_of_use.
Usage of BioOne content is strictly limited to personal, educational, and non-commercial use. Commercial inquiriesor rights and permissions requests should be directed to the individual publisher as copyright holder.
ASSESSMENT OF GENETIC DIVERSITY IN WILD AND AQUACULTURE STOCKS OF
MERCENARIA MERCENARIA IN FLORIDA
JOHN S. HARGROVE,1 LESLIE STURMER,2 JOHN SCARPA3† AND JAMES D. AUSTIN1,4*1Department of Wildlife Ecology and Conservation, Institute of Food and Agricultural Sciences,University of Florida, P.O. Box 110430, Gainesville, FL 32611; 2Shellfish Aquaculture ExtensionProgram, IFAS Extension, Cedar Key Field Lab, University of Florida, P.O. Box 89, Cedar Key, FL32625; 3Aquaculture and Stock Enhancement Program, Harbor Branch Oceanographic Institute atFlorida Atlantic University, 5600 U.S. 1 North, Fort Pierce, FL 34946; 4Program in Fisheries and AquaticSciences, School of Forest Resources and Conservation, Institute of Food and Agricultural Sciences,University of Florida, 7922 NW 71st Street, Gainesville, FL 32653
ABSTRACT The northern hard clam Mercenaria mercenaria is one of the most commercially important bivalve species
produced via aquaculture in the eastern United States. Breeding practices associated with large-scale hatchery production of hard
clam seedmay result in unintended, potentially negative consequences including inbreeding and reduced levels of genetic diversity.
Seven microsatellite markers were used to compare levels of genetic diversity in six hatchery stocks and four wild stocks from the
state of Florida. Wild stocks of M. mercenaria had slightly higher levels of allelic richness and similar observed heterozygosity
(wild¼Ar¼ 3.61,Ho¼ 0.448; hatchery¼Ar¼ 3.46,Ho¼ 0.452); however, these differences were not statistically significant (Ar:P¼0.145; Ho: P ¼ 0.931). Differentiation was highest between hatchery stocks (GST ¼ 0.03, SD ¼ 0.007; P < 0.001) but minimal
among hatchery-by-wild comparisons. In contrast, wild stocks were not differentiated (GST ¼ –0.002, SD¼ 0.004; P� 0.58) and
Bayesian comparisons of competing gene flow models (panmixia, stepping stone, and full-migration) suggested that wild stocks
were effectively panmictic at this scale. Together, these results indicate that some genetic drift has occurred within hatchery
populations, possibly as a result of broodstock selection and spawning practices. The genetic divergence between wild and
hatchery stocks observed in this study are not as pronounced as seen in other aquaculture bivalve species. Given the large scale of
hard clam production in Florida we argue that hatchery practices should incorporate long-term genetic goals (i.e., avoidance of
inbreeding) to maintain the integrity of hatchery stocks. A secondary objective of this study was to amplify a congeneric species,
Mercenaria campechiensis, using the same suite of microsatellite markers to assess their utility for detecting interspecific
hybridization. Amplification success was poor and failed for four of the seven loci. The identification of microsatellite loci for
different species of Mercenaria should be identified de novo in the future.
KEY WORDS: Mercenaria mercenaria, aquaculture, population genetics, microsatellites, panmixia, clam, northern quahog
INTRODUCTION
The hard clam Mercenaria mercenaria (Linnaeus, 1758), isa marine bivalve native to the eastern seaboard of the United
States in coastal waters from the Gulf of St. Lawrence toFlorida (Harte 2001). Populations of M. mercenaria have beencommercially exploited for over 100 y (MacKenzie et al. 2001);declines in harvests and fluctuations in abundance, however,
prompted the development of aquaculture technology to pro-cure seed for large-scale clam production (Arnold et al. 2009).Propagation ofM.mercenaria has increased substantially in the
last 35 y (Castagna 2001) in part due to advances in culturetechniques made during the 1950s (Manzi & Castagna 1989).Most notably, the state of Florida has seen dramatic increases
inM. mercenaria production, which has largely been attributedto job retraining programs for underemployed fishermen, increasedavailability of aquaculture leases, and refined production
techniques (Colson & Sturmer 2000).The commercial hard clam industry in Florida is comprised
of more than 300 shellfish growers who farm submerged landleases totaling over 2,100 acres (Adams & Sturmer 2012).
Hatchery production of Mercenaria mercenaria is typicallyaccomplished via a five-stage process including broodstock
selection and maintenance, spawning, larval culture, postsetculture, and nursery culture in raceways or upwellers (Hadley &
Whetstone 2007). Because the production of wild seed variesannually as a function of environmental conditions, clam aqua-culture is almost entirely dependent upon hatcheries for seed (FAO
2013). Given the reliance on hatcheries for the mass production ofoffspring, resource managers would benefit from considering thegenetic consequences of current breeding practices. For example,
large-scale seed production accomplished using small numbersof broodstock may result in a significant reduction in geneticdiversity and an increased likelihood of inbreeding relative to
wild populations (Lutz 2001). Such outcomes may have poten-tial negative consequences for survival and growth. The appli-cation of genetic techniques to inform aquaculture productionhas resulted in increased yields (Langdon et al. 2003), disease
resistance (Ford & Haskin 1987), and growth rates in a varietyof shellfish species through selective breeding practices (see Guo2009 for review). Baseline information on hatchery stock
diversity remains an important goal in aquaculture given thepotential consequences, both positive and negative, associatedwith broodstock selection and management techniques.
Culture ofMercenaria mercenaria in Florida occurs primar-ily in the Gulf of Mexico, where the natural occurrence of thisspecies is controversial. Palmer (1927) listed the species distri-
bution as occurring in waters along the Texas coast; Harte(2001), however, contends that these were mostly likely mis-taken identifications. Sources of M. mercenaria introductions
*Corresponding author. E-mail: [email protected]
†Current address: College of Science and Engineering, Texas A&M
University, 6300 Ocean Drive, Corpus Christi, TX 78412
DOI: 10.2983/035.034.0218
Journal of Shellfish Research, Vol. 34, No. 2, 355–365, 2015.
355
into the Gulf of Mexico may be derived from either experimentalplantings to assess the suitability for potential aquaculture circa
1960 (Woodburn 1961) or as a result of contemporary aquacul-ture escape (Arnold et al. 2004). It is difficult to distinguishM.mercenariamorphologically from the closely relatedMercenariacampechiensis (Gmelin, 1791), which does occur naturally in the
Gulf of Mexico, and the two species hybridize naturally inFlorida (Bert & Arnold 1995, Arnold et al. 1996, Arnold et al.2004). Given the magnitude of the hard clam industry (upward
of 184 million hard clams were produced in 2007; Adams et al.2009), examination of genetic consequences (reduced geneticdiversity, inbreeding) associated with present culture techniques
warrant consideration.The objective of this study was to compare levels of neutral
genetic variation within and among hatchery stocks relative towild populations. We hypothesized that hatchery-produced
hard clams would show evidence of reduced allelic diversityand lower levels of heterozygosity relative to wild conspecificsas a result of breeding techniques that use limited numbers of
broodstock. Genetic differentiation of wild and hatchery stockswas quantified to understand the extent to which isolation hasimpacted allele frequencies in hatchery populations. We evalu-
ated competing models of gene flow among wild stocks to test ifdifferences between hatchery and wild stocks were the product ofgene flow, genetic drift, or a combination of the two. Lastly, we
amplified the same suite of microsatellite markers on a closelyrelated species,Mercenaria campechiensis, to assess their efficacyfor the detection of interspecific hybridization.
MATERIALS AND METHODS
Individuals of Mercenaria mercenaria were collected from
four Atlantic coastal Florida locations (north to south): St.Augustine, St. Johns County, n ¼ 53 (N 29.728275,W 81.251642); Mosquito Lagoon, Volusia County, n ¼ 13
(N 28.922448, W 80.842134); Mosquito Lagoon, Brevard County,n¼ 22 (N 28.723907,W 80.713320); and Indian River Lagoon, St.Lucie County, n¼ 8 (N 27.543921,W 80.338136) (Fig. 1). Samplesof hatchery stocks were collected from four hatcheries operating
along the Atlantic coast and two operating in the Gulf of Mexico.Sample sizes ranged from 15 to 36 individuals per hatchery stock.Samples (n¼ 48) ofMercenaria campechiensiswere collected from
one population sampled at Bradenton Beach, Manatee County,FL (N 27.44832, W 82.68879, Fig. 1).
DNA was extracted from adductor muscles (;3 mm3 tissue
per sample) using the plate extraction protocol described byIvanova et al. (2006). DNA was quantified using a Nanodropspectrophotometer (Thermo Scientific, Wilmington, DE) and
standardized at 20 ng/mL prior to PCR amplification. Sevenmicrosatellite loci (Wang et al. 2010) were amplified in 15 mLsimplex reactions containing 20 ng template DNA, 7.5 mLQiagen Multiplex PCR Master Mix (Qiagen, Valencia, CA),
5.9mLddH20, 0.02mMforward primer, 0.2mMreverse primer, and0.2mMdye primer.ACAC-sequence tagwas added to the 5# end ofall forward primers (5#-CACGACGTTGTAAAACGAC-3#). Athird dye-primer was used in each PCR reaction that containedthe same CAC-sequence and one of two 5#-fluorescent dyes[6-carboxyfluorescein (FAM) or hexachlorofluorescein (HEX)].
Thermal cycling conditions were: 95�C for 15 min, followed by35 cycles of 94�C for 30 sec, 58�C for 1min 30 sec, 72�C for 1 min30 sec, followed by a 10min extension at 72�C.Electrophoresis of
PCR products was performed using an ABI 3130xl (AppliedBiosystems, Foster City, CA) with a ROX 500 size standard
(Applied Biosystems, Foster City, CA). Multiple PCR productsfrom the same individual were combined before electrophoresisfor select primer pairs (combo one: RUMM 34, RUMM 32;combo two: RUMM 21, RUMM 47, and RUMM 18). For the
remaining primer pairs (RUMM17, RUMM20) PCR productswere electrophoresed individually. PCR products for markerRUMM 17 were diluted (1 mL PCR product: 30 mL double-
distilled water) to facilitate microsatellite scoring (i.e., reducingexcess stutter). For combo one, PCR product generated for lociRUMM 34 and RUMM 32 were mixed at a ratio of 2:1 to
generate peaks of equal intensity. Microsatellites used incombos were identified based on the known characteristics ofindividual microsatellite regions (i.e., size range, repeat motif)(Wang et al. 2010).
Allele calls were automatically scored using GeneMarker soft-ware (SoftGenetics, State College, PA) and manually confirmed.The number of alleles per locus, observed (Ho) and expected
heterozygosities (He), and allelic richness (Ar) were calculated inGenalex 6.5 (Peakall & Smouse 2012). Deviation from Hardy–Weinberg Equilibrium (HWE) and linkage equilibrium were
tested using GENEPOP (Rousset 2008) with the followingparameters: dememorization ¼ 5,000, batches ¼ 5,000, itera-tions per batch ¼ 1,000. The frequency of null alleles was
estimated using the individual breeding model (10,000 itera-tions) implemented in INEst v 1.0 (Chybicki & Burczyk 2009)that accounts for background levels of inbreeding. SequentialBonferroni corrections were performed for multiple compari-
son tests (Rice 1989).Global genetic differentiation among wild and hatchery
stocks was estimated by computing the fixation index GST
(Nei 1987), the standardized fixation index G#ST (Hedrick2005), and Jost�s (2008) differentiation (D) that is independentof the amount of within-population diversity. Multiple metrics
of genetic differentiation were included to account for thepotential influences of mutation rates and initial heterozygositythat may bias individual measures (Leng & Zhang 2011). A lackof discrepancy among metrics was interpreted as meaning
potential biases were minimal. We used 10,000 permutationsto estimate the proportion of simulated data sets that wouldhave lower differentiation under a truly randommating scenario.
We estimated pairwise FST (Weir & Cockerham 1993, Slatkin1995) and 10,000 permutations were used to test for significantdifferences.We applied hierarchical analysis ofmolecular variance
(AMOVA) to examine the apportionment of genetic variancebetween sources (wild versus hatchery), among stocks (hatcheries1, 2, etc.) within sources, and among individuals within individual
stocks. We assumed an infinite allele model and used 10,000permutations to test for significance of the variance partitions. Alldifferentiation and AMOVA calculations were performed usingGENODIVE v2.0 (Meirmans & Van Tienderen 2004). Inbreeding
(FIS) was estimated using SPAGEDI (Hardy&Vekemans 2002) afterWeir and Cockerham (1984). Group average estimates of allelicrichness, heterozygosity, and inbreeding were compared between
wild and hatchery groups using FSTAT (Goudet 2001). Tests forsignificance were based on two-sided tests estimated using 1,000permutations.
The programSTRUCTUREv2.3 (Pritchard et al. 2000, Falushet al. 2003) was used to examine K, the number of geneticallydifferentiated clusters. We included sample identification in
HARGROVE ET AL.356
advance to help inform the search for the ‘‘true’’K in case the datawere weakly informative (Hubisz et al. 2009). We used the
admixture model with correlated allele frequencies between popula-tions. Likelihoods [LnP (K)] were examined for a range of potentialpopulation numbers (K ¼ 1–15) and each population scenario wasperformed 10 times.MCMC consisted of 103105 burn-in iterations
followed by 2.03 106 iterations. Results from STRUCTURE runswere evaluated using STRUCTUREHARVESTER version0.6.8 (http://taylor0.biology.ucla.edu/struct_harvest/) to facili-
tate the interpretation and detection of genetic clusters. Specif-ically, results were examined for: (1) an asymptote point at whichthe increase of likelihood values begins to plateau, or decrease;
(2) K values at or near the asymptote having low variance acrossreplicate runs; and (3) corresponding large K values (e.g., >100)(Earl & von Holdt 2012).
To examine alternative models of genetic population structureamong wild stocks, we used the Bayesian coalescent framework
implemented inMIGRATE3.6.4 (Beerli &Felsenstein 2001, Beerli2006). MIGRATE uses thermodynamic integration to calculatethemarginal likelihoodofa specifiedpopulationmodel, a techniqueshown to outperform Markov chain Monte Carlo and harmonic
mean estimators of model fit (Beerli & Palczewski 2010). Threecompeting models were examined: (1) a full migration modelwhere each wild population represents a distinct stock having
potentially different sizes (q) that exchange migrants at unequalrates; (2) a stepping stonemodel wheremigration occurs betweenadjacent stocks (potentially at unequal rates); and (3) a model of
panmixia assuming the sampled stocks represent a single effectivelyrandom mating population. For the MIGRATE runs, the IndianRiver Lagoon samples were excluded due to low sample size.
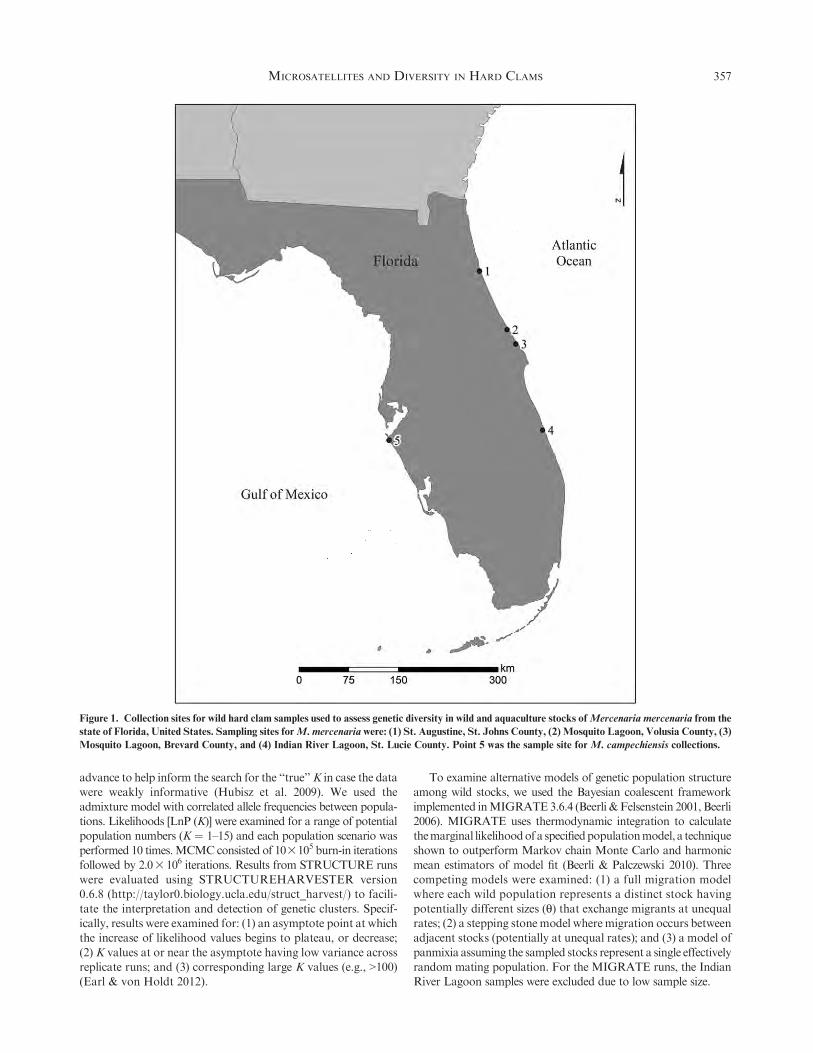
Figure 1. Collection sites for wild hard clam samples used to assess genetic diversity in wild and aquaculture stocks ofMercenaria mercenaria from the
state of Florida, United States. Sampling sites forM. mercenaria were: (1) St. Augustine, St. Johns County, (2) Mosquito Lagoon, Volusia County, (3)
Mosquito Lagoon, Brevard County, and (4) Indian River Lagoon, St. Lucie County. Point 5 was the sample site for M. campechiensis collections.
MICROSATELLITES AND DIVERSITY IN HARD CLAMS 357
Within the program MIGRATE, a preliminary model wasrun to determine the appropriate run length and suitable priors
for subsequent analyses (i.e., full, stepping stone, and panmixiamodels). Three identical, independent runs were generated foreach model and the results from each model were combined.Final individual run parameters were under default conditions
with the following exceptions: Brownian motion mutationmodel for microsatellite data; uniform theta (scaled populationsize) priors (min. ¼ 0, max. ¼ 10,000, delta ¼ 2,000); increment
between sampled genealogies (100); recorded samples per run(150,000); initial discarded samples per replicate (burn-in)(100,000). We ran six static heated chains (temperatures: 1,
4.19, 10.58, 23.35, 48.90, and 100). Natural log Bayes factors(LBF) were calculated as ln[mL(model1)] – ln[mL(model2)].Model probabilities were generated by subtracting the highestmarginal likelihood from each of the alternative models, taking
the exponent of each pairwise difference, summing these values,and using them as the denominator. Each exponentiated valuewas divided by the sum to estimate the probability of an
individual model (Beerli personal communication).
RESULTS
Overall, hatchery stocks exhibited a smaller range of observedheterozygosities (Ho range ¼ 0.392–0.536) relative to the wild
stocks (Ho range ¼ 0.379–0.527; Table 1). The number of allelesacross all loci was on average higher in wild stocks (meanNa ¼ 7.04) relative to hatchery stocks (mean Na ¼ 6.38). Allelicrichness (Ar) averaged across loci was 3.61 for wild stocks and
3.46 for hatchery stocks. The number of alleles per locus rangedfrom a minimum of two (loci: RUMM 20) to a maximum of 20(RUMM 18). We identified eight private alleles distributed
across the four wild populations, and five private alleles acrossthe six hatchery stocks (Table 1). Overall, locus-specific and multi-locus FIS estimates reflected high levels of inbreeding (Table 1).
Differences in Ar, Ho, He, and FIS between wild and hatcherygroups were not significant (Table 2).
Null alleleswere detected in bothwild andhatcheryMercenariamercenaria. Four loci in particular (RUMM 20, RUMM 21,
RUMM 32, and RUMM 34) displayed elevated levels acrossmultiple populations (Table 1). Of the wild populations, St. JohnsCounty population displayed evidence of null alleles at the greatest
number of loci (3) and St. LucieCounty samples had the fewest (1).Hatchery groups 5 and 6 had null alleles at multiple loci (4)whereas all other hatchery populations displayed evidence of null
alleles at either one or two loci. Null alleles in Mercenariacampechiensiswere estimated for the three loci with sufficient data(RUMM 32, RUMM 34, and RUMM 17), one of which
(RUMM 34) showed evidence for null alleles.Across all stocks, 18 of 70 tests for Hardy–Weinberg equilib-
rium deviated from expectation after sequential Bonferronicorrection (Table 1). Four loci had significant deviation from
HWE inmore than one population. Five of two hundred and tentests for linkage disequilibrium were significant after Bonferronicorrection (Hatchery group 2, RUMM 18–RUMM 34; group 4,
RUMM 18–RUMM 34, RUMM 32–RUMM 34, RUMM 32–RUMM 17; group 6; RUMM 18–RUMM 17).
Global genetic differentiation among wild and hatchery stocks
was low (GST¼ 0.022, SD¼ 0.003) even after correction for highlyvariable markers (G#ST ¼ 0.060, SD ¼ 0.019; D ¼ 0.039, SD ¼0.018). The permuted data sets were all smaller than observed test
statistics (all P < 0.001), suggesting that although we detectedlow allelic differentiation, the observed patterns across all
population samples were still greater than expected underrandom mating. When considered separately, wild sampleshad little differentiation (GST ¼ –0.008, SD ¼ 0.007; G#ST ¼0.019, SD ¼ 0.019; D ¼ 0.013, SD ¼ 0.014) and permuted data
sets were nonsignificant (for all results; 0.15 < P < 0.17).Hatchery stocks displayed overall differentiation similar tothe combined wild + hatchery data set (GST ¼ 0.030, SD ¼0.007; G#ST ¼ 0.070, SD ¼ 0.021; D ¼ 0.046, SD ¼ 0.019) andvalues were significantly larger than permuted data sets (all P¼0.001). Pairwise FST estimates were all nonsignificant between
wild stocks, whereas 23 pairwise FST values were significantlygreater than zero between hatchery andwild stocks and betweenhatchery stocks (Table 3). Differences in FIS between wild andhatchery groups were not significant (Table 2).
Levels of genetic differentiation tested by AMOVA wereprimarily explained by high levels of variation among individ-uals nested within stocks (Table 4). The variances among stocks
(e.g., hatcheries 1, 2, etc.) and the variances among sources (wildor hatchery) were low, with the highest variance at 4.5%.Overall, the variance partitions among individual and stock
were significant although variance partitioned among stockswas low. Population source (hatchery versus wild) predicted lessthan 1% of the observed variation.
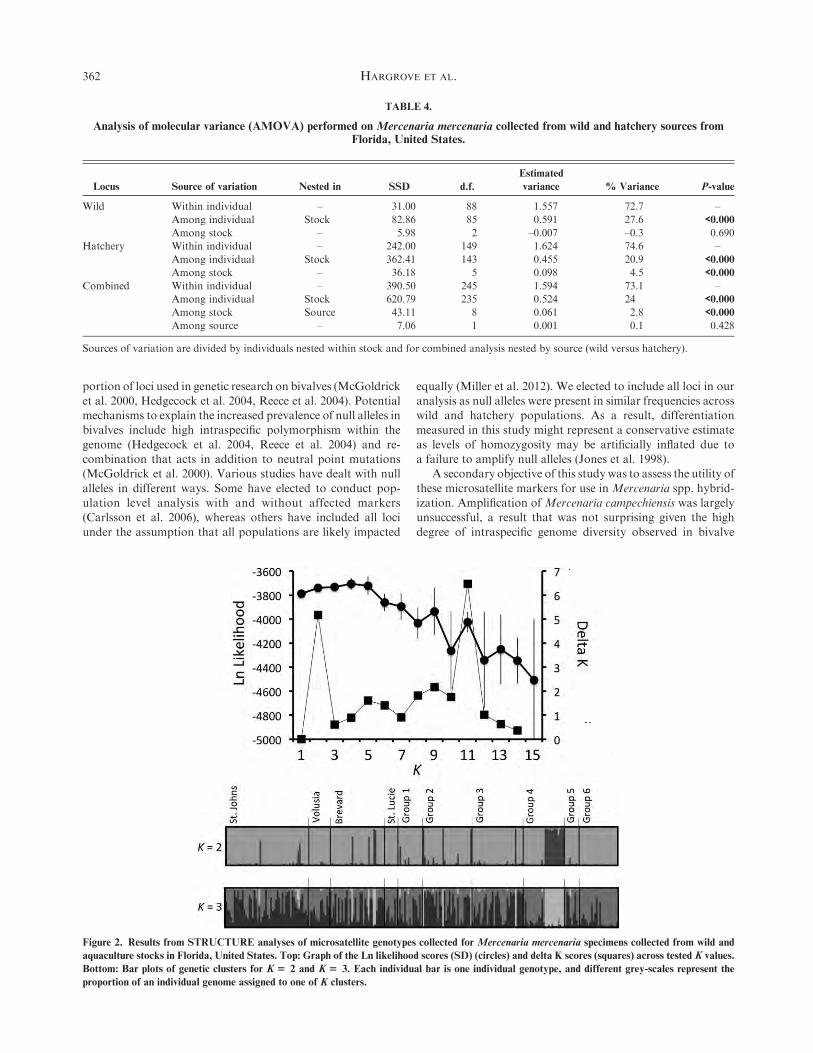
Bayesian estimates of genetic clustering based on likelihoodand deltaK scores revealed limited genetic distinction. ForK¼ 1to K ¼ 3, low variance across replicate analyses was observed,making the choice of best model ambiguous. Variance increased
considerably, and likelihood scores decreased beginning atK¼ 4(Fig. 2). Delta K values were greatest at K ¼ 2 and K ¼ 11; thesevalues were, however, low (both <10), limiting their utility as an
estimator of ad hoc support. Given the low likelihood and largevariance, it is unlikely that K ¼ 11 is a good estimate of thenumber of genetic groups. Graphs showing individuals atK¼ 2
and K ¼ 3 are shown in Figure 2. In both cases there is littlestructure distinguishing wild from hatchery groups, with theexception of hatchery group 4, which seems to consist of twodistinct genetic groups.
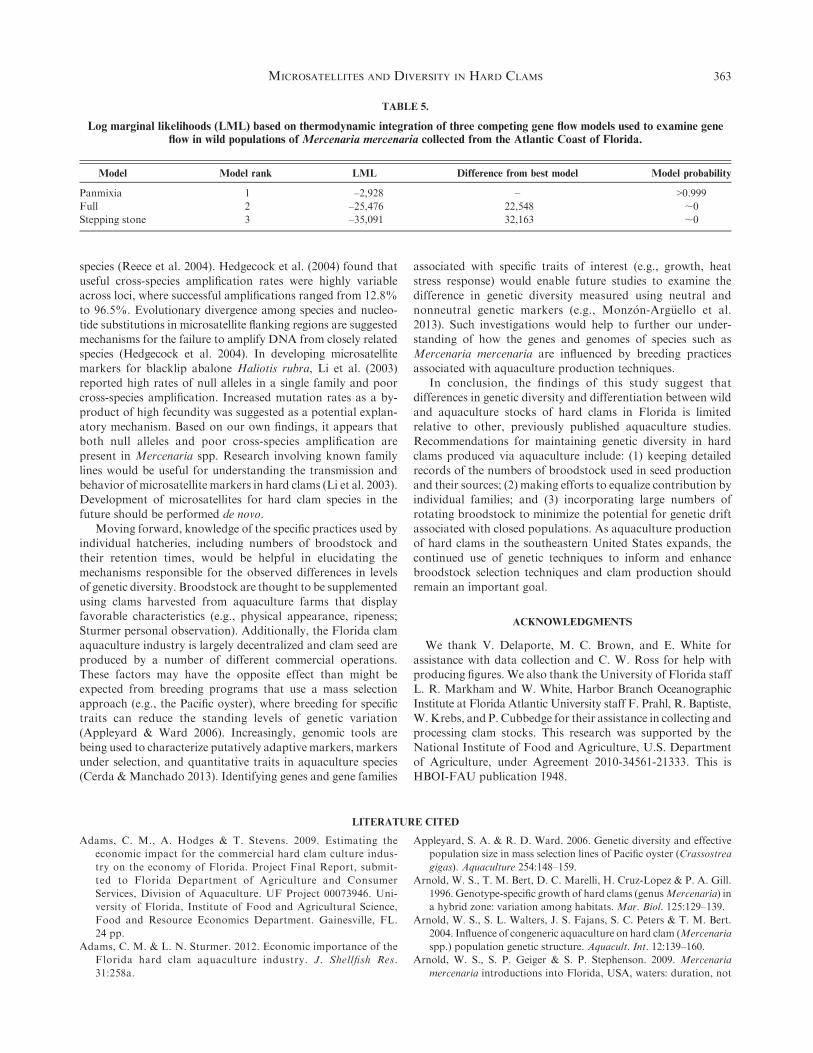
Results from thermodynamic integration of the competinggene flowmodels (full, stepping stone, and panmixia) applied tothe three largest wild stocks showed that panmixia had the
highest marginal likelihood (–2,928) (Table 5). The likelihoodassociated with the panmixia model far exceeded the fullmigration (–25,746) and stepping stone models (–35,091). An
LBF of 22,548 was observed based on the likelihoods ofpanmixia and full migration, which is very strong preferencefor the panmixia model (Kass and Raftery 1995). The corre-
sponding model probability for panmixia was ;1.0. A charac-teristic of the full model was the similar rates per generationof mutation-scaled allelic migration (M) among locations(mean ¼ 168.27, SD ¼ 7.50). Additionally, a very large theta
was observed (mutation-scaled effective population size) for theintermediate location (Brevard; q¼ 2083.5, 95%CI¼ 0–3393.3)relative to the northern (q ¼ 24.7, 95% CI ¼ 0–166.7) and
southern populations (q ¼ 22.4, 95% CI ¼ 0–160.0). Thepanmixia model had a q ¼ 100.93 (95% CI ¼ 33.4–266.7).
For Mercenaria campechiensis, three of seven loci amplified
at greater than 50% of the available samples (Table 1). PCRsuccess rates based on aminimum of two amplification attemptsper sample were: RUMM 17%–88%, RUMM 32%–85%,
HARGROVE ET AL.358
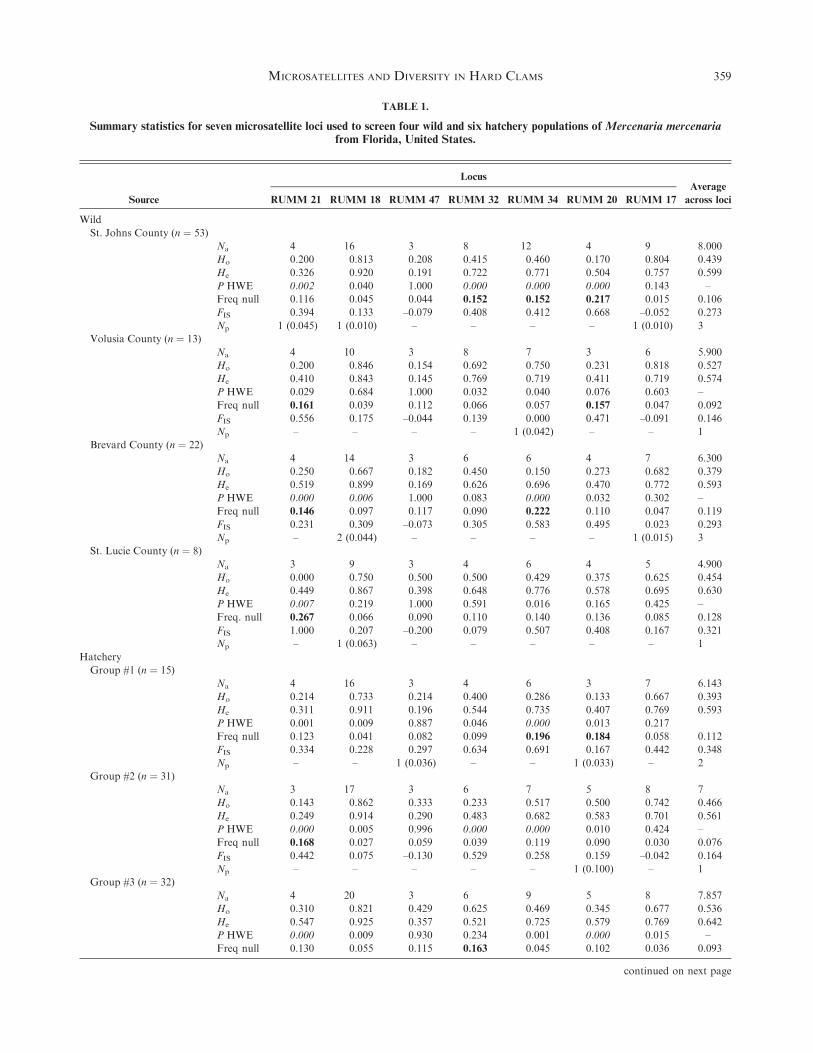
TABLE 1.
Summary statistics for seven microsatellite loci used to screen four wild and six hatchery populations of Mercenaria mercenariafrom Florida, United States.
Source
Locus
RUMM 21 RUMM 18 RUMM 47 RUMM 32 RUMM 34 RUMM 20 RUMM 17
Average
across loci
Wild
St. Johns County (n ¼ 53)
Na 4 16 3 8 12 4 9 8.000
Ho 0.200 0.813 0.208 0.415 0.460 0.170 0.804 0.439
He 0.326 0.920 0.191 0.722 0.771 0.504 0.757 0.599
P HWE 0.002 0.040 1.000 0.000 0.000 0.000 0.143 –
Freq null 0.116 0.045 0.044 0.152 0.152 0.217 0.015 0.106
FIS 0.394 0.133 –0.079 0.408 0.412 0.668 –0.052 0.273
Np 1 (0.045) 1 (0.010) – – – – 1 (0.010) 3
Volusia County (n ¼ 13)
Na 4 10 3 8 7 3 6 5.900
Ho 0.200 0.846 0.154 0.692 0.750 0.231 0.818 0.527
He 0.410 0.843 0.145 0.769 0.719 0.411 0.719 0.574
P HWE 0.029 0.684 1.000 0.032 0.040 0.076 0.603 –
Freq null 0.161 0.039 0.112 0.066 0.057 0.157 0.047 0.092
FIS 0.556 0.175 –0.044 0.139 0.000 0.471 –0.091 0.146
Np – – – – 1 (0.042) – – 1
Brevard County (n ¼ 22)
Na 4 14 3 6 6 4 7 6.300
Ho 0.250 0.667 0.182 0.450 0.150 0.273 0.682 0.379
He 0.519 0.899 0.169 0.626 0.696 0.470 0.772 0.593
P HWE 0.000 0.006 1.000 0.083 0.000 0.032 0.302 –
Freq null 0.146 0.097 0.117 0.090 0.222 0.110 0.047 0.119
FIS 0.231 0.309 –0.073 0.305 0.583 0.495 0.023 0.293
Np – 2 (0.044) – – – – 1 (0.015) 3
St. Lucie County (n ¼ 8)
Na 3 9 3 4 6 4 5 4.900
Ho 0.000 0.750 0.500 0.500 0.429 0.375 0.625 0.454
He 0.449 0.867 0.398 0.648 0.776 0.578 0.695 0.630
P HWE 0.007 0.219 1.000 0.591 0.016 0.165 0.425 –
Freq. null 0.267 0.066 0.090 0.110 0.140 0.136 0.085 0.128
FIS 1.000 0.207 –0.200 0.079 0.507 0.408 0.167 0.321
Np – 1 (0.063) – – – – – 1
Hatchery
Group #1 (n ¼ 15)
Na 4 16 3 4 6 3 7 6.143
Ho 0.214 0.733 0.214 0.400 0.286 0.133 0.667 0.393
He 0.311 0.911 0.196 0.544 0.735 0.407 0.769 0.593
P HWE 0.001 0.009 0.887 0.046 0.000 0.013 0.217
Freq null 0.123 0.041 0.082 0.099 0.196 0.184 0.058 0.112
FIS 0.334 0.228 0.297 0.634 0.691 0.167 0.442 0.348
Np – – 1 (0.036) – – 1 (0.033) – 2
Group #2 (n ¼ 31)
Na 3 17 3 6 7 5 8 7
Ho 0.143 0.862 0.333 0.233 0.517 0.500 0.742 0.466
He 0.249 0.914 0.290 0.483 0.682 0.583 0.701 0.561
P HWE 0.000 0.005 0.996 0.000 0.000 0.010 0.424 –
Freq null 0.168 0.027 0.059 0.039 0.119 0.090 0.030 0.076
FIS 0.442 0.075 –0.130 0.529 0.258 0.159 –0.042 0.164
Np – – – – – 1 (0.100) – 1
Group #3 (n ¼ 32)
Na 4 20 3 6 9 5 8 7.857
Ho 0.310 0.821 0.429 0.625 0.469 0.345 0.677 0.536
He 0.547 0.925 0.357 0.521 0.725 0.579 0.769 0.642
P HWE 0.000 0.009 0.930 0.234 0.001 0.000 0.015 –
Freq null 0.130 0.055 0.115 0.163 0.045 0.102 0.036 0.093
continued on next page
MICROSATELLITES AND DIVERSITY IN HARD CLAMS 359
RUMM 34%–73%, RUMM 47%–48%, RUMM 21%–10%,RUMM 18%–4%, and RUMM 20%–0%. For markers withconsistent amplification, the observed heterozygosity was 0.45,
expected heterozygosity was 0.70 (SE ¼ 0.03), the number ofalleles was eight (SE ¼ 0.00), and allelic richness was 2.25.
DISCUSSION
The aquaculture production of molluscs has expandedsignificantly in recent decades and now accounts for 24% of
the total aquaculture production worldwide (FAO 2012).Genetic resources represent an invaluable asset in the aquacul-ture production of molluscs as molecular techniques have been
successfully used to increasebothgrowthand survival (e.g., Langdonet al. 2003, Guo 2009). In this study, we examined if currentpropagation techniques for Mercenaria mercenaria were effective
at capturing levels of the genetic diversity similar to those observed inwild stocks. Overall, allelic richness and levels of heterozygosity weresimilar in wild stocks relative to hatchery-produced clams. Pairwise
differentiation was significant between many hatchery-by-hatch-ery, and some hatchery-by-wild comparisons, likely reflectinggenetic drift associated with broodstock selection and breeding
practices.The low levels of genetic differentiation between hatchery
and wild hard clams observed in this study may be explained by
the selection of genetically varied broodstock and the periodicsupplementation of broodstock. Hatchery populations foundedwith few individuals would be expected to show signs of reducedgenetic diversity and genetic drift after even a few generations of
isolation (Gosling 1982, Hedgecock & Sly 1990). If hard clamhatchery seed were used as broodstock each generation, andeach hatchery represented a closed population, we would expect
a greater extent of differentiation between hatchery and wildstocks than observed here (e.g., Li et al. 2003). As reported byWhetstone et al. (2005), Mercenaria mercenaria can live up to
30 y of age, and hatcheries included in this study have beenfunctional for approximately 15 y (Sturmer personal observa-tion). Assuming an annual production cycle, inbreeding levels
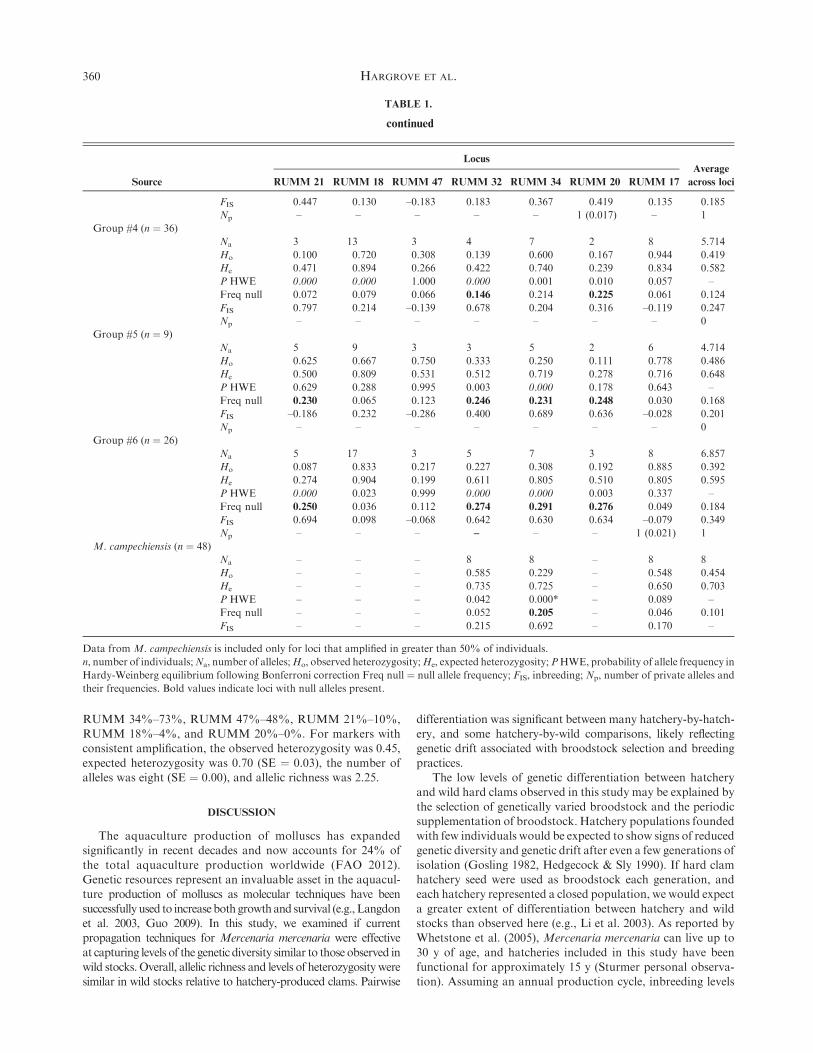
TABLE 1.
continued
Source
Locus
RUMM 21 RUMM 18 RUMM 47 RUMM 32 RUMM 34 RUMM 20 RUMM 17
Average
across loci
FIS 0.447 0.130 –0.183 0.183 0.367 0.419 0.135 0.185
Np – – – – – 1 (0.017) – 1
Group #4 (n ¼ 36)
Na 3 13 3 4 7 2 8 5.714
Ho 0.100 0.720 0.308 0.139 0.600 0.167 0.944 0.419
He 0.471 0.894 0.266 0.422 0.740 0.239 0.834 0.582
P HWE 0.000 0.000 1.000 0.000 0.001 0.010 0.057 –
Freq null 0.072 0.079 0.066 0.146 0.214 0.225 0.061 0.124
FIS 0.797 0.214 –0.139 0.678 0.204 0.316 –0.119 0.247
Np – – – – – – – 0
Group #5 (n ¼ 9)
Na 5 9 3 3 5 2 6 4.714
Ho 0.625 0.667 0.750 0.333 0.250 0.111 0.778 0.486
He 0.500 0.809 0.531 0.512 0.719 0.278 0.716 0.648
P HWE 0.629 0.288 0.995 0.003 0.000 0.178 0.643 –
Freq null 0.230 0.065 0.123 0.246 0.231 0.248 0.030 0.168
FIS –0.186 0.232 –0.286 0.400 0.689 0.636 –0.028 0.201
Np – – – – – – – 0
Group #6 (n ¼ 26)
Na 5 17 3 5 7 3 8 6.857
Ho 0.087 0.833 0.217 0.227 0.308 0.192 0.885 0.392
He 0.274 0.904 0.199 0.611 0.805 0.510 0.805 0.595
P HWE 0.000 0.023 0.999 0.000 0.000 0.003 0.337 –
Freq null 0.250 0.036 0.112 0.274 0.291 0.276 0.049 0.184
FIS 0.694 0.098 –0.068 0.642 0.630 0.634 –0.079 0.349
Np – – – – – – 1 (0.021) 1
M. campechiensis (n ¼ 48)
Na – – – 8 8 – 8 8
Ho – – – 0.585 0.229 – 0.548 0.454
He – – – 0.735 0.725 – 0.650 0.703
P HWE – – – 0.042 0.000* – 0.089 –
Freq null – – – 0.052 0.205 – 0.046 0.101
FIS – – – 0.215 0.692 – 0.170 –
Data from M. campechiensis is included only for loci that amplified in greater than 50% of individuals.
n, number of individuals;Na, number of alleles;Ho, observed heterozygosity;He, expected heterozygosity;PHWE, probability of allele frequency in
Hardy-Weinberg equilibrium following Bonferroni correction Freq null ¼ null allele frequency; FIS, inbreeding; Np, number of private alleles and
their frequencies. Bold values indicate loci with null alleles present.
HARGROVE ET AL.360
following 15 y of propagation would be sufficient for hatcherypopulations to display evidence of genetic drift associated with
decreased effective population size (Durand et al. 1993, Evanset al. 2004). The extent to which spawning practices varybetween hatcheries in Florida is not known, though consider-
able variation in techniques is present. Some hatcheries selectripe adults for use in seed production from the harvests ofcultured stocks. One hatchery maintains a large (;200) group
of adults, but also supplements broodstock from harvests. Theaddition of novel genetic material may serve to limit the extentof genetic differentiation between stocks (Waples 1998). Analternative explanation is that periodic supplementation from
wild stocks has occurred, although M. mercenaria wild stocksare rare, particularly along the Gulf of Mexico coast, andunlikely to be used by hatchery owners.
The loss of genetic diversity was not as pronounced as seen inother comparisons of wild and aquacultured bivalves. Geneticdifferences in microsatellite genotypes between cultured, native,
and naturalized populations of Pacific oystersCrassostrea gigasrevealed significantly lower levels of allelic richness (36.5%decrease) and expected heterozygosity (5.6% decrease) in
hatchery relative to wild populations (Miller et al. 2012).Genetic variation in cultured populations of Asian Suminoeoysters Crassostrea ariakensis was indicative of a genetic bot-tleneck, with a 6-fold increased extent of genetic differentiation
and a loss of allelic richness in excess of 60% among hatcherystocks (Xiao et al. 2011). Our results mirror that of Dillon and
Manzi (1987), who found allele frequencies were similar be-tween wild and hatchery stocks ofMercenaria mercenaria basedon allozyme data, although evidence for the loss of rare allelesand genetic drift was inferred for hatchery stocks. Given the
potential for negative consequences associated with losses ofgenetic diversity, hatchery stocks would benefit from maintain-ing large numbers of potential broodstock to increase effective
population size and minimize genetic drift.Regional panmixia among wild stocks of hard clams was
inferred based upon several lines of genetic evidence. First,
AMOVA tests of genetic differentiation amongwild stocks werenonsignificant. Second, there was a distinct lack of populationclustering associated with Bayesian analysis of individualgenotypes. And lastly, statistical support was strongest for
a panmictic model of gene flow. On the basis of its planktoniclarval stage,Mercenaria mercenaria was predicted to have littleor no genetic structuring at the scale examined here (Eversole
2001, Hellberg et al. 2002), and previous genetic work revealedlimited organellar genetic structuring range-wide (Baker et al.2008). As the southernmost population of wild hard clams was
omitted from model tests, our results suggest that individualsfrom Indian River Lagoon and St. Augustine are geneticallysimilar. This is not surprising given the close geographic
proximity of the wild populations and a lack of major bio-geographic barriers that would prevent gene flow. These resultsare conditional based on the limitations of sample sizes herein.The number of clams available fromwild and hatchery-produced
stocks was limited in some cases. For example, STRUCTUREmay be biased when samples sizes are small (e.g., Fogelqvist et al.2010) or unbalanced, as is the case here. Empirical data, however,
suggest that STRUCTURE is biased toward over splitting whensample sizes are unbalanced (Onogi et al. 2011). Thus, ourinference of a single genetic cluster is probably not overly
conservative given the other lines of evidence (e.g., independentestimates of effective population size and migration usingMIGRATE).
One important consideration for population genetic analysis
of bivalves is the presence of null alleles and their potential toconfound interpretation of differentiation metrics (Chapuis &Estoup 2006). Null alleles have been reported at a significant
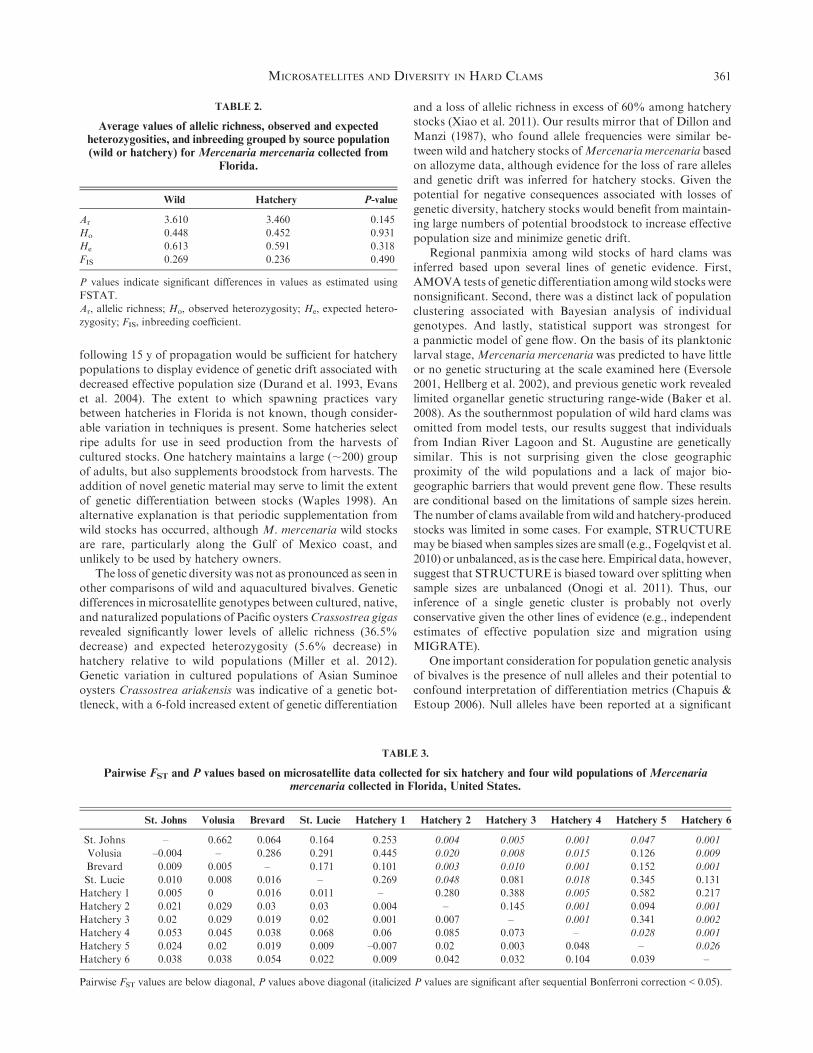
TABLE 3.
Pairwise FST and P values based on microsatellite data collected for six hatchery and four wild populations of Mercenariamercenaria collected in Florida, United States.
St. Johns Volusia Brevard St. Lucie Hatchery 1 Hatchery 2 Hatchery 3 Hatchery 4 Hatchery 5 Hatchery 6
St. Johns – 0.662 0.064 0.164 0.253 0.004 0.005 0.001 0.047 0.001
Volusia –0.004 – 0.286 0.291 0.445 0.020 0.008 0.015 0.126 0.009
Brevard 0.009 0.005 – 0.171 0.101 0.003 0.010 0.001 0.152 0.001
St. Lucie 0.010 0.008 0.016 – 0.269 0.048 0.081 0.018 0.345 0.131
Hatchery 1 0.005 0 0.016 0.011 – 0.280 0.388 0.005 0.582 0.217
Hatchery 2 0.021 0.029 0.03 0.03 0.004 – 0.145 0.001 0.094 0.001
Hatchery 3 0.02 0.029 0.019 0.02 0.001 0.007 – 0.001 0.341 0.002
Hatchery 4 0.053 0.045 0.038 0.068 0.06 0.085 0.073 – 0.028 0.001
Hatchery 5 0.024 0.02 0.019 0.009 –0.007 0.02 0.003 0.048 – 0.026
Hatchery 6 0.038 0.038 0.054 0.022 0.009 0.042 0.032 0.104 0.039 –
Pairwise FST values are below diagonal, P values above diagonal (italicized P values are significant after sequential Bonferroni correction < 0.05).
TABLE 2.
Average values of allelic richness, observed and expectedheterozygosities, and inbreeding grouped by source population
(wild or hatchery) for Mercenaria mercenaria collected from
Florida.
Wild Hatchery P-value
Ar 3.610 3.460 0.145
Ho 0.448 0.452 0.931
He 0.613 0.591 0.318
FIS 0.269 0.236 0.490
P values indicate significant differences in values as estimated using
FSTAT.
Ar, allelic richness; Ho, observed heterozygosity; He, expected hetero-
zygosity; FIS, inbreeding coefficient.
MICROSATELLITES AND DIVERSITY IN HARD CLAMS 361
portion of loci used in genetic research on bivalves (McGoldricket al. 2000, Hedgecock et al. 2004, Reece et al. 2004). Potentialmechanisms to explain the increased prevalence of null alleles inbivalves include high intraspecific polymorphism within the
genome (Hedgecock et al. 2004, Reece et al. 2004) and re-combination that acts in addition to neutral point mutations(McGoldrick et al. 2000). Various studies have dealt with null
alleles in different ways. Some have elected to conduct pop-ulation level analysis with and without affected markers(Carlsson et al. 2006), whereas others have included all loci
under the assumption that all populations are likely impacted
equally (Miller et al. 2012). We elected to include all loci in ouranalysis as null alleles were present in similar frequencies acrosswild and hatchery populations. As a result, differentiationmeasured in this study might represent a conservative estimate
as levels of homozygosity may be artificially inflated due toa failure to amplify null alleles (Jones et al. 1998).
A secondary objective of this study was to assess the utility of
these microsatellite markers for use in Mercenaria spp. hybrid-ization. Amplification of Mercenaria campechiensis was largelyunsuccessful, a result that was not surprising given the high
degree of intraspecific genome diversity observed in bivalve
Figure 2. Results from STRUCTURE analyses of microsatellite genotypes collected for Mercenaria mercenaria specimens collected from wild and
aquaculture stocks in Florida, United States. Top: Graph of the Ln likelihood scores (SD) (circles) and delta K scores (squares) across tested K values.
Bottom: Bar plots of genetic clusters for K$ 2 and K$ 3. Each individual bar is one individual genotype, and different grey-scales represent the
proportion of an individual genome assigned to one of K clusters.
TABLE 4.
Analysis of molecular variance (AMOVA) performed on Mercenaria mercenaria collected from wild and hatchery sources fromFlorida, United States.
Locus Source of variation Nested in SSD d.f.
Estimated
variance % Variance P-value
Wild Within individual – 31.00 88 1.557 72.7 –
Among individual Stock 82.86 85 0.591 27.6 <0.000Among stock – 5.98 2 –0.007 –0.3 0.690
Hatchery Within individual – 242.00 149 1.624 74.6 –
Among individual Stock 362.41 143 0.455 20.9 <0.000Among stock – 36.18 5 0.098 4.5 <0.000
Combined Within individual – 390.50 245 1.594 73.1 –
Among individual Stock 620.79 235 0.524 24 <0.000Among stock Source 43.11 8 0.061 2.8 <0.000Among source – 7.06 1 0.001 0.1 0.428
Sources of variation are divided by individuals nested within stock and for combined analysis nested by source (wild versus hatchery).
HARGROVE ET AL.362
species (Reece et al. 2004). Hedgecock et al. (2004) found thatuseful cross-species amplification rates were highly variableacross loci, where successful amplifications ranged from 12.8%to 96.5%. Evolutionary divergence among species and nucleo-
tide substitutions in microsatellite flanking regions are suggestedmechanisms for the failure to amplify DNA from closely relatedspecies (Hedgecock et al. 2004). In developing microsatellite
markers for blacklip abalone Haliotis rubra, Li et al. (2003)reported high rates of null alleles in a single family and poorcross-species amplification. Increased mutation rates as a by-
product of high fecundity was suggested as a potential explan-atory mechanism. Based on our own findings, it appears thatboth null alleles and poor cross-species amplification are
present in Mercenaria spp. Research involving known familylines would be useful for understanding the transmission andbehavior of microsatellite markers in hard clams (Li et al. 2003).Development of microsatellites for hard clam species in the
future should be performed de novo.Moving forward, knowledge of the specific practices used by
individual hatcheries, including numbers of broodstock and
their retention times, would be helpful in elucidating themechanisms responsible for the observed differences in levelsof genetic diversity. Broodstock are thought to be supplemented
using clams harvested from aquaculture farms that displayfavorable characteristics (e.g., physical appearance, ripeness;Sturmer personal observation). Additionally, the Florida clamaquaculture industry is largely decentralized and clam seed are
produced by a number of different commercial operations.These factors may have the opposite effect than might beexpected from breeding programs that use a mass selection
approach (e.g., the Pacific oyster), where breeding for specifictraits can reduce the standing levels of genetic variation(Appleyard & Ward 2006). Increasingly, genomic tools are
being used to characterize putatively adaptivemarkers, markersunder selection, and quantitative traits in aquaculture species(Cerda &Manchado 2013). Identifying genes and gene families
associated with specific traits of interest (e.g., growth, heatstress response) would enable future studies to examine thedifference in genetic diversity measured using neutral andnonneutral genetic markers (e.g., Monz�on-Arg€uello et al.
2013). Such investigations would help to further our under-standing of how the genes and genomes of species such asMercenaria mercenaria are influenced by breeding practices
associated with aquaculture production techniques.In conclusion, the findings of this study suggest that
differences in genetic diversity and differentiation between wild
and aquaculture stocks of hard clams in Florida is limitedrelative to other, previously published aquaculture studies.Recommendations for maintaining genetic diversity in hard
clams produced via aquaculture include: (1) keeping detailedrecords of the numbers of broodstock used in seed productionand their sources; (2) making efforts to equalize contribution byindividual families; and (3) incorporating large numbers of
rotating broodstock to minimize the potential for genetic driftassociated with closed populations. As aquaculture productionof hard clams in the southeastern United States expands, the
continued use of genetic techniques to inform and enhancebroodstock selection techniques and clam production shouldremain an important goal.
ACKNOWLEDGMENTS
We thank V. Delaporte, M. C. Brown, and E. White for
assistance with data collection and C. W. Ross for help withproducing figures. We also thank the University of Florida staffL. R. Markham and W. White, Harbor Branch Oceanographic
Institute at Florida Atlantic University staff F. Prahl, R. Baptiste,W.Krebs, and P. Cubbedge for their assistance in collecting andprocessing clam stocks. This research was supported by the
National Institute of Food and Agriculture, U.S. Departmentof Agriculture, under Agreement 2010-34561-21333. This isHBOI-FAU publication 1948.
LITERATURE CITED
Adams, C. M., A. Hodges & T. Stevens. 2009. Estimating the
economic impact for the commercial hard clam culture indus-
try on the economy of Florida. Project Final Report, submit-
ted to Florida Department of Agriculture and Consumer
Services, Division of Aquaculture. UF Project 00073946. Uni-
versity of Florida, Institute of Food and Agricultural Science,
Food and Resource Economics Department. Gainesville, FL.
24 pp.
Adams, C. M. & L. N. Sturmer. 2012. Economic importance of the
Florida hard clam aquaculture industry. J. Shellfish Res.
31:258a.
Appleyard, S. A. & R. D. Ward. 2006. Genetic diversity and effective
population size in mass selection lines of Pacific oyster (Crassostrea
gigas). Aquaculture 254:148–159.
Arnold, W. S., T. M. Bert, D. C. Marelli, H. Cruz-Lopez & P. A. Gill.
1996. Genotype-specific growth of hard clams (genusMercenaria) in
a hybrid zone: variation among habitats. Mar. Biol. 125:129–139.
Arnold, W. S., S. L. Walters, J. S. Fajans, S. C. Peters & T. M. Bert.
2004. Influence of congeneric aquaculture on hard clam (Mercenaria
spp.) population genetic structure. Aquacult. Int. 12:139–160.
Arnold, W. S., S. P. Geiger & S. P. Stephenson. 2009. Mercenaria
mercenaria introductions into Florida, USA, waters: duration, not
TABLE 5.
Log marginal likelihoods (LML) based on thermodynamic integration of three competing gene flow models used to examine geneflow in wild populations of Mercenaria mercenaria collected from the Atlantic Coast of Florida.
Model Model rank LML Difference from best model Model probability
Panmixia 1 –2,928 – >0.999
Full 2 –25,476 22,548 ;0
Stepping stone 3 –35,091 32,163 ;0
MICROSATELLITES AND DIVERSITY IN HARD CLAMS 363
size of introduction, influences genetic consequences. Aquat. Biol.
5:49–62.
Baker, P., J. D. Austin, B. W. Bowen & S. M. Baker. 2008. Range-wide
population structure and history of the northern quahog (Mercenaria
mercenaria) inferred from mitochondrial DNA sequence data. ICES
J. Mar. Sci. 65:155–163.
Beerli, P. & J. Felsenstein. 2001. Maximum likelihood estimation of
a migration matrix and effective population sizes in n subpopula-
tions by using a coalescent approach. Proc. Natl. Acad. Sci. U S A
98:4563–4568.
Beerli, P. 2006. Comparison of Bayesian and maximum likelihood
inference of population genetic parameters. Bioinformatics 22:341–
345.
Beerli, P. & M. Palczewski. 2010. Unified framework to evaluate
panmixia and migration direction among multiple sampling loca-
tions. Genetics 185:313–326.
Bert, T. M. & W. S. Arnold. 1995. An empirical test of predictions of
two competingmodels for the maintenance and fate of hybrid zones:
both models are supported in a hard clam hybrid zone. Evolution
49:276–289.
Carlsson, J., C. Morrison & K. Reece. 2006. Wild and aquaculture
populations of the eastern oyster compared using microsatellites.
J. Hered. 97:595–598.
Castagna, M. 2001. Aquaculture of the hard clam, Mercenaria merce-
naria. In: J. N. Kraeuter &M.Castagna, editors. Biology of the hard
clam. Amsterdam, The Netherlands: Elsevier. pp. 675–697.
Cerda, J. & M. Manchado. 2013. Advances in genomics for flatfish
aquaculture. Genes Nutr. 8:5–17.
Chapuis, M.-P. & A. Estoup. 2006. Microsatellite null alleles and
estimation of population differentiation. Mol. Biol. Evol. 24:621–
631.
Chybicki, I. J. & J. Burczyk. 2009. Simultaneous estimation of null
alleles and inbreeding coefficients. J. Hered. 100:106–113.
Colson, S. & L. N. Sturmer. 2000. One shining moment known as
Camelot: the Cedar Key story. J. Shellfish Res. 19:477–480.
Dillon, R. T., Jr. & J. J. Manzi. 1987. Hard clam, Mercenaria
mercenaria, broodstocks: genetic drift and loss of rare alleles without
reduction in heterozygosity. Aquaculture 60:99–105.
Durand, P., K. T.Wada & F. Blanc. 1993. Genetic variation in wild and
hatchery stocks of the black pearl oyster, Pinctada margaritifera,
from Japan. Aquaculture 110:27–40.
Earl, D. A. & B. M. von Holdt. 2012. STRUCTURE HARVESTER:
a website and program for visualizing STRUCTURE output and
implementing the Evanno method. Con. Gen. Res. 4:359–361.
Evans, B., J. Bartlett, N. Sweijd, P. Cook & N. G. Elliott. 2004. Loss of
genetic variation at microsatellite loci in hatchery produced abalone
in Australia (Haliotis rubra) and South Africa (Haliotis midae).
Aquaculture 233:109–127.
Eversole, A. G. 2001. Reproduction inMercenaria mercenaria. In: J. N.
Kraeuter & M. Castagna, editors. Biology of the hard clam.
Amsterdam, The Netherlands: Elsevier. pp. 221–256.
Falush, D., M. Stephens & J. K. Pritchard. 2003. Detecting the number
of clusters of individuals using the software STRUCTURE: a sim-
ulation study. Mol. Ecol. 14:2611–2620.
FAO (Food and Agriculture Organization of the United Nations).
2013. Available at: http://www.fao.org/fishery/culturedspecies/
Mercenaria_mercenaria/en#tcNA009D.
FAO. 2012. Global aquaculture production. FAO Fisheries and
Aquaculture Department, online database. Available at: http://
www.fao.org/fishery/statistics/global-aquaculture-production/en.
Fogelqvist, J., A. Nittyvuopio, J. Agren, O. Savolainen &
M. Lascoux. 2010. Cryptic population genetic structure: the
number of inferred clusters depends on sample size. Mol. Ecol.
Resour. 10:314–323.
Ford, S. E. & H. H. Haskin. 1987. Infection and mortality patterns in
strains of oysters Crassostrea virgininca selected for resistance to the
parasite Haplosporidium nelson (MSX). J. Parasitol. 73:268–376.
Gosling, E. M. 1982. Genetic variability in hatchery produced Pacific
oysters (Crassostrea gigas Thunberg). Aquaculture 26:273–287.
Goudet, J. 2001. FSTAT, a program to estimate and test gene diversities
and fixation indices (version 2.9.3). Available at: www.unil.ch/izea/
softwares/fstat.html.
Guo, X. 2009. Use and exchange of genetic resources in molluscan
aquaculture. Rev. Aquaculture 1:251–259.
Hadley, N. H. & J. M. Whetstone. 2007. Hard clam hatchery and
nursery production. Southern Regional Aquaculture Center, Pub-
lication No. 4301. Mississippi State, MS. 8 pp.
Hardy, O. J. & X. Vekemans. 2002. SPAGeDi: a versatile computer
program to analyze spatial genetic structure at the individual or
population levels. Mol. Ecol. Notes 2:618–620.
Harte, M. E. 2001. Systematics and taxonomy. In: J. N. Kraeuter &
M. Castagna, editors. Biology of the hard clam. Amsterdam, The
Netherlands: Elsevier. pp. 3–51.
Hedgecock, D., G. Li, S. Hubert, K. Bucklin & V. Ribes. 2004.
Widespread null alleles and poor cross species amplification of
microsatellite DNA loci cloned from the Pacific oyster, Crassostrea
gigas. J. Shellfish Res. 23:379–385.
Hedgecock, D. & F. Sly. 1990. Genetic drift and effective sizes of
hatchery-propagated stocks of the Pacific oyster, Crassostrea gigas.
Aquaculture 88:21–38.
Hedrick, P. W. 2005. A standardized genetic differentiation measure.
Evolution 59:1633–1638.
Hellberg,M. E., R. S. Burton&C.N.Neigel. 2002.Genetic assessment of
connectivity among marine populations. Bull. Mar. Sci. 70:273–290.
Hubisz,M. J., D. Falush,M. Stephens & J. K. Pritchard. 2009. Inferring
weak population structure with the assistance of sample group
information. Mol. Ecol. Res. 9:1322–1332.
Ivanova,N. V., J. R. Dewaard&P. D.N.Hebert. 2006. An inexpensive,
automation-friendly protocol for recovering high-quality DNA.
Mol. Ecol. Notes 6:998–1002.
Jones, A. G., C. A. Stockwell, D. Walker & J. C. Avise. 1998. The
molecular basis of a microsatellite null allele from the white sands
pupfish. J. Hered. 89:339–342.
Jost, L. 2008. GST and its relatives do not measure differentiation.Mol.
Ecol. 17:4015–4026.
Kass, R. &A. Raftery. 1995. Bayes Factors. J. Am. Stat. Assoc. 90:773–
795.
Langdon, C., F. Evans, D. Jacobson & M. Blouin. 2003. Yields of
cultured Pacific oysters Crassostrea gigas Thunberg improved after
one generation of selection. Aquaculture 220:227–244.
Leng, L. & D. Zhang. 2011.Measuring population differentiation using
GST or D? A simulation study with microsatellite DNA markers
under a finite island model and nonequilibrium conditions. Mol.
Ecol. Res. 20:2494–2509.
Li, Q., C. Park, T. Kobayashi & A. Kijima. 2003. Inheritance of
microsatellite DNA markers in the Pacific abalone Haliotis discus
hannai. Mar. Biotechnol. (NY) 5:331–338.
Lutz, C. G. (ed). 2001. Inbreeding, crossbreeding and hybridization, in
practical genetics for aquaculture. Oxford, UK: Blackwell Science
Ltd. pp. 93–116.
MacKenzie, C. L., D. L. Taylor &W. S. Arnold. 2001. A history of hard
clamming. In: J. N. Kraeuter &M. Castagna, editors. Biology of the
hard clam. Amsterdam, The Netherlands: Elsevier. pp. 651–671.
Manzi, J. J. & M. Castagna. 1989. History of clam culture in North
America. In: J. J. Manzi & M. Castagna, editors. Clam mariculture
in North America. New York, NY: Elsevier. pp. 11–16.
McGoldrick, D. J., D. Hedgecock, L. J. English, P. Baoprasertkul &
R. D. Ward. 2000. The transmission of microsatellite alleles in
Australian and North American stocks of the Pacific oyster
(Crassostrea gigas): selection and null alleles. J. Shellfish Res.
19:779–788.
Meirmans, P. & P. Van Tienderen. 2004. GENOTYPE and GENODIVE: two
programs for the analysis of genetic diversity of asexual organisms.
Mol. Ecol. Res. 4:792–794.
HARGROVE ET AL.364
Miller, P. A.,N.G. Elliott, A.Koutoulis, P.D.Kube&R. E. Vaillancourt.
2012. Genetic diversity of cultured, naturalized, and native pacific
oysters, Crassostrea gigas, determined from multiplexed microsatellite
markers. J. Shellfish Res. 31:611–617.
Monz�on-Arg€uello, C., C. G. de Leaniz, G. Gajardo & S. Consuegra.
2013. Less can be more: loss of MHC functional diversity can reflect
adaptation to novel conditions during fish invasions. Ecology and
Evolution. 3:3359–3368.
Nei, M. 1987. Molecular evolutionary genetics. New York, NY:
Columbia University Press. 512 pp.
Onogi, A., M. Nurimoto & M. Morita. 2011. Characterization of
Bayesian genetic clustering algorithm based on Dirichlet process
prior and comparison among Bayesian clustering methods. BMC
Bioinformatics 12:263.
Palmer, K. V. W. 1927. The Veranidae of eastern America: Cenozoic
and recent. Palaeontographica Americana 1:209–522.
Peakall, R. & P. E. Smouse. 2012. GenAlEx 6.5: genetic analysis in
Excel. Population genetic software for teaching and research-an
update. Bioinformatics 28:2537–2539.
Pritchard, J. K., M. Stephens & P. Donnelly. 2000. Inference of
population structure using multilocus genotypic data. Genetics
155:945–959.
Reece, K. S., W. L. Ribeiro, P. M. Gaffney, R. B. Carnegie & S. K.
Allen, Jr. 2004. Microsatellite marker development and analysis in
the eastern oyster (Crassostrea virginica): confirmation of null alleles
and non-mendelian segregation ratios. J. Hered. 95:346–352.
Rice, W. R. 1989. Analyzing tables of statistical tests. Evolution 43:223–
225.
Rousset, F. 2008. Genepop’007: a complete reimplementation of the
Genepop software forWindows and Linux.Mol. Ecol. Res. 8:103–106.
Slatkin, M. 1995. A measure of population subdivision based on
microsatellite allele frequencies. Genetics 139:457–462.
Wang, Y., A.Wang&X.Guo. 2010. Development and characterization
of polymorphic microsatellite markers for the northern quahog
Mercenaria mercenaria (Linnaeus, 1758). J. Shellfish Res. 29:77–82.
Waples, R. S. 1998. Separating the wheat from the chaff: patterns of
genetic differentiation in high gene flow species. J. Hered. 85:438–450.
Weir, B. & C. Cockerham. 1984. Estimation F-statistics for the analysis
of population structure. Evolution 38:1358–1370.
Weir, B.&C. Cockerham. 1993. Estimation of gene flow fromF-statistics.
Evolution 47:855–863.
Whetstone, J. M., L. N. Sturmer & M. J. Oesterling. 2005. Biology and
culture of the hard clam. Mississippi State, MS: Southern Regional
Aquaculture Center, Publication No. 433. 6 pp.
Woodburn, K. D. 1961. Survival and growth of laboratory-reared
northern clams (Mercenaria mercenaria) and hybrids (M. mercenaria
x M. campechiensis) in Florida waters. Proc. Natl. Shellfish. Assoc.
52:31–36.
Xiao, J., J. F. Cordes, J. A. Moss & K. S. Reece. 2011. Genetic diversity
in U.S. hatchery stocks of Crassostrea ariakensis (Fujita, 1913) and
comparison with natural populations in Asia. J. Shellfish Res.
30:751–760.
MICROSATELLITES AND DIVERSITY IN HARD CLAMS 365