ASSESSMENT OF FARMER PREFERENCES FOR CATTLE TRAITS...
14
ASSESSMENT OF FARMER PREFERENCES FOR CATTLE TRAITS IN CATTLE PRODUCTION SYSTEMS OF KENYA Emily Ouma 1∗ , Awudu Abdulai 1 and Adam Drucker 2 1 Department of Food Economics and Consumption Studies, University of Kiel. Olshausenstrasse 40, D-24098 Kiel, Germany. Email: [email protected] 2 International Livestock Research Institute, P.O. Box 5689, Addis Ababa, Ethiopia. Email: [email protected] Paper prepared for presentation at the 11th Congress of the EAAE (European Association of Agricultural Economists), The Future of Rural Europe in the Global Agri-Food System, Copenhagen, Denmark, August 24-27, 2005 Copyright 2005 by Emily Ouma, Awudu Abdulai and Adam Drucker. All rights reserved. Readers may make verbatim copies of this document for non- commercial purposes by any means, provided that this copyright notice appears on all such copies. ∗ Contact author, Email: [email protected]
Transcript of ASSESSMENT OF FARMER PREFERENCES FOR CATTLE TRAITS...

ASSESSMENT OF FARMER PREFERENCES FOR CATTLE TRAITS IN CATTLE PRODUCTION SYSTEMS OF KENYA
Emily Ouma1∗ , Awudu Abdulai1 and Adam Drucker2 1 Department of Food Economics and Consumption Studies, University of Kiel. Olshausenstrasse 40, D-24098
Kiel, Germany. Email: [email protected] 2 International Livestock Research Institute, P.O. Box 5689, Addis Ababa, Ethiopia. Email: [email protected]
Paper prepared for presentation at the 11th Congress of the EAAE (European Association of Agricultural Economists),
�The Future of Rural Europe in the Global Agri-Food System�, Copenhagen, Denmark, August 24-27, 2005
Copyright 2005 by Emily Ouma, Awudu Abdulai and Adam Drucker. All rights reserved. Readers may make verbatim copies of this document for non-commercial purposes by any means, provided that this copyright notice appears on all such copies.
∗ Contact author, Email: [email protected]

1
Abstract The urgent need to improve livestock productivity in sub�Saharan Africa in order to keep pace with
expected increases in demand for meat and milk is very topical. Breed improvement provides key entry points for increasing productivity in cattle populations. However, there are tendencies for breed improvement programs to focus on single, market driven traits such as milk or meat production in isolation of environmental constraints and broader livestock system functions which cattle assume in developing countries. This potentially leads to genotypes that are not well adapted to the environment and not capable of performing the multiple roles that cattle assume in cattle production systems of developing countries. In developing countries, many important functions of livestock are embedded in non-tradable traits that are neither captured in economic analysis nor considered in livestock improvement programs. This study evaluates preferences of cattle keepers in pastoral and crop-livestock systems of selected sites in Kenya for various cattle traits, focusing attention on trypanotolerance and employing choice modelling techniques. These systems are characterized by low input management, harsh environmental conditions and prevalence of various cattle diseases. Trypanosomosis is a serious disease constraint in these systems. The results indicate that farmer preferences for cattle traits are influenced by various factors including cultural practices, production system characteristics and environmental conditions, especially in relation to disease prevalence and availability of cattle feeds. Keywords: Cattle production system; Trait preferences; Choice experiment; Kenya JEL Classification: D11; C35; Q26

2
2. Background and Aim of the Study There is an urgent need to improve livestock productivity in sub�Saharan Africa in order to keep
pace with expected increases in demand for livestock products. In sub-Saharan Africa, demand for meat and milk has almost doubled over the past two decades; In Eastern Africa the same trend has been observed. For instance, milk consumption in the region increased from 1.5 million metric tons in 1975 to 3.2 million metric tons in 1995, while meat consumption rose from 0.5 million metric tons to 0.9 million metric tons (Ehui et al., 2002) in the same period. Further projections indicate that total consumption of meat and milk in eastern Africa will more than double between 1997 and 2020 to reach 1.9 and 7.3 million metric tons respectively, by 2020. Unfortunately, livestock productivity in sub-Saharan Africa remains very low compared to other parts of the world because producers are beset by several technical, institutional and infrastructural constraints related to feeding, animal health and genotype. The severity of these constraints varies by the various systems under which cattle production takes place. The production systems are determined by agro-ecology and commonly differ in exhibiting various stress factors, such as water shortages, disease and parasites as well as temperature extremes. The constraints faced by livestock producers would need to be overcome or minimized in order for improved livestock productivity to be realized.
Animal diseases, especially those caused by parasites, impose severe constraints on animal production in sub-Saharan Africa. Trypanosomosis is one of the major constraints to livestock productivity, with forty six million cattle at constant risk of infection (FAO, 1991; Kristjanson et al., 1999). The annual cost of trypanosomosis in terms of foregone milk and meat production is estimated at US$1.3 billion (ibid.). These are colossal amounts that could be invested in alternative development efforts such as improvement of dilapidated physical infrastructures of sub-Saharan Africa. Trypanosomes are minute protozoan parasites specially adapted for life in the blood of a vertebrate. The genus Trypanosoma is large and diverse. It includes several species that infect wild and domesticated animals particularly bovines and humans. The major pathogenic trypanosome species in livestock are transmitted by the tsetse fly, of which there are some 36 species and subspecies, each adapted to different climatic and ecological conditions (d'Ieteren and Kimani, 2000). In Africa, the major pathogenic trypanosome species for livestock are transmitted by the tsetse fly and include Trypanosoma congolense, T. vivax, T. brucei brucei and T. simiae. Trypanosomosis, continue to cause major losses in these regions but the main losses are in sub�Saharan Africa. Control of trypanosomosis currently relies largely on the use of chemotherapeutic drugs, tsetse vector control or an integrated control approach combining several strategies. In most cases, such control remains costly and only partially effective. The control of trypanosomosis using trypanocidal drugs to treat or prevent the disease is limited by drug costs and availability, and by the development of drug-resistance in target parasites. Attempts to develop an effective vaccine have so far been unsuccessful and immediate prospects are not promising.
Breed improvement, through genetic control is a highly promising route for control of trypanosomosis. There are high prospects for it since trypanotolerance exists in several cattle populations. The advantage of genetic control over other methods of control is that genetic changes are cumulate and permanent, and there are no recurring costs to the end users. However, there are tendencies for breed improvement programs to focus on single, market driven traits such as milk or meat production in isolation of broader livestock system functions and constraints. This potentially leads to genotypes not well adapted to the environment and not capable of performing the multiple roles that livestock assume in livestock systems of developing countries. In developing countries, many important functions of livestock are embedded in traits that are not traded in the market. These include functions and products such as traction, manure, form of security (insurance), dowry payment and use in traditional ceremonies. This study aims to assess farmer preferences for cattle traits by deriving economic values for cattle traits in selected production systems in Kenya, focusing particular attention on farmer preferences for trypanotolerance, relative to other traits which could be introduced through breeding programs that utilize resistant genotypes.

3
3. Data Sources The data used in this paper is part of an on-going collaborative livestock research project between
the Statistical Animal Genetics Group of the Swiss Federal Institute of Technology (ETH), and the International Livestock Research Institute (ILRI) being conducted in Kenya and Ethiopia. The analysis presented in this paper is based on primary data collected through farmer group discussions and a cross-sectional household level survey conducted in Kenya between October and December 2004. A sample of three hundred and three cattle keeping households in two production systems; crop-livestock and pastoral systems were interviewed. The sampled households were randomly selected from eight sub-locations of Narok district and four sub-locations of Suba district.
4. Study Area Since the study focuses on farmer preferences for cattle traits paying particular attention to
trypanotolerance as a trait, tsetse fly challenge areas have been identified and contrasted with non-tsetse fly challenge areas. While tsetse fly is not the only vector of African trypanosomes, cyclical transmission of infection represents the most important problem because the tsetse fly, once infected, remains infective for a long period in contrast to the ephemeral nature of non-cyclical transmission. Consequently, the presence of tsetse flies defines the risk of trypanosomosis in cattle. Given that the presence of tsetse flies is a rudimentary indicator of tsetse challenge, spatial mappings of tsetse fly distribution in Kenya has been done as an initial attempt at targeting research areas with tsetse challenge (Figure 1).
Figure 1. Tsetse fly distribution in Kenya
Data on cattle densities in Kenya at the division level has also been overlayed to assess areas at risk of trypanosomosis. The two survey districts were selected since they are tsetse challenge areas and have different cattle production systems. This was done to ensure that variations in cattle trait preference structure across the cattle production systems are captured.
4.1 Characteristics of Cattle Production systems in the Study Area In Mara division of Narok district, pastoral systems prevail while in Suba district, crop-livestock
systems are common. Pastoral systems are characterized by low input management, large herd sizes and practice of some level of semi-nomadism. Livestock is moved based on seasonal rotation in search of water and pasture. No crop production is undertaken mainly due to the semi-arid nature of the environment and the food eating habit of the community inhabiting these areas, which mainly include meat and milk consumption. Land ownership is mainly in the form of communal group ranches. In crop-livestock systems, both crop and livestock production takes place. There exist strong livestock-crop interactions in this system. Cattle act as agricultural inputs in crop production, while crop harvest left-over is used to feed livestock. Cattle provide draught power for ploughing crop fields and manure
Narok district
Suba district

4
for fertilization of the agricultural plots. The use of manure for fertilization of agricultural plots is considered as important as milk or meat. This is because inorganic fertilizers are unaffordable for the farmers as their costs keep escalating. One study in Zimbabwe record that farmers reduced grazing time by keeping cattle penned longer in order to collect more manure even though this meant reduced feed intake thereby adversely affecting production (Romney et al., 1994). Table 1 presents a description of the production system based on data collected from the study.
Table 1. Summary of Characteristics of Cattle Production Systems in Suba and Narok districts, Kenya, (standard deviation in parenthesis).
Cattle production system type
Crop-Livestock (n = 179)
Pastoral (n = 123)
Herd size 12.3 (10.8) 71.7 (68.7)Total land size 16.3 (15.9) Communal ranchesDistance to nearest market (Km) 3.0 (2.8) 3.3 (2.4) Nearest livestock watering point in dry season (Km) 2.5(2.2) 3.5(3.0) Schooling years of household head 8.9 (4.2) 1.9(3.9)
EAZ � East African Zebu
The average cattle herd size per household in the pastoral system is large and significantly different from the crop-livestock system (p<0.01). The common cattle breeds kept in the crop-livestock system is the East African Zebu and crosses of Boran while in the pastoral systems, the East African Zebu is common and a few farmers also keep some Sahiwal breed. Land tenure system in crop-livestock systems is mainly freehold with an average land size of 16.3 acres. In pastoral systems, the community lives in communal group ranches and land is owned by the group ranch members. Distance to livestock watering points is significantly different across the two systems (p<0.05). In the pastoral systems, the nearest watering point for cattle during the dry season is on average 3.5 Km compared to 2.5 Km for the crop-livestock system. Therefore, cattle with low water requirements may be a preferred attribute. The education level of the household head is an important aspect to consider when carrying out interventions, as it determines how such interventions ought to be presented. In the pastoral system, the household head has spent an average maximum of two years in school while in crop-livestock systems, they have spent an average maximum of nine years. This is significantly different across the two systems (p<0.01).
5. Methods A variety of Participatory Rural Appraisal (PRA) tools were used during the farmer group
discussions, including scoring and ranking techniques, timeline and trend analysis, seasonal calendar analysis as well as community institutional maps. The farmer group discussions were held as part of a pilot study to identify existing cattle production systems to be used in targeting research areas for the household level survey. In addition, the farmer group discussions were important in identifying cattle traits preferred by farmers. These traits were then used to design the choice experiment survey instrument which was administered during the household level survey. During the group discussions, farmers were asked to indicate their objectives of cattle keeping and then asked to identify the cattle traits or attributes that they prefer in cattle, based on their prevailing local and environmental conditions (Ouma et al., 2004). Pairwise ranking technique for the attributes was then applied. The identified attributes were then used in the construction of the choice experiment. Table 2 presents the traits identified and their levels.

5
Table 2. Traits and Trait Levels for used in Choice Experiments
Cows Bulls Traits Levels Traits Levels Trypanotolerance 1. Tolerant Trypanotolerance 1. Tolerant 2. Susceptible 2. Susceptible Milk yield 1. 1-2 litres per day Traction ability 1. Suitable 2. 2-4 litres per day 2. Unsuitable Reproduction potential 1. 1 calf per year Fertility 1. High 2. 1 calf every 2 years 2. Low Coat colour 1. Light-colored Coat colour 1. Light-colored 2. Dark-colored 2. Dark-colored Purchase price at 2 yrs 1. KSh 10,000 Purchase price at 4yrs 1. KSh 11,000 2. KSh 15,000 2. KSh 20,000 3. KSh 19,500 3. KSh 27,000 Watering frequency 1. Once a day Watering frequency 1. Once a day 2. Twice a day 2. Twice a day 3. More than 2x per day 3. More than 2x/day Live weight at 2 yrs 1. 120Kg Live weight at 4 yrs 1. 200Kg 2. 190Kg 2. 320Kg 3. 250 Kg 3. 450Kg Feeding requirements 1. Need for supplements 2. No need for supplements
5.1 Experimental Design Since some of the traits identified do not have market values, non-market valuation techniques are
needed to get their values. Revealed and stated preference methods are two methods that have been employed in non-market valuation studies to value non-market goods. In stated preference method, the respondent states his or her preference while in revealed preference, the respondent�s preference is revealed through observed behaviour. Choice experiment is a multiple attribute stated preference method. Once the traits and their levels have been defined, they are then combined according to some experimental design and presented to respondents in the form of profiles. Orthogonal experimental design was used in this study to achieve a randomized selection of the profiles. The orthogonal design treats all attributes as independent and precludes collinearity in an empirical model (Mackenzie, 1993). Cards with pictorial representations of the differences in the levels of traits were then used to demonstrate each cattle profile to survey respondents. The advantage of pictorial presentations is that they help respondents to process the information, thereby facilitating the interpretation and choice of the profile.
The administration of the choice experiment was conducted in the following manner. Each respondent was first introduced to the type of choice task required and then he/she was presented with twelve sets of pair-wise choices for cows or eleven sets for bulls drawn from the orthogonal design. Each choice task required the respondent to choose one animal profile he would prefer to buy for rearing from the two profiles presented for each choice task. If neither of the profiles was found satisfactory, the respondent could choose the �zero� option and state that he preferred neither. The choice tasks are usually designed to elicit the trade-offs that individuals make between traits and to facilitate estimation of values for each trait. An example of one choice task for cows and bulls used in this study is presented in the appendix.
6
5.2 Overview of Choice Experiment Theory The conceptual framework for choice experiments arises from the consumer theory developed by
Lancaster (1966) which postulates that preferences for goods are a function of the traits or characteristics possessed by the good rather than the good per se. An important implication of this theory is that overall utility of a good can be decomposed into separate utilities for its constituent characteristics or traits. In terms of the utility function, this translates into using the characteristics of goods as the arguments of the function. Hence, a good can be described by the characteristics that generate utility or disutility to individuals. For cattle breeding, this permits the analysis of farmer preferences in terms of the utility they perceive to result from various cattle traits. Random utility theory states that consumers make choices that would lead to their utility being maximized conditional on their constraints. Choice experiments is therefore based on consumers choosing option �A� if and only if, option �A� generates at least as much utility as any other option, with utility being assessed by trading off the traits of the alternative options available. The utility generated by an option is dependent on the characteristics or traits of the good (X), the characteristics of the individual (Z) and an unobservable component (e). Hence the utility of choosing option �A� can be specified as:
AAA eZXVU += ),( Equation (1)
Where �V� is an indirect utility function.
Hence the probability that an individual, �i� will choose option �A� from the set of choices �J� is:
)]()[(),|( JiiJAiAi eVeVPJAAAP +>+=∈ Equation (2)
That is, the probability that an individual will choose �A� from the set of options �J� is equal to the probability that the utility they obtain from �A� (including the random component) is higher than for any other element of �J�.
Choice experiments and hedonic price analysis are alternative empirical applications to the Lancaster consumer theory. The strength of both hedonic pricing and choice experiment techniques is the ability to decompose revealed preference data, that is, price of goods in case of hedonics and choice of goods profiles by individuals in case of choice experiments, into marginal values or part worth estimates. However, the use of hedonic pricing is not practical when market transactions data is poor as is the case in Africa. In the rural areas in Africa, most cattle transactions do not take place in formal markets where transactions are transparent and easily recorded. Rather, transactions usually take the form of private agreements between buyers and sellers using cash or barter. Secondly, many cattle are never traded or sold, but stay within the farm household or are passed on to other households through traditional practices such as dowry payments. In addition, market prices may be highly distorted due to the presence of intermediaries. Consequently, price data is likely to be incomplete and can suffer from substantial measurement errors. In choice experiments, since preferences are measured directly, and then related to utility, the results are less likely to be adversely affected by traits that are not priced or transactions that do not occur through organized markets. Consequently, choice experiment technique was used in this study.
5.3. Analytical Techniques and Data Analysis Selection of the appropriate methodology for estimation of choice probabilities is dependent on the
distribution of the random error component �e� in equation 2. Train (2003) indicates that the errors are usually assumed either independent and identically distributed (IID) Gumbel random variables, or not independent or randomly distributed normal random variables. In this application, we assume that the errors are independent and identically distributed, due to computational simplicity. The difference between two extreme value variables is distributed logistic. An IID error term facilitates estimation using multinomial logit model in our case since the respondent chooses between 3 unordered options at any one point. The VJ in Equation 1 are assumed to be additive functions of the traits, socio-economic characteristics and the error term as shown in equation 3.
7
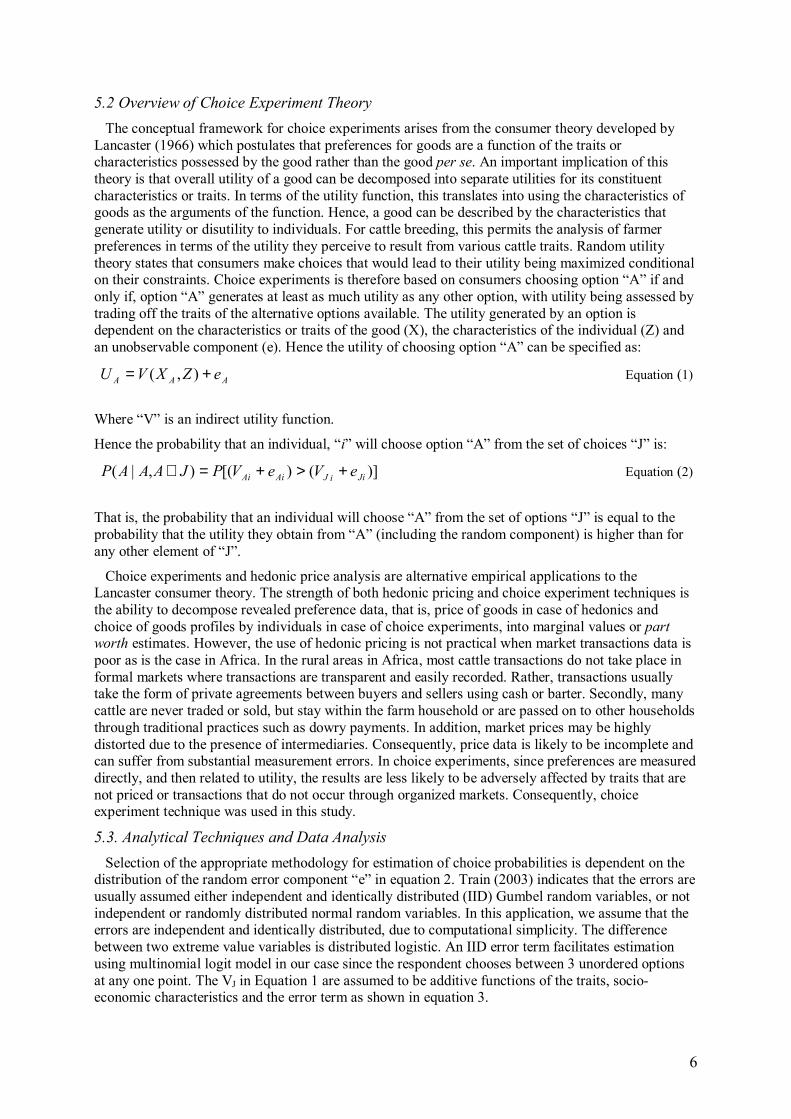
mnnnmmAi eZXV ++= ββ Equation (3)
Where: m = 1,���.k attributes
n = 1,���..p socio-economic and attitudinal characteristics
β is the coefficient associated with each of the attributes and socio-economic or attitudinal characteristics.
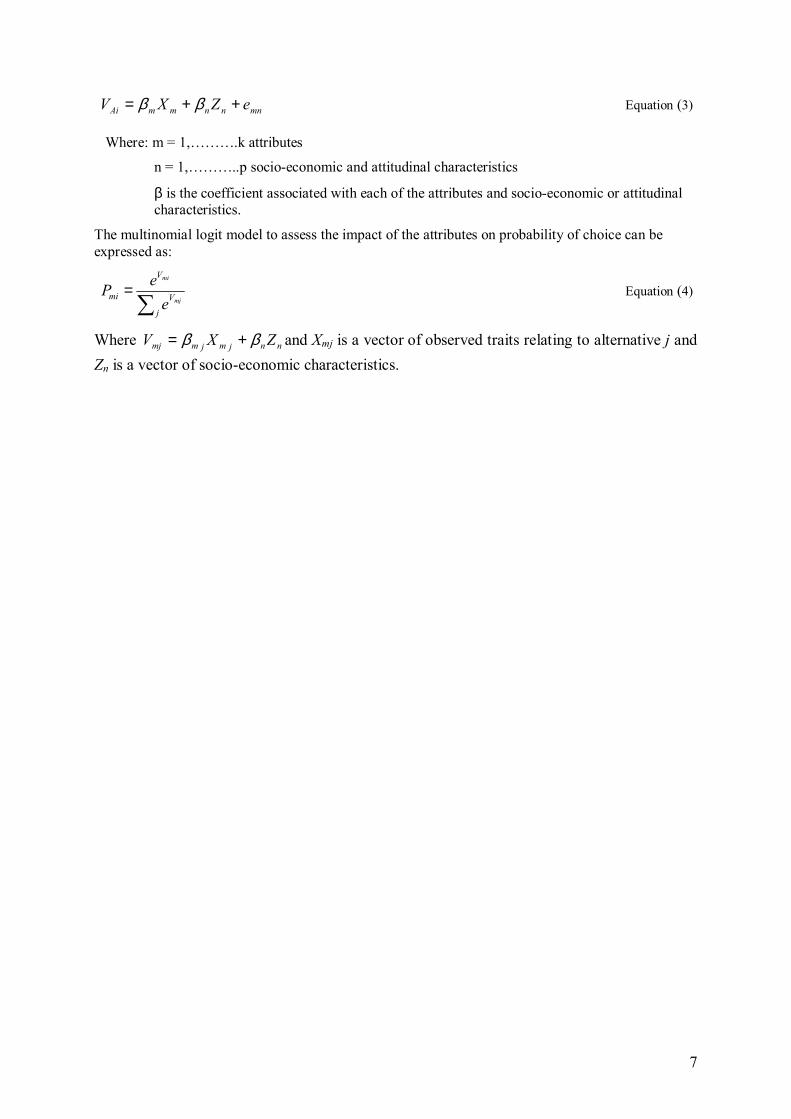
The multinomial logit model to assess the impact of the attributes on probability of choice can be expressed as:
∑=
j
V
V
mi mj
mi
eeP Equation (4)
Where nnjmjmmj ZXV ββ += and Xmj is a vector of observed traits relating to alternative j and Zn is a vector of socio-economic characteristics.

8
6. Results and Discussion Multinomial logit models for both bulls and cows were estimated using NLOGIT 3.0 (2002)
Econometric software. The maximum likelihood parameter estimates are presented in Table 3 and 4 for bulls and cows respectively. Since the traits had 2-3 levels each, one level was left out as base during estimation. The models have a good fit for both bulls and cows as indicated by the likelihood ratio index.
Table 3. Multinomial Logit Maximum Likelihood Parameter Estimates of Bull Traits, by production system
Production system Bull traits All systems
(pooled) (n = 146)Crop-livestock system (n = 83)
Pastoral system (n = 63)
Trypanotolerant 1.5819***(0.1501) 1.6239***(0.1872) 2.6925***(0.5012) Purchase price 0.0011 (0.0093) 0.0140 (0.0111) -0.0003 (0.0269) Low watering frequency 0.2670 *(0.1433) 0.2609 (0.1773) 0.5927 (0.4333) Dark coat colour 0.3322**(0.1458) 0.3845**(0.1736) -0.3826 (0.4068) Live-weight at 4 years (Kg) 0.2964***(0.0603) 0.2074***(0.0713) 0.4232**(0.1727) Good traction ability 1.5232***(0.1475) 2.0139***(0.1838) 0.2395 (0.4048) Highly fertile 1.5068***(0.1339) 0.5558***(0.1614) 4.3896***(0.5350) Log-likelihood function -393.7295 -263.5195 -58.695 Log-likelihood function at zero -848.1287 -522.9394 -325.18 χ2 (7) 908.75 518.8 532.9 p-value 0.00000 0.00000 0.00000 Likelihood ratio index 0.5358 0.4961 0.8195
***, **, * indicate that coefficients are statistically significant at the 1, 5 and 10% levels, respectively, using P-values in maximum likelihood estimation. Robust standard errors are indicated in parentheses.
All coefficients for bull traits except the purchase price have the expected signs. The unexpected positive sign for purchase price though lacking statistical significance implies that the purchase price of the animal is not an important trait to consider as long as the animal has the other preferred traits. This can be attributed to the nature of livestock assets in the sense that they are used to demonstrate wealth and have a capacity to increase in value overtime through growth and reproduction. Therefore the salvage value may even be higher than the price at purchase. Consequently, the purchase price may not be an important attribute.
The positive and highly significant trypanotolerant trait coefficient (p<0.01) indicates that respondents are more likely to choose bull profiles with trypanotolerance trait. The study sites are in high tsetse challenge areas, where cattle are at constant risk of trypanosomosis infection. The trait for low water requirement in bulls is positive and significant (p<0.1) implying a higher likelihood for respondents to choose bull profiles with low water requirement. This implies that the respondents prefer bulls that need to water only once a day relative to those that need to water more than two times a day. However, when differentiated by production systems, the coefficient becomes statistically insignificant.
The positive dark coat colour coefficient indicates that respondents are more likely to choose bull profiles with dark coat colour relative to the lighter coat coloured ones. This is the case for the pooled data as well as the crop-livestock system while in the pastoral system, respondents are less likely to choose the dark coated bulls. In some communities, coat colour is an important trait as the animals are used for ceremonial functions where the coat colour is an important trait. High relative liveweight at 4years and high fertility have the expected positive sign and the coefficients are statistically significant across all the systems (p<0.01). Good traction ability is an important attribute in crop-livestock systems, since bulls are used for ploughing crop-fields. The coefficient is positive and statistically significant for the pooled data and the crop-livestock system (p<0.01) but is not significant for the

9
pastoral system. In the pastoral system there is no crop production and use of cattle for draft power is considered a taboo.
Table 4. Multinomial Logit Maximum Likelihood Parameter Estimates of Cow Traits, by production system
Production system Cow traits All systems
(pooled) (n = 156) Crop-livestock system (n= 96)
Pastoral system (n = 60)
Trypanotolerant 1.7709***(0.1507) 1.7376***(0.1797) 1.9632***(0.2898) High milk yield 0.9655***(0.1367) 1.0332***(0.1697) 0.8552***(0.2379) High reproduction potential 1.1058***(0.1478) 0.9598***(0.1757) 1.4583***(0.2862) Need for supplementary feeds -1.1613***(0.1552) -1.2378***(0.1908) -1.0749***(0.2747) Purchase price 0.0229 (0.0147) 0.0297*(0.0180) 0.0127 (0.0262) Low watering frequency 0.3696**(0.1612) 0.1330 (0.1935) 0.8740***(0.3125) Dark coat colour -0.1767 (0.1476) -0.2067 (0.1788) -0.1208 (0.2741) Liveweight at 2 years (Kg) 0.4783***(0.1080) 0.3679***(0.1316) 0.6713***(0.1973) Log-likelihood function -474.22 -326.56 -139.77 Log-likelihood function at zero -986.55 -626.21 -360.34 χ2 (7) 1024.6 599.3 441.14 p-value 0.00000 0.00000 0.00000 Likelihood ratio index 0.5193 0.4785 0.6121
***, **, * indicate that coefficients are statistically significant at the 1, 5 and 10% levels, respectively, using P-values in maximum likelihood estimation. Robust standard errors are indicated in parentheses.
The coefficients for the traits of cows have the expected signs. The coefficients for trypanotolerance, high milk yield, high reproduction potential and high liveweight are positive and highly significant (p<0.01) indicating a higher likelihood for the respondents to choose cow profiles with these traits. The coefficient for need for supplementary feeds is negative and strongly significant (p<0.01) indicating a lower likelihood for respondents to choose cow profiles that require purchased supplementary feeds. This is because it would be costly for the cattle keepers to purchase supplementary feeds for the cows. The coefficient for low watering frequency is positive and significant (p<0.05) implying a higher likelihood for respondents to choose cow profiles that need to water only once a day relative to those that need to water more than two times a day. When differentiated by production system, the trait becomes highly significant in pastoral systems but not in crop-livestock systems. This is because in the pastoral systems, water is a major constraint.
The choice modeling results can be used to estimate implicit prices for the different traits. Implicit prices are estimated as the rate of change in the trait divided by the rate of change of the cost coefficient. Implicit price for the traits are presented in Table 5.
Table 5. Estimated Implicit prices of Attributes (standard errors in parentheses)
Trait Coefficient (�000� KSh) Standard error t-ratio Trypanotolerance 32.573 6.296 5.174 Low watering frequency 12.332 3.529 3.495 Dark coat colour 8.3882 2.891 2.902 High liveweight in Kg 12.204 2.888 4.226
The implicit price for the attributes is significantly different from zero. The results indicate that respondents are willing to pay KSh 32,573 for an animal that is trypano-tolerant relative to that which is trypano-susceptible. In addition, the respondents would be willing to pay KSh 12, 204 for any additional 50Kg live-weight in the animal. The implicit value for dark coat colour is KSh 8,388 while for a drought tolerant animal, indicated by low watering frequency is KSh 12, 332.

10
7. Concluding Remarks The integration of trypanotolerance traits of cattle into breed improvement programs in tsetse
challenge areas provides a viable option to enhance cattle productivity. Research efforts should be geared towards this. Empirical results indicate that farmers in both pastoral and crop-livestock systems value the adaptation traits, more so trypanotolerance. However, trypanotolerance alone is not sufficient since other traits are also considered important. For instance, cattle that need to be watered less frequently are also preferred. This is mainly because watering points are far from the homesteads or cattle grazing areas. Some of the study sites are located in semi-arid lands; consequently water is a very important constraint.
Culture and tradition have an influence on the traits preferred by farmers. For instance, farmers in the study sites prefer dark coat-coloured cattle, especially the dark red colour and other dark colours. The dark coated animals are used for slaughtering during ceremonial functions. This is despite the fact that light coat-coloured cattle have a lower risk of being bitten by tsetseflies, since tsetse flies are attracted to darker colours. Another aspect to be considered is whether the cattle have horns or not. This is because in some communities, hornless cattle cannot be used for dowry payment, an important function of cattle in Kenya.
Differences in preferences across production systems are observed due to the varying production activities and available resources. Producers in pastoral systems have a high preference for hardy animals that are able to withstand severe environmental conditions. In crop-livestock systems, suitability for traction is a very important attribute especially for male cattle. Similarities in preferences across production systems are also observed, especially in regard to the live weight of the animals, since heavier animals fetch favourable market prices.
Acknowledgement The authors gratefully acknowledge funding support provided by the Swiss Centre for International
Agriculture (ZIL).

11
References d'Ieteren, G., and Kimani, K. (2000) Indigenous Genetic Resources: A Sustainable and Environmentally Friendly Option for Livestock Production in Areas at Risk from Trypanosomes, Science in Africa: Africa's First On-line Science Magazine.
Ehui, S., Benin, S., Williams, T. and Meijer, S. (2002) Food Security in sub-Saharan Africa to 2020: Socio-economic and Policy Working Paper. International Livestock Research Institute, Addis Ababa, Ethiopia.
FAO (1991) Programme for the Control of African Animal Trypanosomosis and Related Development. Second Meeting of the Inter-Secretariat Coordinating Group, Food and Agriculture Organisation of the United Nations, Rome.
Greene, W. (1997) Econometric Analysis. Macmillan Publishing Co. 3rd edition, Prentice Hall.
Kristjanson, P., Swallow, B., Rowlands, J., Kruska, R. and de Leeuw, P. (1999) Measuring the costs of African animal trypanosomosis, the potential benefits of control and returns to research. Agricultural Systems, 59, 79-98.
Lancaster, K. (1966) A New Approach to Consumer Theory. Journal of Political Economy, 74, 132-157. Mackenzie, J. (1993) A Comparison of Contingent Preference Models. American Journal of Agricultural Economics, 65, 593-603.
NLOGIT (2002) Reference Guide by William H. Greene, Econometric Software, Inc. Plainview, New York, USA Ouma, E., Janssen-Tapken, U., Drucker, A., Gibson, J., Obare, G., Ayalew, W., Kadarmideen, H. and Abdulai, A. (2004). �Developing Optimised Cattle Breeding Schemes with a special focus on Trypanotolerance based on the demand and opportunities of smallholder farmers in Eastern Africa� PRA Report
Romney, D. L., Thorne, P.J. and Thomas, D. (1994) Some Animal Related Factors Influencing the Cycling of Nitrogen in Mixed Farming Systems in Sub-Saharan Africa. Agriculture, Ecosystems Environment (49), 163-172
Scarpa, R., Ruto, E., Kristjanson, P., Radeny, M., Drucker, A. and Rege, E. (2003) Valuing Indigenous Cattle Breeds in Kenya: an empirical comparison of stated and revealed preference value estimates. Ecological Economics, 45, 409-426.
Train, K. (2003) Discrete Choice Methods with Simulation. Cambridge University Press, UK

12
Bul
ls - C
hoic
e T
ask
1 (O
ptio
n 1)
KSh
11,
000
Purc
hase
pri
ce o
f bul
l at
4 ye
ars
Dar
k co
at c
olou
r H
igh
wat
erin
g fr
eque
ncy:
Nee
d to
be
wat
ered
mor
e th
an tw
o tim
es a
day
Tra
ctio
n: U
nsui
tabl
e Su
scep
tible
to T
ryps
: Po
or c
ondi
tion
afte
r in
fect
ion,
nee
d tre
atm
ent
drug
s
Hig
hly
fert
ile: S
emen
re
sults
in p
regn
ancy
afte
r 1-
2 se
ssio
ns w
ith c
ow
Wei
ght a
t 4 y
rs:
320
Kg
Bul
ls - C
hoic
e T
ask
1 (O
ptio
n 2)
KSh
27,
000
Purc
hase
pri
ce o
f bul
l at 4
ye
ars
Lig
ht c
oatc
olou
r L
ow w
ater
ing
freq
uenc
y:
Nee
d to
be
wat
ered
onl
y
once
a d
ay
Low
fert
ility
: Sem
en d
oes
not e
asily
resu
lt in
pre
gnan
cy
(suc
cess
afte
r m
ore
than
3
sess
ions
with
cow
)
Tol
eran
t to
Try
ps:
able
to b
e in
goo
d
cond
ition
des
pite
in
fect
ion.
No
need
fo
r tre
atm
ent d
rugs
Tra
ctio
n: S
uita
ble
Wei
ght a
t 4 y
rs:
320
Kg

13
Dar
k co
at
Mod
erat
e w
ater
ing
freq
uenc
y:
Nee
d to
be
wat
ered
onc
e a
day
Ave
rage
milk
Y
ield
per
day
(2
-4 lt
s)
No
need
for
supp
lem
enta
ry
purc
hase
d fe
ed ra
tions
Feed
ing
KSh
19,
500
Purc
hase
pri
ce o
f cow
Tol
eran
t to
Try
ps:
able
to b
e in
goo
d
cond
ition
des
pite
in
fect
ion.
No
need
fo
r tre
atm
ent d
rugs
Wei
ght a
t 2 y
rs: 1
20K
g R
epro
duct
ive
pote
ntia
l: O
ne c
alf
ever
y tw
o ye
ars
√
√
√
Yr 5
Yr4
Yr3
Yr 2
Yr 1
Cow
s: C
hoic
e ta
sk 1
(Opt
ion1
) C
ows:
Cho
ice
task
1 (O
ptio
n2)
Lig
ht c
oat
Nee
d fo
r su
pple
men
tary
pu
rcha
sed
feed
ratio
ns
Feed
ing
requ
irem
ents
KSh
10,
000
Purc
hase
pri
ce o
f cow
Wei
ght a
t 2 y
rs: 2
50K
gR
epro
duct
ive
pote
ntia
l: O
ne
calf
ever
yye
ar
Susc
eptib
le to
Try
ps:
Poor
con
ditio
n af
ter
infe
ctio
n, n
eed
treat
men
tdru
gs
√ √
√ √
√
Yr
5Y
r 4
Yr
3Y
r 2
Yr
1
Mod
erat
e w
ater
ing
freq
uenc
y:
Nee
d to
be
wat
ered
onc
ea
day
Ave
rage
milk
Y
ield
per
da
y
(1-2
lts)