Farmer Preferences for Abiotic Stress Tolerance in...
30
Farmer Preferences for Abiotic Stress Tolerance in Hybrid versus Inbred Rice: Evidence from Bihar, India Patrick S. Ward International Food Policy Research Institute, New Delhi, India David L. Ortega Michigan State University, East Lansing, MI, USA David J. Spielman International Food Policy Research Institute, Washington, D.C., USA Vartika Singh International Food Policy Research Institute, New Delhi, India Nicholas Magnan University of Georgia, Athens, GA, USA Selected Paper prepared for presentation at the Agricultural and Applied Economics Association 2013 AAEA & CAES Joint Annual Meeting, Washington, D.C., August 4-6, 2013. © 2013 by Patrick S. Ward, David L. Ortega, David J. Spielman, Vartika Singh and Nicholas P. Magnan. All rights reserved. Readers may make verbatim copies of this document for non-commercial purposes by any means, provided that this copyright notice appears on all such copies.
Transcript of Farmer Preferences for Abiotic Stress Tolerance in...

Farmer Preferences for Abiotic Stress Tolerance in
Hybrid versus Inbred Rice: Evidence from Bihar, India
Patrick S. Ward
International Food Policy Research Institute, New Delhi, India
David L. Ortega Michigan State University, East Lansing, MI, USA
David J. Spielman International Food Policy Research Institute, Washington, D.C., USA
Vartika Singh International Food Policy Research Institute, New Delhi, India
Nicholas Magnan University of Georgia, Athens, GA, USA
Selected Paper prepared for presentation at the Agricultural and Applied Economics Association 2013 AAEA & CAES Joint Annual Meeting, Washington, D.C.,
August 4-6, 2013.
© 2013 by Patrick S. Ward, David L. Ortega, David J. Spielman, Vartika Singh and Nicholas P. Magnan. All rights reserved. Readers may make verbatim copies of this document for non-commercial purposes by any means, provided that this copyright notice appears on all such copies.

Farmer Preferences for Abiotic Stress Tolerance in
Hybrid versus Inbred Rice: Evidence from Bihar, India
Patrick S. Ward
International Food Policy Research Institute, New Delhi, India
David L. Ortega Michigan State University, East Lansing, MI, USA
David J. Spielman International Food Policy Research Institute, Washington, D.C., USA
Vartika Singh International Food Policy Research Institute, New Delhi, India
Nicholas Magnan University of Georgia, Athens, GA, USA
June 3, 2013
Abstract Recent efforts to develop rice cultivars with drought-tolerance (DT) traits have resulted in the release of
several varieties that demonstrate significant resiliency to drought stresses. In this paper, we use discrete
choice experiments to examine farmers’ preferences for DT traits and explore heterogeneity in these
preferences using primary data collected in rural Bihar, India. We evaluate farmers’ preference for yield
performance under different weather scenarios, duration, seed reusability and seeding rate. Our results
show that farmers value the reduction in yield variability offered by DT cultivars, but are willing to pay
even more for cultivars that offer yield advantages even under normal conditions. Rice farmers were
found to prefer short duration cultivars, which provide an alternative pathway by which farmers can
manage drought risk. Finally, we find that farmers highly value seed-reusability, and would, other things
equal, demand a discount on hybrid seeds that do not have this characteristic.
JEL Codes: Q12, Q16, O33
Keywords: choice experiments, drought tolerance, rice, India
Corresponding author: [email protected]. This study was prepared as a contribution to the Cereal Systems Initiative for South Asia (CSISA), with generous funding from the United States Agency for International Development (USAID) and the Bill and Melinda Gates Foundation. The authors have benefitted from discussions and correspondence with J.K. Ladha, Umesh Singh, Arvind Kumar, Takashi Yamano, Andy McDonald, Olaf Erenstein, Nils Teufel, Fred Rossi, Humnath Bhandari, Ekin Birol, Andrew Bell and Timothy Dalton. We also with to acknowledge assistance provided by Samson Dejene, Varun Mohan, Amardeep Ujjain, and Kishor Purohit.

1
1 Introduction
Rice is the most important staple food commodity in South Asia, with roughly 60 million
hectares of rice cultivated each year. India is the world’s second largest rice producer,
producing roughly 20 percent of the world’s rice. In India alone, there are approximately
43 million hectares under rice cultivation, providing a source of livelihood for millions of
people.1 In addition to being an important source of employment and income, rice
contributes nearly 30 percent of total caloric energy and over 20 percent of total protein
per capita in India.
Droughts represent a significant constraint to rice production in much of India. Roughly
20 percent of India’s total land area is drought-prone. When droughts occur, there are
significant negative impacts on rice production, both in terms of a decrease in cultivated
area as well as a decrease in yield. In addition to the immediate, farm-level
consequences of drought such as lower output and income, there are often significant
secondary household impacts such as indebtedness, asset depletion and health
consequences that perpetuate already high levels of poverty and deprivation in India
(World Bank, 2008). Even broader and economy-wide impacts include rapid increases
in rice prices that can increase vulnerability among food-insecure households, and
strains of fiscal expenditures required to offset price increases and operate social
protection schemes. This situation is disconcerting, since evidence suggests that
droughts have been occurring with greater frequency in India since the beginning of the
20th century (World Bank, 2008).
Recent efforts to develop rice cultivars with drought-tolerance (DT) traits have resulted
in the release of several varieties that demonstrate significant resiliency to drought
stresses with no yield penalty under normal conditions.2 Simulation exercises aimed at
1 FAO estimates that over 100 million households in Asia and Africa are directly dependent upon rice
cultivation. 2 Recent research has involved improvements in terms of both drought tolerance as well as drought
resistance. While the terms are often used interchangeably, they in fact describe different physiological phenomenon. Drought tolerance involves enduring periods with scanty or deficient water supplies. Drought resistance, on the other hand, generally involves mechanisms by which plants protect themselves from the harsh drying sun in during drought conditions. Throughout the remainder of this paper, we will use the term “drought tolerant” as a generic term describing crops that are both drought tolerant as well as drought resistant.

2
assessing the impacts of DT rice suggest that the successful development and delivery
of these varieties will produce significant benefits across South Asia, well in excess of
the investments necessary to develop the technology (Mottaleb et al., 2012). While this
holds potential promise for both public or private sector research efforts, Lybbert and
Bell (2010) argue that development of DT cultivars does not necessarily imply that DT
varieties will be widely adopted with the same speed as other recent improvements
(e.g., crops genetically engineered to contain the Bacillus thuringiensis toxin, thereby
making crops virtually impervious to insect) due primarily to the non-monotonic nature of
the benefits associated with drought tolerance and their effect on social learning and
technology diffusion.
In this paper, we use discrete choice experiments to examine farmers’ preferences for
DT traits embodied in different rice backgrounds, and explore heterogeneity in these
preferences. Our empirical approach allows for the elicitation of a money-metric
valuation for specific attributes in hypothetical rice seeds. In this study, we included
drought tolerance and alternative backgrounds (self-pollinating varieties vs. hybrid)
within a series of other varying attributes that characterize hypothetical rice seed
options to assess farmers’ choices among alternatives and determine their valuation for
the DT attribute. These choices aim to simulate future market scenarios and situations
that farmers will potentially face in India.3
The remainder of this paper is organized as follows. In Section 2, we provide a
background on rice production in India, paying specific attention to the challenges
wrought by frequent droughts in key rice-growing regions. In Section 3, we describe the
empirical methodology used in analyzing farmer preferences and demand
heterogeneity. In Section 4, we describe the data used in this study, including a
discussion of the geographic and socioeconomic context of our sample area as well. In
Section 5, we present the results of our empirical analysis. Finally, we offer some
concluding remarks in Section 6.
3 For example, farmers in India may face the question of whether to purchase low-cost seed of a DT rice
variety developed by public breeders versus higher-cost seed of a DT rice hybrid developed by private breeders. Similar choices (albeit for different traits) are already faced by small-scale, resource-poor farmers who cultivate cotton and maize in India, and similar choices have already been modeled for eggplant in India (Kolady and Lesser, 2006).
3
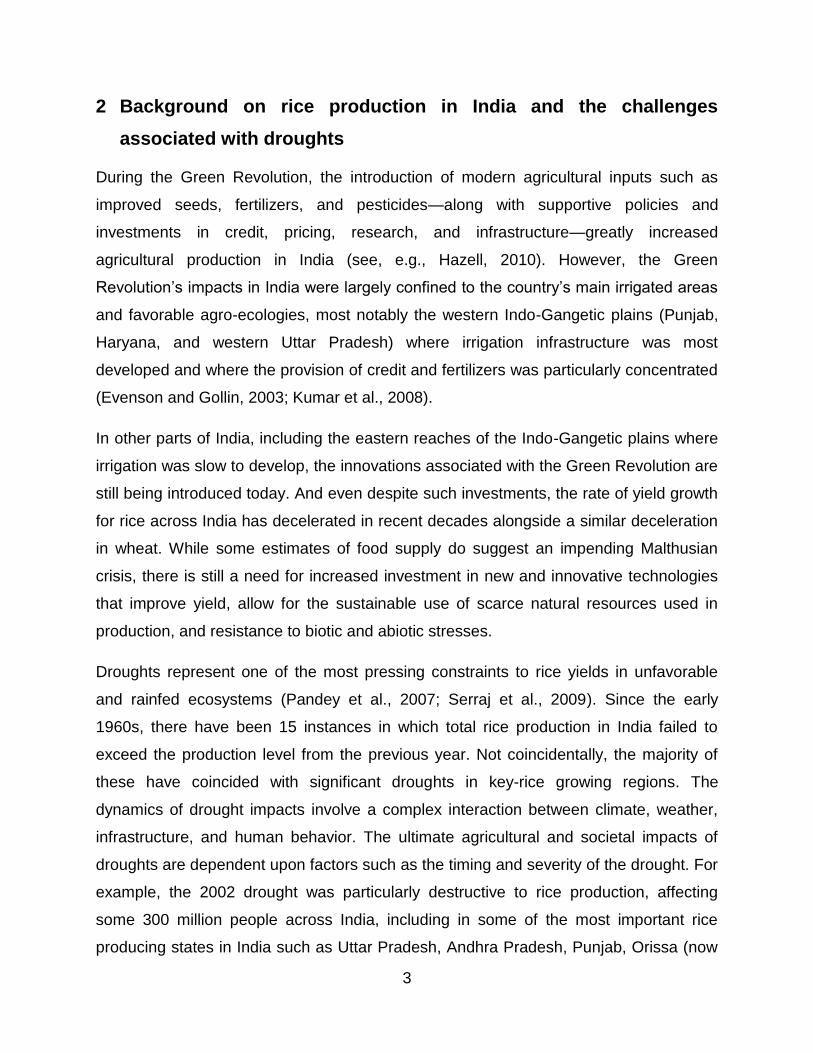
2 Background on rice production in India and the challenges
associated with droughts
During the Green Revolution, the introduction of modern agricultural inputs such as
improved seeds, fertilizers, and pesticides—along with supportive policies and
investments in credit, pricing, research, and infrastructure—greatly increased
agricultural production in India (see, e.g., Hazell, 2010). However, the Green
Revolution’s impacts in India were largely confined to the country’s main irrigated areas
and favorable agro-ecologies, most notably the western Indo-Gangetic plains (Punjab,
Haryana, and western Uttar Pradesh) where irrigation infrastructure was most
developed and where the provision of credit and fertilizers was particularly concentrated
(Evenson and Gollin, 2003; Kumar et al., 2008).
In other parts of India, including the eastern reaches of the Indo-Gangetic plains where
irrigation was slow to develop, the innovations associated with the Green Revolution are
still being introduced today. And even despite such investments, the rate of yield growth
for rice across India has decelerated in recent decades alongside a similar deceleration
in wheat. While some estimates of food supply do suggest an impending Malthusian
crisis, there is still a need for increased investment in new and innovative technologies
that improve yield, allow for the sustainable use of scarce natural resources used in
production, and resistance to biotic and abiotic stresses.
Droughts represent one of the most pressing constraints to rice yields in unfavorable
and rainfed ecosystems (Pandey et al., 2007; Serraj et al., 2009). Since the early
1960s, there have been 15 instances in which total rice production in India failed to
exceed the production level from the previous year. Not coincidentally, the majority of
these have coincided with significant droughts in key-rice growing regions. The
dynamics of drought impacts involve a complex interaction between climate, weather,
infrastructure, and human behavior. The ultimate agricultural and societal impacts of
droughts are dependent upon factors such as the timing and severity of the drought. For
example, the 2002 drought was particularly destructive to rice production, affecting
some 300 million people across India, including in some of the most important rice
producing states in India such as Uttar Pradesh, Andhra Pradesh, Punjab, Orissa (now

4
Odisha) and Tamil Nadu. For the country as a whole the monsoon season rainfall was
roughly 20 percent below the historical average mainly due to a significantly dry spell in
July, during which rainfall was 49 percent below the long run average, the largest
monthly rainfall deficiency in recorded history (IMD, 2002).
While decreases in production and productivity may be the most immediate
consequence of droughts, these are often accompanied by lower farm incomes,
increased indebtedness, asset depletion and negative health consequences that
perpetuate already high levels of poverty and malnutrition in India (World Bank, 2008).
Even broader and economy-wide impacts include rapid increases in rice prices that can
increase vulnerability among food-insecure households, and strains of fiscal
expenditures required to offset price increases and operate social protection schemes.
This is disconcerting since evidence suggests that droughts have been occurring with
greater frequency in India since the beginning of the 20th century (World Bank, 2008;
see also EM-DAT4).
Questions remain as to whether existing technologies combined with improved crop
management practices can meet the demands of growing populations under these
increased stresses. The development of DT traits for a variety of crops has been seen
as a potential avenue through which human livelihoods can be at least partially
insulated from the effects of droughts. However, drought resistance has, until recently,
received relatively little attention from plant breeders. For an early example of the failure
to marshal resources around research on drought resistance, see Doering (2005).
Despite significant challenges and early setbacks, research on drought tolerance is
proceeding in both the public and private sectors, and at both the global and national
levels. Many agricultural scientists and development practitioners agree that DT
varieties present a means of avoiding the increasing threat of droughts. An ex ante
assessment by Mottaleb et al. (2012) suggests that the development of such rice
varieties would provide significant benefits, both in terms of economic benefits to
farmers as well as nutritional benefits to consumers, concluding that the monetized
4 EM-DAT: The OFDA/CRED International Disaster Database – www.emdat.net – Université catholique
de Louvain – Brussels – Belgium.

5
benefits of these advances exceed the costs of research and development necessary to
bring these varieties to the market.
This is not to say that the dissemination and adoption of DT rice varieties, once
developed, will be a rapid or straight-forward process. Lybbert and Bell (2010) argue
that the nature of drought—and crop responses to drought—make adoption pathways
for DT varieties more complicated than those for varieties tolerant to other stresses,
particularly insect-resistant crops.5 Among other important differences, they argue that
drought tolerance introduces non-monotonic benefits relative to non-tolerant varieties,
which, as a productivity-enhancing (yield variability reducing) benefit rather than purely
a productivity-increasing (yield increasing) benefit, introduces stochastic-relative benefit
streams that may complicate the decision-making calculus of risk-averse farmers.6 But
the benefits of DT rice may be nearly monotonic, as currently available DT rice varieties
provide farmers with significant yield advantages over conventional varieties even under
severe drought conditions. Thus, their results should perhaps be interpreted as
providing a caveat that there may be a need for interventions in order to expedite the
widespread adoption of DT crops.
While current efforts in developing DT cultivars have resulted in self-pollinating (inbred)
DT varieties, the present study also considers the possibility that drought-tolerance
traits could be embedded in a hybrid background as an alternative solution to
embedding the trait in an inbred (modern or high-yielding) varietal background. The
relative yield advantage of hybrid rice under irrigated systems is well documented, with
some studies estimating hybrids yielding 10-30 percent higher than inbred varieties in
India, China, and Bangladesh (see, e.g., Li et al., 2009; Lin, 1991; Virmani et al., 1982,
2003; Janaiah and Hossain, 2003). Creating hybrid rice with both high yield potential
5 The genetically modified insect-resistant crops referred to here share a similar insect-resistance trait that
is conferred by the introduction of genes from the soil bacterium Bacillus thuringiensis (Bt) into their DNA. While Bt cotton and Bt maize are the largest commercial applications of this technology, Bt has also been introduced into potato, soybeans, and brinjal (eggplant), among other crops. 6 We define a productivity-enhancing benefit as one that either increases yield or reduces yield variability
or yield susceptibility to stress, while a productivity-increasing benefit more narrowly only increases yield. In this regard, productivity-enhancing technologies involve higher-order moments of the yield distribution, while productivity-increasing technologies involve only the first-order moment.

6
and drought resistance could both improve and stabilize yields in drought-prone
environments (Villa et al., 2012).
In addition to the yield potential of hybrid rice is its economic potential for private
innovators. The economic value of hybrids stems from the fact that yield gains conferred
by heterosis decline dramatically after the F1 generation, thus compelling farmers to
purchase new F1 seed each season if they want to continually realize these gains.
These purchases of F1 seed provide innovators—breeders and seed companies—with
a means of recouping their investments in research, while maintaining secrecy over the
hybrid’s pedigree or the high fixed costs of producing hybrids provides the innovators
with a form of protection over their intellectual property.
While hybrid rice in India is still characterized by low rates of adoption (on the order of 6
percent nationally), and while hybrid rice is still fraught with issues such as poor cooking
qualities and variable yield performance, there is a sense that hybrid rice will play an
important role in the future of rice production in India. The Government of India has set
its sights on introducing hybrid rice on 25 percent of all cultivated rice area by 2015:
although this may not be feasible, there are indications of high adoption levels in poorer
northeastern states such as Bihar where 24 percent of farmers had cultivated hybrid
rice at least once as of 2009 (Spielman et al., 2012).
3 Empirical Methodology
Our empirical methodology is based on using experimental choice modeling methods to
analyze farmers’ preferences for seeds among a series of alternatives. Choice modeling
has become an increasingly important mode of studying economic behavior and
demand patterns, since this methodology allows the researcher to estimate marginal
values for various attributes embodied in different goods or services, including non-
market goods and services for which such marginal valuations are difficult or impossible
to measure by examining revealed preferences. In addition, choice modeling allows for
relatively straightforward estimation of welfare effects arising from incremental changes
in the levels of the attributes included in the analysis (Colombo et al., 2008). Within the
agricultural and environmental economics literature, choice experiments have been

7
used extensively for analyzing consumer preferences for environmental amenities (e.g.,
Adamowicz et al., 1994; Boxall et al., 1996; Bennet and Blamey, 2001), food
certification and food safety attributes (e.g., Lusk et al., 2003; Nilsson et al., 2006;
Loureiro and Umberger, 2007; Ubilava and Foster, 2009; Ortega et al., 2009), adoption
of voluntary traceability systems in cow-calf operations (Schulz and Tonsor, 2009), and
quantify welfare effects of various agricultural and food policies (Ortega et al., 2012;
Lusk et al., 2009; Tonsor et al., 2009).
In the context of this study, the use of choice experiments allows us to elicit farmers’
willingness to pay (WTP) for drought tolerance as a characteristic embodied in rice.
Choice experiments represent an empirical application and extension of the theoretical
and conceptual work of Lancaster (1966). It may at first seem inappropriate to use an
empirical approach designed within the context of consumer theory to understand
producer behavior. In fact, such an approach has rarely been attempted with technology
adoption, even though agricultural technologies (especially biotechnologies) are often
differentiated largely on a trait-by-trait basis (Useche et al., 2009). In situations where
there are missing markets or when the traits of a particular technology exhibit non-
monetary effects or otherwise give rise to non-separability, the production and
consumption decisions of the household must be taken simultaneously. Under these
conditions, it is appropriate to view technology adoption decisions as components of a
utility maximization problem, where utility of farm profits is maximized by choosing a
combination of technology attributes amongst a set of feasible alternatives (e.g.,
Useche et al., 2012). By incorporating technology choices, farm production and farm
profits in a utilitarian framework, we are able to analyze the demand for and welfare
implications of traits that affect the variability of expected profits.
Choice experiments closely simulate real world purchasing decisions. In these
experimental settings, consumers are asked to choose among a series of alternative
bundles of attributes. Suppose that individual faces alternatives contained in choice
set during occasion . We can define an underlying latent variable that denotes
the value function associated with individual choosing option during occasion .
For a fixed budget constraint, individual will choose alternative so long as

8
. The researcher does not directly observe
, but instead directly observes
, where
{
(
)
(1)
Following standard practice, we assume that indirect utility is linear, which ensures that
marginal utility is strictly monotonic in traits and yields corner solutions in which only one
good is purchased (Useche et al., 2012). We can write individual ’s indirect utility
function as
(2)
where is a vector of attributes for the th alternative, is a vector of taste
parameters (i.e., a vector of weights mapping attribute levels into utility), and is a
stochastic component of utility that is independently and identically distributed across
individuals and alternative choices, and takes a known distribution. This stochastic
component of utility captures unobserved (to the econometrician) variations in tastes
and errors in consumer’s perceptions and optimization.
The probability of observing (i.e., the consumer chooses option given all other
alternatives in ) can be written
rob ) rob(
) (3)
We assume that the random component of utility follows a Gumbel (extreme value
type I) distribution with cumulative distribution function ( ) ( ) and
corresponding probability density function ) ( ) . Re-
arranging terms in equation (3), we can easily observe that
rob ) rob(
) (4)
Then, under the assumption that are identically and independently
distributed, we can write our expression for the probability of observing alternative j

9
chosen over all other alternatives conditional upon the observed levels of the attribute
vector for all alternatives in the choice set as
rob
) [
]
∑ [ ]
(5)
which can be estimated using maximum likelihood.
Given the utilitarian interpretation of our econometric specification, the vector of
parameters ( ) defining tastes and preferences over the attributes can
be interpreted as marginal utilities. If one of the included attributes (say, the th attribute)
is the cost of the alternative, then can be interpreted as the marginal utility of cost.
With an estimate for the marginal utility of money, WTP for each of the corresponding
attributes can be estimated as
WT
(6)
where is the estimated parameter for the th attribute. The negative sign appears
because the marginal utility of cost is assumed to be negative, while the marginal utility
for favorable attributes will be positive; thus, we must take the negative of this ratio to
ensure that the WTP for a favorable attribute is represented as a positive sum.
Because farmers are heterogeneous, their preferences for drought tolerance will also be
heterogeneous. Within the discrete choice literature, there are several ways for
accounting for preference heterogeneity. A common method of evaluating preference
heterogeneity is estimation of random parameters logit (RPL) models, also called mixed
logit. The RPL is regarded as a highly flexible model that can approximate any random
utility model and relaxes the limitations of the traditional logit by allowing random taste
variation within a sample according to a specified distribution (McFadden and Train,
2000). Under RPL the deterministic component of utility ( ) takes the form of
(7)

10
where we now treat as a vector of random parameters with mean ̅ and variance-
covariance representing individual preferences. Following Train (2003), the
probability that individual chooses alternative from the choice set in situation is
given by
∫ ( )
∑ ( ) ( ) (8)
where the researcher can specify the distribution of the random parameter ( ). If the
parameters are fixed at (non-random), the distribution collapses, i.e. ( ) and
( ) otherwise (Ortega et al., 2012).
4 Data
The data used in this study is derived from household surveys conducted in the state of
Bihar, India (Figure 1). Although roughly 90 percent of the state’s population live in rural
areas (compared with only 72 percent at the national level), Bihar has the highest
population density of any state in India, with an estimated 1,104 persons per square
kilometer as of 2011.7 Bihar also has the lowest state-wise per capita income in India, at
only 35 percent of the national average in 2009-10 (Government of Bihar, 2012).
Because of topographical and climatic conditions, Bihar is vulnerable to meteorological
and hydrological hazards on a recurring basis, particularly flood and droughts. Nearly 50
percent of the total cultivated area in Bihar is prone to these hazards. Bihar’s
vulnerability to droughts has become much more apparent and urgent in recent years.
Though roughly 57 percent of gross rice cropped area is irrigated (in some fashion or
another), a large share of this irrigation infrastructure relies on diesel-powered
tubewells, which significantly increase farmers’ production costs, especially during years
when rainfall is scarce. It seems plausible that the development and delivery of rice
varieties and hybrids that demonstrate resiliency to drought conditions could
significantly reduce output variability and reduce farmers’ vulnerability to these hazards.
7 This ranking excludes Union Territories such as Chandigarh and Delhi, which each have over 9,000
persons per square kilometer.

11
Our sample consists of 576 rice-producing households in rural Bihar. We used a multi-
stage sampling approach to form our survey sample. In the first stage, we selected
three districts heavily dependent upon rice production in which to sample households:
Bhojpur, Madhubani, and Nawada (Figure 1). These three districts provide a great deal
of heterogeneity, not least in terms of geography and agro-ecology. Madhubani and
Nawada are both participants in the Government of India’s Drought-Prone Area
Programme (DPAP) as of 2010, while Bhojpur and Nawada were participants in DPAP
from 2002-2010. All three districts were affected by rainfall deficiencies during kharif
2012: Nawada and Madhubani had rainfall deficiencies of 49 percent and 48 percent,
respectively, while Bhojpur had a rainfall deficiency of 32 percent (India Meteorological
Department, 2012).8 In the second stage, we selected 16 high rice producing blocks
across the three districts. The number of blocks drawn from each district is proportional
to the share of rice production attributable to each district.9 Seven blocks were selected
from Bhojpur, three from Nawada, and six from Madhubani. Within each of these
blocks, we randomly selected two villages from which to draw households. From these
villages, we randomly selected 18 rice growing households from village rosters
prepared by enumerators through door-to-door listing. We therefore have data on 252
households from Bhojpur, 216 households from Madhubani, and 108 households from
Nawada.
For the choice experiment, the alternatives that the individuals were presented are
comprised of varying levels of key attributes that are thought to be the most important
attributes that condition rice seed purchasing decisions. In our particular context, since
we are concerned with farmers’ preferences with regard to rice seed, we are interested
in incorporating the traits that are most important to farmers when deciding on which
seeds to purchase and to cultivate. The attributes included in our choice experiment and
the levels over which they vary were determined through consultation with scientific
8 The kharif season is the monsoon season in India, which lasts from roughly mid-June through the end of
September. 9 These figures are based on average total rice production during 2007-08, 2008-09 and 2009-10. On
average, total rice production was 227,733 (42 percent) tonne in Bhojpur, 118,163 tonne (22 percent) in Nawada, and 196,621 tonne (36 percent) in Madhubani.

12
experts, focus group discussions with farmers, pre-testing choice experiments in the
field, and through careful review of related literature.
Paddy yield was widely identified as the most important attribute that farmers consider
when deciding on which rice variety to cultivate. Since yields are ultimately the result of
both deterministic and stochastic processes, it is possible that farmers consider yields
under both “normal” and drought stress conditions to be important. A study by Dalton et
al. 2011) that explores farmers’ demand for DT maize in Kenya demonstrated drought
tolerance by quantifying yields under different rainfall scenarios, corresponding to maize
varieties with different forms of stochastic dominance relative to a popular local variety:
one in which the improved variety first-order stochastically dominated (FSD) the
reference variety; one in which the improved variety second-order stochastically
dominated (SSD) the reference variety; and a final distribution in which the improved
variety third-order stochastically dominated (TSD) the reference variety.10 Such an
approach involves an attribute (drought tolerance) with three distinctly varying levels
(FSD, SSD, TSD), though the attribute levels are presented as yields under different
rainfall conditions, which simplifies the choice task for the respondent. This offers a
novel method for characterizing drought tolerance (i.e., dehydration tolerance, which is
in contrast to drought escape through a shorter duration to maturity) without necessarily
specifying the pathway by which such tolerance was achieved.
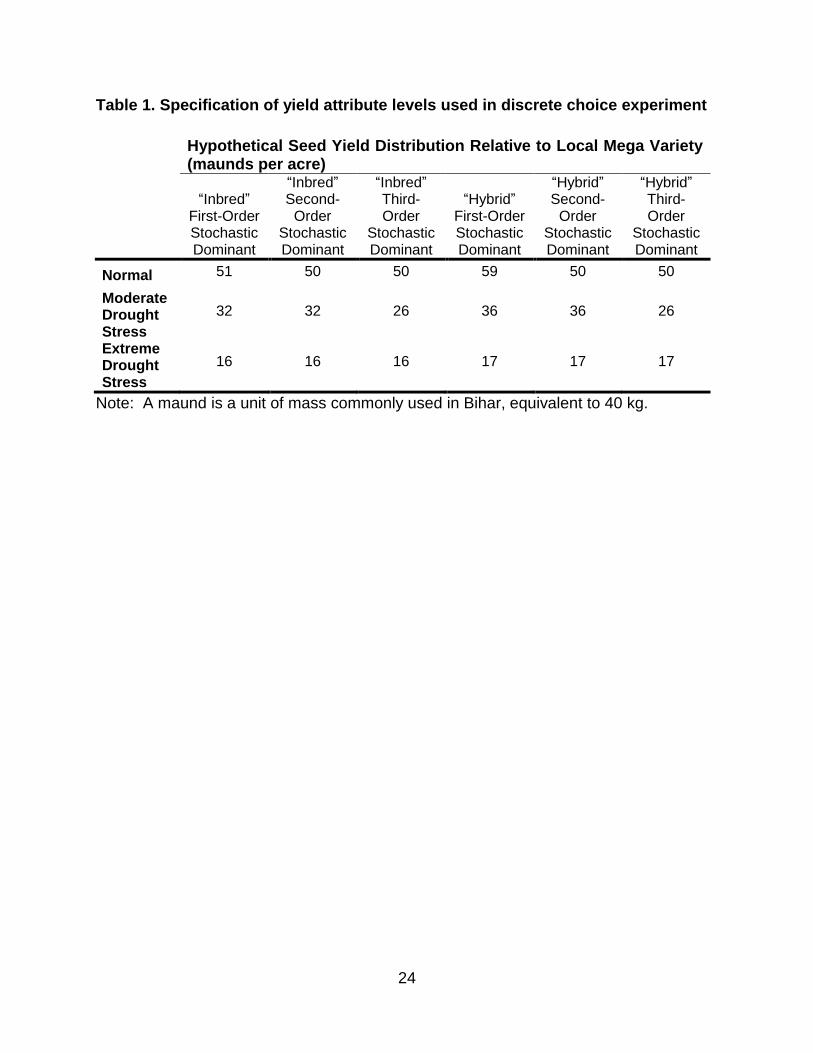
For our study, we have used a similar approach to quantifying drought tolerance. Our
yields under different stress conditions are derived based both on published figures for
a newly-released inbred variety as well as hypothetical yields that may be obtained
through hybridization. Researchers from the International Rice Research Institute (IRRI)
have been actively engaged in research on DT rice, and have released a DT rice variety
(Sahbhagi dhan) for use in Jharkhand and Odisha, which will soon be tested in Bihar.
This variety has been shown to give better yields over check varieties in trials
10
Specifically, the FSD variety had higher yields than the local variety under normal conditions (thereby providing a higher expected yield) as well as under both moderate and severe drought stress conditions (thereby providing lower yield variability). The SSD variety yielded the same as the popular local variety under normal conditions (thus preserving mean or expected yields), but yielded higher under both moderate and severe drought stress. The TSD variety yielded the same as the popular local variety under both normal and moderate stress conditions, but yielded higher under extreme drought stress conditions (thereby providing protection against downside risk).

13
conducted during the 2005-2007 kharif seasons, including under both stressed and non-
stressed conditions. Under severe drought conditions, Sahbhagi dhan provided a 1 t/ha
yield advantage over IR 64 and IR 36, two prominent mega-varieties grown throughout
eastern India. The yield distribution of Sahbhagi dhan under various water stress
conditions has provided important guidance in specifying the yield distributions for
potential inbred varieties presented in our choice experiment.
For hypothetical hybrid DT varieties, we had to consider the yield advantages presented
by heterosis, and consider how such yield advantages might decay with increased
drought stress. Based on personal communication with rice breeders from IRRI, it was
determined that the most optimistic scenario for a hybrid DT rice variety is that it would
yield 15% higher than Sabhagi dhan under normal conditions, but that this yield
advantage would diminish to 10% under moderate drought stress conditions and 5%
under severe drought stress conditions (A. Kumar, pers. comm.). We are therefore able
to specify yield distributions that roughly correspond with inbred and hybrid rice with
differing degrees of stochastic dominance relative to local check varieties. In the actual
choice sets, we do not identify the seeds as either inbred or hybrid, but merely allow for
the attribute to have six different levels. A summary of these different yield attribute
levels is seen in Table 1. We label these as “hybrids” and “inbreds” to reflect the
difference in yield levels, though we note there is nothing inherently hybrid or inbred
about them.
Focus group discussions and consultations with scientists working on DT rice have
indicated the importance of short durations to maturity for farmers in drought-prone
areas, since short durations provide a means of escaping drought. Focus group
discussions with farmers in several districts of Bihar have suggested that short duration
remain important attributes. In our choice experiment, we have incorporated time-to-
harvest, or duration, as an attribute with three distinct levels, corresponding to short
(less than 120 days), medium (120-135 days) and long (greater than 135 days) duration
Specifying drought tolerance through both dehydration tolerance and drought escape
mechanisms allows the researcher to determine which, if either, of these mechanisms
are more valued by farmers, which additionally facilitates cost-benefit analysis that

14
could inform public and private sector research and development programs in the
discovery, development and delivery of DT rice.
Since we are interested in estimating whether demand is sufficient enough to justify
private sector investment in the further development and delivery of DT rice, we also
want to determine whether there are significant differences in the valuation between a
DT hybrid and a DT variety. As previously discussed, heterosis is fully expressed in first
generation seeds, but significantly declines in subsequent generations. Thus, farmers
must typically purchase new hybrid seeds on a seasonal basis in order to obtain the
maximum benefits conferred by heterosis. Inbreds, on the other hand, maintain their
performance for several generations, so harvested grains can generally be stored and
reused as seeds in subsequent years. Therefore to isolate the characteristic of non-
reusability we characterize the choice as one between a seed that can be reused rather
than a seed that cannot. This has been specified as a binary variable equal to 1 if grains
can be stored and used as seeds and 0 otherwise.
We have also included an attribute to capture differences in the seeding rate between
inbreds and hybrids. Hybrids typically have significantly lower seeding rates than do
inbreds, sometimes on the order of 1:3. We specified two levels for the seeding rate, a
low seeding rate (4-6 kg/ha) roughly corresponding to seeding rates for hybrids, and a
high seeding rate (12-16 kg/ha) roughly corresponding to the seeding rates for
conventional inbred varieties. As before, to avoid biasing responses, only the seeding
rate ranges are presented to respondents in the choice sets.
Finally, an additional parameter capturing seed price was included to allow for the
estimation of money metric measures for WTP and welfare comparisons. We have
specified six price levels to be included in our choice sets. The price levels included
have been specified based on cost and returns survey data collected in Bihar as part of
the Cereal Systems Initiative for South Asia (CSISA). The prices roughly correspond to
prices at the 5th, 25th, 40th, 50th, 75th, and 99th percentiles of rice prices in these data.
The actual prices included in the choice sets are Rs.15, 25, 45, 140, 220, and 300.

15
To construct our choice sets, we specified a D-efficient design that takes into account all
main effects as well as interactions between the yield and seeding rate attributes with
the binary reusability variable. The D-efficient design was achieved using a modified
Federov search algorithm, with a full-factorial design constituting the candidate set.
Choice sets were constructed with three alternatives per set, with a fourth option
available to respondents whereby they choose to use the variety of rice they cultivated
in the previous kharif season. Information on these “own varieties” are collected to allow
us to control for attribute levels in the choice analysis.11 To reduce the response burden
on survey respondents and reduce the probability of respondent fatigue, the choice sets
were blocked into four groups of nine choice sets each. Respondents were
subsequently randomly assigned to respond to the choice tasks presented in one of
these four groups, with an even number of households allocated to each of the groups.
Illustrations were included in the choice sets to increase respondents’ comprehension of
the attributes and levels presented in the choice sets. An example of one of the choice
sets is presented in Figure 2.12
In addition to collecting data pursuant to the choice experiments, we also collect data
from a series of experiments designed to ascertain farmers’ risk aversion, loss aversion,
and ambiguity aversion. These experiments proceed along the lines of those in Tanaka
et al. (2010) and Liu (2013).13 As an additional component of this study, a household
survey was conducted to collect information on, among other things, household
characteristics (including demographic and socioeconomic characteristics), agricultural
production, experiences with both positive and negative economic shocks (including
droughts), dietary diversity, food security, role of women in household decision making
and women’s empowerment, and global positioning system (GPS) coordinates. The
11
While such information was used in the following analysis, it was not known during the experimental design, so the design proceeded assuming only three choice alternatives per choice set. By allowing respondents to “opt out” into simply re-using the seed they used last season may introduce status quo bias, we note that only 11 percent of farmers in our sample chose this alternative. Thus, there does not appear to be a systematic over-valuation of the traits in their existing varieties. 12
While Figure 2 is shown in English, the actual choice sets presented to respondents were translated into Hindi to increase respondent comprehension. 13
Tanaka et al. (2010) and Liu (2013) forego the assumptions of expected utility theory (EUT) and allow for preferences adhering to Cumulative Prospect Theory (CPT). There are three parameters that characterize CPT preferences: value function curvature (risk aversion), loss aversion, and a probability weighting parameter. For more information on the experiments conducted, see Ward and Singh (2013).

16
additional information is relevant for further understanding the determinants of WTP,
especially as it pertains to preference heterogeneity, both between and within
households.
5 Results
The results of estimating the random parameters (mixed) logit model represented by
equation (8) are reported in Table 2. Two sets of results are reported: the first set
provides mean values for the marginal utility parameters, while the second set provides
estimates of the standard deviation for the normally distributed parameters. The former
provides us with valuable information on the relative value associated with each of the
attribute levels, while the latter provides us with information regarding the shape of the
parameter distributions, which in turn gives insight into the degree of preference
heterogeneity.
As expected, the marginal utility of price is negative, indicating that farmers generally
prefer cheaper seeds to more expensive seeds. This term can be used to generate
money-metric WTP figures for each of the attribute levels using equation (6). The
estimated WTPs associated with each of these attribute levels are given in Table 3. We
use a parametric bootstrapping procedure (Krinsky and Robb, 1986) to generate 95
percent confidence intervals for these estimates.
There are positive mean marginal utilities and WTPs for each of the six yield distribution
attribute levels. This is as expected, since these yield distributions stochastically
dominate the distributions of mega-varieties commonly grown in eastern India. The
marginal utility of a FSD distribution is higher than that of a SSD distribution, which in
turn is higher than that of a TSD distribution. This result implies that farmers prefer
higher expected yields over and above lower yield variability or protection against low
probability downside risk (similar to Lybbert, 2006).
Additionally, the marginal utility and WTP for the “hybrid” seed distributions are always
and everywhere higher than the marginal utility and WTP for the corresponding “inbred”
distributions. For example, the marginal utility of a FSD “hybrid” yield distribution is
higher than the marginal utility of a FSD “inbred” yield distribution. This not particularly

17
surprising, since, while both exhibit the same degree of stochastic dominance over
check varieties, the “hybrid” yields are higher than the “inbred” yields under all
conditions, so the “hybrid” FSD yield distribution actually also dominates the “inbred”
FSD yield distribution in the first order. But comparing the results of the SSD and TSD
yield distributions provides interesting insights into how farmers value higher moments
of the yield distribution. Consider, for example, the two yield distributions third-order
stochastically dominating the check variety. The two seeds represented by these
distributions have the same expected yield (50 maunds per acre, also the same
expected yield as the check variety) and even the same yield under moderate drought
stress (26 maunds per acre, again also the same as the check variety). Where these
two seeds differ is in how they perform under extreme drought stress. Both yield
significantly more than the check variety: the “hybrid” and “inbred” TSD cultivars yield
17 and 16 maunds/acre, respectively, under extreme drought stress conditions,
compared with the check variety, which yields only 9.1 maunds/acre under extreme
drought stress. But the difference in the yields under extreme stress is rather small
(only 1 maund/acre). So, a priori, one might expect the WTPs for these two yield
distributions to be roughly the same. But this is not the case; the WTPs are quite
different: respondents are willing to pay Rs. 82 for the “hybrid” TSD yield distribution,
but only Rs. 75 for the “inbred” TSD yield distribution. 14 So, other things equal,
respondents on average place a 10 percent premium on the additional maund/acre
provided by the “hybrid” TSD seed under extreme drought stress conditions.
The negative marginal utilities and WTPs of medium and long duration suggest that
farmers prefer short duration cultivars. As the rice cultivar’s duration increases, farmers
demand increasing discounts on seed. For medium duration varieties, farmers demand
a Rs. 7 discount, while for long duration varieties farmers demand a Rs. 25 discount.
Farmers’ preference for short duration has particularly important implications for the
development of new varieties for rice cultivation in rainfed ecosystems. With shorter
duration varieties, farmers can delay transplanting if the monsoon rains are delayed and
still be able to sow the rabi crop (in the case of Bihar, primarily wheat) in time. This
14
We note, however, that this difference is not statistically significant (e.g., see the confidence intervals reported in Table 3).
18
provides farmers with an avenue for dealing with droughts by “escaping” the negative
impacts.
We also find that farmers value being able to save harvested grain and reuse it as seed
in the following kharif season. This attribute is actually quite valuable to farmers, with
farmers willing to pay an additional Rs. 84 for this characteristic. We also find a negative
marginal utility and WTP for the high seeding rate (12-16 kg/acre), indicating that
farmers appreciate the lower seeding rates associated with hybrids, since—other things
equal—a lower seeding rate implies lower input costs. Farmers demand a Rs. 60
discount for seed with these higher seeding rates.
The lower panel of Table 2 demonstrates the heterogeneity in farmers’ preferences for
these various rice seed attributes. The estimated standard error of the distribution of
marginal utility parameters for the “hybrid” FSD yield distribution is larger than any of the
other estimated standard errors, suggesting the greatest degree of preference
heterogeneity for this characteristic. There is also a great deal of heterogeneity in
farmers’ preferences for being able to store grain and reuse as seed. While the mean
valuation of this characteristic is large, there are 24 percent of farmers in the sample
who have a negative WTP for this characteristic. Understanding the sources of
preference heterogeneity can be helpful for market segmentation and potentially
targeting subsidies in order to increase the speed or level of adoption of seeds like
those considered here. For example, to what degree do credit constraints or land
constraints affect preferences? To what degree do household demographics explain
differences in how farmers value these various attributes? Do behavioral parameters
such as risk aversion or loss aversion explain a significant portion of preference
heterogeneity? At present we are unable to address such interesting questions, but
these are avenues of ongoing and future research.
6 Conclusion
In this study, we use discrete choice experiments to examine farmers’ preferences for
DT traits embodied in different rice backgrounds, and model heterogeneity in these
preferences. This research provides a novel analysis of demand heterogeneity that can

19
inform public and private sector strategies for targeting resources—subsidies, vouchers,
coupons, and other such incentives—that can generate demand for a new technology
among risk-averse farmers without necessarily crowding out additional private
investment or otherwise distorting market signals.
Rice farmers were found to prefer short duration rice varieties as well as low seeding
rates. Seed-reusability was a characteristic highly valued by farmers, a trait available
only in self-pollinating inbred rice varieties. We modeled preferences for various yield
distributions and found that farmers prefer higher expected yields over and above lower
yield variability or simply protection against low probability downside risk. These results
can be used to inform public and private sector investment in the discovery,
development, and delivery of DT rice varieties. For example, future efforts to develop
DT cultivars should consider this finding when conducting cost-benefit analysis for
future investments into research and development of these technologies, weighing the
additional costs of developing varieties that perform well in all conditions against the
additional revenue that could be generated by such sales.
Additionally, while this study focuses on rice in Bihar province, we provide a
methodological toolkit to motivate similar studies that address abiotic stresses
characterized by similar patterns of occurrence and learning among farmers such as
submergence, salinity, excessive heat, and excessive cold for rice and other crops in
developing countries.

20
References
Adamowicz, W., J. Louviere, and M. Williams (1994). Combining revealed and stated
preference methods for valuing environmental amenities. Journal of Environmental
Economics and Management 26, 271–292.
Bennett, J. and R. Blamey (2001). The choice modeling approach to environmental
valuation (Northampton, MA: Elgar Publishing).
Boxall, P.C., W.L. Adamowicz, J. Swait, M. Williams, J. Louviere (1996). A comparison
of stated preference methods for environmental valuation. Ecological Economics
18(3), 243—253.
Colombo, S., Hanley, N., & Louviere, J. (2008). Modelling Preference Heterogenity in
Stated Choice Data: An Analysis for Public Goods Generated by Agriculture.
University of Stirling Economics Discussion Paper 28.
Doering, D.S. (2005). Public–private partnership to develop and deliver drought tolerant
crops to food-insecure farmers. The Drought Tolerant Crop Initiative, Winrock
International: Arlington, VA.
Evenson, R. and D. Gollin (2003). Assessing the impact of the Green Revolution, 1960-
2000. Science (300), 758—762.
Government of Bihar (2012). Economic Survey 2010-11. Government of Bihar Finance
Department.
Hazell, P.B.R. (2010). The Asian Green Revolution. In: D.J. Spielman, and R. Pandya-
Lorch, eds., Proven Successes in Agricultural Development: A Technical
Compendium to Millions Fed. Washington, DC: IFPRI.
Holt, C.A. and S.K. Laury (2002). Risk aversion and incentive effects. American
Economic Review 92(5), 1644-1655.
IMD (2002). Southwest Monsoon 2002 end-of-season report. India Meteorological
Department. Available online at http://www.imd.gov.in/section/nhac/dynamic/mid.htm.

21
Janaiah, A., and M. Hossain. 2003. Can hybrid rice technology help productivity growth
in Asian tropics? Farmers’ experiences. Economic and Political Weekly 38(25): 2492-
2501.
Kolady, D. and W. Lesser (2006). Is it feasible to provide genetically modified crops to
small farmers on preferential terms? An ex ante analysis of Bt eggplant in India.
Selected paper for presentation at the American Agricultural Economics Association
Annual Meeting, Long Beach, CA, 23-26 July 2006.
Krinsky, I. and A. Robb (1986). On approximating the statistical properties of
elasticities. The Review of Economics and Statistics 68(4), 715—719.
Kumar, A., J. Bernier, S. Verulkar, H.R. Lafitte, and G.N. Atlin (2008). Breeding for
drought tolerance: direct selection for yield, response to selection and use of drought-
tolerant donors in upland and lowland-adapted populations. Field Crops Research
107(3), 221—231.
Lancaster, K. (1966). A new approach to consumer theory. Journal of Political Economy
74(2), 132—157.
Li, J., Y. Xin, and L. Yuan. 2009. Hybrid rice technology development: Ensuring China’s
food security. In: D.J. Spielman, and R. Pandya-Lorch, eds., Proven Successes in
Agricultural Development: A Technical Compendium to Millions Fed. Washington,
DC: IFPRI.
Loureiro, M.L. and W.J. Umberger (2007). A choice experiment model for beef: what US
consumer responses tell us about relative preferences for food safety, country-of-
origin labeling and traceability. Food Policy 32(4), 496—514.
Lusk, J.L., Norwood, F.B., and Pruitt, J.R. (2006). Consumer Demand for a Ban on
Antibiotic Drug Use in Pork Production. American Journal of Agricultural Economics,
88 1015-1033.
Lybbert, T.J. 2006). Indian farmers’ valuation of yield distributions: Will poor farmers
value pro-poor seeds? Food Policy 31(5), 415—441.
Lybbert, T.J. and A. Bell (2010). Stochastic benefit streams, learning, and technology
diffusion: Why drought tolerance is not the new Bt. AgBioForum 13(1), 13—24.

22
McFadden, D. and K. Train (2000). Mixed MNL models for discrete response. Journal of
Applied Econometrics, 15(5), 447-470.
Mottaleb, K.A., R.M. Rejesus, S. Mohanty, M.V.R. Murty, T. Li, H.G. Valera and M.K.
Gumma 2012). “Ex ante assessment of a drought tolerant rice variety in the
presence of climate change.” Selected paper prepared for presentation at the 2012
annual meeting of the Agricultural and Applied Economics Association (AAEA) in
Seattle, Washington, USA.
Olynk, N.J., C.A. Wolf and G.T. Tonsor (2012). Production technology option value: the
case of rbST in Michigan. Agricultural Economics, forthcoming.
Ortega, D.L., H. H. Wang, L. Wu, N. Olynk, and J. Bai 2012). Chinese Consumers’
Demand for Food Safety Attributes: A Push for Government and Industry
Regulations. American Journal of Agricultural Economics, 94(2), 489-435.
Pandey, S., H. Bhandari, and B. Hardy (Eds.) (2007). Economic costs of drought and
rice farmers’ coping mechanisms: a cross-country comparative analysis (Los Banos,
Philippines: International Rice Research Institute).
Schulz, L. and G.T. Tonsor (2010). Cow-Calf Producer Preferences for Voluntary
Traceability Systems. Journal of Agricultural Economics 61, 138-162.
Serraj, R., A. Kumar, K.L, McNally, I. Slamet-Loedin, R. Bruskewich, R. Mauleon, J.
Cairns, and R.J. Hijmans (2009). Improvement of drought resistance in rice.
Advances in Agronomy 103, 41—99.
Spielman, D.J., D. Kolady, P. Ward, H. Ar-Rashid, and K. Gulati. 2012 (forthcoming).
Public Expenditures, Private Incentives, and Technology Adoption: The Economics of
Hybrid Rice in South Asia. IFPRI discussion paper, Washington, DC: IFPRI.
Tonsor, G.T., N. Olynk, C. Wolf (2009). Consumer Preferences for Animal Welfare
Attributes: The Case of Gestation Crates. Journal of Agricultural and Applied
Economics 41 (3), 713-730.
Train, K. E. (2003). Discrete Choice Methods with Simulation. Cambridge Books.
Cambridge University Press.

23
Useche, P., B.L. Barham, and J.D. Foltz (2012). Trait-based adoption models using ex-
ante and ex-post approaches. American Journal of Agricultural Economics [in press],
doi:10.1093/ajae/aas044.
Ubilava, D. and K.A. Foster (2009). Quality certification vs. product traceability:
Consumer preferences for informational attributes of pork in Georgia. Food Policy
34(3), 305-310.
Ward, P.S. and V. Singh (2013). Risk and ambiguity preferences and the adoption of new agricultural technologies: Evidence from field experiments in Rural India. Paper selected for presentation at the Agricultural and Applied Economics Association 2013 AAEA & CAES Joint Annual Meeting, Washington, D.C., August 4-6, 2013.
Villa, J.E., A. Henry, F. Xie, and R. Serraj (2012). Hybrid rice performance in
environments of increasing drought severity. Field Crops Research 125, 14—24.
Virmani, S., R. Aquino, and G. Khush (1982). Heterosis breeding in rice (Oryza sativa
L.). Theoretical and Applied Genetics 63(4), 373—380.
24
Table 1. Specification of yield attribute levels used in discrete choice experiment
Hypothetical Seed Yield Distribution Relative to Local Mega Variety (maunds per acre)
“Inbred” First-Order Stochastic Dominant
“Inbred” Second-
Order Stochastic Dominant
“Inbred” Third-Order
Stochastic Dominant
“Hybrid” First-Order Stochastic Dominant
“Hybrid” Second-
Order Stochastic Dominant
“Hybrid” Third-Order
Stochastic Dominant
Normal 51 50 50 59 50 50
Moderate Drought Stress
32 32 26 36 36 26
Extreme Drought Stress
16 16 16 17 17 17
Note: A maund is a unit of mass commonly used in Bihar, equivalent to 40 kg.

25
Table 2. Random parameters logit results
Attribute level Estimate
Std. Error
Yields 51, 32, 16‡ maunds/acre ("Inbred" FSD)
1.1016 *** 0.0829
Yields 50, 32, 16‡ maunds/acre ("Inbred" SSD)
0.9331 *** 0.0805
Yields 50, 26, 16‡ maunds/acre ("Inbred" TSD)
0.8377 *** 0.0857
Yields 59, 36, 17‡ maunds/acre ("Hybrid" FSD)
1.6651 *** 0.1066
Yields 50, 36, 17‡ maunds/acre ("Hybrid" SSD)
1.0809 *** 0.0939
Yields 50, 26, 17‡ maunds/acre ("Hybrid" TSD)
0.9220 *** 0.8910
Medium duration (120-135 days) -0.1020 * 0.0590
Long duration (more than 135 days) -0.2744 *** 0.0532
Grain can be stored and reused as seed 0.9416 *** 0.0754
High seeding rate (12-16 kg/acre) -0.6730 *** 0.0513
Price (Rs.) -0.0112 *** 0.0003
Distribution Parameters Estimate
Std. Error
Std. Deviation ("Inbred" FSD) 0.4323 *** 0.1444
Std. Deviation ("Inbred" SSD) 0.1541 0.2161
Std. Deviation ("Inbred" TSD) 0.4468 *** 0.1517
Std. Deviation ("Hybrid" FSD) 1.4326 *** 0.1204
Std. Deviation ("Hybrid" SSD) 0.8457 *** 0.1338
Std. Deviation ("Hybrid" TSD) 0.3987 *** 0.2310
Std. Deviation (Medium Duration) 0.8450 *** 0.0632
Std. Deviation (Long Duration) 0.4219 *** 0.0890 Std.Deviation (Grain can be stored and reused as seed) 1.3463 *** 0.0804
Std. Deviation (High Seeding Rate)) 0.6428 *** 0.0650
Note: * Significant at 10% level; ** Significant at 5% level; *** Significant at 1% level.
‡These figures correspond to yields under normal conditions, moderate drought stress conditions, and
extreme drought stress conditions, respectively.

26
Table 3. Estimated willingness to pay for rice seed attributes
WTP
Lower 2.5% Mean Upper 2.5% Yields 51, 32, 16 maunds/acre ("Inbred" FSD) 83.85 98.10 112.32
Yields 50, 32, 16 maunds/acre ("Inbred" SSD) 68.57 83.24 97.91
Yields 50, 26, 16 maunds/acre ("Inbred" TSD) 59.06 74.55 89.19
Yields 59, 36, 17 maunds/acre ("Hybrid" FSD) 130.08 148.17 168.08
Yields 50, 36, 17 maunds/acre ("Hybrid" SSD) 79.04 96.76 113.05
Yields 50, 26, 17 maunds/acre ("Hybrid" TSD) 66.11 81.86 97.62
Medium duration (120-135 days) -19.23 -8.76 0.23
Long duration (more than 135 days) -34.16 -24.55 -15.73
Grain can be stored and reused as seed 71.10 84.00 97.70
High seeding rate (12-16 kg/acre) -68.58 -59.93 -50.95
Note: Confidence intervals derived using parametric bootstrap procedure introduced in Krinsky and Robb
(1986).

27
Figure 1. Location of sample districts

28
Figure 2. Example of choice set presented to survey respondents