Assessment of anthropogenic sources of pollution along ...
21
International Journal of Environmental Pollution and Environmental Modelling, Vol. 3(3): 83-103 (2020) (Original Paper) 83 Assessment of anthropogenic sources of pollution along Mazai and Matsheumhlope streams in Bulawayo, Zimbabwe using GIS and Remote Sensing tools Cinderrella Ndlovu 1 , Canisius Mpala 1* 1 Lupane State University, Faculty of Agricultural Sciences, Department of Crop and Soil Sciences, P. O. Box 170, Lupane, Zimbabwe. E-Mail: [email protected], [email protected] Abstract: In recent years, global water pollution has been largely attributed to anthropogenic activities such as mining, agriculture, industrial activities and domestic effluent. In the case of Mazai and Matsheumhlope streams in Bulawayo, Zimbabwe, manufacturing industries in the surrounding areas are known to discharge partially treated effluent into the two streams. These two streams are tributaries to Umguza River, which is used by local communities for irrigation and domestic purposes. Pollutants carried by these two streams negatively affect the quality of the streams causing a deterioration in the health of Umguza River and Dam. This study aimed at investigating anthropogenic sources of pollution along the two streams. Water samples were collected from May 2016 to April 2017 and tested for permanganate value, chemical oxygen demand, nitrates, ammonia, phosphates, electrical conductivity, pH, total dissolved solids and suspended solids. The results were compared to EMA SI 6 Regulations on Effluent and Solid Waste Disposal. Results were divided into the wet and dry season. The physico- chemical parameters of the two streams were analysed for Analysis of Variance. The results showed that the streams had no significant influence on all the parameters except for pH (p<0.05). The seasons had a significant influence on the levels of ammonia, suspended solids, nitrates and pH. A GIS application QGIS, was used to generate maps using the selected parameters to display levels of pollution. The results showed that the industrial and sewage effluent significantly affect the water quality of the two streams. The study recommends that pollution hotspots indicated by the study be further investigated and given more attention to curb the release of pollutants in the two streams. Keywords: Urban streams, anthropogenic activities, pollution, GIS INTRODUCTION The rapid global growth in social and economic development has come with environmental pollution problems such as water pollution, a vital threat to human health and the environment [25] . Impacts of human activities on surface water quality are through effluent and sewage discharges, use of agricultural chemicals, in addition to the increased exploitation of water resources [1] . With prevailing economic situations in Zimbabwe, most trade effluent is released into the environment untreated or partially treated into urban streams. Cases of sewage effluent impacts are evident in the form of serious eutrophication in lake Chivero in Harare which receives polluted water from its tributary, Marimba River [17,18] . High nutrient concentrations in Chinyika River, a tributary of Mazowe River were found because of sewage inflows [6] . A study done by [7] in Mazai River in Bulawayo showed how industrial effluent significantly contributed to a high percentage of pollutants. Bulawayo has a long history of polluting public streams. Manufacturing industries are the primary sources of pollution, producing tonnes of effluent and releasing it into public streams [7] . As a result, the two streams that are meant for surface runoff during the rainy season are found flowing throughout the year. Regulating effluent discharges from industries and sewage works into the two tributaries Mazai and Matsheumhlope could significantly reduce pollution risks in Umguza Dam. There is need to curb the accumulation of pollutants to levels that cannot be naturally controlled through self-purification. Pollutant releasing sites that are less than 10 kilometres from Umguza Dam should be considered that make self-purification of the streams difficult [11,] . In addition to physical, chemical and biological monitoring, Geographic Information Systems (GIS) and Remote Sensing are amongst the most useful approaches in water quality monitoring [5] . The study therefore investigated anthropogenic sources of pollution along Mazai and Matsheumhlope Streams using GIS and Remote sensing tools. * Corresponding E-mail: [email protected] or [email protected]
Transcript of Assessment of anthropogenic sources of pollution along ...

International Journal of Environmental Pollution and Environmental Modelling, Vol. 3(3): 83-103 (2020)
(Original Paper)
83
Assessment of anthropogenic sources of pollution along Mazai and Matsheumhlope streams in Bulawayo, Zimbabwe using GIS and Remote Sensing tools
Cinderrella Ndlovu1, Canisius Mpala1*
1 Lupane State University, Faculty of Agricultural Sciences, Department of Crop and Soil Sciences, P. O. Box 170, Lupane, Zimbabwe. E-Mail: [email protected], [email protected] Abstract: In recent years, global water pollution has been largely attributed to anthropogenic activities such as mining, agriculture, industrial activities and domestic effluent. In the case of Mazai and Matsheumhlope streams in Bulawayo, Zimbabwe, manufacturing industries in the surrounding areas are known to discharge partially treated effluent into the two streams. These two streams are tributaries to Umguza River, which is used by local communities for irrigation and domestic purposes. Pollutants carried by these two streams negatively affect the quality of the streams causing a deterioration in the health of Umguza River and Dam. This study aimed at investigating anthropogenic sources of pollution along the two streams. Water samples were collected from May 2016 to April 2017 and tested for permanganate value, chemical oxygen demand, nitrates, ammonia, phosphates, electrical conductivity, pH, total dissolved solids and suspended solids. The results were compared to EMA SI 6 Regulations on Effluent and Solid Waste Disposal. Results were divided into the wet and dry season. The physico-chemical parameters of the two streams were analysed for Analysis of Variance. The results showed that the streams had no significant influence on all the parameters except for pH (p<0.05). The seasons had a significant influence on the levels of ammonia, suspended solids, nitrates and pH. A GIS application QGIS, was used to generate maps using the selected parameters to display levels of pollution. The results showed that the industrial and sewage effluent significantly affect the water quality of the two streams. The study recommends that pollution hotspots indicated by the study be further investigated and given more attention to curb the release of pollutants in the two streams. Keywords: Urban streams, anthropogenic activities, pollution, GIS INTRODUCTION
The rapid global growth in social and economic development has come with environmental pollution problems such as water pollution, a vital threat to human health and the environment [25]. Impacts of human activities on surface water quality are through effluent and sewage discharges, use of agricultural chemicals, in addition to the increased exploitation of water resources [1]. With prevailing economic situations in Zimbabwe, most trade effluent is released into the environment untreated or partially treated into urban streams. Cases of sewage effluent impacts are evident in the form of serious eutrophication in lake Chivero in Harare which receives polluted water from its tributary, Marimba River [17,18]. High nutrient concentrations in Chinyika River, a tributary of Mazowe River were found because of sewage inflows [6]. A study done by [7] in Mazai River in Bulawayo showed how industrial effluent significantly contributed to a high percentage of pollutants.
Bulawayo has a long history of polluting public streams. Manufacturing industries are the primary sources of pollution, producing tonnes of effluent and releasing it into public streams [7]. As a result, the two streams that are meant for surface runoff during the rainy season are found flowing throughout the year. Regulating effluent discharges from industries and sewage works into the two tributaries Mazai and Matsheumhlope could significantly reduce pollution risks in Umguza Dam. There is need to curb the accumulation of pollutants to levels that cannot be naturally controlled through self-purification. Pollutant releasing sites that are less than 10 kilometres from Umguza Dam should be considered that make self-purification of the streams difficult [11,]. In addition to physical, chemical and biological monitoring, Geographic Information Systems (GIS) and Remote Sensing are amongst the most useful approaches in water quality monitoring [5]. The study therefore investigated anthropogenic sources of pollution along Mazai and Matsheumhlope Streams using GIS and Remote sensing tools.
*Corresponding E-mail: [email protected] or [email protected]

International Journal of Environmental Pollution and Environmental Modelling, Vol. 3(3): 83-103 (2020)
84
Water quality According to ZINWA, water pollution is defined as the discharge of any liquid, solid, gaseous,
pathogenic organisms or other substances into the water as will or is likely to create a nuisance or to render such water harmful, detrimental or injurious to the health, safety or welfare of the public and the environment [10]. The term can therefore be used to refer to the physical, chemical and microbiological properties of water and its fitness for use [5]. Deteriorating water quality is a global problem especially in catchments that drain from urban areas. Poor water quality increases treatment costs of potable and industrial water and decreases agricultural yields because of increased impurities in irrigation water. The effects of consumption of water with poor quality has an effect on human health, aquatic ecosystem (aquatic biota, and in-stream and riparian habitats) as well as various sectors of the economy, including agriculture, industry and recreation and can have varied disastrous consequences. Due to the heavy pollution of the two tributaries to Umguza Dam, water in this dam has been found to be unfit for crop production due to the high levels of heavy metals such as cadmium [23]. The Environmental Agency (Effluent and Solids Waste) Regulations Statutory Instrument of 2007, stipulates the acceptable limits of the various parameters under analysis and these limits are colour classified. These include blue, green, yellow and red permits, in which the red permit is the most extreme and the blue permit the least extreme. Physical and chemical water quality monitoring
Physical parameters define those characteristics of water that respond to the sense of sight, touch, taste or smell [2], whereas chemical characteristics are those that are to do with the chemical composition of water. Physical parameters include turbidity, temperature, dissolved and suspended solids as well as electrical conductivity, total dissolved solids and suspended solids which were used in this study. For chemical monitoring, chemical oxygen demand (COD, permanganate value (PV), dissolved oxygen (DO), chlorides, nitrates, phosphates and ammonia. MATERIALS AND METHODS Study site description
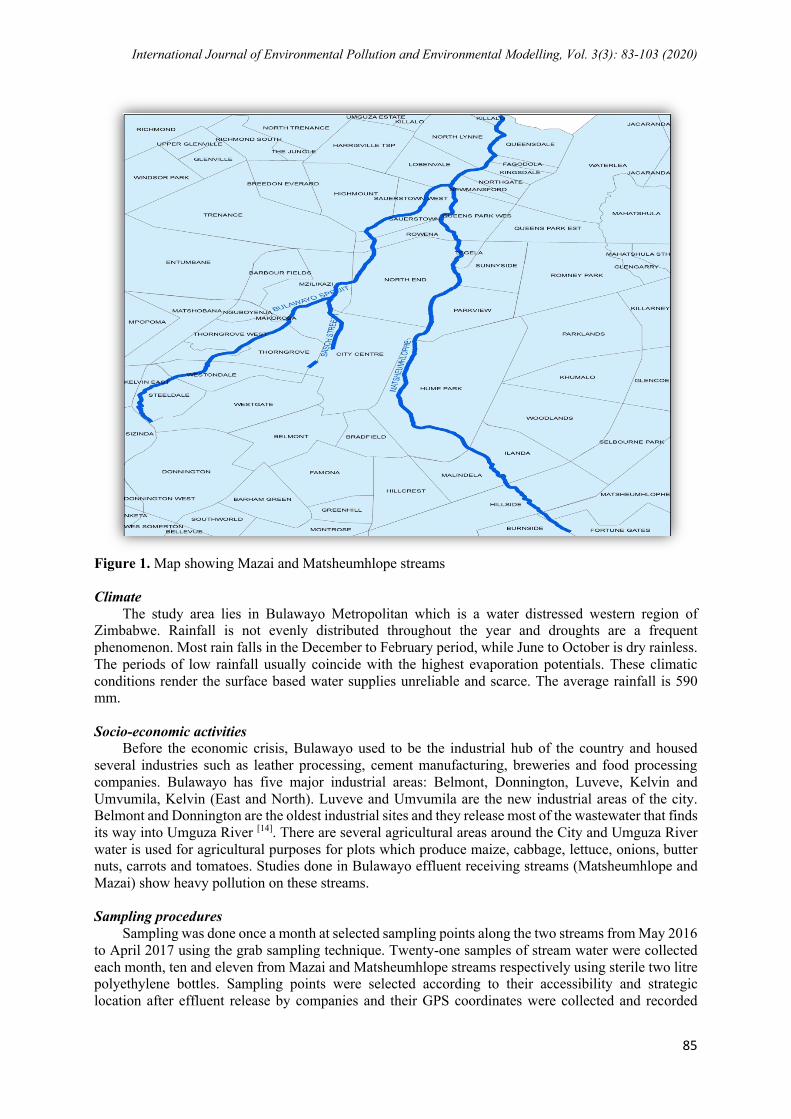
The Matsheumhlope Stream flows from Burnside, through the Hillside Dams Conservancy before it reaches the Belmont Industrial Site, where it collects industrial effluent. It passes through the eastern side of the Central Business District and then joins Mazai Stream in Sauerstown, which flows to Umguza River. Matsheumhlope Stream was converted from a natural stream to a canal by the Bulawayo City Council and it is supposed to collect surface runoff during the rainy season. However, it also collects waste water from industries in Belmont Industrial Site. Matsheumhlope Stream joins with Mazai Stream, which is also heavily polluted and flows into Umguza River. Mazai Stream runs from Donnington, past Belmont, Steeldale, Thorngrove Industrial areas and Thorngrove Sewage Treatment Works. It eventually passes through Renkini Long Distance Bus Terminus, Makokoba, Mzilikazi and Trenance residential areas to join Matsheumhlope Stream and flows into Umguza River [14]. Figure 1 shows the location of the two streams.
International Journal of Environmental Pollution and Environmental Modelling, Vol. 3(3): 83-103 (2020)
85
Figure 1. Map showing Mazai and Matsheumhlope streams Climate
The study area lies in Bulawayo Metropolitan which is a water distressed western region of Zimbabwe. Rainfall is not evenly distributed throughout the year and droughts are a frequent phenomenon. Most rain falls in the December to February period, while June to October is dry rainless. The periods of low rainfall usually coincide with the highest evaporation potentials. These climatic conditions render the surface based water supplies unreliable and scarce. The average rainfall is 590 mm. Socio-economic activities
Before the economic crisis, Bulawayo used to be the industrial hub of the country and housed several industries such as leather processing, cement manufacturing, breweries and food processing companies. Bulawayo has five major industrial areas: Belmont, Donnington, Luveve, Kelvin and Umvumila, Kelvin (East and North). Luveve and Umvumila are the new industrial areas of the city. Belmont and Donnington are the oldest industrial sites and they release most of the wastewater that finds its way into Umguza River [14]. There are several agricultural areas around the City and Umguza River water is used for agricultural purposes for plots which produce maize, cabbage, lettuce, onions, butter nuts, carrots and tomatoes. Studies done in Bulawayo effluent receiving streams (Matsheumhlope and Mazai) show heavy pollution on these streams. Sampling procedures
Sampling was done once a month at selected sampling points along the two streams from May 2016 to April 2017 using the grab sampling technique. Twenty-one samples of stream water were collected each month, ten and eleven from Mazai and Matsheumhlope streams respectively using sterile two litre polyethylene bottles. Sampling points were selected according to their accessibility and strategic location after effluent release by companies and their GPS coordinates were collected and recorded

International Journal of Environmental Pollution and Environmental Modelling, Vol. 3(3): 83-103 (2020)
86
using a Garmin GPS device. Chemical analysis of the samples was done within 24 hours after sampling at Thorngrove Water Pollution Control Laboratory in Bulawayo. The description of sampling points and their GPS coordinates are shown in Table 1 and 2.
Table 1. Matsheumhlope (Bulawayo Canals) sampling points
Sampling Point
GPS Coordinates Stream Location Description
Latitude Longitude BCOD2 20°11'5.61"S 28°33'21.39"
E Bulawayo Canal /Matsheumhlope
Wolverampton Road open drain near Hunyani
BCOD3 20°10'59.96"S
28°33'16.77"E
Bulawayo Canal / Matsheumhlope
Bilston Street open drain near Steelforce Factory
BCOD4 20°10'44.17"S
28°33'23.01"E
Bulawayo Canal / Matsheumhlope
Public drain along South perimeter of Old Cold Storage Company
BC1 20°10'23.94"S
28°33'37.92"E
Bulawayo Canal / Matsheumhlope
Birkenhead Road West
BC2 20°10'6.07"S 28°34'37.11"E
Bulawayo Canal / Matsheumhlope
Tributary from Belmont South Bridge
BC3 20°10'4.57"S 20° 9'59.56"S Bulawayo Canal / Matsheumhlope
Bulawayo Canal opposite Radiator and Tinning Factory
BC4 20° 9'57.06"S 28°35'13.18"E
Bulawayo Canal / Matsheumhlope
Lochlion Outlets Showgrounds
BC4.2 20° '23.41"S 28°35'29.87"E
Bulawayo Canal / Matsheumhlope
L. Takawira Avenue Bridge
BC5 20° '54.91"S 28°35'36.16"E
Bulawayo Canal / Matsheumhlope
Hume Park Weir Outlet Harare Road
BC6 20°7'37.89"S
28°35'59.35"E
Bulawayo Canal / Matsheumhlope
Airport Road near Ikes Garage
BC7 20° '18.23"S 28°35'57.05"E
Bulawayo Canal / Matsheumhlope
Before Confluence with Bulawayo Spruit/ Syringa Avenue
Table 2. Mazai Stream (Bulawayo Spruit) sampling points
Sampling point
GPS coordinates Stream location
Description
Latitude Longitude BS1 20° 9'27.79"S 28°33'6.97"E Bulawayo
Spruit (Mazai) Tributary Steelworks Road Bridge near Stuttaford
BS2 20° 9'20.57"S 28°33'25.22"E Bulawayo Spruit (Mazai)
Magazine Road Bridge
BS2.0 20° 9'27.90"S 28°33'27.65"E Bulawayo Spruit (Mazai)
Canal Steelworks Road near Ingwebu Breweries (effluent plant)
BS3 20° 9'4.80"S 28°33'37.11"E Bulawayo Spruit (Mazai)
Tributary Mpopoma Railway Station Road
BS 10.1 20° 8'56.12"S 28°33'49.24"E Bulawayo Spruit (Mazai)
Canal Westerham Road/ Thorngrove Water Works
BS 4.1-
Renkini
20° 8'33.84"S 28°34'16.03"E Bulawayo Spruit (Mazai)
Old Falls Road Bridge
BS Lotshe In 20° 8'30.38"S 28°34'47.14"E Bulawayo Spruit (Mazai)
Canal opposite Getrude Mc Intyre Hostels
BS Lotshe
Out 20° 8'9.78"S 28°34'40.17"
E Bulawayo Spruit (Mazai)
Old Falls Road Bridge below Lotshe Primary School
BS4 20° '51.86"S 28°34'57.71"E
Bulawayo Spruit (Mazai)
Flow Gauging Weir Cremotorium
BS5 20° '17.00"S 28°35'54.14"E
Bulawayo Spruit (Mazai)
Before confluence with Matsheumhlope Stream

International Journal of Environmental Pollution and Environmental Modelling, Vol. 3(3): 83-103 (2020)
87
Samples were analysed for COD, PV, nitrates, phosphates, ammonia, suspended solids and TDS.
pH, DO and electrical conductivity were measured onsite. GPS coordinates were used to map sampling points along the two streams. Data for physico-chemical parameters from Microsoft Excel was used in interpolation to produce maps showing spatial variations of parameters showing significant differences in Genstat Discovery. RESULTS Water quality status of Matsheumhlope and Mazai River based on physic-chemical parameters pH
The pH values at all sites along the stream ranged from 4.27 to 12 which fell in the blue category of SI 6 regulations hence considered safe for the environment. The wet season, Matsheumhlope stream pH values ranged from 7 to 8.5, whilst the dry season values ranged from 6.9 to 8.3, with an average pH of 7.8 and 7,5 for the wet and dry season respectively. The Mazai stream dry season pH values ranged from 6.7 to 7.5, with an average of 7.1, whilst the wet season ranged from 7.4 to 7.7 with an average of 7.7.
Electrical Conductivity
Average electrical conductivity values for Matsheumhlope and Mazai streams in the wet season were 121.3 mS/cm and 115 mS/cm respectively and 91 and 113 mS/cm for the dry season. Similar to the pH trend, the results showed higher conductivity during the wet season compared to the dry season and fell in the blue category.
Total Dissolved Solids
Average TDS values in the wet season were 568 and 597 mg/l for Matsheumhlope and Mazai streams respectively. The values ranged between 298 and 635, 275-1322 in the dry season. TDS values were higher in the dry season compared to the wet season. Figure 6, shows the EC and TDS seasonal trends in Matsheumhlope Stream.
Suspended Solids
Both Matsheumhlope and Mazai streams had higher SS values during the dry season compared to the wet season. In the dry season, Mazai Stream had 128.4mg/l (>101) hence it fell in the red category and Matsheumhlope stream had 95.9 mg/l (yellow category). The wet season Matsheumhlope and Mazai stream SS values were 58.9 and 80 mg/l respectively (Table 3 and 4). Table 3. Matsheumhlope Stream physical parameter results
Sampling point
pH Conductivity TDS SS Dry Wet Dry Wet Dry Wet Dry Dry
BCOD2 6.9 8.1 90.4 166 462.3 854.4 194.8 77.8 BCOD3 7.1 8.3 92.2 163.4 466.7 851.6 180.8 66.2 BCOD4 7.2 7.2 57.9 276.2 298.3 1322.4 47.8 179.8 BC1 7.5 8.0 123.6 144.5 635.8 606.2 360 88.8 BC2 8.3 8.5 64.1 56.2 325.3 275.8 11.7 17 BC3 7.9 8.1 68.4 72.1 375.3 413.7 37.3 22.2 BC4 7.6 8.1 87.1 72.5 470.5 415.5 82.2 25.5 BC4.2 7.7 7.7 109.1 72.8 549.8 357 18.3 14.3 BC5 7.71 7.6 111.4 145.6 534 342 20 12.2

International Journal of Environmental Pollution and Environmental Modelling, Vol. 3(3): 83-103 (2020)
88
BC6 7.7 7 94.6 85.6 465.5 420.8 8.7 92.8
Table 4. Mazai stream physical parameter results Sampling point
pH Conductivity TDS SS Dry Wet Dry Wet Dry Wet Dry Wet
BS1 7.54 7.61 235.2 136.6 1156.2 737.2 30.2 14.5
BS2 7.17 7.89
5 70 94.9 366.5 497 33.8 39.5
BS2.0 6.8 8.9 67.3 168.
2 336.8 856 168.
2 82.5
BS3 7.4 7.6 134.
1 119.
8 637.3 620.
7 95.8 52.5
BS10.1 7.1 7.5 104 103 466 500 159.
8 193.
2
BS4.1 6.7 7.4 109.
1 103.
2 590.3 528.
5 230 120.
2
BSLi 6.9 7.7 86.6 105.
5 440.9 522.
7 30.5 29.8
BSLo 7.3 7.8 132.
4 114.
9 658.5 601.
7 70.8 32.2
BS4 7.2 7.5 107.
4 108 544.5 562.
7 283.
8 134.
5
BS5 7.2 7.5 93.6 101.
7 452.66
7 546.
5 180.
7 100.
8
COD Average COD values for Matsheumhlope Stream ranged from 1661 mg/l to 18.5 mg/l with the
highest COD value obtained at BCOD4 and the lowest at BC2.In the wet season, Matsheumhlope and Mazai streams had COD values of 296.3mg/l and 334.5 mg/l respectively. Mazai and Matsheumhlope streams COD average values were 346.5 mg/l and 334.5mg/l respectively. The highest COD value in Mazai stream was obtained at BS2 Bulawayo Spruit) and the lowest at BSlotshe in.
Permanganate Value
The study showed that the wet and dry season lowest PV value was 4.2 mg/l, obtained at sampling point BC2 and the highest was 594.3 mg/l obtained at BCOD4 as shown in Table 4.10. The average PV values for the wet season for Mazai and Matsheumhlope streams was 24 mg/l (yellow category) and 74 mg/l (red category) respectively. In the dry season, the average values were 29.4 mg/l and 36.52 mg/l for Matsheumhlope and Mazai streams respectively. Both these values were classified under the red category (>26 mg/l).
Phosphate
The phosphate values for Matsheumhlope Stream ranged from 0.24mg/l to 16.2 mg/l and the average phosphate concentration for Matsheumhlope Stream was 1.5 mg/l and 4.3 mg/l for the wet season and the dry season respectively. The Mazai Stream average concentration for the dry and wet seasons was 4.1mg/l and 8.7mg/l respectively. The average concentration combining the 2 seasons for Mazai stream was 6.3 mg/l and 2.9mg/l for Matsheumhlope stream. The highest phosphate concentration was 16.2 mg/l at sampling point BC1 and the lowest was 0.24 mg/l obtained at sampling point BC4 in Matsheumhlope Stream.
Nitrates

International Journal of Environmental Pollution and Environmental Modelling, Vol. 3(3): 83-103 (2020)
89
Nitrate concentrations along Matsheumhlope stream at all sampling points were categorised in the blue zone (<10). In Mazai Stream, the concentration of nitrates only varies in the wet season as all values in the dry season are in the blue category (<10).
Ammonia
All sampling points along Matsheumhlope Stream fell in the red category (> 1.51), except for sampling point BC2. The average ammonia concentrations of 26.5 mg/l for the dry season and 19.6 for the wet season for Matsheumhlope Stream. The ammonia concentration along Mazai Stream was also in the red category for all sampling points with averages of 28.2 mg/l and 15.2 mg/l in the dry and wet season respectively (Table 5 and 6).
Table 5. Matsheumhlope River chemical parameters results Sampli
ng point
COD PV P NO3 NH3
Dry Wet Dry Wet Dry Wet Dry Wet Dry Wet
BCOD2 642 266.4 49 41.7 4.2 2.7 0.07 0.8 36.5 20.7
BCOD3 601.9 273.7 50.3 43 3.9 2.4 0.03 0.8 33.3 37.5
BCOD4 130.4 1661 31.6 594.3 1.93 4.2 0.004 4.9 17.5 93.2
BC1 1905.9 120.8 88.2 29.5 16.2 1.8 1.1 1.5 66.4 23.
BC2 44.5 18.5 11.2 4.2 0.3 0.03 0.07 1 1.2 0.1
BC3 83.5 91 11 11.3 1.3 0.3 0.06 0.8 8.9 1.8
BC4 147.1 79.7 24.3 12.4 1.8 0.24 0.1 0.9 2 1.6
BC4.2 64.1 35.2 11.8 6.1 2.6 0.6 0.05 0.8 23.6 2.2
BC5 56.9 42 12.8 7 2.8 1 0.4 2.5 22.9 3
BC6 109.5 544.1 14.9 48.3 7.4 1.5 0.03 0.7 15.8 19.6
Table 6. Mazai River chemical parameters results Sampli
ng point COD PV P NO3 NH3
Dry Wet Dry Wet Dry Wet Dry Wet Dry Wet BS1 75.5 33.4 18.4 16.2 3.9 2.5 0.3 12.4 27.3 20.2 BS2 396.8 117.1 30.8 7.8 0.8 0.5 0.03 26.2 11.2 6.4
BS2.0 1285.
7 350.3 79.6 13.6 3.8 0.6 0.5 74.7 9.9 3.7 BS3 186.9 69.5 43.3 26.5 8.8 5.3 0.04 25.6 69.6 41.9 BS10.1 261.2 65.9 38.3 36 6.7 18.4 0.08 27.6 21 5.4 BS4.1 400.2 103 44.5 70.5 3.5 52.6 0.08 45.7 30.7 13.2 BSLi 53.35 19.2 4.5 3.8 0.5 0.5 0.1 4.8 3.8 16.5 BSLo 120.7 36.8 12.8 7.9 1.5 0.4 0.4 10 24.2 6.03

International Journal of Environmental Pollution and Environmental Modelling, Vol. 3(3): 83-103 (2020)
90
BS4 398.7 106.7 46.3 29 5.5 3.0 0.04 31.8 47.15 21.2 BS5 285.6 80.4 46.7 28.5 6.5 2.7 0.1 27.5 36.8 21.8
Effect of stream on physicochemical parameters of Matsheumhlope and Mazai streams
The ANOVA results showed that both Matsheumhlope and Mazai streams have no significant influence on the levels of ammonia (p>0.05) though Matsheumhlope Stream had higher average ammonia levels compared to Mazai Stream. However, the values 23.07 and 22.4 for Matsheumhlope and Mazai streams respectively are greater than 2, hence they fall in the red category of SI 6 of 2007.
Both streams showed no significant effect on COD values. Matsheumhlope Stream has a higher COD value in comparison to Mazai Stream. The overall mean COD value was 290.4 mg/l. The average COD values for Matsheumhlope and Mazai streams were 315.9mg/l and 262.5mg/l respectively. In comparison to COD values stipulated in SI 6, both streams had values greater than 200, which placed them in the red category.
The average PV value for Matsheumhlope and Mazai streams were 52.5mg/l and 30.6 mg/l respectively. According to SI 6 of 2007 Regulations on Effluent and Solid Waste Disposal, the PV values for both streams fall within the red category as they are greater than 25 mg/l. However, Mazai Stream has a lower PV value than Matsheumhlope Stream, with a p-value greater 0.05, affirming that the streams had no significant effect on the PV values.
The ANOVA results for phosphates show that both Mazai and Matsheumhlope streams had no significant influence on phosphate concentration. However, Mazai Stream had a higher concentration of phosphates compared to Matsheumhlope Stream. Therefore, Mazai stream was in the red category, whereas Matsheumhlope was in the yellow category, which was considered to be less harmful to the environment.
As shown in the ANOVA (Table 7) of results, the p-value (0.12) for SS was greater than 0.05, which meant that the streams had no significant influence on SS levels in the water. Mazai Stream had more suspended solids compared to Matsheumhlope Stream. The SS levels for Matsheumhlope and Mazai streams were in the yellow and red categories respectively.
The TDS values for both streams were in the green category and were not considered to be a threat to the environment. The average TDS values were higher in Mazai stream compared to Matsheumhlope stream. ANOVA results show that the streams had no significant influence on TDS values.
The electrical conductivity values were greater in Mazai than in Matsheumhlope stream. With a p-value greater than 0.05, the streams had no significant influence on conductivity values. The average electrical conductivity values for both streams is <1000mS/cm, therefore grouped in the blue category.
The ANOVA results revealed that the streams had no significant influence on nitrate levels (p>0.05). The average mean values showed that Matsheumhlope had more nitrates compared to Mazai stream, however both values were less than 10 mg/l, placing them in the blue category.
The results showed that the average pH values were 7.7 and 7.4 for Matsheumhlope and Mazai streams respectively. The ANOVA results showed that the streams had a significant influence on the pH values. Table 9 shows the ANOVA results for physico-chemical parameters in Matsheumhlope and Mazai streams.
Table 7. ANOVA of physicochemical parameters of Matsheumhlope and Mazai Streams
River NH3 COD PV P SS TDS E. Cond
NO3 pH
Matsheumhlope Stream
23.07
315.9 52.5 2.9 77.42 516.5 106.2 0.78 7.7
Mazai Stream 22.4 262.5 30.6 6.4 104.2 581.1 114.6 0.71 7.4 Overall mean 22.7 290.4 42.05 4.6 90.2 547.3 110.2 0.75 7.6 p-value 0.87 0.61 0.42 0.1 0.12 0.22 0.43 0.74 0.02 LSD 8.28 206.4 53.05 4.28 33.63 104 20.74 0.42 0.2 % CV 146.5 286 507.8 376.7 150.1 76.7 75.8 227.5 10.8

International Journal of Environmental Pollution and Environmental Modelling, Vol. 3(3): 83-103 (2020)
91
Seasonal effect on physicochemical parameters of Mazai and Matsheumhlope streams
The ANOVA results revealed that seasons have a significant influence on the level of ammonia (p<0.05). The average ammonia concentration for the dry season was higher than the wet season. However, both values are in the red category of SI 6 Regulations.
Seasons had no significant effect on COD values according to the ANOVA results (Table 8). The dry season had a higher COD value than the wet season and both these values fell within the red category (>200). With respect to PV, the wet season had a higher value compared to the dry season. There was no significant effect of seasons on PV values. The average PV values for both the wet and dry season were classified under the red category.
The ANOVA results obtained for phosphates showed that the season had no significant effect on phosphate levels (p>0.05). It was noted however that the overall phosphate levels for both seasons were above the SI 6 Regulations which could potentially lead to environmental problems.
As shown in the ANOVA (Table 8), seasons significantly affected the levels of SS in the water (p<0.05). Average SS values for Matsheumhlope and Mazai streams were 111.4 and 68.94 mg/l. The two seasons did not have a significant effect on TDS and conductivity (p>0.05). The wet season had higher TDS and conductivity values compared to the dry season. In comparison to the SI 6 Effluent and Waste Water Regulations, conductivity was in the blue category which is environmentally acceptable.
Results from analysis of variance showed that seasons have a significant influence on the levels of nitrates present in water. The average nitrate value for the wet season was in the yellow category whereas the dry season fell within the blue category of the solid and effluent disposal. The pH was also significantly affected by seasons as the p value was less than 0.05. Average pH values for the wet and dry season were 7.8 and 7.3 respectively.
Table 8. ANOVA of physicochemical parameters for the dry and wet season.
Season NH3 COD PV PO3 SS TDS Cond NO3 pH Dry 27.3a 340.7 33.9 4.2 111.4a 512.4 101.8 0.17b 7.3b
Wet 18.2b 240.2 50.2 4.9 68.9b 582.1 118.6 1.32a 7.8a
Overall mean
22.7 290.7 42.05 4.6 90.2 547.3 110.2 0.75 7.6
P value 0.03 0.34 0.55 0.73 0.01 0.19 0.11 <0.001 <0.001 LSD 8.26 206.2 52.99 4.3 33.59 104.1 20.72 0.42 0.2 %CV 146.5 286.1 507.8 507.8 150.1 76.7 75.8 227.5 10.8
Spatial variation of physicochemical parameters along Mazai and Matsheumhlope streams
The sampling points were located at different locations along the two streams. For each parameter, mean concentrations for the wet (May-October) and dry seasons (November–April) were calculated. These were used in analysis of various spatial patterns. Each parameter revealed a characteristic in terms of water quality and also gave an indication of pollution hotspots. The extent of the colour represents how far a particular pollutant travelled down the stream. Changes in colour along the streams showed the changes that occurred throughout the length of the streams show the spatial variations along Matsheumhlope Stream.
After interpolation, maps showed that all sampling points along Matsheumhlope stream were in the blue category of SI 6 Regulations thus pH was considered to be environmentally acceptable for both seasons (Figure 2 and 3).

International Journal of Environmental Pollution and Environmental Modelling, Vol. 3(3): 83-103 (2020)
92
Figure 2. pH spatial variations along Matsheumhlope Stream during the dry season
Figure 3. pH spatial variation along Matsheumhlope Stream during the wet season Suspended Solids spatial variations
As shown in Figures 4 and 5, suspended solids tended to decrease as you go down stream. Upstream points showed high levels of suspended solids signaled by the red parts of the stream especially from points BCOD2 to BC1.

International Journal of Environmental Pollution and Environmental Modelling, Vol. 3(3): 83-103 (2020)
93
Figure 4. Suspended solids variations along Matsheumhlope Stream during the dry season
Figure 5. Suspended Solids spatial variation for Matsheumhlope Stream during the wet season Nitrate concentration spatial variations
For both the wet and dry season, nitrate concentrations were in the blue category (0-10 mg/l) as displayed in Figures 6 and 7.

International Journal of Environmental Pollution and Environmental Modelling, Vol. 3(3): 83-103 (2020)
94
Figure 6. Nitrate variations along Matsheumhlope Stream during the dry season
Figure 7. Nitrate spatial variations along Matsheumhlope stream during the wet season
Ammonia spatial variation
Ammonia concentrations were very high in areas with red colour (Figures 8 and 9).

International Journal of Environmental Pollution and Environmental Modelling, Vol. 3(3): 83-103 (2020)
95
Figure 8. Ammonia spatial variations along Matsheumhlope Stream during the dry season
Figure 9. Ammonia spatial variations along Matsheumhlope Stream during the wet season
Matsheumhlope Stream sources of pollution
The ANOVA results (Table 9), revealed that there were significant differences between sampling points for ammonia, phosphates and suspended solids. The separation of means technique showed BCOD4 had the highest ammonia concentration. Points BC2 to BC6 showed no significant differences in ammonia concentrations. Suspended solids also showed significant differences between sampling points with BC1 having the highest concentration and all other sampling points showing no significant differences. BCOD4 had the highest phosphate concentration.
Table 9. ANOVA results on NH4, PO and Suspended solids
Sampling point
Ammonia Phosphates Suspended solids
Dry Wet Dry Wet Dry Wet

International Journal of Environmental Pollution and Environmental Modelling, Vol. 3(3): 83-103 (2020)
96
BCOD2 41.3bc 20.7c 4.22bc 2.74c 194.8b 77.8bcd BCOD3 37.7bc 37.5bc 3.93bc 2.44c 180.8bc 66.2cd BCOD4 15.7c 93.2a 1.93c 4.24bc 47.8d 179.8bc BC1 72.3abc 23.1c 16.16a 1.83c 360.0a 88.8bcd BC2 10.0c 0.1c 0.28c 0.03c 11.7d 17.0d BC3 13.8c 1.8c 1.30c 0.29c 37.3d 22.2d BC4 24.6c 1.6c 1.79c 0.23c 82.2bcd 25.5d BC5 27.1c 2.2c 2.25c 0.63c 18.3d 14.3d BC6 22.9c 2.4c 2.81c 0.96c 19.7d 12.2d
Mazai Stream spatial variations Ammonia spatial variations along Mazai Stream
Ammonia spatial variations for both the wet and dry seasons showed high levels of ammonia concentrations as showed by the red colour throughout the stream (Figure 10 and 11).
Figure 10. Ammonia spatial variations along Mazai Stream during the dry season
Figure 11. Ammonia spatial variations along Mazai stream during the wet season

International Journal of Environmental Pollution and Environmental Modelling, Vol. 3(3): 83-103 (2020)
97
Nitrate spatial variations Nitrate concentrations were in the blue category during the dry season. The wet season showed
variations in nitrate concentration between sampling points (Figure 12 and 13).
Figure 12. Nitrate spatial variations along Mazai Stream during the dry season
Figure 13. Nitrates spatial variations along Mazai Stream during the wet season
pH spatial variations
For both the wet and dry season pH values were in the blue category of SI 6 Regulations (Figures 14 and 15).

International Journal of Environmental Pollution and Environmental Modelling, Vol. 3(3): 83-103 (2020)
98
Figure 14. pH spatial variations along Mazai Stream during the dry season
Figure 15. pH spatial variations along Mazai Stream during the wet season Suspended solids spatial variation
Suspended solids concentration showed variations between sampling points as showed by the different colors between the points (Figures 16 and 17).

International Journal of Environmental Pollution and Environmental Modelling, Vol. 3(3): 83-103 (2020)
99
Figure 16. Suspended solids spatial variations along Mazai stream during the dry season
Figure 17. Suspended solids spatial variations along Mazai stream during the wet season
Mazai stream sources of pollution
The ANOVA table (Table 10) revealed that there were significant differences between sampling points for ammonia, suspended solids, TDS and electrical conductivity along Mazai Stream where p-value <0.005.
Table 10. ANOVA of physico-chemical parameters along Mazai Stream
Season NH3 COD PV PO3 SS TDS Cond NO3 pH Dry 29.2 346 37.1 4.1 128 565 113.6 0.16 7.14 Wet 14.5 179 24 8.7 80 597 115.6 1.26 7.7 Overall Mean
21.8 262 30.6 6.4 104 581 114.6 0.71 7.4
P-value <0.001 0.574 0.206 0.150 0.004 0.004 <0.001 0.178 0.169 Lsd 22.25 825.2 57.37 27.11 162.2 335.6 60.7 1.348 0.755 %CV 89.1 274.5 163.9 368.4 135.9 50.4 46.3 166.1 8.9

International Journal of Environmental Pollution and Environmental Modelling, Vol. 3(3): 83-103 (2020)
100
Using separation of means technique, ammonia concentrations were highest at point BS3 during
both seasons. The highest electrical conductivity and total dissolved solids values were recorded at sampling point BS1 and the lowest at BS2.0 during the dry season. In the wet season, BS2.0 had the highest values for both EC and TDS. Suspended solids were highest at BS4 during the dry season were as in the wet season, the highest value was recorded at sampling point BS10.1. Table 11. ANOVA of Ammonia, SS, TDS and EC along Mazai Stream
Sampling point
Ammonia
Suspended Solids TDS EC
Dry Wet Dry Wet Dry Wet Dry Wet BS1 27.3bc 20.2c 30.de 14.e 1156.a 737.b 235.2a 136.6bc BS2 11.2c 6.4c 34.cde 40.cde 366.c 497.c 70.0d 94.9cd BS2.0 9.9c 3.7c 168.abcde 82.bcde 337.c 856.ab 67.2d 168.2b BS3 69.6a 40.8bc 96.bcde 52.cde 637.bc 621.bc 134.1bc 119.8bcd BS10.1 21.0c 5.4c 60.abcde 193.abc 466.c 500.c 104.0cd 103.0cd BS4.1 30.7bc 13.2c 230.ab 120.bcde 590.bc 528.bc 109.1bc
d 103.2cd
BSLotshe in 14.4c 6.1c 30.de 30.de 441.c 523.bc 86.6cd 105.4cd BS Lotshe out 24.2c 6.0c 71.bcde 32.de 658.bc 601.bc 132.4bc 114.9bcd BS4 47.1b 21.2c 284.a 134.abcde 544.bc 562.bc 107.4cd 108.0bcd BS5 36.1bc 21.8c 181.abcd 101.bcde 453.c 546.bc 89.8cd 101.7cd
DISCUSSION Seasonal trends for physico-chemical parameters along Mazai and Matsheumhlope streams
According to the Analysis of Variance results (Table 10), seasons had a significant effect on pH, ammonia, nitrates and suspended solids. Both streams are receipt to sewage bursts from manholes which flow into streams throughout the year hence contributing to the deterioration of water quality. This could have been the reason why some parameter did not show any seasonal trends. High levels of effluent discharge have been reported in Mazai Stream [7], suggests that the physico-chemistry of water and solute concentrations are expected to follow a certain trend of enriched values with increasing urbanisation and seasonality. Ammonia seasonal variations
The results obtained for the two streams showed very high levels of pollution in comparison to the SI 6 Regulations of 2007 and was in the red category. In healthy streams ammonia is broken down to nitrates which is a more stable less toxic compound. The results obtained for the two streams indicated higher ammonia levels compared to nitrates. Effluent from waste water treatment plants influences the abundance, distribution and composition of epilithic ammonia oxidising assemblages. There was a significant difference in the concentrations of ammonia found during the two seasons. The dry season had higher concentrations compared to the wet season. A study by [7], on Mazai Stream revealed that there was high concentration of ammonia at sampling points located near the Thorngrove Sewage Treatment Works.
Nitrates seasonal variations
Nitrates produced during nitrification when ammonia (NH4+) are broken down by bacterial action
to nitrite, which is then converted to the more stable, less toxic nitrate. Nitrates in water are typically low, natural levels of nitrates in surface water can be supplemented with nitrate from human sources such as fertilisers that get washed away from the surface with runoff. All nitrate concentrations in Matsheumhlope Stream were in the blue category of SI 6 of 2007. The potential explanation for lower than expected nitrogen levels might be related to the high availability of NH4 that is not nitrified to nitrates [21] and a high denitrification rate where oxygen is low and dissolved organic compounds are high.

International Journal of Environmental Pollution and Environmental Modelling, Vol. 3(3): 83-103 (2020)
101
Mazai Stream proved to have more nitrates during the wet season with only 2 sampling points falling in the permissible blue category of SI 6. The distinct difference in nitrate concentrations in Mazai Stream during the wet season could be attributed the different ecosystem processes such as nitrification which should also be included as part of a stream network model [21]. Phosphates
High concentrations of phosphates rarely occur because as soon as they enter the water, they are immediately taken up by plants. In case of Mazai and Matsheumhlope streams overall phosphate concentrations were above the permissible standards stipulated in SI 6 Regulations on Effluent and Solid Waste Disposal. This is because most parts of the streams were converted into canals as such no plants can be able to grow on concrete surfaces. Elevated nutrient loads particularly in urban streams have been attributed to stream channelisation which involves the removal of trees and vegetation inside the stream channel and along the banks [13]. The average phosphate concentrations found in Mazai Stream were higher than in Matsheumhlope Stream. This is largely attributed to the effluent discharged from Thorngrove Sewage Works which is in agreement with findings by [7].
pH
According to [4], the ideal pH for biological productivity is 7-8.5 and anything less than 4 is detrimental to the ecosystems. Of note is the fact that in the wet season, both streams seem to have higher pH values compared to the dry season. The pH values for all sampling sites along both streams were in the blue category hence safe for aquatic organisms.
Electrical Conductivity and TDS
A sudden increase in stream’s electrical conductivity indicates a source of dissolved ions in the vicinity. In other words, an increase in EC values results in an increase in TDS values as well. The values obtained for both EC and TDS obtained display this pattern.
Sources of pollution
Along Matsheumhlope River, BCOD4 sampling point showed significantly higher concentrations of ammonia compared to the rest of the points due to sewage flows to burst sewer pipes from Sidojiwe Flats, a dilapidated infrastructure belonging to Bulawayo City Council, housing destitute people. The separation of means technique revealed that point BC1 located at the Birkenhead West Road was the source of phosphates in the stream. This is due to spillages from Cold Storage Company effluent pre-treatment which were seen flowing into the canal throughout the study period.
The study revealed that along Mazai River, BS1 sampling point had high levels of TDS as a result EC also increased. Considering the location of the point, such characteristics of high TDS and EC where expected. Industries within the vicinity of the point include service stations, battery manufacturing company, beverage manufacturing company and a dumping site. Point BS3 is located along a tributary from Mpopoma Railway Station. According to the results obtained, this point was the source of ammonia levels. This affirms studies carried out by [7], which also found high levels of ammonia just before the Thorngrove sewage treatment plant. BS4 located near the crematorium showed the highest level of suspended solids which could be attributed to urban farming loosening the soil causing particulate matter to be easily carried away by water. CONCLUSION
Both Mazai and Matsheumhlope streams had poor water quality in terms of nutrients such as ammonia and phosphates which were found to be present in levels exceeding the permissible values stipulated in EMA SI6 Regulations of 2007. The continued pollution of water bodies in the Matabeleland region may jeopardise any future plans of reclamation of water sources such Umguza dams in times of scarcity. Overall, pollutants tended to be higher upstream compared to downstream were most of the industrial areas are located. Downstream points were located in residential areas.
The pollution source of ammonia for Matsheumhlope stream was BCOD4 which is recipient to sewage from burst sewer pipes from dilapidated infrastructures. The study revealed that BC1 was the source of phosphates and suspended solids. Mazai Stream showed high levels of ammonia at BS3 which is a tributary from Mpopoma Railway Station. According to the results obtained BS4 was the source of suspended solids. BS1 had the highest level of TDS and EC values.

International Journal of Environmental Pollution and Environmental Modelling, Vol. 3(3): 83-103 (2020)
102
RECOMMENDATIONS AND FUTURE PERSPECTIVE Points of pollutant release coordinates along the two streams were not taken due to lack of time and
their inaccessibility. These would have been useful in measuring the extent of pollution from the exact pollutant discharging points. Further studies looking into more parameters need to be done for example heavy metals, bacteria and macro invertebrates. Such studies would be justified as they provide more information on the health of the two streams which are tributaries to Umguza River, a source of irrigation for local communities. REFERENCES [1] Baig, S.A., Qaisar, M., Bahadar, N., Altaf, H. and Muhammad, N., (2010). Assessment of seasonal
variations in surface water quality of Chitral River, North West Frontier Province (NWFP), Pakistan. World Applied Sciences Journal, 9(6), pp.674-680.
[2] Cunningham, W.P., Saigo, B.W. and Cunningham, M.A., 2001. Environmental science: A global concern (Vol. 412). Boston, MA: McGraw-Hill.
[3] Day, J., (2000). Biomonitoring: appropriate technology for the 21st century. In Symposium Sustainable Use of Water Resources; Advances in Education and Research, 1. WARFSA.
[4] Deekae, S.N., Abowei, J.F.N. and Alfred-Ockiya, J.F., (2010). Seasonal variation of some physical and chemical parameters of Luubara Creek, Ogoni Land, Niger Delta, Nigeria. Research journal of environmental and earth sciences, 2 (4), pp.208-215.
[5] Dias, J., Martin, R., Ferreira, C., Esteves, T., Soares, M., Costa, M.L. and Costa, M.C., (2006). Application of GIS Database tool to surface water quality at ESAC. The Quest for Sustainability: the role of Environmental Management Systems and Tools, ECAS, Coimbra, Portugal, pp.27-29.
[6] Dondo, P.N., (2016). The effects of pollution on the physico-chemical parameters of water and diversity of aquatic macroinvertebrates: a case study of the Khami Dam.
[7] Dube, T., Makaka, C. and Sibanda, Z., (2010). An assessment of the effect of industrial and sewage effluent on aquatic invertebrates: A case study of a southern urban stream, Zimbabwe. Journal of Sustainable Development, 3 (2), p.210.
[8] Johnson, D.L., Ambrose, S.H., Bassett, T.J., Bowen, M.L., Crummey, D.E., Isaacson, J.S., Johnson, D.N., Lamb, P., Saul, M. and Winter-Nelson, A.E., (1997). Meanings of environmental terms. Journal of environmental quality, 26 (3), pp.581-589
[9] Lawson, E.O., (2011). Physico-chemical parameters and heavy metal contents of water from the Mangrove Swamps of Lagos Lagoon, Lagos, Nigeria. Advances in Biological Research, 5(1), pp.8-21.
[10] Masere, T.P., Munodawafa, A. and Chitata, T., (2012). Assessment of human impact on water quality along Manyame River. International Journal of development and sustainability, 1(3), pp.754-765.
[11] Mehrdadi, N., Ghobadi, M., Nasrabadi, T. and Hoveydi, H., (2006). Evaluation of the quality and self-purification potential of Tajan River using QUAL2E model.
[12] Merbt, S.N., Auguet, J.C., Blesa, A., Martí, E. and Casamayor, E.O., (2015). Wastewater treatment plant effluents change abundance and composition of ammonia-oxidizing microorganisms in mediterranean urban stream biofilms. Microbial ecology, 69(1), pp.66-74.
[13] Meyer, J.L., Paul, M.J. and Taulbee, W.K., (2005). Stream ecosystem function in urbanizing landscapes. Journal of the North American Benthological Society, 24(3), pp.602-612.
[14] Moyo, A., (2015). An assessment of the effects of socio-economic activities on the diversity of aquatic macro-invertebrates. a case study of Umguza River in Bulawayo, Zimbabwe (Doctoral dissertation, BUSE).
[15] Moyo, N.A. (1997). Lake Chivero: A polluted lake. [16] Nhapi, I., and H. Gijzen. (2002). Wastewater Management in Zimbabwe. Proceedings of the 28th
WEDC Conference on sustainable environmental sanitation and water services. Kolkata, India. [17] Nhapi I, Tirivarombo S, (2004). Sewage discharges and nutrient levels in Marimba River,
Zimbabwe. Water SA 2004;30 (1):107–13.

International Journal of Environmental Pollution and Environmental Modelling, Vol. 3(3): 83-103 (2020)
103
[18] Nyenje, P.M., Foppen, J.W., Uhlenbrook, S., Kulabako, R. and Muwanga, A., (2010). Eutrophication and nutrient release in urban areas of sub-Saharan Africa—a review. Science of the Total Environment, 408 (3), pp.447-455.
[19] Ouyang, Y., Nkedi-Kizza, P., Wu, Q.T., Shinde, D. and Huang, C.H., (2006). Assessment of seasonal variations in surface water quality. Water research, 40 (20), pp.3800-3810.
[20] Potter, J.D., McDowell, W.H., Helton, A.M. and Daley, M.L., (2014). Incorporating urban infrastructure into biogeochemical assessment of urban tropical streams in Puerto Rico. Biogeochemistry, 121(1), pp.271-286.
[21] Potter, J.D., McDowell, W.H., Merriam, J.L., Peterson, B.J. and Thomas, S.M., (2010). Denitrification and total nitrate uptake in streams of a tropical landscape. Ecological Applications, 20(8), pp.2104-2115.
[22] Ramírez, A., De Jesús-Crespo, R., Martinó-Cardona, D.M., Martínez-Rivera, N. and Burgos-Caraballo, S., (2009). Urban streams in Puerto Rico: What can we learn from the tropics? Journal of the North American Benthological Society, 28(4), pp.1070-1079.
[23] Teta, C., Ncube, M. and Naik, Y.S., (2017). Heavy metal contamination of water and fish in peri-urban dams around Bulawayo, Zimbabwe. African Journal of Aquatic Science, pp.1-8.
[24] Thebe, T.A. and Mangore, E.N., (2012). Wastewater production, treatment, and use in Zimbabwe. Department of Civil and Water Engineering, National University of Science and Technology, Bulawayo.
[25] Vörösmarty, C.J., McIntyre, P.B., Gessner, M.O., Dudgeon, D., Prusevich, A., Green, P., Glidden, S., Bunn, S.E., Sullivan, C.A., Liermann, C.R. and Davies, P.M., (2010). Global threats to human water security and river biodiversity. Nature, 467 (7315), p.555.