
POLLUTION – FREE ENVIRONMENT: A MIRAGE OR AN...
104
POLLUTION – FREE ENVIRONMENT: A MIRAGE OR AN ATTAINABLE REALITY? By Professor Olusegun Olukayode Odukoya (Professor of Analytical Chemistry) Department of Chemistry, College of Natural Sciences (COLNAS) Federal University of Agriculture, Abeokuta, Nigeria. FUNAAB INAUGURAL LECTURE Series No. 43 Wednesday, 19th February, 2014 Series No 43: Professor O. O. Odukoya FUNAAB INAUGURAL LECTURE SERIES
Transcript of POLLUTION – FREE ENVIRONMENT: A MIRAGE OR AN...

POLLUTION – FREE ENVIRONMENT: A MIRAGE OR AN ATTAINABLE REALITY?
By
Professor Olusegun Olukayode Odukoya
(Professor of Analytical Chemistry)
Department of Chemistry, College of Natural Sciences (COLNAS)
Federal University of Agriculture, Abeokuta, Nigeria.
FUNAAB INAUGURAL LECTURE Series No. 43
Wednesday, 19th February, 2014
Series No 43: Professor O. O. Odukoya
FUNAAB INAUGURAL LECTURE SERIES

This 43rd Inaugural Lecture was delivered under
the Chairmanship
of
The Vice-Chancellor Professor Olusola B. Oyewole B.Sc. (Ife), M.Sc., Ph.D. (Ibadan)
Published 19th February, 2014
Reproduction for sale or other commercial purposes is prohibited
ISBN:
Series No. 43: Professor O. O. Odukoya
FUNAAB INAUGURAL LECTURE SERIES
Professor Olusegun Olukayode ODUKOYA ( B.Sc., M.Sc., Ph.D. Ibadan)
(Professor of Analytical Chemistry)
3
FUNAAB INAUGURAL LECTURE SERIES
4
FUNAAB INAUGURAL LECTURE SERIES
POLLUTION – FREE ENVIRONMENT: A MIRAGE OR AN ATTAINABLE REALITY?
The Vice-Chancellor, Deputy Vice-Chancellor (Academic), Deputy Vice-Chancellor (Development), Registrar, Other Principal Officers of the University, The Dean, College of Natural Sciences, Other Deans and Directors, Head, Department of Chemistry, Members of Senate and Other Colleagues, Friends of the University/Special Guests, Erudite Academics, Distinguished Ladies and Gentlemen, Gentlemen of the Press, Students of Federal University of Agriculture, Abeokuta
1.0 Preamble An Inaugural Lecture is a lecture that is delivered to mark the inauguration of a Professor when he is being celebrated as an-other addition to the rank of Professors. It is the formal an-nouncement of the arrival of another Professor. It is an obli-gation which a Professor is required to fulfil in the course of his academic career in the university. It is however a privilege because for various reasons, not all Professors have the oppor-

tunity to deliver an inaugural lecture. Some even have the op-portunity and prepare the lecture but for one reason or the other could not deliver it. I am therefore immensely grateful to the Almighty God for the grace to stand before this audi-ence today to deliver this lecture. This Inaugural Lecture is the fourth in Department of Chemi-cal Sciences/ Chemistry. The first was given by Prof. I. Adamson, followed by Prof. I.C .Eromosele while the third was by Prof. F.O. Bamiro. This is however the second to be given in the field of Analytical Chemistry. To God be the glory. I am also very grateful to the Vice-Chancellor Professor Olusola Bamidele Oyewole for the opportunity he has given me to deliver this lecture. Thank you sir. An inaugural lecture is a forum at which a Professor gives an insight into his work, what he has been doing up to date, what contributions ha has made to advance the frontiers of knowl-edge, the relevance of his work to the society and to the im-provement of the quality of life to humanity. It is also used to discuss his present research work. It represents a landmark in the career of an academician. In recent years, there have been a lot of discussions on envi-
5
FUNAAB INAUGURAL LECTURE SERIES

ronmental issues. Topics like global warming, climate change, acid, rain, ozone layer and its depletion are topical issues which have all been brought about by heavy pollution of the environment. We are all stakeholders in what happens to our environment. We have a duty to bequeath a safe and clean environment to future generations to ensure continuity of life on our planet. The topic “Pollution free Environment: A Mirage or an At-tainable Reality?” is therefore most appropriate at this point in time. 2.0 INTRODUCTION 2.1 The Environment In its simplest definition, the environment consists of the soil, air and water. This is the living environment which sustains life (man, plant, animal) on earth. More properly the environ-ment consists of the atmosphere, the hydrosphere, the geo-sphere and the biosphere. 2.2 The Atmosphere The atmosphere is the thin layer of gas covering the Earth´s surface. It is a reservoir of gases and moderates the Earth´s temperature; it absorbs energy and damaging ultraviolet radia-tion from the sun, transports energy from the equatorial re-
6
FUNAAB INAUGURAL LECTURE SERIES

gion and serves as a pathway for vapour-phase movement of water. The atmosphere is divided into several layers on the ba-sis of temperature. The most significant are the troposphere and the stratosphere. 2.2.1a. The troposphere extends from sea-level to a height of 11km. The temperature decreases from 150C at sea level to -560C at the upper limit while the height varies by a kilometre or more. 2.2.1b.The Stratosphere The next layer is the stratosphere. This is from a height of 11km to about 50km. The average temperature of the strato-sphere is from -500C at the boundary with the troposphere to -20C at its upper limit. The reason for the increase in tempera-ture is due to absorption of solar ultraviolet energy by the ozone in the stratosphere. 2.2.1c. The Mesosphere and Thermosphere The mesosphere is from a height of 50km to 85km. The ab-sence of absorbing species allows the temperature to decrease to about -920C. Thereafter comes the thermosphere which makes first contact with solar radiation, and in which the highly rarerifield gas reaches a temperature of 1,2000C by the absorption of very energetic radiation of wavelengths less than 200nm by gas species in this region (Manahan 1994)
7
FUNAAB INAUGURAL LECTURE SERIES
2.3. The Hydrosphere The hydrosphere consists of Earth’s water with over 97% of it in the oceans and most of the remaining fresh water in the form of ice on the poles; that is only a relatively small percent-age of the total water on Earth is involved in the terrestrial, atmospheric, underground water, surface water, in streams, rivers, lakes and ponds. 2.4 The Geosphere The geosphere consists of solid earth, including soil which supports plant life. That part of the geosphere which is di-rectly involved with environmental processes through contact with the atmosphere, the hydrosphere and living things (biosphere) is the solid Lithosphere which varies from 50 to 100km in thickness. The most important part of it is its thin outerskin (5- 40km) composed mainly of the lighter silicate-based minerals which are called the Earth’s crust. 2.5 Others Others consist of the Biosphere which is made up of all living organisms (Manahan, 1994). The Anthrosphere is the contri-bution of man’s activities that is technology and its effect on the other forms of the environment including the biosphere.
8
FUNAAB INAUGURAL LECTURE SERIES
9
FUNAAB INAUGURAL LECTURE SERIES
3.0. POLLUTION The anthropogenic sources which are due to man’s activities are responsible for the pollution problems we have today. Ge-ologists, astronomers and scientists in related disciplines agree that our planet was formed as condensation product from gas and dust particles from some immense super nova explosion in outer space about 4,700 million years ago. The liquid ball gradually solidified to form our planet. While in the liquid state, all the heavy elements mostly metals and in particular iron, were compacted by gravity to the molten centre before solidification. Hence, man is made of the lighter elements on the surface e.g. carbon, hydrogen, oxygen, nitrogen, sulphur etc. (Fiabane and Williams 1977). The Bible also tells us in the book of Genesis, Chapter 2, verse 7 “And God formed man of the dust of the ground” that is, mud, clay and sand on the surface of the earth. After creating the world and everything in it, God sur-veyed it and was satisfied. Genesis chapter 1, verse 31 “And God saw everything that he made, and behold it was very good”. Then God gave man do-minion over the earth and power to subdue it (Genesis 1:26 and 28). Part of the result of that dominion is the pollution of the environment that is prevalent today.

The term “pollution” has been given many definitions de-pending on the perception of the definer. A good definition by Holdgate (1979) puts it as the introduction by man into the environment of substances or energy liable to cause hazards to human health, living resources and ecological systems, dam-age to structures and amenities, and interfere with the legiti-mate use of the environment. In simple terms, it can be defined as something in the wrong place, and in the wrong quantity. 3.1 Types of pollution The different types of pollution are grouped under names re-flecting the resource affected like air, water, energy, soil etc, or the characteristics of the pollution e.g chemical pollution, solid waste pollution, thermal pollution, noise pollution, heavy metal pollution etc. These pollutants affect more than one re-source e.g Chemical pollution and heavy metal pollution affect atmospheric, terrestrial and aquatic ecosystem. The action of pollutants in the environment varies greatly and is affected by the characteristics of the pollutant and to a large extent, by the degree of human activities at or near the site of pollution (Joseph 1971). 3.1.1 Atmospheric Pollution Atmospheric pollution arises from both natural and anthropo-
10
FUNAAB INAUGURAL LECTURE SERIES

genic sources. The natural sources is mostly from volcanic eruptions in thermally active areas, which shows that the so-lidification of our planet is not yet complete but is still on-going. Some volcanoes are truly extinct like the ones that gave rise to the Jos plateau while some are simmering. The sudden eruption of the volcano in Lake Nyos in the Cameroon re-public is a pointer to what can happen. In this connection I wish to draw attention to the simmering volcano at Idanre Hills in Ondo state. This seemingly extinct volcano gives rise to rumblings and smoke. The inhabitants at the base of the hill put the rumbling down to the “market noise” being made by people sheltered by the hill in ancient days who are still liv-ing there, the smoke to be due to their cooking. This simmer-ing volcano can erupt at any time and I wish to appeal to the Ondo state Government to as a matter of urgency, relocate the people living at the base of the hill. Anthropogenic sources include mostly automobiles (vehicle) emission, burning of fossil fuels in electric power plants, in-dustrial processes, space heating and agricultural burning, re-fining and smelting of ores, burning of refuse etc. These sources introduce smoke, gases, fumes, dust and parti-cles into the air. The gases include carbon-monoxide, carbon-dioxide, oxides of nitrogen and sulphur, hydrocarbons etc. The type of pollutants present in the air in a particular loca-
11
FUNAAB INAUGURAL LECTURE SERIES
tion depends on the sources in that location: for example, the air around petroleum refineries, natural gas flaring spots, coal-burning and smelters involving sulphur ores like galena(Lead sulphide), Zinc blende (Zinc sulphide) contain high concentra-tion of sulphur-dioxide, oxides of nitrogen and carbon-dioxide. In marshy and swampy areas, hydrogen sulphide (some of which is oxidised to sulphur-dioxide) and methane are prevalent in the air. In urban areas with high traffic density, a lot of lead related particles and oxides of metals are preva-lent; in coastal area a lot of salt particles due to sea-spray while in highly windy and semi-arid areas, the air is dusty due to meteoric dust. The beginning of the industrial revolution in Europe(1950) resulted in the building of large furnaces and tall stacks for smelting and refining and marked the beginning of heavy atmospheric pollution. 3.1.2 Noise Pollution This is also part of atmospheric pollution. This arises as a re-sult of high mechanisation of systems and facilities in indus-tries, homes, transportations and religious houses. These ma-chinery in industries, appliances at home, motor vehicles, trains, aircrafts and blaring sounds from musical instruments and religious activities in urban areas produce unwanted and disturbing sound which have psychological effects on people. This results in loss of concentrations and in some cases men-tal retardation (FEPA 1991).
12
FUNAAB INAUGURAL LECTURE SERIES

Industries should distribute ear-plugs to their workers while religious houses should turn their loud speakers to face the inside of their buildings and desist from mounting them on poles outside the buildings. 3.1.3 Water Pollution Pollution of water is one which renders the water body unsuit-able for a specific purpose e.g water that is unsuitable for drinking may be useful for manufacturing, irrigation, cooling, laundry etc. Sources of water pollution include domestic and industrial wastes and effluents, agricultural sources including run-offs which contain chemical inputs like fertilizers, herbi-cides, pesticides etc., weathering of rocks, precipitation from air (both wet and dry)etc. Energy pollution is mainly from in-dustry where hot water used for cooling machinery is dis-charged into nearby river resulting in sudden increase in tem-perature of a localised area., this affects aquatic organisms and sometimes cause their death. 3.1.4 Land (Soil) Pollution Land pollution occurs as a result of dumping of wastes from domestic, industrial, agricultural and mining sources on the soil. A typical domestic solid waste dumpsite in Nigeria urban area contains paper, food, metal, glass, wood, plastic, rug, clothing, rubber, leather and dirt( Holderness et al, 1982). Ag-ricultural waste include animal drops (used as manure), waste
13
FUNAAB INAUGURAL LECTURE SERIES
from slaughter houses, from crop harvesting and processing, while others include fertilizers, pesticides, herbicides and fun-gicides added to soil. Mining wastes which are mostly from minerals, fossil fuels and associated mining leave large scars and pits (gullies) on the land. 3.2 NATURE OF POLLUTANTS 3.2.1 Types of pollutants Most pollutants (except noise and energy) are chemical in na-ture and can be divided into three main groups:- Organic pol-lutants, Inorganic pollutants and Metal pollutants. 3.2.2 Organic and Inorganic Pollutants The organic pollutants result from using organic pesticides, fungicides, herbicides etc in agriculture and homes. Most of them are biodegradable and degrade into less harmful and even harmless substances. Inorganic pollutants include mostly gaseous emissions which pollute the atmosphere. The major ones are sulphur dioxide, oxides of nitrogen (NOx), hydrogen sulphide, ammonia, car-bon-dioxide, carbon-monoxide etc. The main sources are from industrial emission. They include burning of fossil fuels (petroleum, natural gas and coal) for use in thermal power stations, smelting of metal ores, refining
14
FUNAAB INAUGURAL LECTURE SERIES
of crude petroleum, flaring of natural gas, automobile emis-sion etc. 3.2.3 Metal Pollutants These consist of various forms of metals and metallic com-pounds which find their way into the environment via natural and anthropogenic routes. Natural routes include volcanic eruptions which introduce vapours of metals and metallic compounds, particulates consisting of various metallic species and fumes of oxides of metals. There is more importantly molten larva which contains metals and metallic species. The other and more common natural route of metals in to the environment is the weathering of metal containing rocks. If these were the only routes through which metals get into the environment, the world would be a cleaner and healthier place. The anthropogenic routes include technology and for this purpose man dug into the depth of the earth to mine (bring out) metals from the safe place God stored them. Among the metals mined are iron, lead, cadmium, mercury, zinc, gold, sil-ver etc., for use in technological development and for orna-ments. Naturally some of these metals are lost to the environ-ment during processing into various products and also due to poor handling. The solid wastes which include industrial and domestic wastes are dumped on the soil while the effluents from industries are discharged into drainages, streams and riv-
15
FUNAAB INAUGURAL LECTURE SERIES
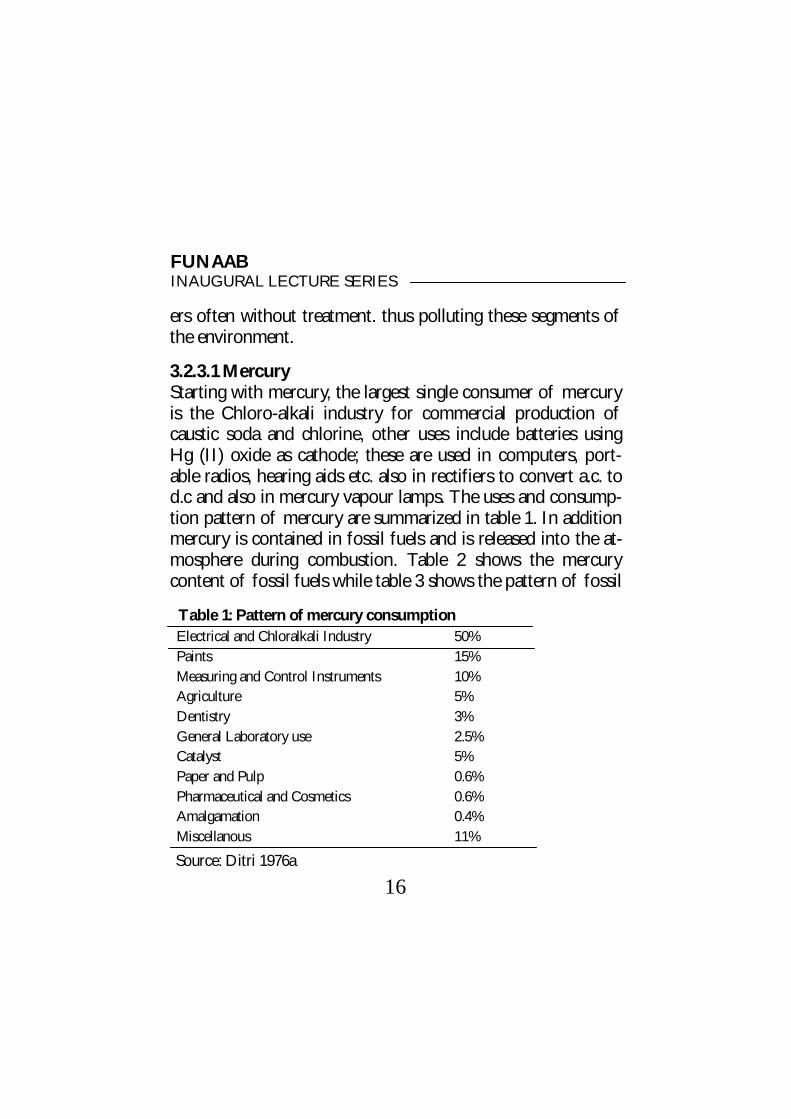
ers often without treatment. thus polluting these segments of the environment. 3.2.3.1 Mercury Starting with mercury, the largest single consumer of mercury is the Chloro-alkali industry for commercial production of caustic soda and chlorine, other uses include batteries using Hg (II) oxide as cathode; these are used in computers, port-able radios, hearing aids etc. also in rectifiers to convert a.c. to d.c and also in mercury vapour lamps. The uses and consump-tion pattern of mercury are summarized in table 1. In addition mercury is contained in fossil fuels and is released into the at-mosphere during combustion. Table 2 shows the mercury content of fossil fuels while table 3 shows the pattern of fossil
16
FUNAAB INAUGURAL LECTURE SERIES
Table 1: Pattern of mercury consumption Electrical and Chloralkali Industry 50% Paints 15% Measuring and Control Instruments 10% Agriculture 5% Dentistry 3% General Laboratory use 2.5% Catalyst 5% Paper and Pulp 0.6% Pharmaceutical and Cosmetics 0.6% Amalgamation 0.4% Miscellanous 11%
Source: Ditri 1976a
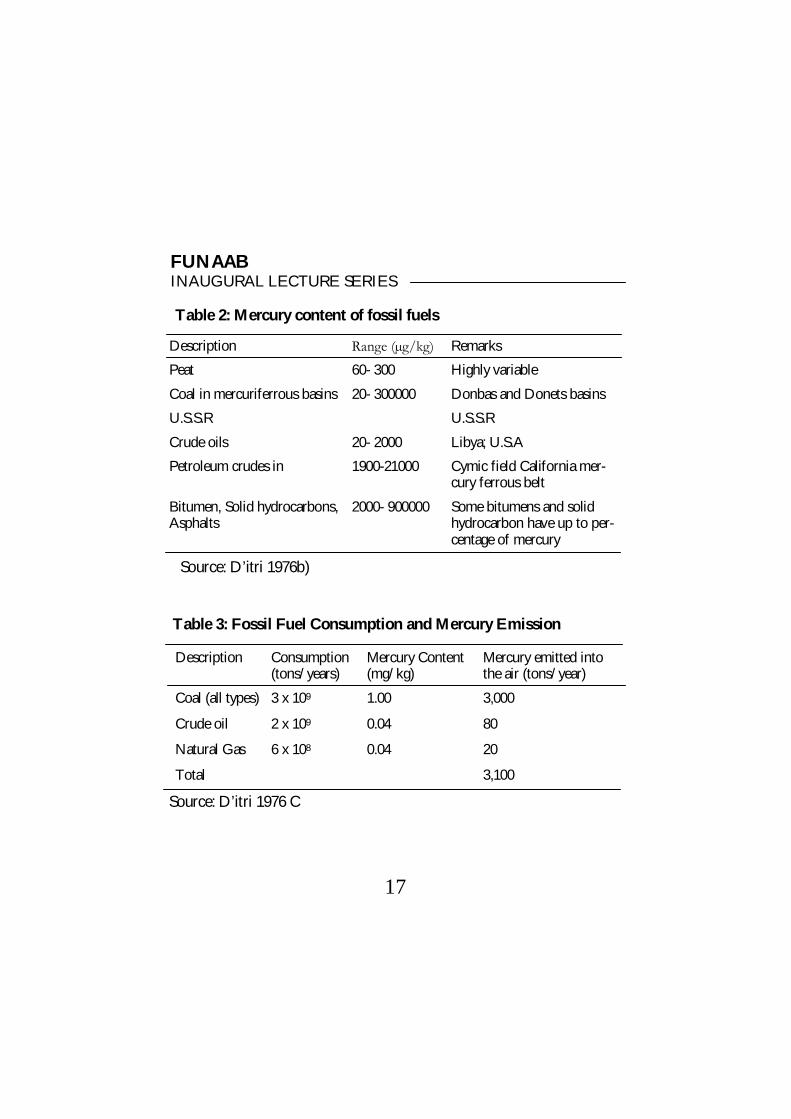
Table 3: Fossil Fuel Consumption and Mercury Emission
Description Consumption (tons/years)
Mercury Content (mg/kg)
Mercury emitted into the air (tons/year)
Coal (all types) 3 x 10⁹ 1.00 3,000
Crude oil 2 x 10⁹ 0.04 80
Natural Gas 6 x 10⁸ 0.04 20
Total 3,100
FUNAAB INAUGURAL LECTURE SERIES
Source: D’itri 1976 C
Table 2: Mercury content of fossil fuels
Description Range (µg/kg) Remarks
Peat 60- 300 Highly variable
Coal in mercuriferrous basins 20- 300000 Donbas and Donets basins
U.S.S.R U.S.S.R
Crude oils 20- 2000 Libya; U.S.A
Petroleum crudes in 1900-21000 Cymic field California mer-cury ferrous belt
Bitumen, Solid hydrocarbons, Asphalts
2000- 900000 Some bitumens and solid hydrocarbon have up to per-centage of mercury
Source: D’itri 1976b)
17

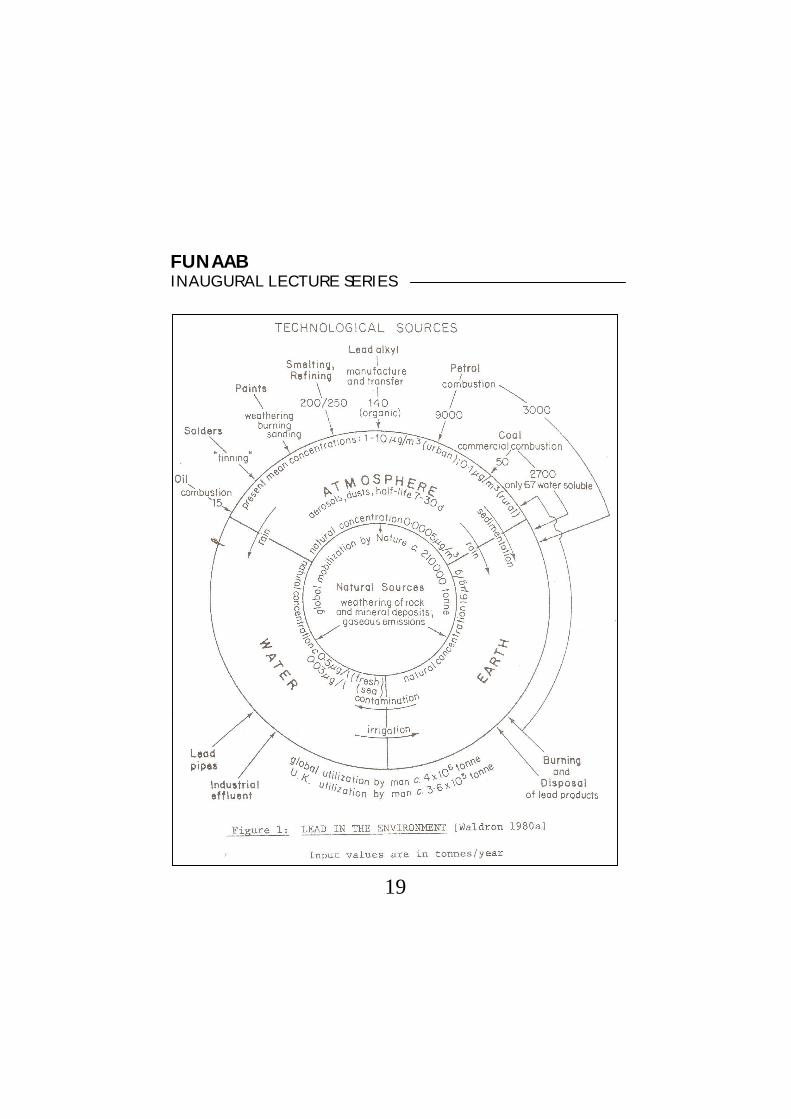
fuel consumption and mercury emission. 3.2.3.2 Lead The largest single use of lead is the automobile industry where it is used in lead acid accumulator (vehicle battery). This lead is recoverable, its compounds (TEL and TML) are used as anti-knock additives to petrol. Other uses include cables, sheathing, sheets, pipes, solders and alloys etc. These uses are responsible for the loss of lead into the environment. This is illustrated in figure 1. This lead is not recoverable.
18
FUNAAB INAUGURAL LECTURE SERIES
19
FUNAAB INAUGURAL LECTURE SERIES
20
FUNAAB INAUGURAL LECTURE SERIES
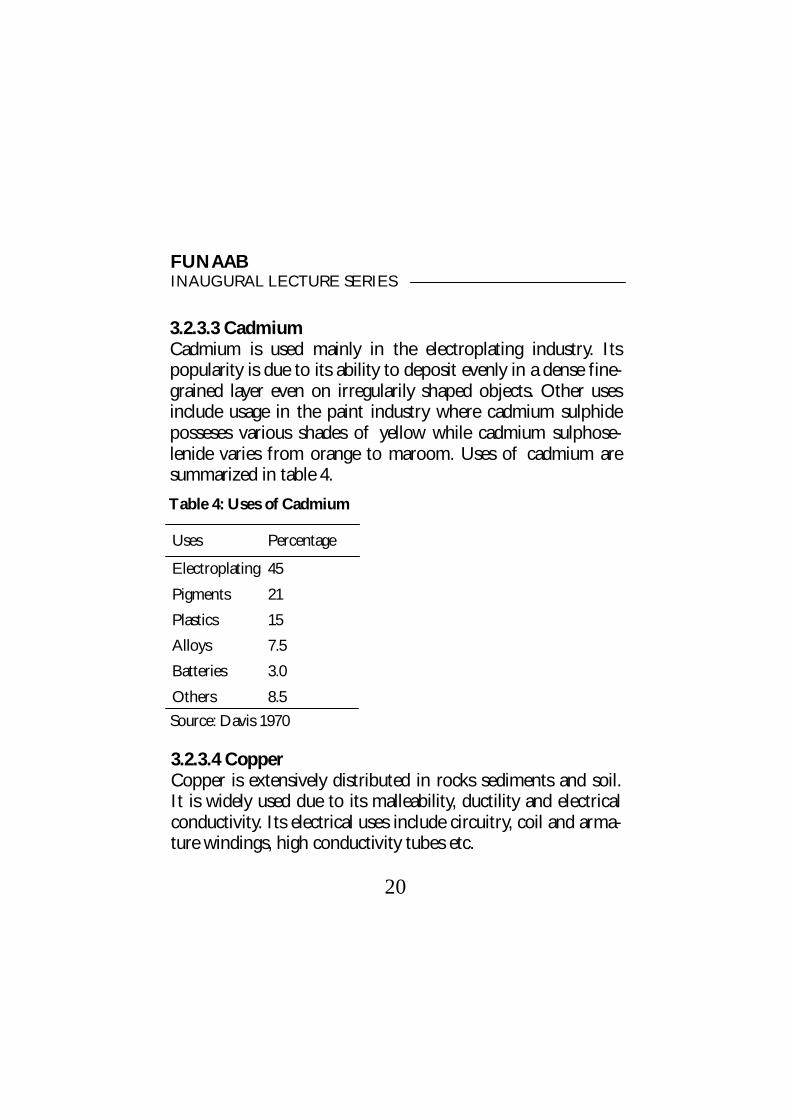
3.2.3.3 Cadmium Cadmium is used mainly in the electroplating industry. Its popularity is due to its ability to deposit evenly in a dense fine-grained layer even on irregularily shaped objects. Other uses include usage in the paint industry where cadmium sulphide posseses various shades of yellow while cadmium sulphose-lenide varies from orange to maroom. Uses of cadmium are summarized in table 4. Table 4: Uses of Cadmium
Uses Percentage
Electroplating 45
Pigments 21
Plastics 15
Alloys 7.5
Batteries 3.0
Others 8.5
Source: Davis 1970
3.2.3.4 Copper Copper is extensively distributed in rocks sediments and soil. It is widely used due to its malleability, ductility and electrical conductivity. Its electrical uses include circuitry, coil and arma-ture windings, high conductivity tubes etc.

FUNAAB INAUGURAL LECTURE SERIES
Medical uses include copper-containing IUD and as a compo-nent in dental amalgam. Copper sulphate are added to natural waters to kill snails serving as host to the parasite causing a human fluke, Schistosomiasis and also used to control algae growth in lakes and rivers. These uses introduce copper di-rectly into the environment. 3.2.3.5 Zinc Zinc is mined in more than fifty countries and total consump-tion is about eight million tonnes. Zinc is used in four major areas:- galvanizing, brass and bronze products, casting and rolled zinc. In addition, large qualities of zinc compounds are used as pigments in paints, micro-nutrients in agriculture, in medicine where zinc acetate or sulphate therapy has decreased the symptoms and crises of sickle-cell anaemia patients. These various uses of the metals and their compounds result in a large environmental interface between the metals and man. 3.3 Route of metals to man Metal fumes or dust in air gets to man through inhalation by those in that area e.g. industrial workers in paints and metal industries, residents in high traffic density areas, those around smelters, attendants at petrol filling stations etc. Some metals like mercury have high vapour pressure (19.9 x 104mm at 25oc)
21

FUNAAB INAUGURAL LECTURE SERIES
and easily vaporize wherever mercury metal is stored or being used e.g. in science laboratories, hospital premises etc. Poor ventilation further increases its concentration in those places and people working in such places easily inhale the vapour without realizing it. Some metal fumes and dust which settle on vegetation are consumed when such vegetation are eaten as food e.g. green vegetables, fruits etc. the fumes and dust which settle on soil or get washed down by rain get absorbed by plant though their roots and are translocated to other parts. Some get into the fruit and foliage which are consumed as food. Some foliage and tree barks are used as medicinal herbs which are boiled and the extract taken as herbal preparations. Some plants are consumed by animals which accumulate the metals e.g. cattle on their way from the northern parts of the country (Nigeria) to the south consume a lot of roadside vegetations on which a lot of lead particles have deposited. Other grass-eating animals like sheep, goats and lower ones like rabbit, guinea pigs etc. also do the same. When slathered and consumed by man these metals get to man. Finally, most of these metals get into streams rivers and the sea. In this environment, the metals are accumulated by aquatic plants and animals Micro-organisms are capable of ab-sorbing these metals directly from the water and they in turn are consumed by bigger ones. Bottom feeding forage fish con-sume benthic organisms and are themselves eaten by preda-
22

FUNAAB INAUGURAL LECTURE SERIES
tory fishes. The predatory fishes can also absorb metals di-rectly from the sea through the large volume of water flowing through their gills daily. As the food chain is ascended, so does the magnification increase (Kazantis 1980). Biological magnifi-cation of mercury in the aquatic food chain is shown in table 5. Man being at the end ;of the food chain, and being omnivo-rous runs a very high risk of having the highest concentration of these metals in his body. Beside this, man can also inhale directly from the air and ingest directly from water. The gen-
23
Table 5: Biological Magnification of Mercury in the Aquatic chain (Hamilton 1971)
Marine Organism No of Samples Mean Value (mg/kg)
Algae eaters 39 0.05
Zooplankton eaters 9 0.04
Omnivores 9 0.45
Dentritus eaters 12 0.54
Predators 25 0.73

FUNAAB INAUGURAL LECTURE SERIES
eral food chain is shown in fig-
ure 2, while the en- vironmental
path way of lead to man is
shown in fig-ure 3.
24
Hyd
rosp
here
– B
iosp
here
M
etals
in w
ater
Plan
kton
Om
nivo
rous
Carn
ivor
ous
Bird
sM
an
Pedo
sphe
re-B
iosp
here
Met
als i
n So
il Pl
ants
Ani
mal
s M
an
Atm
osph
ere
– Bi
osph
ere
Met
als i
n air
Pl
ants
A
nim
als
Man
Figu
re 2
: Gen
eral
ised
Foo
d C
hain
.
Sour
ce: J
onas
son
and
Boy
le 19
71

FUNAAB INAUGURAL LECTURE SERIES
FIGURE 3: ENVIRONMENTAL PATHWAYS OF LEAD TO MAN (Waldron 1980b) Source :Waldron 1980
25

FUNAAB INAUGURAL LECTURE SERIES
26
4.0 ABSORPTION, DISTRIBUTION AND TOXICITY OF METALS IN THE BODY 4.1. Mercury 4.1.1 Absorption and Distribution Inhalation of mercury vapour leads to diffusion through the lungs into the blood stream resulting in about 80% assimila-tion. Metallic mercury taken through the mouth is poorly ab-sorbed to the tune of 10-15%. The corrosive effect of mer-cury(II) chloride increases its permeability and absorption. Absorption through the skin is only significant for methylmer-cury and could lead to mercury poisoning. Mercury vapour crosses the placental barrier into the foetus; inorganic mer-cury also gets to the placental barrier but accumulates there without getting to the foetus. Methylmercury crosses the bar-rier and is selectively absorbed by the foetus and the level in the foetal blood can even exceed that of maternal blood (Tejuing 1970). Methylmercury is also secreted into breast milk thus compounding the problem of the new born baby. Once absorbed into the blood stream, mercury, like other di-valent metals is attached to the sulphhydryl group of the red blood cells while some are left in the plasma. The one in the plasma can penetrate the blood –brain barrier while that in the red cell is distributed to the other parts of the body. The kid-ney is the principal organ of accumulation which harbours more than 90% of the total body burden (Flayes 1980).
FUNAAB INAUGURAL LECTURE SERIES
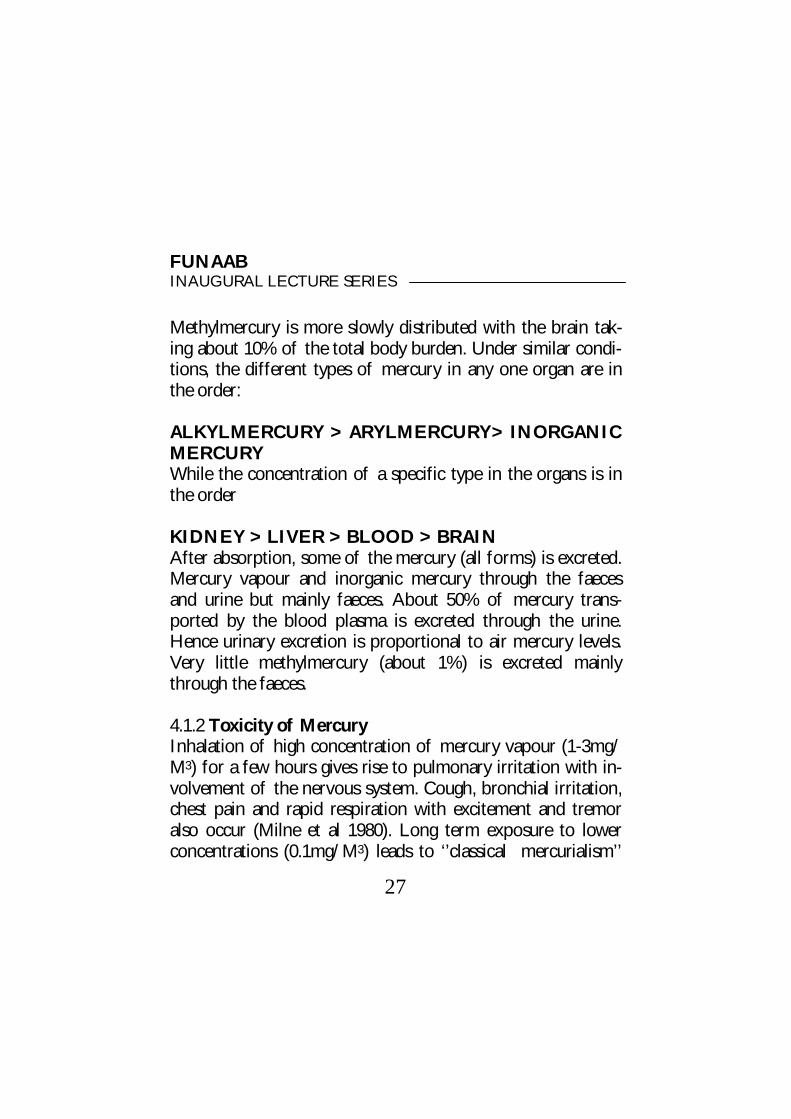
Methylmercury is more slowly distributed with the brain tak-ing about 10% of the total body burden. Under similar condi-tions, the different types of mercury in any one organ are in the order: ALKYLMERCURY > ARYLMERCURY> INORGANIC MERCURY While the concentration of a specific type in the organs is in the order KIDNEY > LIVER > BLOOD > BRAIN After absorption, some of the mercury (all forms) is excreted. Mercury vapour and inorganic mercury through the faeces and urine but mainly faeces. About 50% of mercury trans-ported by the blood plasma is excreted through the urine. Hence urinary excretion is proportional to air mercury levels. Very little methylmercury (about 1%) is excreted mainly through the faeces. 4.1.2 Toxicity of Mercury Inhalation of high concentration of mercury vapour (1-3mg/M3) for a few hours gives rise to pulmonary irritation with in-volvement of the nervous system. Cough, bronchial irritation, chest pain and rapid respiration with excitement and tremor also occur (Milne et al 1980). Long term exposure to lower concentrations (0.1mg/M3) leads to ‘’classical mercurialism’’
27
FUNAAB INAUGURAL LECTURE SERIES
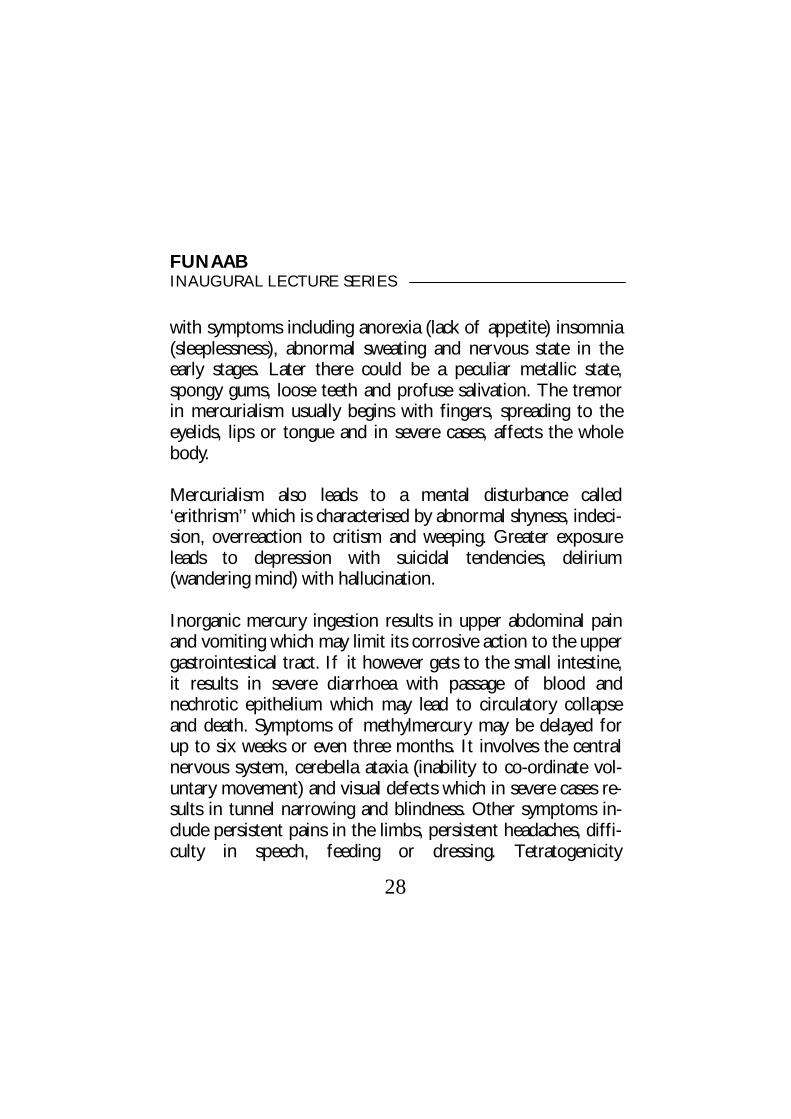
with symptoms including anorexia (lack of appetite) insomnia (sleeplessness), abnormal sweating and nervous state in the early stages. Later there could be a peculiar metallic state, spongy gums, loose teeth and profuse salivation. The tremor in mercurialism usually begins with fingers, spreading to the eyelids, lips or tongue and in severe cases, affects the whole body. Mercurialism also leads to a mental disturbance called ‘erithrism’’ which is characterised by abnormal shyness, indeci-sion, overreaction to critism and weeping. Greater exposure leads to depression with suicidal tendencies, delirium (wandering mind) with hallucination. Inorganic mercury ingestion results in upper abdominal pain and vomiting which may limit its corrosive action to the upper gastrointestical tract. If it however gets to the small intestine, it results in severe diarrhoea with passage of blood and nechrotic epithelium which may lead to circulatory collapse and death. Symptoms of methylmercury may be delayed for up to six weeks or even three months. It involves the central nervous system, cerebella ataxia (inability to co-ordinate vol-untary movement) and visual defects which in severe cases re-sults in tunnel narrowing and blindness. Other symptoms in-clude persistent pains in the limbs, persistent headaches, diffi-culty in speech, feeding or dressing. Tetratogenicity
28

FUNAAB INAUGURAL LECTURE SERIES
(abnormality in new born babies) of methylmercury was ap-parent in the Minamata incident when 22 infants were born with clinical features of cerebral palsy (loss of control by brain) (Harada 1968).
4.2 Lead 4.2.1 Absorption and Distribution Inorganic lead compounds are absorbed through the gut or lungs. Organic lead compound are, in addition readily ab-sorbed through the skin but are major hazard only to those handling them during manufacture and transportation as it may be absorbed from leaded petrol in sufficient amount to produce intoxication. Lead absorbed through the gut is de-pendent on a number of factors, being markedly affected by other constituents of the diet e.g calcium and iron. Phosphate deficiency in diet enhances lead uptake as does protein defi-ciency or fat excess. (Mylroie et al 1980). About 10% of amount ingested is absorbed but rate of absorption from gut bears an inverse relationship to age i.e Children absorb more than adults. Lead vapour and particulate are absorbed through the lungs. At normal respiratory rate about 30% of air borne particles is deposited in the lungs of which 40-50% is ab-sorbed into the blood (U.K. Dept. of Environment 1974). Ab-sorbed lead is bound to the sulphhydryl groups of red blood cell. Plasma levels are relatively constant and may be con-
29

trolled by calcium ion concentration in the plasma. Its distri-bution in the body tissues is shown in figure 4.
30
BLOOD
RED CELL/PLASMA SOFT TISSUES BONE
URINE BILE, HAIR SWEAT, NAILS
Figure 4: Distribution of Lead in the body (Waldron 1980c)
Lead has no tendency to accumulate in the soft tissues espe-cially after the second decade. Bone lead level increases with age and by the 6th and 7th decades could be up to 200mg in men. Lead, like mercury readily crosses the placental barrier. Excretion of lead occurs mainly through the kidney, but it also goes through faeces, sweat, nail and hair. Human milk contains between 5 and 12mg/litre lead depending on the level of exposure of the mother (Lam and Rosen 1974). This is harzadous to infants as their gastrointenstinal absorption is quite high.Absorption of lead from the gut varies inversely with the concentration of calcium in the diet and it may ac-

FUNAAB INAUGURAL LECTURE SERIES
the absorption of calcium (Gruden et al 1974). In the bone lead displaces calcium in the hydroxyapatite crystal and low intake of calcium increases bone lead levels. In the kidney, low levels of calcium in the diet increases soft tissue concentra-tions and this may cause proximal tube damage (Goyer and Rhyne 1973). Lead interferes with the absorption of iron from the gut and also during haem synthesis inhibiting haem syn-thesis at a number of stages. The distribution of alkyl lead compound is different from inorganic lead. They have no af-finity for bone but for lipid-rich tissues; hence the brain and liver have the highest concentration of organic lead.
4.2.2 Toxicity The toxic effects of lead are directed mainly against the blood, the nervous system and the kidney. In the blood, lead in com-mon with other toxic metals is a potent inhibitor of sulphhy-dryl enzymes and this effects haem synthesis. At least five stages of haem synthesis are affected by lead but the two en-zymes most affected are amino laevulinic acid dehydratase (ALAD) and ferrochelatase. This results in increased amount of ALA in plasma and a corresponding increase in urine. These effects are more pronounced in lead workers or in peo-ple with lead poisoning. This could result in anaemia though this is usually a late sign and is seldom severe, except if ac-companied by iron deficiency.
31

FUNAAB INAUGURAL LECTURE SERIES
Lead impairs the efficient functioning of the nervous system, and if calcium is deficient, the impairment is even more se-vere, affecting some central neurotromitters (Waldron 1980). In the kidney, it causes tubular and other damages. Lead poisoning are of three types: i. Inorganic lead poisoning in adults gives rise to colic (flatulent distension of the abdomen without diarrhoea), nau-sea and vomiting. Neurological symptoms in industrial workers:- nerve condi-tions slow down even when the worker appears clinically nor-mal. ii. Encephalopathy (inflammation of the brain) occurs in adults who are heavy drinkers of wine made or stored in poorly-glazed earthen wares. The major symptoms include ir-ritability, tremor and hallucination, headaches, restlessness, loss of memory and inability to concentrate. These may pro-gress to delirium, mania (violent madness) convulsion, paraly-sis and comma. iii. In children, lead poisoning results in encephalopathy, espe-cially children in pica(1-3years). At this age, children are in the habit of always putting things to their mouth and pick a lot of lead from dust. Lead-containing paint is the most common but dust rich in lead from exhaust pipes of vehicles in areas of
32

FUNAAB INAUGURAL LECTURE SERIES
heavy traffic density also contribute. Organic lead poisoning has symptoms which include insom-nia, delirium, hallucinations and tremor. It mostly occurs in people handling TEL in leaded petrol. In organic lead poison-ing, the total blood lead concentration may be normal but the contents in lipid-rich organs are usually high. 4.3 Cadmium 4.3.1 Absorption and Distribution Only about 5.6% of inhaled cadmium is absorbed while 40% is deposited in the lungs. Between 50-70% of the total intake of cadmium is deposited in the liver and kidney with one-third of this amount in the kidney. Very little cadmium is present in the bones, muscles or central nervous system. The amount in the blood is extremely small (1-5mg/litre) and unabsorbed cadmium is excreted in the faeces while the kidney excretes just 1-2% of absorbed cadmium. 4.3.2 Toxicity of Cadmium Accidental ingestion of cadmium results in prompt nausea and vomiting which could limit its effect to the upper intesti-nal tract. This could occur by storing or cooking foods in cad-mium plated utencils. Exposure to cadmium oxide fumes re-sult in acute pneumonitis which could sometimes be fatal. Cadmium fumes are even more toxic than cadmium oxide
33
FUNAAB INAUGURAL LECTURE SERIES
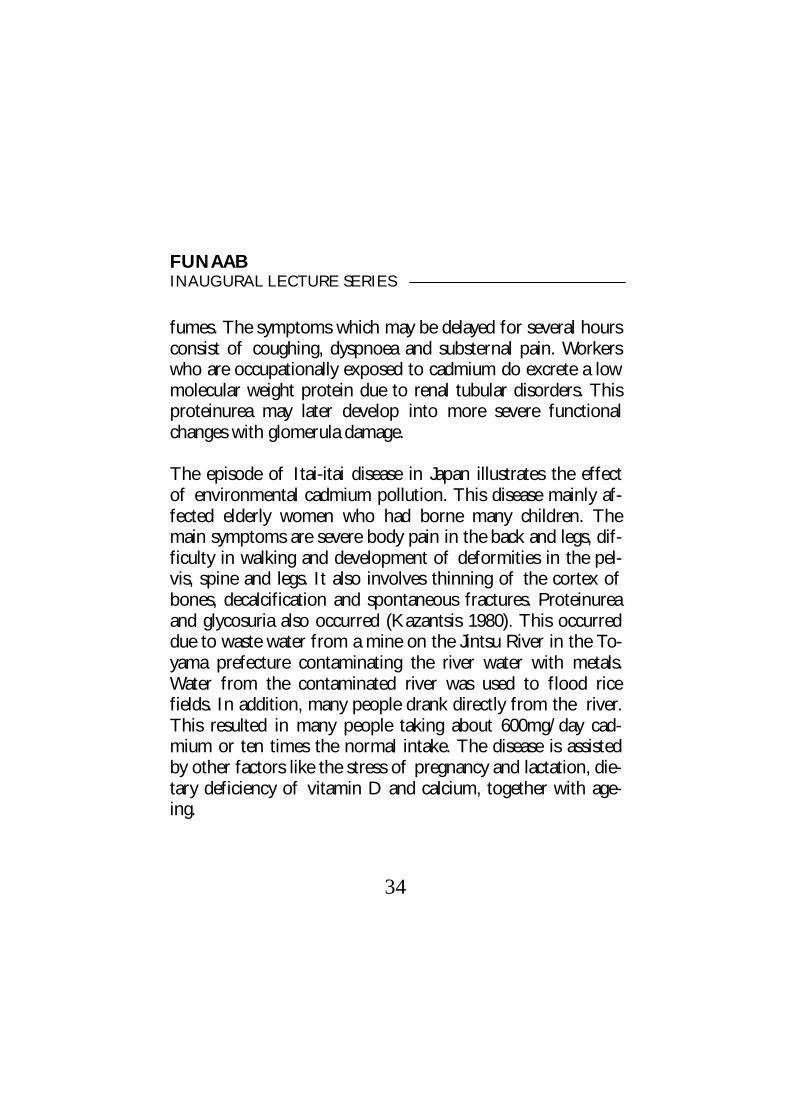
fumes. The symptoms which may be delayed for several hours consist of coughing, dyspnoea and substernal pain. Workers who are occupationally exposed to cadmium do excrete a low molecular weight protein due to renal tubular disorders. This proteinurea may later develop into more severe functional changes with glomerula damage. The episode of Itai-itai disease in Japan illustrates the effect of environmental cadmium pollution. This disease mainly af-fected elderly women who had borne many children. The main symptoms are severe body pain in the back and legs, dif-ficulty in walking and development of deformities in the pel-vis, spine and legs. It also involves thinning of the cortex of bones, decalcification and spontaneous fractures. Proteinurea and glycosuria also occurred (Kazantsis 1980). This occurred due to waste water from a mine on the Jintsu River in the To-yama prefecture contaminating the river water with metals. Water from the contaminated river was used to flood rice fields. In addition, many people drank directly from the river. This resulted in many people taking about 600mg/day cad-mium or ten times the normal intake. The disease is assisted by other factors like the stress of pregnancy and lactation, die-tary deficiency of vitamin D and calcium, together with age-ing.
34
FUNAAB INAUGURAL LECTURE SERIES
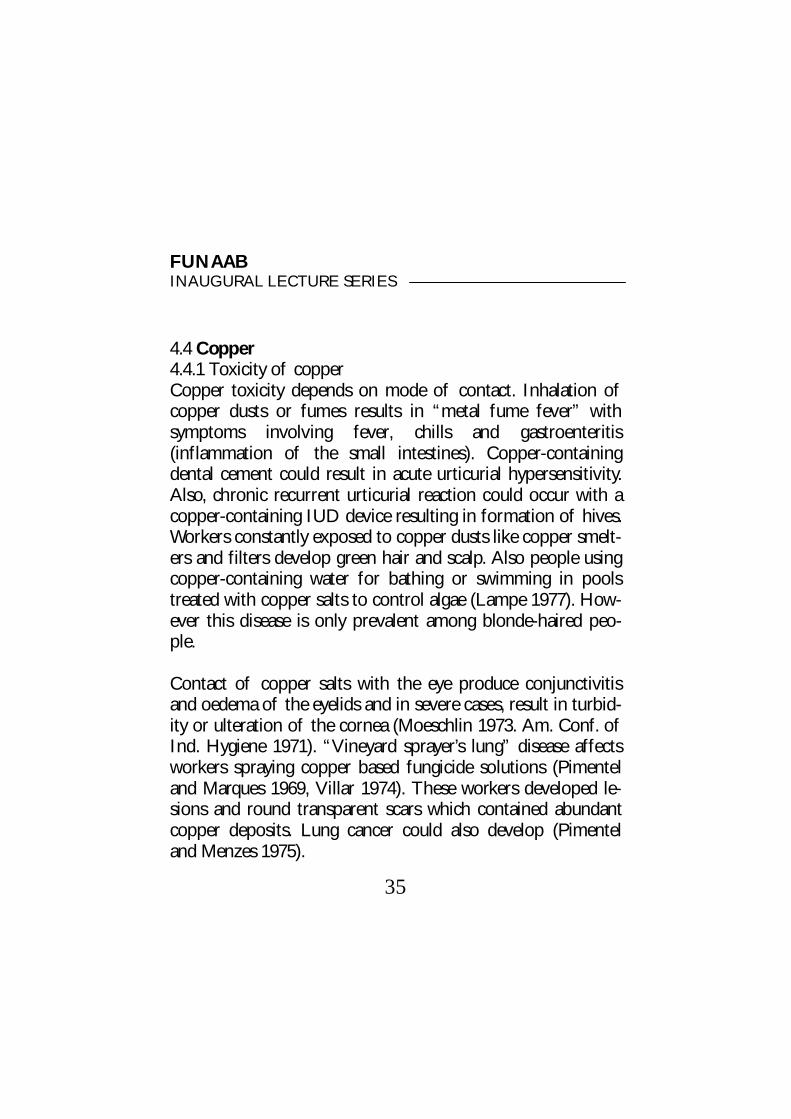
4.4 Copper 4.4.1 Toxicity of copper Copper toxicity depends on mode of contact. Inhalation of copper dusts or fumes results in “metal fume fever” with symptoms involving fever, chills and gastroenteritis (inflammation of the small intestines). Copper-containing dental cement could result in acute urticurial hypersensitivity. Also, chronic recurrent urticurial reaction could occur with a copper-containing IUD device resulting in formation of hives. Workers constantly exposed to copper dusts like copper smelt-ers and filters develop green hair and scalp. Also people using copper-containing water for bathing or swimming in pools treated with copper salts to control algae (Lampe 1977). How-ever this disease is only prevalent among blonde-haired peo-ple. Contact of copper salts with the eye produce conjunctivitis and oedema of the eyelids and in severe cases, result in turbid-ity or ulteration of the cornea (Moeschlin 1973. Am. Conf. of Ind. Hygiene 1971). “Vineyard sprayer’s lung” disease affects workers spraying copper based fungicide solutions (Pimentel and Marques 1969, Villar 1974). These workers developed le-sions and round transparent scars which contained abundant copper deposits. Lung cancer could also develop (Pimentel and Menzes 1975).
35

FUNAAB INAUGURAL LECTURE SERIES
4.5 Zinc 4.5.1 Toxicity of Zinc Exposure to zinc fumes or dust results in “metal fume fever” characterised by fever, chills and gastro-enteritis. Symptoms of zinc toxicity include dehydration, electrolyte imbalance, ab-dominal pain, nausea, vomiting, lethargy, muscular in-coordination etc. Zinc chloride ingestion could lead to acute renal failure, while zinc sulphate ingestion could lead to gas-trointestinal bleeding (Moore 1978).\ 5.0 MY RESEARCH CONTRIBUTIONS 5.1 Method Improvement My first major research contribution was the modification of an existing method of analysis to make it more efficient and more accurate while still maintaining the simple nature of the method. It is titled “Modification of Bethge’s open system ap-paratus for the Determination of Mercury in Biological Mate-rials” published in 1990 in “International Journal of Environ-mental Analytical Chemistry”. Mercury is a very volatile element with a vapour pressure of 19.9 x 104mm and prevention of losses during open system method of digestion was a major problem. Since many labora-tories cannot afford the closed system method of digestion due to cost, it became appropriate to make the open system
36
FUNAAB INAUGURAL LECTURE SERIES
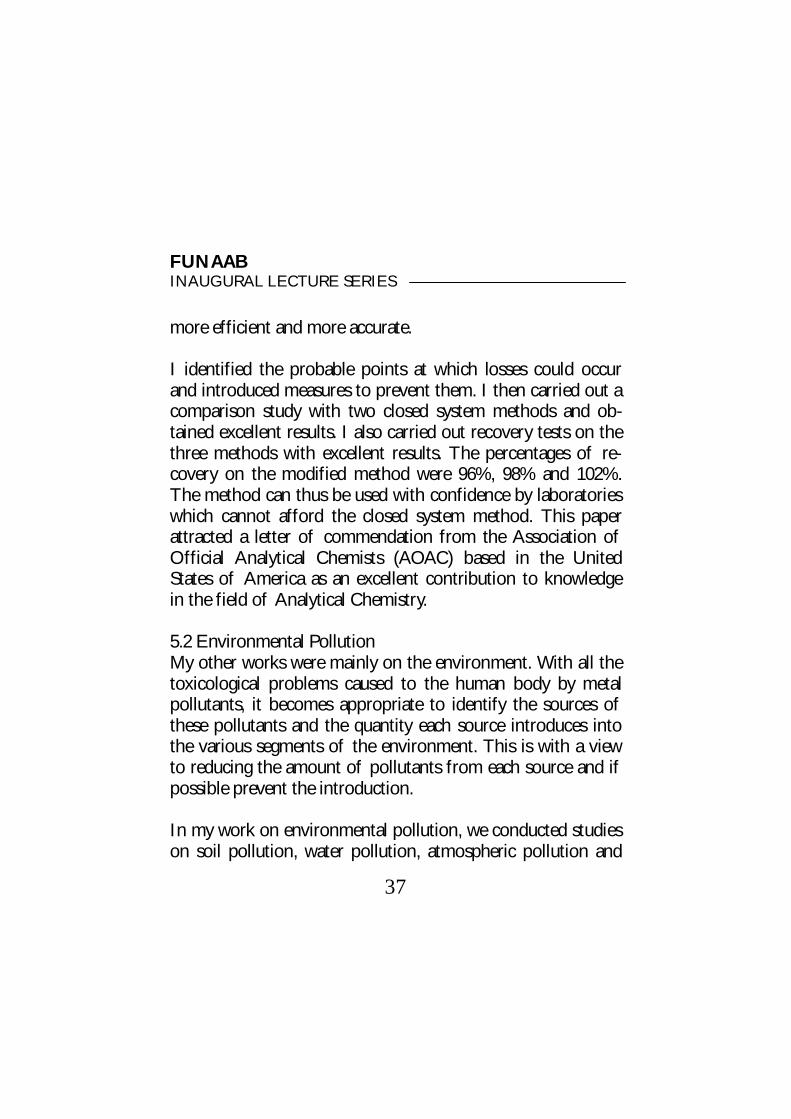
more efficient and more accurate. I identified the probable points at which losses could occur and introduced measures to prevent them. I then carried out a comparison study with two closed system methods and ob-tained excellent results. I also carried out recovery tests on the three methods with excellent results. The percentages of re-covery on the modified method were 96%, 98% and 102%. The method can thus be used with confidence by laboratories which cannot afford the closed system method. This paper attracted a letter of commendation from the Association of Official Analytical Chemists (AOAC) based in the United States of America as an excellent contribution to knowledge in the field of Analytical Chemistry. 5.2 Environmental Pollution My other works were mainly on the environment. With all the toxicological problems caused to the human body by metal pollutants, it becomes appropriate to identify the sources of these pollutants and the quantity each source introduces into the various segments of the environment. This is with a view to reducing the amount of pollutants from each source and if possible prevent the introduction. In my work on environmental pollution, we conducted studies on soil pollution, water pollution, atmospheric pollution and
37

FUNAAB INAUGURAL LECTURE SERIES
control methods. 5.2.1 Soil Pollution 5.2.1.1. Refuse dumpsites For example in our study of the pollution effect of refuse dumpsites in Abeokuta, we collected top soil in these sites as well as in the control sites and analysed them for heavy metal pollutants. Results showed that the top soil in the sites has a range of 65.77 to 634.3 mg/kg dry weight for copper, 289.3 to 360.1 for iron, 5.52 to 145 for lead, 100.8 to 226.6 for zinc and 4.65 to 50.5 for cadmium. These results are significantly dif-ferent from those of control sites values indicating that these sites are sources of pollution (Odukoya et al., 2001). Some of these metals like lead, cadmium and chromium are toxic met-als while copper and zinc are toxic at high concentrations and cause health problems when consumed e.g lead causes lead poisoning consisting of impairment of the efficient function-ing of the nervous system, it also causes renal tubular damage. Cadium causes Itai-itai disease characterized by severe pains in the back and legs, deformities in the pelvis, decalcification and spontaneous fracture especially among elderly women. Iron overload in the body leads to cirrhoses and deposition of iron in the lungs, pancreas and heart (Corine and Lawcer, 1977). Most of these refuse dumpsites are located near streams and rivers. The metals are thus leached into these wa-
38

FUNAAB INAUGURAL LECTURE SERIES
ter bodies from run-offs during rainfall and accumulate in aquatic organisms (fish, shrimps, crabs etc) and thus enter the food chain. It is recommended that refuse dumpsites be lo-cated away from water bodies. Also, the refuse could be sorted into metallic and non-metallic components and the metallic components could then be recycled. We also noticed some edible vegetables growing on these re-fuse dumpsites. These vegetables look healthy and attractive due to the great quantity of carbon in the refuse. Our analysis of metal contaminants in the vegetables showed that they contained toxic metals at high concentrations e.g lead levels range from 2.00 to 372mg/kg, Copper 0.20 to 44.00, Chro-mium 2.90 to 103, Iron 25.50 to 150.5 and Zinc 8.35 to 64.5 respectively. I wish to suggest that people should be careful and check the sources of the vegetables they buy in the market in order to avoid health risks due to consumption of these contaminating metals 5.2.1.2.Scrap-metal dumpsites Another major source of heavy metal pollution is the scrap-metal dumpsites in mechanic villages. Mechanic villages dot our cities and urban centres. Some cities have three or four mechanic villages. In Abeokuta, the prominent ones are at Bisi
39
FUNAAB INAUGURAL LECTURE SERIES
Onabanjo road, Campsite, Kobape and Lagos road villages. Motorists take their vehicles for repairs at these villages during which process a lot of scrap metals are generated and dumped in various heaps in the villages. Our study on these mechanic villages consisted of top soil in 42 scrap metal dumpsites in three villages: Kobape, Bisi Onabanjo Road and Campsite. Re-sults show that the top soil in these villages have a range of 64.5 to 435mg/kg weight for copper, 22.05 to 111.3 for lead, 85.1 to 207.0 for zinc, 1.300 to 6.290 for chromium and 235.2 to 702.8 for iron which are significantly different from the val-ues for the control site (Odukoya, 2004). These scrap metals are exposed to the weather where they undergo oxidation which makes them soluble in rain water and run-offs into streams and rivers. Here they accumulate in aquatic organisms and enter the food chain. Some seep through the soil to pol-lute underground water and in areas where the population de-pends heavily on underground water (most urban and rural dwellers) and thus to man. 5.2.1.3 Street dusts Another study on soil pollution was the one on street dusts in Abeokuta and Ijebu-ode for lead, iron, copper and zinc. This pollution arises from the effluent air from the exhaust pipes of motor vehicles. The results showed that the level of lead in street dusts depend on the traffic density in that area, being highest for high traffic density areas like Sapon, Lafenwa,
40

FUNAAB INAUGURAL LECTURE SERIES
Kuto, Ita-Osin and lowest in places like Akomoje Water Works area and Ibara Housing Estate. The other metals showed similar trend except where local activities like welder’s workshop, blacksmith workshop etc contributed to the levels of specific metals. The trend is the same at Ijebu-Ode. However, during rains, the dust is washed into water bodies thus polluting the rivers and the metals accumulate in aquatic organisms thus entering the food chain (Odukoya, 1999). A study on the pollution status of Ogun River showed that the river picked up significant amount of metals and other pollutants during its flow through Abeokuta. These pollutants came from industrial effluents of Adire industry, Apex paints, Midgal and other industries (Odukoya, 2000). 5.2.2 Water Pollution 5.2.2.1 Industrial effluents We also studied industrial effluents as a source of water pollu-tion. In most of these industries, the liquid effluents are dis-charged into drainages, canals and water ways without treat-ment. The industries studied are paint industry, galvanizing industry, textile industry and aluminium industry (two of each type), at Ikeja Industrial Estate. The results showed that the effluents contain high levels of pollutant which are discharged into the environment. These results are summarized in table 6
41

FUNAAB INAUGURAL LECTURE SERIES
42
Table 6: Average Levels of Selected Metals in Effluents of Some Nigeria Industries (M±S.D. and are expressed in mg/litre). Cadmium Chromium Copper Iron Zinc potassium Sodium
Paint 0.95±0.18 5.50±0.07 0.90±0.16 3.80±0.20 7.30±0.08 8.40±0.02 60.00±1.2
Galvanising 0.38±0.06 3.00± 0.28±0.03 0.95±0.03 7.64±0.06 8.40±0.34 12.00±0.06
Textil 0.76±0.11 5.10±0.06 0.96±0.12 1.60±0.02 2.30±0.02 8.00±0.28 42.00±0.14
Aluminium 0.76±0.12 4.4±0.07 0.81±0.09 1.31±0.10 4.61±0.04 8.80±0.36 152±1.8
Source : Odukoya 1999
Some of these industries were co-operative and allowed us to collect the effluents while many of them were hostile using their security personnel to chase the students away from their premises. However, students especially boys will always find a way to outwit them. Ring Road (Ibadan) Land fill site We also studied the pollution effect of solid waste landfill on underground and surface water quality at Ring Road, Ibadan. This landfill site was closed down in 1991 after being in use for over 20 years during which period it received both domes-tic and industrial wastes. The wastes were burnt periodically generating a lot of ash from combustible materials and con-verted metals to their oxides, thereby increasing the solubility
FUNAAB INAUGURAL LECTURE SERIES
of various substances in the water percolating into the soil. The immediate vicinity of the landfill site is a highly populated residential area which depends mostly on underground water for cooking and other domestic purposes due to inadequate supply of portable tap water- a common problem in Ibadan and many cities in Nigeria. Results show that the solid landfill site leached a large number of pollutants into the underground water (wells) and surface water (stream) flowing around the site. These pollutants in-clude chloride, phosphate, sulphate, phenol, lead, aluminum, cadmium, chromium, calcium, iron etc. The levels of phosphate, iron, lead, cadmium and phenol in the underground water were higher than the WHO guidelines for drinking water quality. Considering that lead, cadmium and phenol are toxic substances, the ground water is not suitable for human consumption. It is recommended that treated port-able tap water be provided for the inhabitants of this area soonest.Odukoya et al 2001) Effect of Highways Another source of water pollution especially underground wa-ter are highways. The polluting effect of highways on underground water was studied using three districts in Ogun State: Sango/otta, Benin
43
FUNAAB INAUGURAL LECTURE SERIES
– Sagamu Express way and Abeokuta districts, using 15 wells in each district. The metal pollutant studied include the metals lead, zinc, iron, aluminum, sodium and potassium while the non-metals in-clude, pH, conductivity, chemical oxygen demand (COD), al-kalinity, total hardness, total solid, dissolved solid, suspended solid, nitrate, phenol. The levels of these pollutants show sig-nificant difference compared to the levels in the control sam-ples showing that the underground water along the highways are polluted and that highways have pollution effect on under-ground water near it due to the following reasons (1) the com-bustion of leaded petrol by motor vehicles which introduce lead and other metallic and non-metallic pollutants into the atmosphere (2) other human (anthropogenic) activities which are located along the highways e.g. industries, petrol filling sta-tions, toll gates, car parks, automobile workshops, welder’s workshop, refuse dumpsites, markets etc. Thus highways con-stitute a source of both metallic and non-metallic pollution of underground water especially in Nigeria and other developing countries. Comparison of the values of these parameters with WHO guidelines on drinking water standards shows that the following parameters have levels higher than the recom-mended values in all the samples; lead, iron, nitrate, sulphate and phosphate; conductivity in most of the samples and total hardness in many of the samples. Considering the fact that
44

FUNAAB INAUGURAL LECTURE SERIES
lead is a toxic metal, iron is toxic at high concentrations, and nitrate is also toxic causing metheglobinemia (blue baby syn-drome), it can be concluded that water from these sources is not fit for domestic use like drinking or for food preparations( Odukoya et al 2010). Pollution Through Grinding Methods Apart from metal contamination of food through aeriel depo-sition on soil and vegetation and through aquatic pollution by untreated effluents, another source of metal contamination of food is through grinding. In our work of contamination through this source, we studied the relative contamination of food by grinding stone, blender and disc attrition mill using cowpea, onion, pepper, tomato and maize. Results showed that the uptake of the metals was highest with the disc attrition mill followed by the blender and lastly by grinding stone. The blades of the blender and the disc of the attrition mill are composed mostly of iron and there is the possibility of rusting through constant use under wet condi-tions, which will further increase the leaching. Hence iron is the most taken up metal. The uptake of iron is significant in all the three methods even from grinding stone. The disc attrition mill, from which significant quantities of iron, copper and zinc were picked up is the popular choice for
45
FUNAAB INAUGURAL LECTURE SERIES
grinding food stuff by urban dwellers. Contamination of food by metals during grinding could constitute health risk since high levels of these metals, are toxic (Corinne and Lawcer 1977, Rober 1978, Lyon 1980). However processing of pep-per, tomatoes, and onions into stew and maize into fine paste (ogi) and porridge (eko) involves substantial slurring with wa-ter, This dilution effect will reduce the quantity of the con-taminants (Odukoya et al., 2005) 5.2.3 Atmospheric Pollution 5.2.3.1. Lead in tree barks. Atmospheric pollution studies carried out included determina-tion of level of metals retained by tree barks along major streets in Abeokuta. The use of trees to monitor atmospheric pollution stems from the fact that trees are widely distributed and remain in fixed position over a considerable period of time, thus enabling analysis of trend over time intervals. The tree Azardiracta indica (Dongoyaro) was used for this study because it is widely distributed. The metals lead, zinc and cop-per were determined in the tree barks from 40 locations span-ning high and low traffic densities in Abeokuta. Results showed that the level of the metals in the tree barks varied with traffic density, being highest in high traffic density areas and lowest in low traffic density areas. The sources of these metals are the exhaust pipes of motor vehicles which
46

FUNAAB INAUGURAL LECTURE SERIES
discharges exhaust effluent into the air thus polluting the air. The polluted air is inhaled taking the pollutants into the hu-man body while some airborne particles settle on vegetation. The tree used for this study is also used for medicinal pur-poses. The bark is boiled in water and the extract taken for the treatment of malaria fever. This allows the toxic metals to get into the human body through this route and cause health, problems (Odukoya et al, 2000). Wet precipitation Another atmospheric study was the study of the chemical composition of rain water in Ibadan to monitor the type and composition of pollutants in the atmosphere, since various gases and particulates are discharged into the atmosphere daily as a consequence of human activities, Rainfall is the most effi-cient cleaning agent of the atmosphere and its chemical com-position is an indicator of atmospheric pollution. Acid rain occurs as a result of interaction between oxides of sulphur and nitrogen with rain water and is a major environmental problem. It causes several damage to vegetation and farm crops, increases the acidity of lakes, streams and rivers and damages monuments made of marble and also effects soil ecology. Results showed that the rainwater in Ibadan was pre-dominantly neutral with the pH ranging from 5.8 to 7.0 with the average at 6.6. Result obtained for the four cations and four anions indicated a relatively modest atmospheric pollu-
47

FUNAAB INAUGURAL LECTURE SERIES
tion over Ibadan (Onianwa et al, 2002) 5.3 Lead Body Burden 5.3.1. Human scalp hair. The level of lead in human scalp hair was also studied as an indicator of the lead body burden. This was done across three cities of Lagos, Abeokuta and Ibadan for non-occupationally exposed individuals. The major source of lead into the environment is the exhaust pipe effluents of motor vehicles using leaded petrol. Other sources include uses like cables and sheathings, lead acid accu-mulators etc. the lead in air can be inhaled by man; settle on vegetation and soil, get washed into water ways, streams and rivers during rainfall and accumulate in aquatic organisms thereby entering the food chain and thus getting to man to cause health problems. Result showed that the range of lead in human scalp hair is higher in Lagos (2.9 - 251 mg/g) followed by Abeokuta (1.6 - 210mg/g) and lastly Ibadan (2.2 – 167mg/g). It also showed that only about 50% of the sampled population have lead lev-els within safe limits of non-occupational exposure. About 18% have levels indicative of high risk exposure i.e. above threshold limit. These results underscore the need to urgently phase out the use of leaded petrol which is the primary source of lead pollution in the Nigerian environmental (Ajayi et al,
48
FUNAAB INAUGURAL LECTURE SERIES
2001). 5.3.2. Lead in blood Following all these sources of metal pollution and their vari-ous routes into the human body (especially lead) we con-ducted a study on the lead levels in the blood and urine of some residents in Abeokuta as indicators of lead body burden. The subjects were FUNAAB students used as control, petrol attendants at filling stations and pregnant women. We used a total of 147 subjects consisting of 24 students, 67 petrol at-tendants and 28 pregnant women. Biological monitoring of metals was performed to provide information on absorption following exposure for an assessment of risk to health. Blood and urine were the media used. The pregnant women were mostly traders having stalls beside the streets or hawking their wares along the streets. Result showed that in both male and female petrol attendants, the blood lead levels were significantly higher than the control values. While the male levels were 2.6 times higher than con-trol values, the female levels were 2.3 times higher. Similar trend occurred in the urine level. While the urine lead leves in the male was 2.9 times higher than the control levels, the fe-male levels were 3.2 times higher. For the pregnant women, the blood level was 2.5 times higher
49

FUNAAB INAUGURAL LECTURE SERIES
than control values in the second trimester while it was 3.6 times higher in the third trimester. About 70% of these blood lead levels were excreted in the urine. Since the major route of lead into the atmosphere is the use of leaded gasoline, this problem should be most urgently addressed.(Onunkawor 2004). 5.4 Metals in Nigerian Fishes Since the final destination of all these metal pollutants is the marine environment i.e. rivers and seas, where they accumulate in aquatic organisms (fish, shrimps etc) which are consumed by man, we carried out a study of the metal contents of Nige-rian Fishes using freshwater fishes, brackish water (lagoon) fishes and sea fishes. Results showed a range of 0.03 – 0.63mg/kg wet wt for mercury, 0.01 – 0.33 for lead, 0 – 0.01 for cadmium, 0.07 – 0.63 for copper and 2.3 – 7.1 for zinc in freshwater fishes while the range is 0.05 – 0.21 for mercury,0-0.02 for lead,0.05-0.21 for copper and 1.50 – 4.60 for zinc in Lagos lagoon (brackish water) fishes. The range is 0.05 – 0.16 mg/kg we ut. for mercury,0- 0.02 for lead, 0 – 0.23 for cad-mium, 0.11 – 0.68 for copper and 3.4 – 12.3 for zinc in the fishes of coastal Atlantic ocean. (Odukoya and Ajayi 1987a, Odukoya and Ajayi 1987b, Odukoya and Ajayi 1988). These data are summarized in table 7 below.
50

FUNAAB INAUGURAL LECTURE SERIES
51
Table 7: SUMMARY OF METALS IN NIGERIA FISHES (MG/KG WET WEIGHT)
Copper Zinc Lead Cadmium Mercury
Fresh water 0.07-0.63 2.3-7.1 0.012-0.32 0.00-0.013 0.03-0.63
Brackish water 0.05-0.21 1.5-4.6 0.00-0.02 0.001-0.002 0.05-1.16
Sea water 0.11-0.68 3.4-12.3 0.00-0.02 0.00-0.23 0.05-0.21
Maximum permissible level
40.0 2.0 2.0 0.5
Challenges based on cultural beliefs In the course of these studies on soil pollution we encoun-tered some incidences, some funny and some hostile reactions based on some traditional and cultural beliefs of Nigerians. E.g. a student went to collect top soil samples from refuse dump sites only to attract this type of comments from passers-by. “What a pity! This fine young boy in his prime has been made insane”. During the collection of samples of street dust, a student wanted to collect street dusts at Ita-Osin in front of some shops and the student was nearly lynched by the shop owners.

FUNAAB INAUGURAL LECTURE SERIES
She was accused of having been sent by enemies to collect dust in front of their shop to prepare charms capable of driv-ing their customers away. In a related incident, we were collecting street dust sample in front of Moore Petrol filling station, Obantoko when we no-ticed the manger coming at us with great fury and demanding to know what we were doing in front of his station. It took a lot of skill to calm him down and convince him that we meant no harm, we only needed a landmark for ease of identification of the sampling spot. Another incident occurred at Ikare.Ondo State. We wanted to study the pollution status of a lake. The student, an M. Sc stu-dent from FUTA) was asked to consult “Baba” in charge of the lake before being allowed to collect samples. The Baba wondered at the audacity of the student and asked him if he had ever heard or seen anybody collecting water from that lake before and refused to allow the student to collect samples. However he asked the student how he even conceived the idea of coming to the lake to which the student replied that his Oga sent him where upon the Baba decided to pray for him as follows:- ‘’May God never allow such dangerous and hazard-ous thoughts to get into the brain of your Oga and yourself again” and thereafter sent him away.
52
FUNAAB INAUGURAL LECTURE SERIES
6.0 Pollution Control 6.1 Treatment of Industrial effluents A large number of manufacturing industries abound in our urban centres like Lagos which has the highest concentration, Sango- otta, Ibadan, Kano, Kaduna, Enugu, Port-Harcourt etc. These industries discharge their untreated effluents into city’s water-ways thus polluting the marine environment. These industries should be made to have effluent treatment tanks where the level of metal concentrations could be re-duced to acceptable levels before discharge. Various methods of doing this are as follows:- i. Treatment of these effluents with lime increases the pH and results in the precipitation of these metals as hydroxides which settle at the bottom of the tank. This method is effi-cient especially when coupled with addition of disulphide (Jenko et al 1983). ii. Based on the use of Water Hyacinth plants. Towards this objective, I developed a simpler method based on treatment with water hyacinth (eichornia crassipes) plants which reduced the levels of pollutants considerably and even removed some completely. This study was carried out on the effluents of seven different industries (two of each type) from Lagos, Ogun and Oyo State. These are galvanizing industry, paint in-dustry, textile industry, battery industry, breweries industry and
53
FUNAAB INAUGURAL LECTURE SERIES
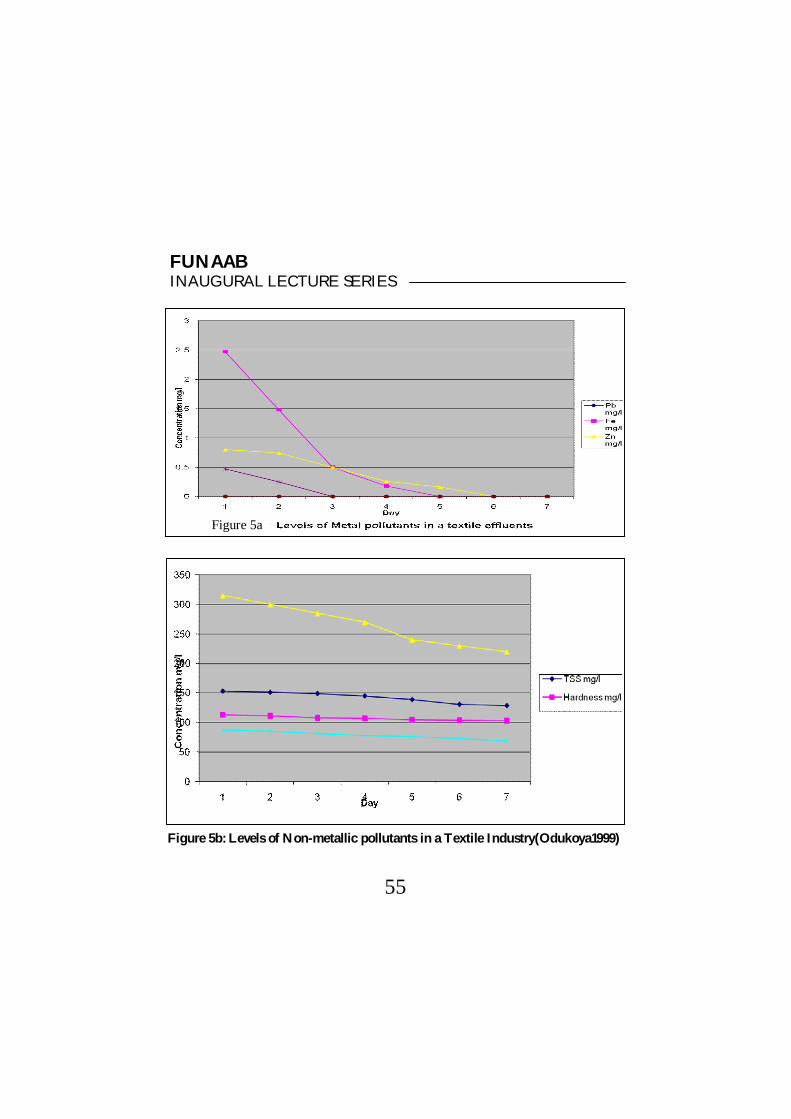
food industry. After adjusting the pH to neutral pH (6.5 to 7.5) the plants were cultured in each of these effluents for seven days. Results showed that the plant removed many of the pollutant completely within six days and reduced others considerably e.g lead which has a range of 11.5mg/l – 19.5mg/l in the efflu-ents was completely removed in textile, food, paint and brew-ery industrial effluents while it was reduced by 80.3% in bat-tery industrial effluents in six days. The non-metallic and organic pollutants were also substan-tially reduced or completely removed e.g nitrate has concentra-tion range of 20mg/l to 190mg/l. At the end of day 6, it was completely removed in dairy, battery, food and galvanizing in-dustrial effluents while it was reduced by 77.5% in brewery, 76.1% in paint, and 53% in textile industrial effluents. This is further illustrated in figure 5a and 5b (Odukoya and Oniyitan, 2003). The ability of the plant to multiply rapidly producing a lot of biomass in a very short time makes it all the more suit-able for this purpose (Phillip et al 1993)
54
FUNAAB INAUGURAL LECTURE SERIES
55
Figure 5b: Levels of Non-metallic pollutants in a Textile Industry(Odukoya1999)
Figure 5a

FUNAAB INAUGURAL LECTURE SERIES
Application
The effluent from the industry should be channelled into a concrete tank 360 square feet in area (15ft x 24ft) and 15ft deep and treated with water hyacinth plants for seven days. It is then subjected to further treatment in a second tank for an-other seven days to be doubly sure of complete removal of all pollutants before discharge into water ways and canals. Also the discharge of lead and other metallic particles into the air from the exhaust pipes of motor vehicles should be re-duced and eventually stopped by replacing TEL antiknock ad-ditives with alternative cyclic organic compounds. As at 2009 Nigeria gasoline contained 0.65-0.74g/litre of lead (Orisakwe 2009). Domestic refuse could be sorted by magnetic separator into metallic and non-metallic wastes. The metallic wastes could then be re-cycled. Similarly scrap metals in dump sites in mechanic villages could be collected and recycled instead of being left to the mercy of the weather which results in pollu-tion. IF WE TAKE CARE OF THE ENVIRONMENT, THE ENVIRONMENT WILL TAKE OF US 6.2 Treatment of Victims of Lead Poisoning Treatment of victims of metal poisoning usually consists of
56

FUNAAB INAUGURAL LECTURE SERIES
(a). removing the victim from the source of exposure (usually his or her livelihood). (b). treating with chelating agents like BAL, D-penicillamine, EDTA etc which form soluble chelates with the metal and is excreted in the urine. This can only be done by hospitalization under medical observation. In 2004, Prof. Ademuyiwa, myself and two M.Sc students car-ried out a study in which we developed a simpler and more efficient method of reducing the level of lead in the human body using 2 weeks ascorbic acid (vitamin C) supplementa-tion. The subjects used for the study include 14 UNAAB stu-dents, 27 petrol station attendants and 21 auto-mechanics which represent those who consented to participate in the study. Their blood (10ml venous blood) and urine samples were collected before and after 2 weeks ascorbic acid supple-mentation. The ascorbic acid was given to each subject as a daily dose of 500mg for two weeks. The blood and urine sam-ples were analysed for lead and urine and some biochemical parameters associated with lead toxicity before and after the ascorbic acid supplementation. Results showed that the supplementation produced a signifi-cant reduction in blood lead in the occupationally exposed subjects (P < 0.05). The reduction in blood lead amounted to 57% in the male petrol station attendants, 50% in the female
57

FUNAAB INAUGURAL LECTURE SERIES
petrol station attendants and 44% in the auto-mechanics. Uri-nary excretion of lead increased remarkably in the occupation-ally exposed subjects. The biochemical effects associated with the toxic effects of lead also respondecd positively to the ascorbic acid regime (Onunkwor et al., 2004). This method has the following advantages. a) The victim does not need to be removed from the source
of exposure (usually his livelihood) b) No hospitalization or medical observation is required c) Vitamin C is cheap and easily available. It is also a food
supplement. In 2012, there was an incident of lead poisonous in Zamfara State and a lot of untrained people including children were mining lead and other metals. Many children died of lead poi-soning. While nothing could be done about the source of the lead other than sealing it off, the children could have been saved with vitamin C therapy. 7.0 CUREENT WORKS 7.1. Study of the environmental impact assessment of some industries i.e effect of these industries on the soil, vegetation and underground water of the area of location. Usually the vicinity of these industries are heavily populated residential areas. The industries studied are:
58

FUNAAB INAUGURAL LECTURE SERIES
Exide Battery, Ibadan. Ewekoro Cement Factory. Waste Bat-tery Crushing site, Ibadan 7.2. We studied the lead body burden of Primary school children in public schools in Ibadan North West Local Gov-ernment. In addition we determined the level of lead in the classroom dusts and in the playground soils and correlated the lead in the blood and urine of the pupils with the level in the classroom dusts and playground soil. The children at this age group are very susceptible to taking contaminated food. e.g at ages up to 10 years, they still pick food that fall to the ground when eating, unmindful of con-tamination and so consume a lot of harmful contaminants. Most of these schools are located in areas of high traffic den-sity and the soil contains a lot of lead and other metal con-taminants. Some of the pupils (92.1%) have blood lead levels above the threshold limit. It is recommended that the pupils be given vitamin C supplementation to reduce the levels of lead in their blood. This type of study has many challenges. The parents have to be motivated to give their consent to allow their children to participate in the study. On this occasion, it was an election year and there was controversy about the incumbent govern-
59

FUNAAB INAUGURAL LECTURE SERIES
ment giving free food to school children. This was interpreted as intention to use some children for rituals designed to win elections. With this background, no Headteacher was willing to allow his pupils to donate blood and urine samples. This necessitated waiting for six months after the elections before commencement of the study. 7.3. Another completed study is the determination of or-ganic pollutants in the effluents of pharmaceutical industries. The industries produce a wide range of pharmaceutical prod-ucts in the course of which they generate effluents which con-tain toxic organic pollutants which are discharged into water ways. We found many of these pollutants in the effluents which could cause health problems when consumed by hu-mans either through aquatic organisms or through water. Other studies are still on-going.
60
FUNAAB INAUGURAL LECTURE SERIES
8.0 FOSSIL FUELS, ATMOSPHERIC POLLUTION AND ACID RAIN Currently, there is extreme dependency on fossil fuels for our energy needs since fossil fuels provide about 90% of our en-ergy requirements. Fossil fuels are obtained from incomplete biological decomposition of dead sea plants and animals which are converted by complex chemical reactions under high pressure and temperature over countries into fossil fuels (Botkin and Keller 1995a). The main fossil fuels are crude oil, natural gas and coal. 8.1 Crude oil (Petroleum) The most important, the most convenient and the most popu-lar of the fossil fuels is crude petroleum. To be useful, it is separated by fractional distillation in a refinery into its various components. These include petrol, kerosene, diesel oil, lubri-cating oil, and the residue consisting of asphalt and bitumen. Apart from these components, sulphur and nitrogen are con-verted to sulphur-dioxide and oxides of nitrogen. The amount of these gases produced depends on the percentage of sul-phur and nitrogen in the crude oil. This varies from country to country and from well to well. The sulphur content of Nigerian crude oil and those of some selected countries are shown in tables 8a, 8b and 8c.
61
FUNAAB INAUGURAL LECTURE SERIES
62
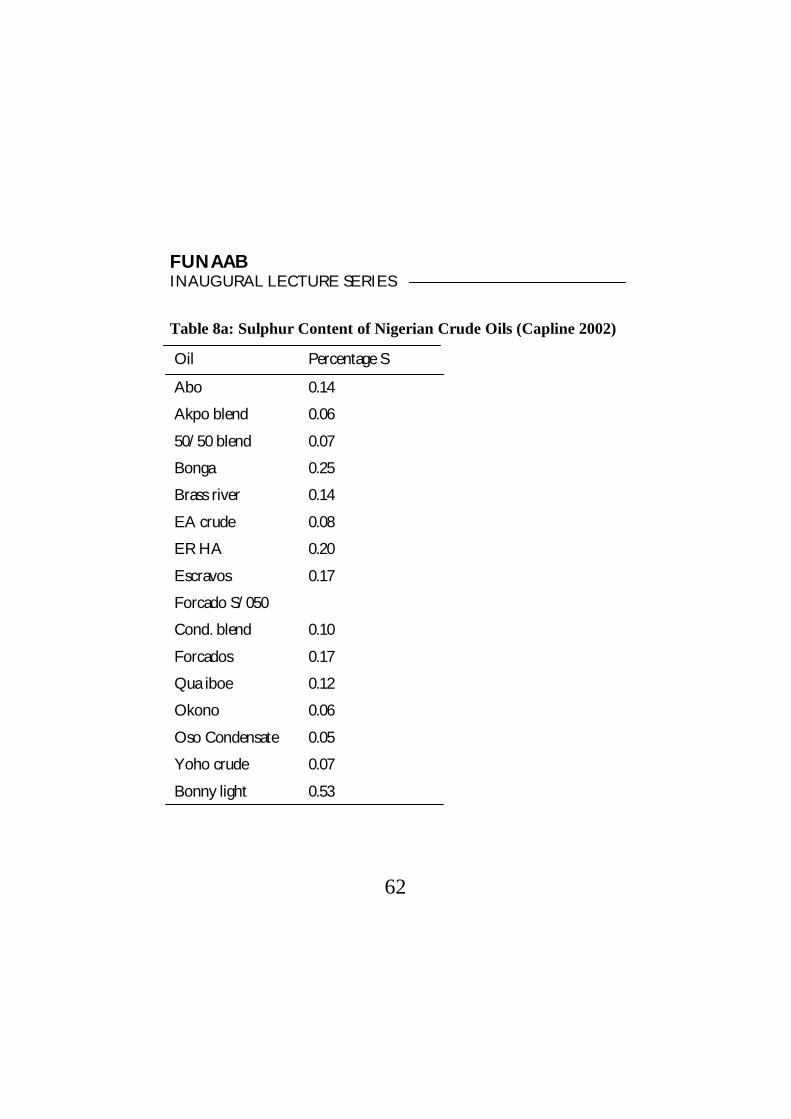
Table 8a: Sulphur Content of Nigerian Crude Oils (Capline 2002)
Oil Percentage S
Abo
Akpo blend
50/50 blend
Bonga
Brass river
EA crude
ER HA
Escravos
Forcado S/050
Cond. blend
Forcados
Qua iboe
Okono
Oso Condensate
Yoho crude
Bonny light
0.14
0.06
0.07
0.25
0.14
0.08
0.20
0.17
0.10
0.17
0.12
0.06
0.05
0.07
0.53
FUNAAB INAUGURAL LECTURE SERIES
63
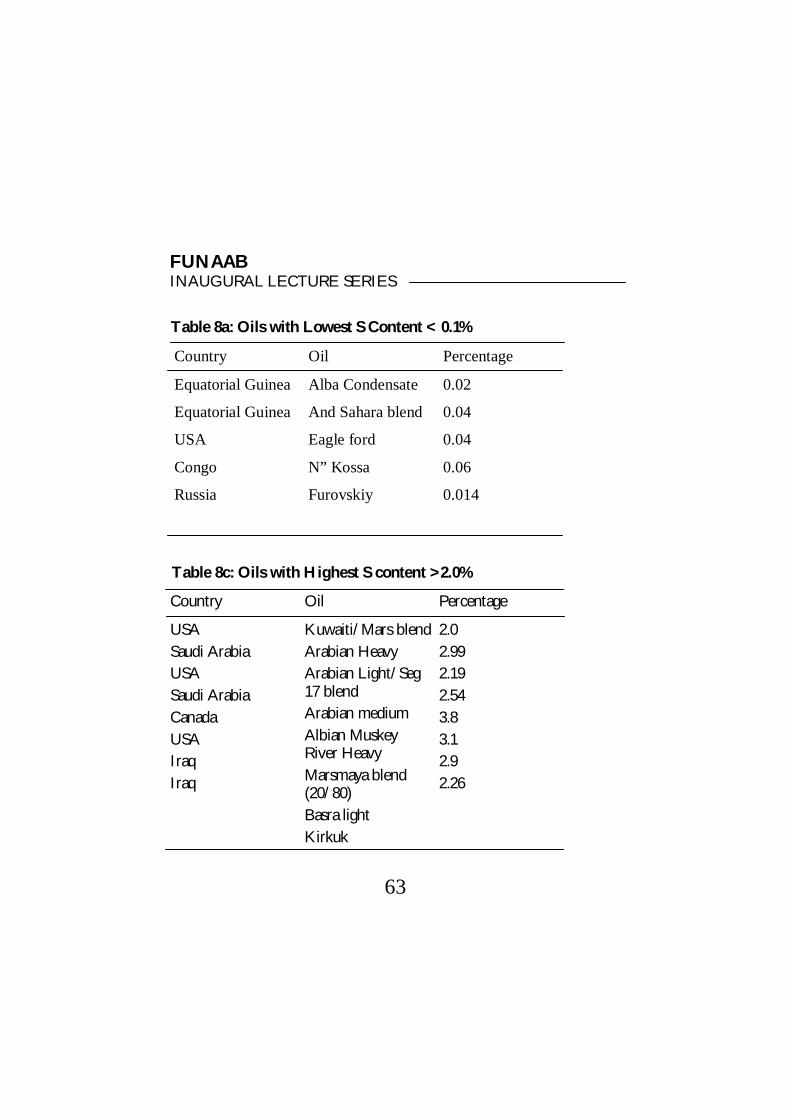
Table 8a: Oils with Lowest S Content < 0.1%
Country Oil
Equatorial Guinea
Equatorial Guinea
USA
Congo
Russia
Alba Condensate
And Sahara blend
Eagle ford
N” Kossa
Furovskiy
Percentage
0.02
0.04
0.04
0.06
0.014
Table 8c: Oils with Highest S content >2.0%
Country Oil
USA Saudi Arabia USA Saudi Arabia Canada USA Iraq Iraq
Kuwaiti/Mars blend Arabian Heavy Arabian Light/Seg 17 blend Arabian medium Albian Muskey River Heavy Marsmaya blend (20/80) Basra light Kirkuk
Percentage
2.0 2.99 2.19 2.54 3.8 3.1 2.9 2.26

FUNAAB INAUGURAL LECTURE SERIES
8.2 NATURAL GAS Natural gas forms a cap over crude oil reserves. This consists of C1 to C4 alkanes and alkenes which can be liquefied under low pressure for domestic and industrial uses, or flared in or-der to have access to the crude oil. In Nigeria both processes occur. The amount being flared should be progressively re-duced while greater efforts should be placed on liquefaction to have a cleaner environment and also to earn more revenue. Natural gas has little or no contribution to formation of acid rain. 8.3 COAL When partially decomposed vegetation is buried deeply in a sedimentation environment, it is slowly transformed into coal under high pressure and intense heat. Coal is by far the world’s cheapest and most abundant fossil fuel with a total recover-able resource of 1000billion metric tonnes (Botkin and Keller 1995b). At an annual global consumption of about 4billion tonnes, it should last for 250years. It is classified according to its carbon and sulphur contents. Table 9 shows the sulphur content and ranking according to energy content.
64

FUNAAB INAUGURAL LECTURE SERIES
65
Table 9: Classification of Coal According to Energy Content (US. Mineral Resources 1966)
Anthracite coal
1
30-34
Low 0-1
97.1
Coal Type Ranking Energy Content(million joule/kg)
Sulphur Content
Medium 1.1-3.0
2.9
(%)
High >3.0
-
Bituminous coal
2 23-34 29.8 26.8 43.4
Subbitumi-nous coal
3 16-23 99.6 0.4 -
Lignite coal 4 13’16 90.7 9.3 -
8.4 USAGE OF FOSSIL FUELS AND ACID RAIN FORMATION These fossil fuels are used for various purposes as follows i. in thermal power stations to produce steam used to turn
the turbine blades to generate electricity. ii. for heating purposes in industries iii. for domestic use for cooking and other purposes iv. in transportation; to power aircrafts, automobiles, ships
and trains.

FUNAAB INAUGURAL LECTURE SERIES
In all those cases, the fossil fuel is burnt to provide energy. During the process, they produce mostly carbon-dioxide, steam, some quantities of sulphur-dioxide and oxides of ni-trogen, the quantity produced depending on sulphur and ni-trogen contents of the fuel. Other sources of gaseous pollut-ants are the smelting of metal ores especially sulphide ores like zinc blende (ZnS), galena (PbS) and copper pyrites (CuFeS2) which produce sulphur-dioxide during smelting. On production, these gases dissolve in rain water during rain-fall and are converted into acids to produce acid rain. (acid rain can be defined as rain having a pH of less than 5.6, the pH of rain water equilibrated with carbon-dioxide). Gas phase reactions are as follows:- sulphur-dioxide is oxi-dised by hydroxyl radical to form sulphuric acid
SO2 + OH. HOSO2. HOSO2. + O2 HO2. + SO3 SO3(g) + H2O(l) H2SO4(aq) Nitrogen –dioxide reacts with OH. radical to form nitric acid NO2 + OH. HNO3 Source: Seinfield and Pandis 1998.
66

FUNAAB INAUGURAL LECTURE SERIES
Acid rain devastates vegetation (Dassler and Boritz 1988, Cowling 1989). It damages monuments made of marble. It increases acidity of lakes and rivers with consequential death of fishes (Acid rain 1983). It can also result in acid ground wa-ter and corrode buried metal pipes resulting in heavy contami-nation of drinking water ten to hundred times their normal value. In terms of pollution, natural gas is the cleanest followed by petroleum while coal is the most polluting,. Since Nigeria’s crude oil has low sulphur content, the contribution from this source is minimal. However acid rain still occurs periodically in Nigeria. Some colleagues captured acid rain having a pH of 4.8 around Warri area. This is probably due to smelting of sul-phur containing ores by Delta steel company. A lot of the sources of these pollutants are present in Nigeria. Petroleum refineries exist in Port-Harcourt, Warri, Kaduna while a number of private ones are in the pipeline. Gas flaring points are all over Niger Delta area. Smelting complexes are at Ajaokuta and Aladja. Fossil fuels are being burnt at PHCN thermal plants to generate electricity e.g Egbin (Lagos state) Afam (Rivers state) etc. More thermal stations are being planned. They all emit acid forming gases:- sulphur –dioxide, oxides of nitrogen and even carbon-dioxide. A large number of industries abound in our urban areas like Lagos, which has
67

FUNAAB INAUGURAL LECTURE SERIES
the highest concentration, Sango Otta, Ibadan, Kaduna, Kano, Enugu, Warri, Port-Harcourt etc. which burn fossil fuels to power their electricity generating plants during power outages which occurs more frequently than regular power supply. Another source of acid water is coal mines because coal is of-ten associated with copper pyrites (CuFeS2). When this comes in contact with oxygen and water, it forms sulphuric acid (H2SO4). This happens when surface water or shallow ground water runs through or moves in and out of mines or tailings. If the acid-rich water now runs off to a natural stream, pond or lake, significant pollution and ecological damage may result. Acidic water is toxic to plants and animals of an aquatic eco-system; it damages biological productivity, and fish and other aquatic life may die. Acid-rich water can also seep into and pollute groundwater (Botkin and Keller 1995c). 8.5 CONTROL FROM REFINERIES AND SMELT-ING WORKSHOPS Control and preventive measures of acid forming gaseous emissions is to channel the effluent gases from tall stacks and chimney pipes into alkaline solutions like lime water ( water in contact with lime) to neutralise them. Lime is cheap and read-ily available and the process entails minimal cost. In addition, gas flaring in the Niger Delta area should be stopped. In sup-port of this, more effort should be made to improve and ex-
68

FUNAAB INAUGURAL LECTURE SERIES
pand the LNG project. IF WE TAKE CARE OF ENVIRONMENT, ENVI-RONMENT WE TAKE CARE OF US. 9.0 GREENHOUSE GASES, GLOBAL WARMING AND CLIMATE CHANGE 9.1 Global Warming Global warming is the rise in the average temperature of the earth’s atmosphere and oceans since the late 19th century and its projected continuation. Since the early 20th century, the Earth’s mean temperature has increased by about 0.80C (1.40F) with about two-third of the increase occurring since 1980. Warming of the climate system is undisputable. The last 20years were the hottest in the last 400years(Greenscroll 2007) and this is primarily due to increase in the concentration of greenhouse gases produced by anthropogenic (human) activi-ties such as burning of fossil fuels, deforestation, urbanisation etc. The earth’s climate is fuelled by the sun. Most of the sun’s en-ergy (radiation) is absorbed by the earth, but some is reflected back into space as infra-red radiation. A natural layer of at-mospheric gases absorb a portion of this reflected infra-red radiation, eventually releasing some of it into space, but forc-
69
FUNAAB INAUGURAL LECTURE SERIES
ing much of it back to the earth. This warms the Earth’s sur-face creating the natural “greenhouse effect.” Without this natural greenhouse effect, the Earth’s temperature would be much colder and the planet would be covered with ice (EPA 1995). The major greenhouse gases and their percentage are: Water vapour (H2O) 36-70% Carbon-dioxide (CO2) 9-26% Methane (CH4) 4-9% Ozone (troposphere) 3-7% These have been responsible for maintaining a comfortable global temperature and preventing the sliding of the Earth to-wards the ice age. However, the increase in the concentration of the major gases especially carbon-dioxide and methane since the industrial Revolution (1950) has increased the proportion of these gases to dangerous levels which is now causing problems. 9.2 Anthropogenic (Human Activity) Contributions Recent observations show that the greenhouse effect is being increased by the anthropogenic release of certain gases into the atmosphere that cause the Earth’s temperature to rise. Car-bon-dioxide accounted for about 85% of the greenhouse
70
FUNAAB INAUGURAL LECTURE SERIES
gases released. Carbon-dioxide emission is largely due to the combustion of fossil fuels in electric power generating plants. Methane emissions, which result from agricultural activities, solid refuse landfills and other sources are the second largest contributors to greenhouse gases. Industrial applications such as foam production, refrigeration, dry cleaning, chemical manufacturing and semiconductor manufacturing produce other greenhouse emissions such as hydrofluorocarbons (HFC’S), NOx (Oxides of nitrogen) and various organic com-pounds (VOC) from automobile exhaust and industrial proc-esses contribute to the formation of ground level ozone or smog, also a greenhouse gas (EPA 1995). Added to this is the increasing rate of deforestation and ur-banisation which deprives the earth of providing the natural carbon-dioxide sink, a role which the vegetation plays. This is especially so in third world countries like Nigeria, where trees are cut down to provide firewood for cooking. This is a dou-ble-edged sword. The trees cut down are no longer available to remove carbon-dioxide from the atmosphere; in addition, this wood when burnt, produces more carbon-dioxide. So, it is not surprising that the concentration of carbon-dioxide has been increasing at an alarming rate. 9.3 Health and Environmental Effects Greenhouse gas emissions could cause 1.8 to 6.30F rise in
71

FUNAAB INAUGURAL LECTURE SERIES
temperature within the next century, if atmospheric levels are not reduced. Although this change may appear small, it could prove disastrous producing extreme weather events, such as droughts and floods; threaten coastal resources and wetlands by raising sea levels, due to the melting of ice at the poles and increase the risk of certain diseases by producing new breed-ing ground for pests and pathogens; e.g warmer weather pro-vides breeding grounds for insects like malaria-carrying mos-quitoes. Agricultural regions and wood lands are also susceptible to changes in climate that could result in increased insect popula-tions and plant disease. Some of these effects are already hap-pening even in Nigeria e.g droughts and floods, rise in sea level resulting in ocean surge e.g Victoria Island and beach where the Lagos State Government has been battling to keep the Atlantic Ocean at bay. There has also been upsurge in wild fires (Australia), heat waves and strong tropical storms even in Nigeria resulting in destruction of houses and even whole vil-lages and farmlands thereby rendering many people homeless and threatening the nation with famine. 9.4 Control The solution lies in the massive planting of trees. Apart from absorbing carbon-dioxide, they also prevent soil erosion by holding the soil firmly with their roots. Everybody should be
72
FUNAAB INAUGURAL LECTURE SERIES
involved in tree planting to save our planet from overheating. Governments should launch a vigorous campaign for tree planting and aggressively implement tree-planting pro-grammes. The proposal of Otunba Giwa Bisi Rodipe(2013) about Governments at all levels establishing large acreage of forest land in non-urban Local Government areas and also private ownership of forests will contribute substantially to this project. In addition individuals should plant trees in their premises es-pecially the elites and nouveax riche whose latest fashion is to concrete the floors or use interlocking units in their premises. I wish to appeal to everybody here present to at least plant fruit-bearing trees in their premises and neighbourhoods e.g Orange trees, guava, cashew, mango, almond popularly known as fruit, pawpaw etc. 9.5 Threat to Human Existence However, a more serious consequence of excessive carbon-dioxide emission into the atmosphere is the increasing con-centration of atmospheric carbon-dioxide. Between 1970 and 2004, the global greenhouses gases (GGHG’s) have increased by 70% due to human activities. Atmospheric carbon-dioxide is currently 385ppm and is increasing by about 2ppm per an-num from the burning of fossil fuels (oil, coal and natural gas) and burning of forests (deforestation and urbanisation). The
73

FUNAAB INAUGURAL LECTURE SERIES
critical point (point of no return) has been fixed at 450-500ppm when it will be very uncomfortable to breathe natural air. At an annual increase of 2ppm per annum, this may occur in 30years time (Greenscroll 2007). This is in addition to the warming effect. Latest data from Hawaii’s Manu Loa observa-tory puts the current carbon-dioxide concentration at 400ppm. Tree planting is only a short term solution. A long term solution is to look for alternatives to the burning of fos-sil fuels for our energy needs. The major consumption of fos-sil fuels and consequent emission of carbon-dioxide is the thermal stations for the generation of electricity. Generation of electricity and heating alone account for 24.9% of greenhouse gas emission. When combined with industrial emission, the total percentage is 40% (Wikemedia commons 2005). We should explore other sources of generating electric-ity e.g conversion of solar energy, water energy (hydroelectricity), wind energy, especially in the semi-arid re-gions, and most importantly, nuclear energy for the produc-tion of electricity. This will stem the tide of carbon-dioxide emission into the atmosphere and save mankind from immi-nent extinction. Sources that can be explored include: i. Solar energy ii. Water energy (hydroelectricity)
74
FUNAAB INAUGURAL LECTURE SERIES
iii. Wind energy especially in semi-arid regions iv. Most importantly nuclear energy. For the generation of electricity
IF WE TAKE CARE OF THE ENVIRONMENT, THE ENVIRONMENT WILL TAKE CARE OF US.
10.0 OZONE LAYER AND DEPLETION 10.1 Ozone layer Ozone is a triatomic form of oxygen in which three atoms of oxygen are bonded together in an uneasy union. It is produced by a photochemical reaction by oxygen molecules (O2) pro-ducing two oxygen radicals.
O2 + hυ O. + O. (Where the wavelength of the exciting radiation must be less than 242.4nm) followed by the reaction O + O2 + M O3 + M (increased energy) M is another species e.g N2 or O2 which absorbs the excess energy given off by the reaction and enables the ozone mole-cule to stay together. The ozone molecule is also unstable, al-though relatively long- lived in the stratosphere, and when ul-tra-violet light hits it, it splits into a molecule of oxygen and an atom of oxygen and this is a continuing process called the hυ O3 O2 + O.
75

FUNAAB INAUGURAL LECTURE SERIES
Ozone-oxygen cycle, thus creating an ozone layer in the at-mosphere. The region of maximum ozone concentration is within the range of 25-30km high (in the stratosphere) where it may be up to 10ppm (Manahan 1994). In the lower atmosphere which we breathe, ozone is really a pollutant. However, ozone in the stratosphere provides an es-sential shield because it absorbs most of the ultra-violet (UV) radiation that is potentially damaging to life on the earth. The solar UV radiation is divided into three categories, based on wavelength; these are UV-A having a wavelength of 400-315nm UV-B having a wavelength of 315-280nm and UV-C having a wavelength of 280-100nm, the shortest wavelength is the most energetic and is the most harmful to all living things. It is however entirely screened out by a combination of dioxy-gen (<200nm) and ozone (>200nm) at an altitude of about 35km. Most of the concern about the ozone layer problems centres on UV-B, which can be harmful to the skin and is the main cause of sunburn, while excessive exposure can cause genetic damage, resulting in problems like skin cancer. The ozone layer which absorbs from about 200nm to 311nm, with a maximum absorption at about 250nm is very effective at screening out UV-B. Ozone is transparent to most UV-A, so most UV-A with
76
FUNAAB INAUGURAL LECTURE SERIES
longer wavelength reaches the Earth’s surface but is signifi-cantly less harmful to DNA (Wikipedia 2013). 10.2 Ozone Depletion Ozone depletion describes two distinct but related phenom-ena. a) a steady decline in the total volume of ozone in the Earth’s
stratosphere; i.e the ozone layer. b) a much larger spring time decrease in stratospheric ozone
over the Earth’s polar regions. This second phenomenon is called the ozone hole.
The ozone layer can be depleted by free radical catalysts, in-cluding nitric oxide (NO) nitrous oxide (N2O), hydroxyl (OH), atomic chloride (Cl), atomic bromine (Br),.While there are natural sources for all of these species, the concentration of chlorine and bromine have increased markedly in recent years due to the release of large quantities of man-made organoha-logen compounds especially chlorofluorocarbons (CFC’s) and bromoflorocarbons. These are used in air-conditioning and cooling systems (refrigerators, deep-freezer etc.), aerosol spray propellants and in the cleaning process of delicate electronic equipment. These highly stable compounds with half-lives of over 100years diffuse to the stratosphere, where Cl and Br radicals are produced by the action of ultra-violet radiation. Each radical then initiates a chain reaction capable of breaking
77
FUNAAB INAUGURAL LECTURE SERIES
down 100,000 ozone molecules with consequent inability to absorb ultra-violet rays. Hence unabsorbed and dangerous UV-B radiation now gets to the Earth’s surface. In 2009, nitrous oxide (N2O) was the largest ozone-depleting substance emitted anthropogenically (Wikipedia 2013). The depletion of ozone layer can lead to a number of serious health risks for humans. It causes greater incidences of skin cancer and cataract of the eye, with children being particularly vulnerable. There are also serious impacts for biodiversity. In-creased UV-B rays reduce levels of plankton in the oceans and subsequently diminish fish stocks. It can also have adverse ef-fects on plant growth, thus reducing agricultural productivity. Severe depletion of the Antarctic ozone layer was first ob-served in 1980s.In 2006, the average area of the ozone hole was observe to be 10.6 million square miles (27.5 million square kilometres) in diameter. 10.3 Control Control requires the stoppage of usage and manufacture of CFC’s and other Ozone-depleting chemicals. This however requires international cooperation. Although talks started early enough, consensus was difficult to obtain. By 1995, the pro-duction of CFC’s was banned in developed countries and it was decided that efforts should be made to help developing countries to gradually reduce and eventually stop using them.
78

FUNAAB INAUGURAL LECTURE SERIES
By 2003, the rate of depletion of ozone layer was observed to be decreasing; that is the gradient has changed and recovery has started.
It has been estimated that ozone layer may take beyond 2075 to recover (Wikipedia 2013) if the ban is sustained and devel-oping countries are helped to provide alternatives. Up till to-day, CFC’s and HCFC’s are still being used in Nigeria for air-conditioners and refrigerators. IF WE TAKE CARE OF THE ENVIRONMENT THE ENVIRONMENT WILL TAKE CARE OF US. 10.4 SUMMARY OF CONTROL MEASURES FOR THE DIFFERENT POLLUTION PROBLEMS 1.Effluents from industries Collection of the effluents into concrete holding tanks fol-
lowed by treatment with water Hyacinth (eichornia crassipes) plants for one or two weeks before discharging the effluents into the city’s water-ways.
2. Acid Rain Channeling the acid producing gaseous emmissions into lime
water to neutralise them. 3. Global Warming Due mostly to the uncontrolled massive emission of carbon-dioxide resulting in high atmospheric concentration of carbon-dioxide.
79

FUNAAB INAUGURAL LECTURE SERIES
(a). Massive planting of trees. (b). Encouraging individuals to plant trees in their premises, even if it is only fruit-bearing trees. (c). Encouraging private planting and ownership of forests. (d). Looking for alternative sources of production of electric-ity and gradually phasing out of thermal stations which de-pend on burning of fossil fuels and emission of carbon-dioxide. Alternative sources include (i). Solar energy (ii). Water energy (hydroelectricity) (iii). Wind energy (iv). Nuclear energy This will in addition save mankind from the threat of immi-nent extinction due to high concentration of carbon-dioxide in the air we breathe. 4. Ozone Layer Preservation Banning of the manufacture and use of chlorofluorocarbon and other ozone-depleting chemicals. Mr Vice-Chancellor sir, If these suggestions are faithfully implemented not only in Ni-geria but also across the globe we will be moving towards a pollution-free environment and a safer world to bequeath to our children instead of borrowing their world. IF WE TAKE CARE OF THE ENVIRONMENT, THE
80
FUNAAB INAUGURAL LECTURE SERIES
ENVIRONMENT WILL TAKE CARE OF US. 11.0 INTEGRITY AND NIGERIAN VALUES Integrity by my definition is the ability to do what is right, es-pecially when there is nobody around to see you do what is wrong. Integrity as a virtue is a very rare commodity and is grossly lacking in 95 to 99% of people. Since Adam and Eve ate the fruit of the knowledge of good and evil, everybody, even a five year old child knows the difference between right and wrong. Most people however choose to do wrong because of (i) greed, (ii) selfishness (iii) the desire to acquire power and lord it over others. These result in fraudulent practices, nepo-tism, corruption, sycophancy, cultism coupled with injustice and wickedness. These are very rampart in every aspect of our national life; even in academics and also on this campus. A man in a position of little authority thinks he can only dem-onstrate his authority by being unjust, wicked and even ruth-less to others. Our politicians are the arrowheads of this prac-tice. The problem is that our leaders are politicians and not statesmen. The politician always thinks of the next election; all his thoughts and actions are dictated by how to win the on-coming election; what strategies to put in place, which oppo-nent to buy out or eliminate if he proves stubborn. How much to set aside to bribe electoral officers, what type of fet-ish rituals to perform etc.
81

FUNAAB INAUGURAL LECTURE SERIES
The statesman always thinks of the next generation. How to give them a better quality of life:- better and more functional education, better nutrition and food security, good health de-livery system, good and efficient transportation etc. Unfortu-nately, the number of statesmen is infinitesimal and they stand in great danger of incarceration and extinction. The politicians engage in these wicked practices with impunity. You hear such statements like “if you cannot beat us, join us” I wish to appeal to us, especially the younger generation not to join them because if you do, there is no more hope for this country. For example the Nigerian Labour Congress informs us that members of the National Assembly take a monthly package of over N50million naira each. In addition, they receive sever-ance allowance of tens of millions every four years. They are now planning life pension for their presiding officers. All these in a country where more than 50million people are living be-low poverty line and many struggle to have one meal a day. Similar happenings occur in the States and Local Govern-ments. Some legislators were reported to be fighting the newly elected governor of their states for delaying to pay them 25million naira severance allowance each. It is completely un-justifiable.
82

FUNAAB INAUGURAL LECTURE SERIES
In my view, both the legislature and the executive should be paid within the civil service salary structure. This will allow more funds to be used for essential things to improve the liv-ing conditions of the people. It will also allow only patriotic people who have the desire to serve, to aspire to elective and leadership positions. We must all join in the fight against this malaise called corrup-tion which is rooted in lack of integrity. For those who patri-otically choose to join in this crusade, let me warn that it will not be a bed of roses.You will suffer victimisation, oppression and harasement. Some will be incarcerated, some will be im-prisoned, others may be assassinated but the struggle must continue. No retreat, no surrender. It reminds me of the wordings of the third verse of the school song of my alma mater, C.M.S. Grammar School Bariga, Lagos. Foes in plenty we shall meet, Heart courageous scorn defeat So, we press with eager feet Up and On Ever onward to the fight, Ever upward to the light Ever true to God and right Up and On
83
FUNAAB INAUGURAL LECTURE SERIES
Nothing good comes easy and Jesus Christ even warned us that “in the world, ye shall meet with tribulation, but be of good cheer; I have overcome the world (John 16:33). Hence, there is light at the end of the tunnel if we sustain the fight. We must all join hands to make Nigeria a better place than we met it not forgetting to take the word of God with us. In the words of Mr. Rafiu Balogun, Chairman NBA Ilorin branch, “It is high time Nigeria redefined her value system and commenced dignifying merit instead of mediocrity. We must celebrate probity, integrity and erudition, because truth is self-evident and cannot be buried” (Nigeria Tribune, 18th Septem-ber, 2013 p.8). Herein lies our road to nationhood and development.
84
FUNAAB INAUGURAL LECTURE SERIES
12.0 MY BACKGROUND I was born in Lagos to the family of Deacon and Mrs Daniel Tanimowo Odukoya. I am the first of ten children all from the same mother. My mother had multiple births, twins followed by triplets. I am glad to say that but for one of the triplets who died at six months old, we are all alive and well today. As many as we are, my father recognised the value and impor-tance of education and vigorously struggled on his civil ser-vant’s salary to give us education for which I am very grateful. Although I was born in Lagos, I started schooling at Baptist Day School in Kaduna in 1952. My father had been trans-ferred from the Nigerian Secretariat in Lagos to regional out- station in Kaduna in 1951. The regions obtained self-governing in 1955 and he was caught up in the Northern region. Due to constant transfer within the region, he sent my immediate younger sister and I back to Lagos to continue our education. Hence I completed my primary education at St. Jude’s School Ebute Metta and was admitted into C.M.S Grammar School, Bariga Lagos in 1960. It is the Premier Secondary Institution in Nigeria, founded in 1859 by the Anglican Mission and the first princi-pal was Sir Babington Macaulay of blessed memory. I finished School Certificate in 1964 coming out in Division One and
85

FUNAAB INAUGURAL LECTURE SERIES
started Higher School Certificate Course (H.S.C) at Igbobi College, Yaba in January 1965. While in Lower Six, I sat for the concessional Entrance Examination into Prelim Science Program of the University of Ibadan and I was admitted in September 1965. It was at this point that God, in his infinite mercies smiled on us and made things easier for the family. I now want to ad-dress Funaabites and the youth generally ‘’Whatever you want to do, put in your best for you never know what can come out of it.’’ I performed well in the exams and was admitted. Fait accompli! or so I thought. I resumed at the University in Sep-tember 1965 and was posted to Nnamdi Azikiwei Hall. In No-vember, I picked up a letter from my pidgeon hole informing me that I had been awarded a’’state scholarship’’ I was con-fused because I had not applied for any scholarship. On en-quiry from the stale students, I learnt that I must have per-formed very well in the entrance examination to have won the scholarship. Later, I learnt from a student’s magazine that the scholarship was for the ten best candidates in the entrance ex-ams. It was a federal government scholarship but internal to the University of Ibadan. I graduated in 1969 and immediately came to the aid of my father and ensured that every one of my sibling had tertiary education. I started working as a classroom teacher at Adeola Odutola
86
FUNAAB INAUGURAL LECTURE SERIES
College Ijebu-ode in September 1969 where I taught Chemis-try at both School Certificate and Higher School Certificate levels. I also taught Physics and Mathematics at lower levels. In 1971, I got an appointment as a Pupil Research Officer at the Nigerian Institute for Trypanosomiasis Research, Vom, Pla-teau State where I was posted to Biochemistry section. In 1973, I went back to the University of Ibadan for the post graduate Diploma in Analytical Chemistry which was later changed to M.Sc. AnalyticChemistry since senate regulation did not allow for that at the beginning. Again, without any foreknowledge, I won the prize for the best student in the course. I took up an appointment as Lecturer II at the Poly-technic Ibadan in 1974 and later registered for my Ph.D de-gree on part-time basis at University of Ibadan. I obtained my Ph.D in 1984. In 1992, I joined the staff of UNAAB as a Sen-ior Lecturer; I was promoted to a Reader in 2001 and finally became a Professor in 2007. I come from a very strong Christian family and closely knit at that. My father was a Deacon of the Baptist church while my mother was president of the Women Missionary Union (W.M.U). Two of my brothers are currently pastoring the churches God put in their care, Pastor John Olufemi Odu-koya, Hope Ministry, Maryland, USA and Pastor Taiwo Odu-koya, Senior pastor, Fountain of Life Church, Ilupeju, Lagos while I attend Orita-Mefa Baptist church, Total Garden, Ibadan.
87
FUNAAB INAUGURAL LECTURE SERIES
13.0 ACKNOWLEDGEMENT My gratitude goes first to the ALMIGHYTY GOD, the crea-tor of Heaven and Earth for creating me into this world in the first place, and for His protection, loving kindness, tender mercies, abiding presence and guidance over me which has kept me safe and alive to stand before you today, inspite of the activities of the devil and his human agents. To Him be ALL the GLORY. Next, I thank my parents, Deacon and Mrs. Daniel Tanimowo Odukoya through whose medium I came into this world for their parental love and care and for infusing in me and my sib-lings the rudiments of Christianity and the importance of education. They are both of blessed memory. I also want to thank my teachers from primary school to post graduate levels for teaching me well and imbibing in me the spirit of hard-work. Next, I want to acknowledge the current Vice chancel-lor, Professor Olusola Bamidele Oyewole for his objectivity and uprightness in piloting the affairs of FUNAAB since he assumed its leadership. I have personally benefitted in more ways than one when he stood up against and prevented the injustice planned against me. This has made it possible for this lecture to be holding to-day. Thank you very much sir. May God continue to guide you in your onerous duty.
88

FUNAAB INAUGURAL LECTURE SERIES
I wish to recognise and acknowledge my brothers and sisters for their show of love and prayerful support and for a close knit family. I also thank all other family members. I thank my in-law, the Aina family led by Rev. Obafemi Aina. I also wish to recognise the presence of my Ph.D supervisor and mentor. Prof. Sunday Olukayode Ajayi and to thank him for training me well and for playing a significant role in my life. Thank you sir. I wish to recognise the presence of the first Dean of the College of Natural Science Prof. Ishola Adamson for laying a good foundation to build upon. Thank you sir for coming. The old Grammarians (old boys of C.M.S. Grammar School) here present I thank you. Our vision that’’ Africa will surely rise’’ is gradually crystallizing in our lifetime with our school motto ‘’Nisi; Dominus Frustra’’ I want to urge us to keep the flame burning brightly ever. I wish to thank my colleagues who contributed to the prepara-tion of this lecture they are: Dr (Mrs) Temilade Akinhanmi and Dr. Johnson Adediji, Thank you very much. God will con-tinue to bless you. I also want to thank those of my colleagues in Chemistry De-partment and the College of Natural Sciences who related to
89

FUNAAB INAUGURAL LECTURE SERIES
me in a stress-free manner, which allowed me to keep a cool head throughout. In this connection, I want to specially men-tion my research partner and colleague, Prof Oladipupo Ade-muyiwa of Biochemistry Department for his academic and Christian spiritual support. I wish here to acknowledge the principled stand and support of the current ASUU executive under the able leadership of Dr Biodun Badmus during the crisis that was stirred up in 2012. I wish to appreciate the member of staff of West African Ex-amination Council (W.A.E.C.) Ibadan for their show of love by being present here and to specially recognise the Zonal Co-ordinator of Ibadan zone Mr. K.B. Ola. Thank you very sir for coming. May God continue to bless you. My colleagues in the Department of Chemical Science Olabisi Onabanjo University, Ago-Iwoye led by the Head Depart-ment, Dr. Laide Lawal. Thank you for coming. May God bless you. I wish to specially recognise a long-standing layer and ex-tremely trust worthy friend Mr. J.A. Agosu (Little John) who has touched my life in many ways. God bless you.
90

FUNAAB INAUGURAL LECTURE SERIES
Now I want to acknowledge the presence of some of my for-mer students who contacted me at one point or the other (students always recognise their teacher) and have made it to the top of their careers and professions. These are students I taught at A. Levels and are still in contact with me. They were small boys then but big men today. They include Prof. Ayobami Aina of College of Animal Science FUNAAB, Prof. Olukayode Bamgbose College of Environmental Resources and Management FUNAAB. Those outside FUNAAB include Prof. Olusegun Ogunlade, Head of Department of Orthopae-dic Surgery UCH Ibadan, Prof. Temitope Alonge, Chief Medical Director UCH Ibadan, Pastor Taiwo Odukoya, Foun-tain of Life Church Ilupeju, Lagos. Thank you for coming. May God continue to bless you. I wish to acknowledge my Christian families starting with the members of my Sunday school class (Adult Men III) and members of Akobo North House fellowship both of Orita-mefa Baptist church and members of Orita Mefa Baptist Church . Thank you for your Christian love, goodwill and spiritual support. May the love and blessings of God continue to envelope you. My spiritual mentor and father in the Lord, Papa Evangelist Adeyinka Togun who inspired me and helped to build up my faith. I cannot fail to mention the immediate past Senior Pas-
91
FUNAAB INAUGURAL LECTURE SERIES
tor of Orita-mefa Baptist Church Rev. Samuel Morakinyo Leigh for spiritual advice and counselling. Evangelist Rev. Ademoolami Adeniyi Afolayan of Pilgrims Miracle Church, Oke-Ado, Ibadan, for spiritual training and support. May God continue to bestow on you all multiple portions of anointing and always renew your strength. I thank all members of Foun-tain of Life Church, llupeju Lagos here present. I also wish to recognise members of the Moyede Zone 3 Resi-dents Association for your good neighbourliness, love and care and in particular, the chairman Rev Kayode Ojediran for his leadership qualities. Finally back home, I thank you my children, for being good children to your mother and I throughout your growing up years, giving us minimum stress. I also thank you for your show of love and affection to us all the time. God will bestow mercy and favour on you and your respective families in your different places of abode. You will forever remain our pre-cious jewels and we are justifyable proud of you’’ And the Lord God said, It is not good that man should be alone, I will make him a help meet for him’’ (Gen2:18) that is, a designer’s model made by the master designer, God himself to be compatible with the man spiritually, emotionally and physically. Vice- chancellor sir, Let me introduce the ‘’help
92
FUNAAB INAUGURAL LECTURE SERIES
meet for me’’; the apple of my eye, the honey in my tea (not sugar), my jewel of inestimable value, Mrs Olujoke Odukoya. Thank you for your love, care and constant support. May God continue to bless you. Finally, I want to acknowledge the FUNABITES. Great FU-NAABITES! Greatest FUNAABITES!! Thank you for being here. It is a fact that both the Academic and Non-academic staff are all here, because you are here. No students, No uni-versity. May you continue to do us proud and portray what you have learnt in character and training while you are here. Distinguish Ladies and gentlemen, thank you for listening. God bless you all. REFERENCES Acid rain 1983. Acid rain: a review of the phenomenon in the EEC and Europe. Graham and Trotman, London pp 159 Ajayi S.O., Odukoya O.O, and Onianwa P.C. 2001. Lead Content in Human Scalp Hairian Southwestern Nigeria. Nig. J. Sc. 35 (2) 183-187 American Conf. of Govt. Ind. Hyg 1971. in “Documentation of threshold limit values for substances in the workroom ‘air’ 3rd ed. Cincinnati, Ohio pp 59-60.
93
FUNAAB INAUGURAL LECTURE SERIES
Botkin D.B. and Keler E.A. 1995a. Environmental science ( Earth as a living planet) pp 312 (fossil fuel) Botkin D.B. and Keller E.A. 1995b. Environmental science (Earth as a living planet) pp 319. Botkin D.B. and Keller E.A. 1995c. Environmental science (Earth as a living planet) pp320 Jhon wiley and sons New york Botkin D.B. and Keller E.A. (1995d) Environmental science (Earth as a Living planet ) pp 409 Jhon Wiley and sons New york (acid mine drain) Corinne H.R., and Lancer M.R 1977. Normal and theura-peutic nutrition 5th edition Macmillian Publishers, New York pp 112 Cowling E.B. 1982. Acid precipitation in historical perspec-tive. Environ.sc and tech. 16 (2) 110-122 D’Itri Frank M 1976a. The Environmental Mercury problem. CRC Press, Clevel’nd, Ohio pp 17 D’ltri Frank M. 1976b. The Environmental Mercury Problem CRC Press, Cleveland, Ohio pp 30 D’ltri Frank M. 1976c. The Environment Mercury Problem
94
FUNAAB INAUGURAL LECTURE SERIES
CRC Press, Cleveland, Ohio pp 31 Daesler H.G. and Bortitz s. 1988. Air pollution and its in-fluence on vegetation W. Junk publishers New York. Davis W.E. 1970. in ‘’National Inventory of sources and Emissions – Cadmium section 1’’ pp 1-44 Dept. of Health Education and Welfare, Washington D.C., USA Dooley H.E. and Griffis 1980. in Metals in the environment, H.A. Waldron ed. Acad Press London and New York. EPA 1976. National interim Primary Drinking Water Regula-tions, U.S. Govt. Printing Press Washington D.C. EPA 1995. - Global warming and climate change. Airtrends 1995 summary. Fakayode S.O., Olu-Owolabi B.I. 2003. Heavy metal con-tamination of roadside top soil in Oshogbo, Nigeria. Its rela-tionship to traffic density and proximity to highways Enviro. Geol. 44 150-157. FEPA 1991. Guidelines and standards for Environmental pol-lution control In Nigeria pp 67. Fleischer M, sarofim A.F. Fasset D.W, Hammond P,
95

FUNAAB INAUGURAL LECTURE SERIES
Shacklette H.T., Nisbet I.G.T.1974. Environment health perspertive 7 253 325 Gibson F.H and Selvig W.A. 1954. Rare and uncommon ele-ments in coal. Technical paper 669, Bureau of Mines, U.S. De-partment of Interior. Goyer R.A. and Rhyne BC. 1973. intern Rev. Expl. Pathol 12 1-77 Greenscroll- Greening the web 2007. Grunden N, stantic M and Buben M 1974. Environ Res 8 203-206 Grunden N. Stantic M and Buben M 1974. Enviro Res 8 203-206 HaradaY.L 1968. in ‘’Minamata Disease’’ N Katsua ed. Ku-mamoto University Japan. Hawaii’s Manu Loa Observatory 2013. Hayes A.I. and Rothstein A.J. 1977. Heavy metal pollution from spillage at ore smelters and mills EPA-60012-77-171 Washington D.C. pp 109
96

FUNAAB INAUGURAL LECTURE SERIES
Hayes A.I. and Rothstein A.j. 1980 Mercury in ‘’Metals in the Environment’’ H.A Waldron ed, Head Press, New york and London. Hunter D. 1969. in ‘’The Disease of occupation’’4th ed. Little Brown, Boston USA. pp 163 and 421 Jenko D.R, Pageulcop G.K and Diebold F.E. 1983. chemi-cal changes in concentrated, acidic, metal bearing waste waters when treated with lime Environ Sc. Technology 17, 217-223 Jonasson I. R and Boyle R.W. 1971. Geochemistry of mer-cury in Proc. Soc, Can, Symp, ‘Mercury in man’s environment” O Hawa 5. Katsuna M ed. 1968. ‘’Minomata Diseases’’. Kumamoto Uni-versity, Japan. Kazantzis G. 1980a. ‘’Mercury in Metals in the Environment’’ H.A. Waldron ed Academic Press London & New york. pp 234. Kazantzis G. 1980b. Mercury in ..Metal in the environment ‘’H.A. Waldron ed. Acad. Press, London & New york Lam S.H. and Rosen J.F. 1974. Pediatric 53 137-141
97
FUNAAB INAUGURAL LECTURE SERIES
Lampe R.M., Henderson A.L, and Hausen G.H 1977. Green Hair. J. Arm. Med. Assoc 237 2092. Lundholm B. 1907. Background Information. A survey of the situation in Sweden in ‘’The Mercury Problem’’ Oikos suppl.9 45 Manhan S.E. 1994. Environmental chemistry 6th edition, Manahan S.E. ed. Lewis Publishers London pp 1-3, 32, 267-268. Miesch A.L. and Haffman C. 1980. in ‘’ Metals in the Envi-ronment’’. H.A. Waldron ed. Head press London and New York Milne J., Christopher A and da Silver 1980. Mercury in ‘’Metals in the Environment’’ H.A. Waldron ed. Head. press, New York and London. Moeschlin S. 1973 Metals, Copper, Copper sulphate in “Poisoning, Diagnosis and Treatment” 4th ed. Carume and Stratton, New York 124-125. Moore R. 1978. Bleeding gastric erosion after oral Zinc sul-phate BriMed J. 1 754 www.cpalinepipelin.com/ReportsIaspx Murozumi M., Chow T.J. and Patterson C.C.(1985) in ‘’Metals in the Environment’’ H.A. Waldron ed Acad Press, London
98

FUNAAB INAUGURAL LECTURE SERIES
and New York. Mylroie A.A., Moore L and Erogbogbou. 1977. Lead in ‘’Metals in the Environment’’. H.A. Waldron ed Acad Press, New York and London.pp 169 UK DEpt of Environment (1974) Noaa Research – www.research.noaa.gov/climate/image Nriagu J.O. 1980 Copper in the Environment vol II J.O. Nriagu ed. Jhon Wiley and Sons Inc. New York pp 100 Nriagu J.Oleru NT, Cudjoe O and Chine A. 1977. Lead poisoning of children in Africa III, Kaduna, Nigeria, Sci Total Environ 197 13-19 Odukoya 1999. Accumulation of Heavy metals from Pollu-tion water by Water Hyaciuth (eichornia crassipes) Trop. En-viro. Res. I (1) 55-57. Odukoya O.O 2004. Heavy Metal in Top Soil of Scrap-Metal Dumpsites in Mechanic Villages in Abeokuta, Western Nigeria Trop. J. of Environ. Res. 5(1and 2) 360-370. Odukoya O.O. 1990 Modification of Bethge’s Open System Apparatus for the Determination of Mercury in Biological
99

FUNAAB INAUGURAL LECTURE SERIES
Materials pintern. Journal of Environ. Analytical chemistry 29 323-327 Odukoya O.O. 1999. Accumulation of Heavy Metals from polluted water by water- Liyacinth (Eichornio Grassipes) Trop.J.of Environ.Res 1 (1) 53-57. Odukoya O.O. , Arowolo T.A. and Bamgbose O. 2000 Lead, Zinc and Copper levels in Tree barks as an indicator of atmospheric pollution Environ. Inter.26 11-16. Odukoya O.O. and Ajayi S.O. 1988. Heavy metals in Nige-rian Fishes:III Mercury.Nig.J.Nutri Sc. 9(1) 47-57 Odukoya O.O. and Ajayi S.O. 1987a. Heavy metals in Nige-rian Fishes I: Lead and Cadmium. Nig.J.Nutr.Sc. 8 (2) 105-113 Odukoya O.O. and Ajayi. S.O. 1987b. Heavy metals in Ni-gerian Fishes II: Copper and Zinc Nig. J. Nutri Sc. 8(1) 41-49 Odukoya O.O. and Okwarata 1998. Lead in street Dusts of Abeokuta. B.Sc. Research project Dept of chemical sciences, University of Agriculture Abeokuta. Odukoya O.O. and Oniyitan A.A. 2003. Cleaning of indus-trial effluents by water hyacinth (eichornia craaipes) B.Sc. re-
100

FUNAAB INAUGURAL LECTURE SERIES
search project, Department of Chemical Science. University of Agriculture, Abeokuta. Odukoya O.O. 2000. Pollution Trend in Ogun River, Abeo-kuta, Nigeria.Nig.J.ef Science 14(2) 183-186. Odukoya O.O., Bamgbose O and Arowolo T.A. 2001. Heavy Metals in Top Soils of Abeokuta Dump sites. Global Journal of Pure and Applied Sciences 7(3) 407-472. Odukoya O.O., Folarin M. and Akinnawo O.O, 2004. Up-take of iron, Copper, Zinc by some selected Nigerian food materials using different grinding methods Biosciences, Bio-technology, Research Ascs 3 (1) 63-66. Odukoya O.O., Onianwa P.C, and Sanusi O. I. 2010. Ef-fect of highways and local activities on the quality of under-ground water in Ogun State, Nigeria. (A case study of three districts in Ogun State) Enviro. Monit Assess 168 1-10 Onianwa P.C., Odukoya O.O, and Alabi H.A , 2002. Chemical Composition of Wet precipitation in Ibadan, Nige-ria. Bull. Chem. Soc. Ethip 16 (2) 141 – 147. Onunkwor B., Dosumu O., Odukoya O.O., Arowolo T., Ademuyiwa O. 2004. Biomarkers of Lead exposure in Petrol
101

FUNAAB INAUGURAL LECTURE SERIES
attendants and auto-mechanics in Abeokuta, Nigeria: effect of 2-week ascorbic acid supplementation. Environ Toxicol and Pharmacology 17 169-176. Onunkwor B., Dosunmu O., Odukoya O.O Arowolo T. Ademuyiwa O. 2004. Biomarkers of lead exposure in petrol station attendants and auto-machinics in Abeokuta, Nigeria, effect of 2-week ascorbic acid supplementation. Enviro. Tox-col and tharmacol 17 169-176. Ordonez J.V. 1966. Epidemiological study of a disease in the Guatamalan Highlands believed to be encephalopathy. Boletin Oficing Sanitaria Panamericana 60 (6) 510. Orisakwe O.E . 2009. Environmental pollution and blood lead levels in Nigeria: who is uexposed . International Journal of Occupational and Enviromental Health 15.3 315-317. Osibanjo O and Ajayi S.O. 1980 Trace Heavy metals in Tree barks as indicators of atmospheric pollution. Environ int 14 239-244 Periumutter N.M. and Lieber M. 1980. in ‘’Metals in the Environment’’, H.A. Waldron ed Acad Press, London and New York.
102

FUNAAB INAUGURAL LECTURE SERIES
Philip w, Koch H, Koser H. 1993. utilisation and control of water Liyacinth plants in Sudan. G.T.Z, publication No 122. Pimentel J.C. and Marques 1969 Vineyard sprayer’s lung: a new occupational diseases Thorax 24 678 Pimentel J.C. and Menzes A.P 1975. Lung Cancer and Cop-per inhalation in vineyard sprayers in Proceedings of the 5th congress of European society of pathology, Vienna pp 140. Rodipe B. 2013. “Environmental Awareness and conserva-tion of forests and Biodiversity” FMENV/FUNAAB LIKAGE seminar Seinfeld H, and Pandus S.N. 1998. Atmospheric chemistry and Physics- fron air pollution to climate change. Jhon Wiley and Sons Ter Haar G.L. and Bayard M.A. 1971. composition of Lead particles. Nature 232-553 airborne. Ter Hear G.L, and Bayard M.A. 1971. composition of air-borne lead particles Nature 232 553 Thomas V. and Kwong A. 2001. Ethanol as a ead replace-ment: phasing out leaded gasoline in Africa Energy Policy 29
103

FUNAAB INAUGURAL LECTURE SERIES
1133-1143 Tobershao 1. 1977. in Occupational disease- 9 guides to their recognition U.S. public Health service publications (NIOSH) pp77. U.S Mineral Resources 1966. pp 13342 Villar T.G. 1974. Vineyard sprayers Lung: clinical aspects. Am. Rev. Respir. Dis 110 545. Waldron H.A. 1980a. Lead in ‘’Metals in the Environment’’ H.A. Waldron ed Acad Press, New York and London pp 160 Waldron H.A. 1980b. Lead in ‘’Metals in the Environment’’ H.A. Waldron ed. Acad Press, New York and London pp 161. Wikimedia commons 2005. Wikipedia- the free encyclope-dia. Wikipedia 2013. http//en.wikipedia.org.wiki/Acid rain Wikipedia 2013. Ozone Layer depletion- Wikipedia, the free encyclopedia http//en.wikipedia.org/w/index.php?=ozone depletion &oldid=551979525.
104