Assessing Rio de Janeiro Vulnerability to Natural...
33
Date : 5 March 2012 Assessing Rio de Janeiro Vulnerability to Natural Disasters EO Information Products Ricardo Armas, Critical Software SA Haris Kontoes, ISARS-NOA
-
Upload
trinhkhanh -
Category
Documents
-
view
216 -
download
0
Transcript of Assessing Rio de Janeiro Vulnerability to Natural...

Date : 5 March 2012
Assessing Rio de Janeiro Vulnerability to Natural Disasters
EO Information Products
Ricardo Armas, Critical Software SA
Haris Kontoes, ISARS-NOA

Introduction: Products
- Product 1: Land Use
Land Use is a geographic map describing how humans use the land (for ex., institutional, commercial,
sports or residential) -> it refers to the economic use to which land is put.
- Product 2: DEM and Slopes maps
The Digital Elevation Model is a map representing the “first surface” elevation of an area, including
vegetation and man-made structures.
The Slopes map represent the rate of maximum change in z-value from each cell to the neighbourhood
cells (3*3).
- Product 3: Flood Simulation Scenarios
A flood simulation scenario is a replication as close as possible to a historic flood occurrence in order
to provide a visual analysis of the “real situation”.
Besides the “real situation”, three hypothetical scenarios were also simulated in order to analyse the
influence of Land Use/Cover in the flood propagation.

Introduction: Project Team
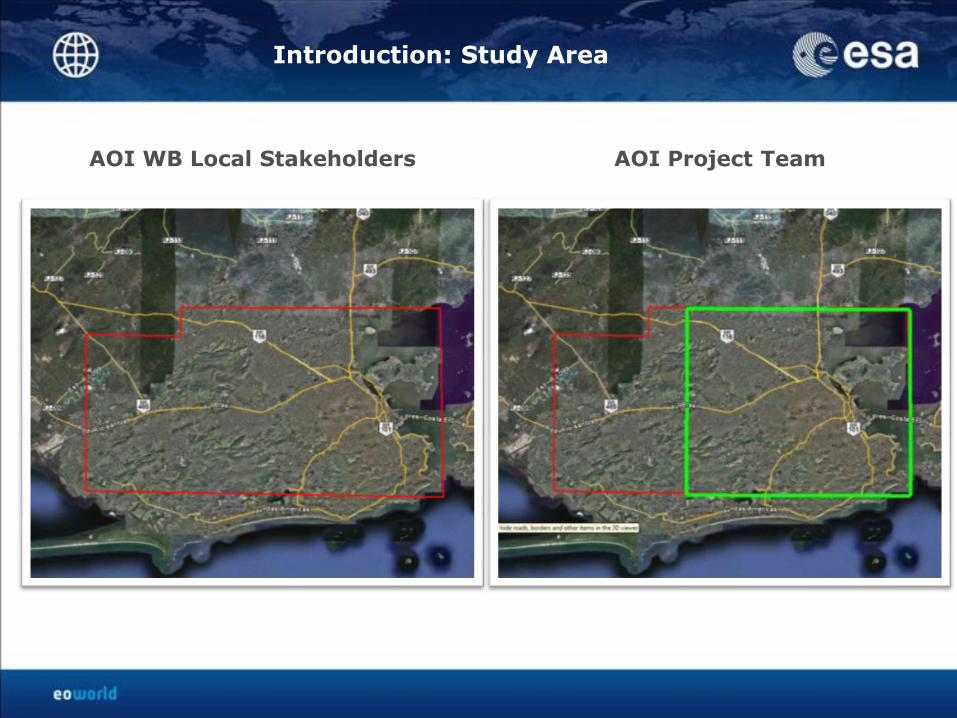
Introduction: Study Area
AOI Project TeamAOI WB Local Stakeholders


Product 1: Land UseTechnical Specifications
The Land Use product is a map dividing the AOI in polygons composed of ground elements with the same land
use. This product presents the use that was being given by humans on December 2010.20 classes (Original nomenclature)
+ A – The class “Industrial, commercial, public, military and private units” was
divided into 4 classes:
1 - Public unit
2 - Commercial unit
3 - Industrial unit
4 - Military unit
+
B – The class “Agricultural + Semi-natural + Wetland areas“ was divided
into 3 classes:
1 - Herbaceous Vegetation (grass & herbs)
2 - Wetlands
3 - Bare soil
= 25 classes

AOI area = ~1000 km2
SPOT-5 date 1 =2010/12/21
SPOT-5 date 2 = 2010/12/11
Product 1: Land UseAOI vs Spot 5 coverage

Product 1: Land UseExamples

Product 1: Land UseExamples

Product 1: Land UseValidation
Land Use and validation dataset
(5088 points collected by making use of ancillary data and ground surveys)
The product validation is an independent process made by third parties, without the
service producer knowing where the validation points were being located.

Product 1: Land UseValidation
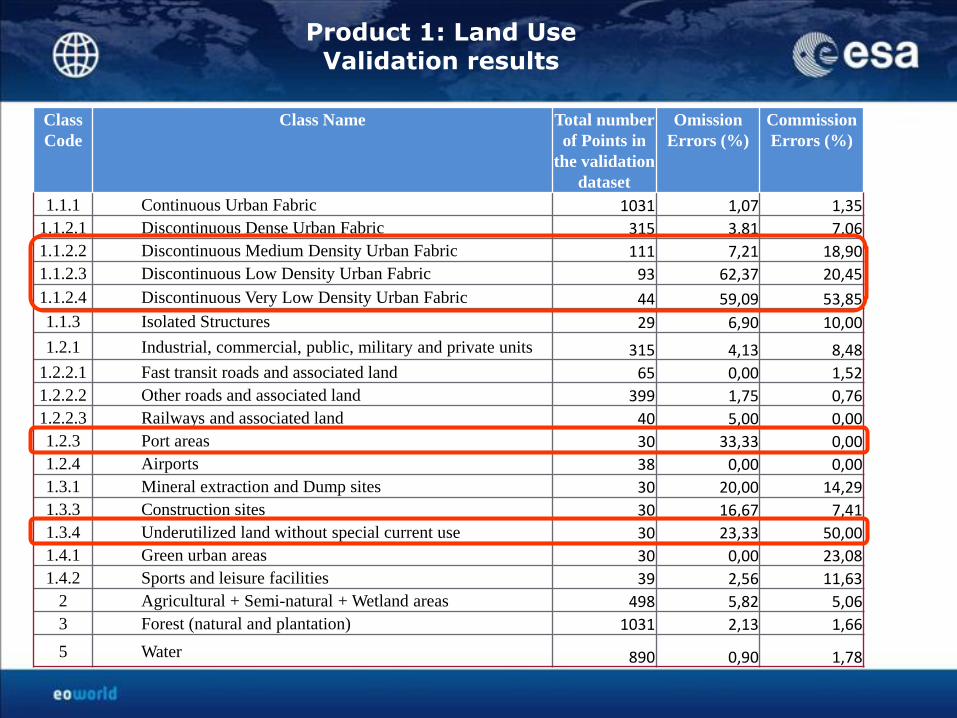
Product 1: Land UseValidation results
Class
Code
Class Name Total number
of Points in
the validation
dataset
Omission
Errors (%)
Commission
Errors (%)
1.1.1 Continuous Urban Fabric 1031 1,07 1,35
1.1.2.1 Discontinuous Dense Urban Fabric 315 3,81 7,06
1.1.2.2 Discontinuous Medium Density Urban Fabric 111 7,21 18,90
1.1.2.3 Discontinuous Low Density Urban Fabric 93 62,37 20,45
1.1.2.4 Discontinuous Very Low Density Urban Fabric 44 59,09 53,85
1.1.3 Isolated Structures 29 6,90 10,00
1.2.1 Industrial, commercial, public, military and private units 315 4,13 8,48
1.2.2.1 Fast transit roads and associated land 65 0,00 1,52
1.2.2.2 Other roads and associated land 399 1,75 0,76
1.2.2.3 Railways and associated land 40 5,00 0,00
1.2.3 Port areas 30 33,33 0,00
1.2.4 Airports 38 0,00 0,00
1.3.1 Mineral extraction and Dump sites 30 20,00 14,29
1.3.3 Construction sites 30 16,67 7,41
1.3.4 Underutilized land without special current use 30 23,33 50,00
1.4.1 Green urban areas 30 0,00 23,08
1.4.2 Sports and leisure facilities 39 2,56 11,63
2 Agricultural + Semi-natural + Wetland areas 498 5,82 5,06
3 Forest (natural and plantation) 1031 2,13 1,66
5 Water 890 0,90 1,78
Product 1: Land UseValidation results
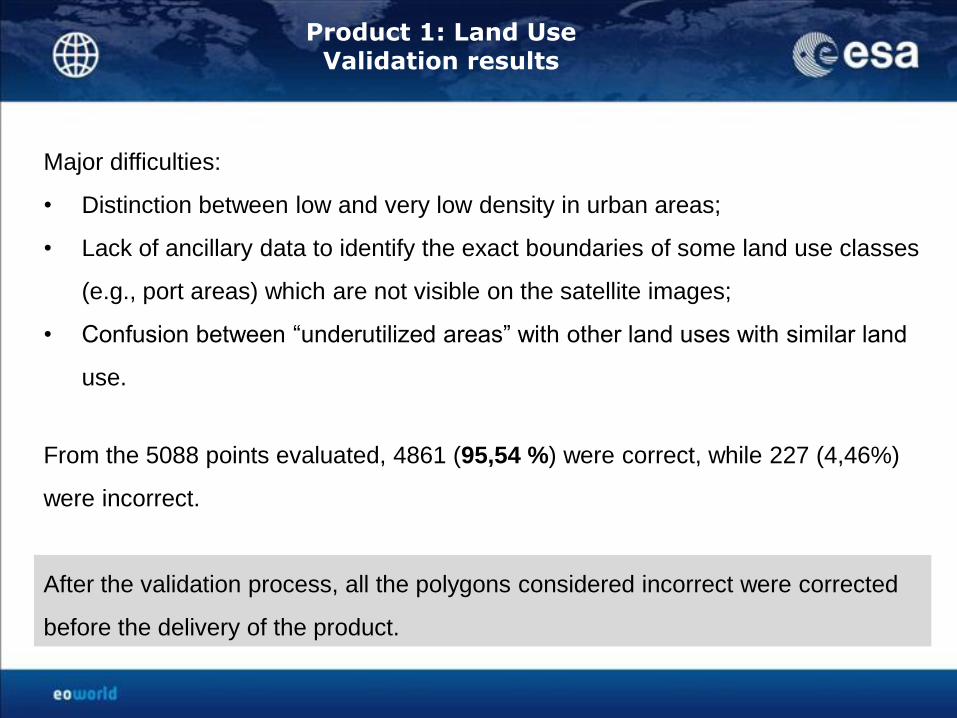
After the validation process, all the polygons considered incorrect were corrected
before the delivery of the product.
From the 5088 points evaluated, 4861 (95,54 %) were correct, while 227 (4,46%)
were incorrect.
Major difficulties:
• Distinction between low and very low density in urban areas;
• Lack of ancillary data to identify the exact boundaries of some land use classes
(e.g., port areas) which are not visible on the satellite images;
• Confusion between “underutilized areas” with other land uses with similar land
use.

Product 2.1: Digital Elevation ModelTechnical Specifications
The DEM is a map in the raster data model (image) representing the elevation in a
20 m*20 m cell mesh.
Each cell represents the average elevation of the elements visible to the satellite
(buildings, trees, soil, etc.) on June 2009.
This product is the SPOT DEM® product directly acquired from Astrium Geo-
Information Services and the only change was the transformation of the coordinate
system so as to be in accordance to the requirements of the local stakeholders.

Product 2.1: Digital Elevation ModelExamples

Product 2.2: SlopesTechnical Specifications
The slopes map is a map in the raster data model representing the maximum
change in elevation between each cell in the DEM and its eight neighbour’s cells.
The measuring unit of the slopes map is the percentage.
This product is based on the SPOT DEM® product directly acquired from Astrium
Geo-Information Services.

Product 2.2: Slopes MapExamples
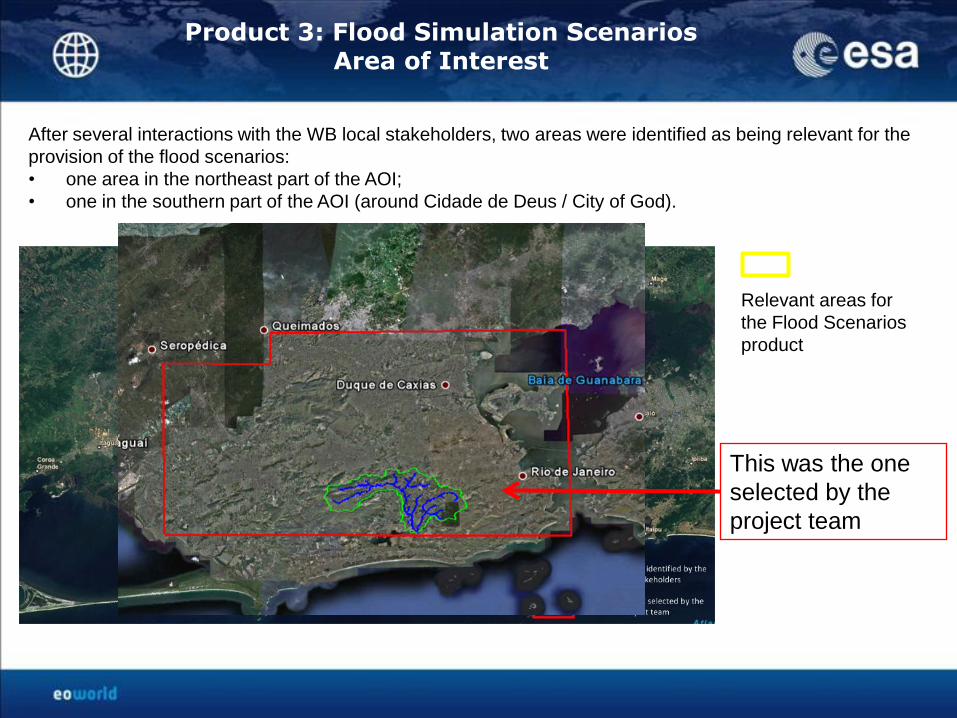
Product 3: Flood Simulation ScenariosArea of Interest
After several interactions with the WB local stakeholders, two areas were identified as being relevant for the
provision of the flood scenarios:
• one area in the northeast part of the AOI;
• one in the southern part of the AOI (around Cidade de Deus / City of God).
Relevant areas for
the Flood Scenarios
product
This was the one
selected by the
project team

Product 3: Flood Simulation ScenariosDate of Interest
The baseline date for the flood scenarios simulation was the 24th of
December 2001, where a total precipitation of 114 mm has fallen, almost
half of it in just 2 hours
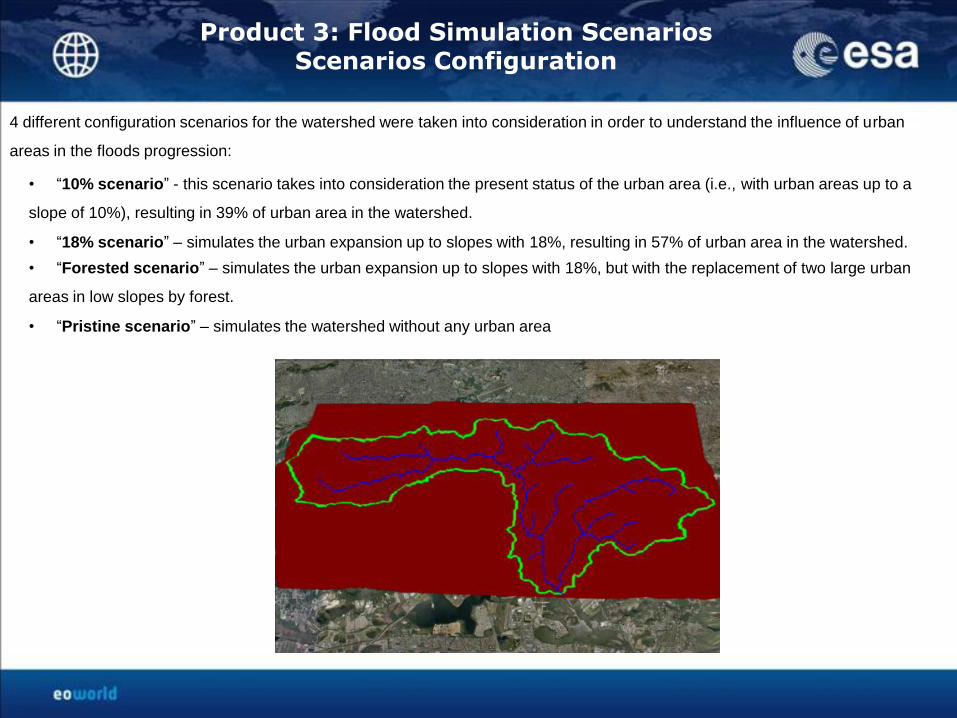
Product 3: Flood Simulation ScenariosScenarios Configuration
4 different configuration scenarios for the watershed were taken into consideration in order to understand the influence of urban
areas in the floods progression:
• “10% scenario” - this scenario takes into consideration the present status of the urban area (i.e., with urban areas up to a
slope of 10%), resulting in 39% of urban area in the watershed.
• “18% scenario” – simulates the urban expansion up to slopes with 18%, resulting in 57% of urban area in the watershed.
• “Forested scenario” – simulates the urban expansion up to slopes with 18%, but with the replacement of two large urban
areas in low slopes by forest.
• “Pristine scenario” – simulates the watershed without any urban area

Product 3: Flood Simulation ScenariosSelected Points
Due to the impossibility of analysing in detail the entire watershed, two points considered as the most relevant in the entire
watershed were selected for analyzing both the water flow and the flood extent:
• Point 1 (Rio Grande) was chosen because, after several tests, the simulation model has shown water overflowing in this
point due to the sudden decrease in slope (which results in decrease in velocity).
• Point 2 (Rio Anil) was chosen because it is an area known as having frequent and intense flooding events.

Product 3: Flood Simulation ScenariosWater Flow - Point 1 - Rio Grande
Water Flow in Point 1 (Rio Grande)
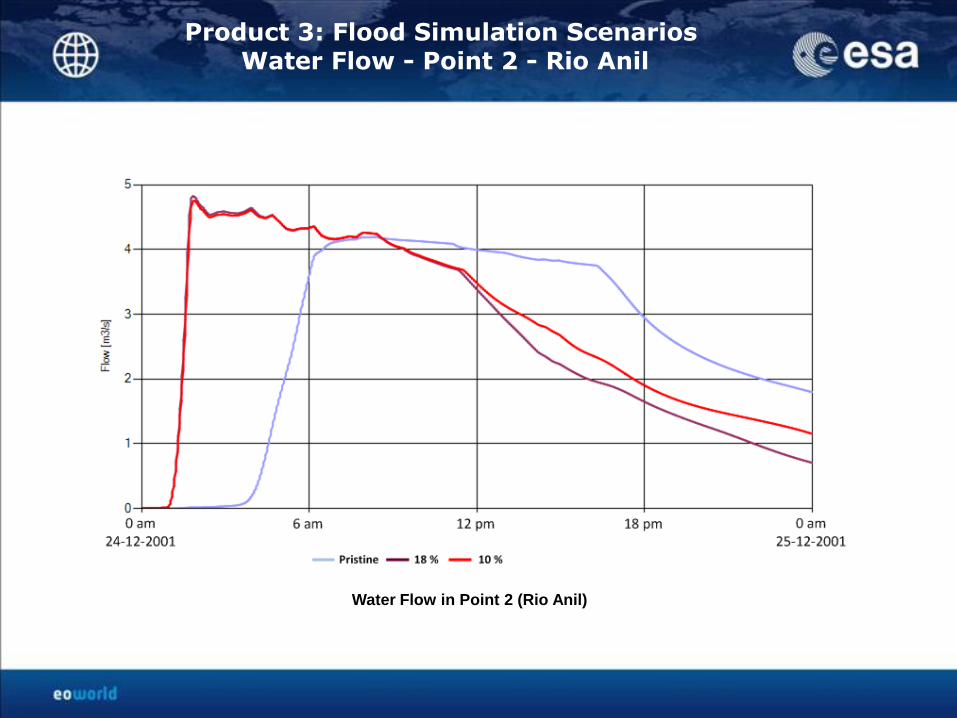
Product 3: Flood Simulation ScenariosWater Flow - Point 2 - Rio Anil
Water Flow in Point 2 (Rio Anil)
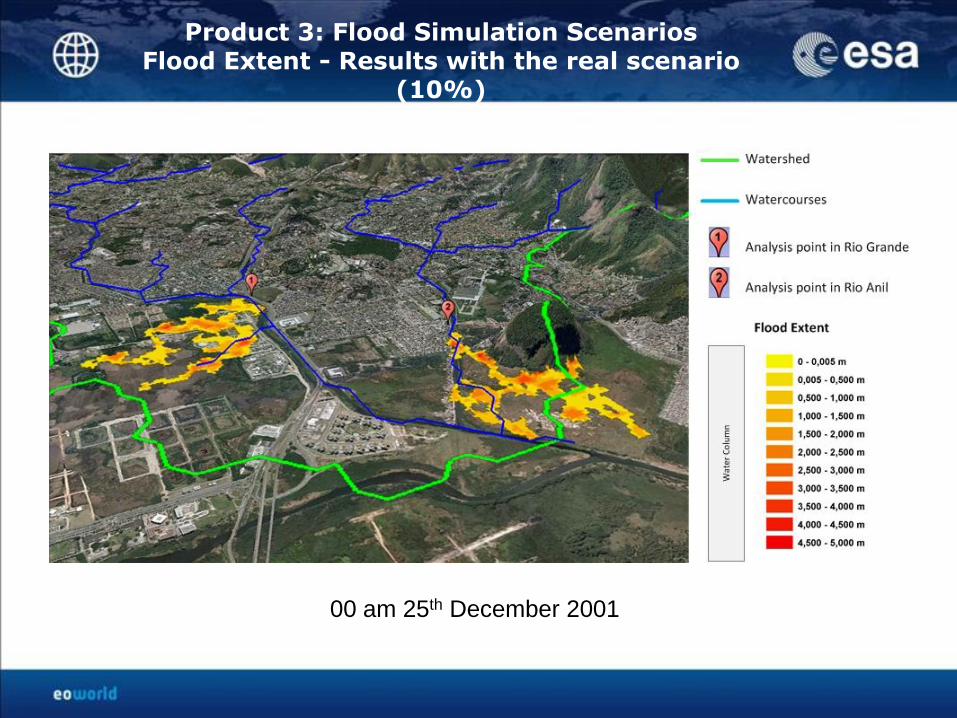
Product 3: Flood Simulation ScenariosFlood Extent - Results with the real scenario
(10%)
06 am 24th December 200112 am 24th December 200118 pm 24th December 200100 am 25th December 2001

Product 3: Flood Simulation ScenariosQuality check/Validation
Results of the flood simulation visualized in Google Earth® and video capture of a flood in the same area (Rio Anil) but occurred in a
different date (06-04-2010)


Major Findings
• The residential areas of the city of Rio de Janeiro correspond mainly to continuous or discontinuous
urban areas with medium to high density.
• 30 % of the AOI is covered with medium to dense urban fabric.
• High density of urban fabric appears in the low slopes areas.
• Discontinuous urban fabric of low density appears mostly on high slope areas.
• Slums reside in the continuous urban fabric class in both low slopes and high slopes.
• Areas with high slopes and very high dense urban fabric are almost always slums.
• 30% of the AOI was covered by vegetation, bare soil, very low density urban fabric or mineral
extraction. However, the large majority of the areas with slopes above 13% are covered with vegetation.
• Industrial units in the city of Rio de Janeiro are scattered among the residential areas in the urban
fabric.
Major Findings
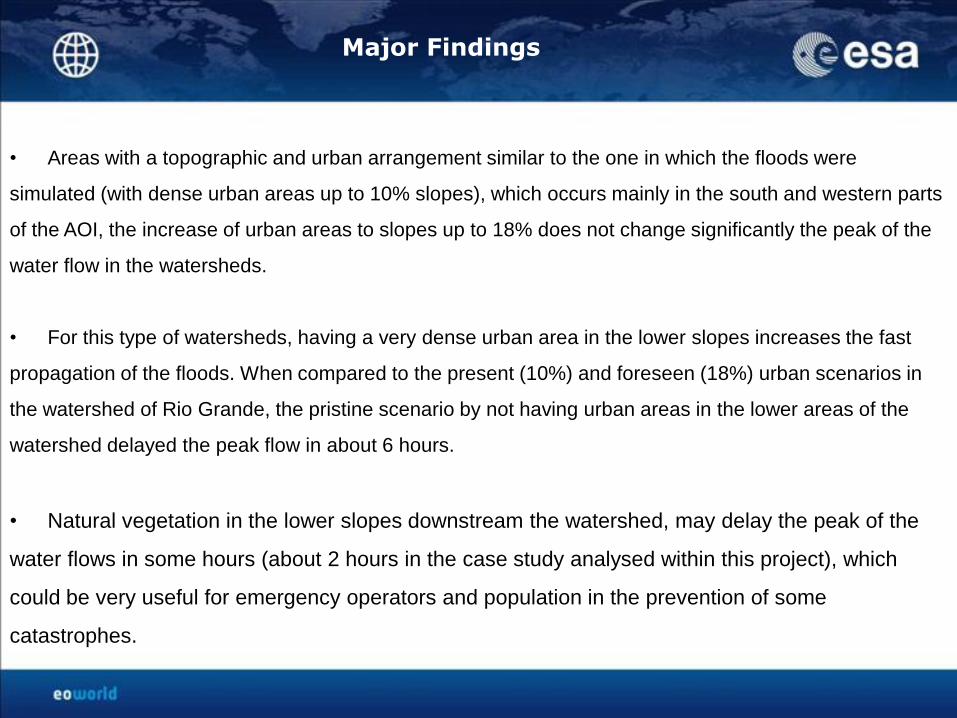
• Areas with a topographic and urban arrangement similar to the one in which the floods were
simulated (with dense urban areas up to 10% slopes), which occurs mainly in the south and western parts
of the AOI, the increase of urban areas to slopes up to 18% does not change significantly the peak of the
water flow in the watersheds.
• For this type of watersheds, having a very dense urban area in the lower slopes increases the fast
propagation of the floods. When compared to the present (10%) and foreseen (18%) urban scenarios in
the watershed of Rio Grande, the pristine scenario by not having urban areas in the lower areas of the
watershed delayed the peak flow in about 6 hours.
• Natural vegetation in the lower slopes downstream the watershed, may delay the peak of the
water flows in some hours (about 2 hours in the case study analysed within this project), which
could be very useful for emergency operators and population in the prevention of some
catastrophes.

How can these services be used?
Urban planning:
• Identify vacant, under-utilized or industrial areas that could be redeveloped or used for urban development,
sports of leisure purposes.
• Define priorities for urban development by analysing the vacant, under-utilized or industrial areas nearby
current transportation networks and planned transport investments.
• Identify the large majority of the informal settlements as these tend to be continuous urban areas with a very
high percentage of soil sealing and implemented in steep slopes.
• Identify high risk areas in order to avoid urban development on such areas or re-house people already living in
on these areas.
• Improve urban quality of life and urban development strategies by computing statistics such as the percentage
of green urban areas per hectare built.
• Identify vacant or under-utilized areas for managing construction licenses.
• Use flood simulation scenarios to analyze the impact of implementing specific urban strategies such as the
possibility of building new urban areas in steep slopes and use this information to better manage the urban space.
• Reduce the potential impact in the areas with high probability of floods occurrence by selecting these areas for
allocating the green areas, for example.
How can these services be used?
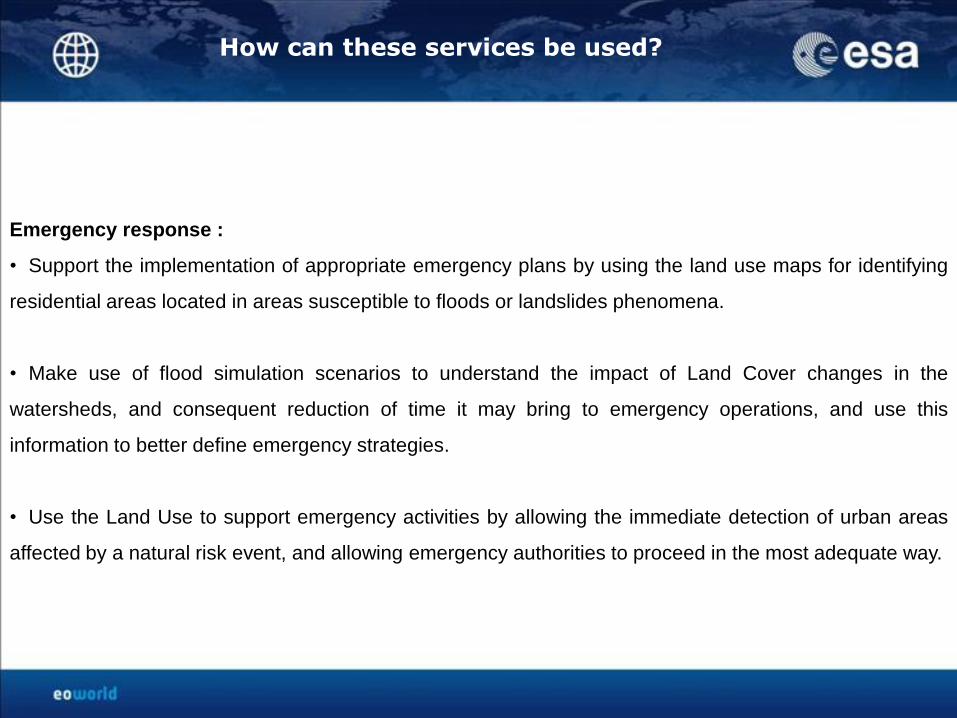
Emergency response :
• Support the implementation of appropriate emergency plans by using the land use maps for identifying
residential areas located in areas susceptible to floods or landslides phenomena.
• Make use of flood simulation scenarios to understand the impact of Land Cover changes in the
watersheds, and consequent reduction of time it may bring to emergency operations, and use this
information to better define emergency strategies.
• Use the Land Use to support emergency activities by allowing the immediate detection of urban areas
affected by a natural risk event, and allowing emergency authorities to proceed in the most adequate way.

Thank you
Questions & Discussion


![Rio De Janeiro Brazil[1]](https://static.fdocuments.in/doc/165x107/54b9338c4a795919228b464d/rio-de-janeiro-brazil1.jpg)