
Assessing Learning Efficiency In Narrative Simulation ...
145
University of Kentucky University of Kentucky UKnowledge UKnowledge Theses and Dissertations--Curriculum and Instruction Curriculum and Instruction 2020 Assessing Learning Efficiency In Narrative Simulation Delivered Assessing Learning Efficiency In Narrative Simulation Delivered Through Interactive Multimedia Through Interactive Multimedia Christopher Shannon Daniel University of Kentucky, [email protected] Author ORCID Identifier: https://orcid.org/0000-0002-6743-7042 Digital Object Identifier: https://doi.org/10.13023/etd.2020.447 Right click to open a feedback form in a new tab to let us know how this document benefits you. Right click to open a feedback form in a new tab to let us know how this document benefits you. Recommended Citation Recommended Citation Daniel, Christopher Shannon, "Assessing Learning Efficiency In Narrative Simulation Delivered Through Interactive Multimedia" (2020). Theses and Dissertations--Curriculum and Instruction. 34. https://uknowledge.uky.edu/edc_etds/34 This Doctoral Dissertation is brought to you for free and open access by the Curriculum and Instruction at UKnowledge. It has been accepted for inclusion in Theses and Dissertations--Curriculum and Instruction by an authorized administrator of UKnowledge. For more information, please contact [email protected].
Transcript of Assessing Learning Efficiency In Narrative Simulation ...

University of Kentucky University of Kentucky
UKnowledge UKnowledge
Theses and Dissertations--Curriculum and Instruction Curriculum and Instruction
2020
Assessing Learning Efficiency In Narrative Simulation Delivered Assessing Learning Efficiency In Narrative Simulation Delivered
Through Interactive Multimedia Through Interactive Multimedia
Christopher Shannon Daniel University of Kentucky, [email protected] Author ORCID Identifier:
https://orcid.org/0000-0002-6743-7042 Digital Object Identifier: https://doi.org/10.13023/etd.2020.447
Right click to open a feedback form in a new tab to let us know how this document benefits you. Right click to open a feedback form in a new tab to let us know how this document benefits you.
Recommended Citation Recommended Citation Daniel, Christopher Shannon, "Assessing Learning Efficiency In Narrative Simulation Delivered Through Interactive Multimedia" (2020). Theses and Dissertations--Curriculum and Instruction. 34. https://uknowledge.uky.edu/edc_etds/34
This Doctoral Dissertation is brought to you for free and open access by the Curriculum and Instruction at UKnowledge. It has been accepted for inclusion in Theses and Dissertations--Curriculum and Instruction by an authorized administrator of UKnowledge. For more information, please contact [email protected].

STUDENT AGREEMENT: STUDENT AGREEMENT:
I represent that my thesis or dissertation and abstract are my original work. Proper attribution
has been given to all outside sources. I understand that I am solely responsible for obtaining
any needed copyright permissions. I have obtained needed written permission statement(s)
from the owner(s) of each third-party copyrighted matter to be included in my work, allowing
electronic distribution (if such use is not permitted by the fair use doctrine) which will be
submitted to UKnowledge as Additional File.
I hereby grant to The University of Kentucky and its agents the irrevocable, non-exclusive, and
royalty-free license to archive and make accessible my work in whole or in part in all forms of
media, now or hereafter known. I agree that the document mentioned above may be made
available immediately for worldwide access unless an embargo applies.
I retain all other ownership rights to the copyright of my work. I also retain the right to use in
future works (such as articles or books) all or part of my work. I understand that I am free to
register the copyright to my work.
REVIEW, APPROVAL AND ACCEPTANCE REVIEW, APPROVAL AND ACCEPTANCE
The document mentioned above has been reviewed and accepted by the student’s advisor, on
behalf of the advisory committee, and by the Director of Graduate Studies (DGS), on behalf of
the program; we verify that this is the final, approved version of the student’s thesis including all
changes required by the advisory committee. The undersigned agree to abide by the statements
above.
Christopher Shannon Daniel, Student
Dr. Gerry Swan, Major Professor
Dr. Kristen Perry, Director of Graduate Studies

ASSESSING LEARNING EFFICIENCY IN NARRATIVE SIMULATION DELIVERED THROUGH INTERACTIVE MULTIMEDIA
____________________________________
DISSERTATION
____________________________________
A dissertation submitted in partial fulfillment of the requirements for the degree of Doctor of Education in the
College of Education at the University of Kentucky
By
Christopher Shannon Daniel Lexington, Kentucky
Director: Gerry Swan, Ph.D., Associate Professor of Education and Instructional Systems Design
Lexington, Kentucky
Copyright © Christopher Daniel 2020 https://orcid.org/0000-0002-6743-7042

ABSTRACT OF DISSERTATION
ASSESSING LEARNING EFFICIENCY IN NARRATIVE SIMULATION
DELIVERED THROUGH INTERACTIVE MULTIMEDIA
This study evaluated the effects of Narrative Simulation (NS) on learning and cognitive load. Specifically, it measured the potential differences in observed instructional efficiency when comparing a self-paced expository multimedia lesson to a NS lesson which involves a character-focused story with multiple decision inputs at key points.
This ex post facto design observed 119 participants consisting of preservice teachers from a large public university in the southeastern United States. They were divided into two sequence groups: (a) Expository Lesson Group; and (b) Narrative Simulation group. The Expository group received Expository Lesson One first, then Expository Lesson Two, and then Narrative Simulation. The Narrative Simulation group received Narrative Simulation, Expository One, and then Expository Two.
Upon entering learning management system, participants received the three lessons, each consisting of the following: (a) lesson content, (b) content assessment (c) NASA Task Load Index (TLX), a measure of cognitive load or perceived mental effort.
Statistical analysis reported (a) no statistical differences on perceived cognitive load across lessons (b) no statistical differences in the efficiency score across lessons, (c) no statistical differences on assessment score across Expository One and Two, (d) no statistical differences in the number of attempts needed to achieve a passing score when considering all assessments, (e) statistically significant differences from each group’s respective first attempt regarding cognitive load and efficiency, (f) statistically significant differences in the Narrative Simulation assessment score between groups.
KEYWORDS: online learning, learning efficiency, narrative simulation, interactivity, cognitive load theory, multimedia learning
Christopher Shannon Daniel
December 1, 2020 Date

THE EFFECT OF NARRATIVE SIMULATION ON LEARNING EFFICIENCY IN AN ONLINE DISTANCE EDUCATION LESSON
By
Christopher Shannon Daniel
Dr. Gerry Swan Director of Dissertation
Dr. Kristen Perry
Director of Graduate Studies
12/1/2020 Date

DEDICATION
To Sara. Grow old along with me! The best is yet to be, the last of life, for which the
first was made:
To Colin. See this and know you are always loved, you can do anything you put your
mind to, and we live the good life every single day.
The good life gives no warning.
It weathers the climates of despair
and appears, on foot, unrecognized, offering nothing,
and you are there.
-Mark Strand

iii
ACKNOLWEDGEMENTS
It is difficult for me to concisely explain Dr. Gerry Swan’s impact on my work, thinking,
and growth during this dissertation. He provided constant guidance, encouragement, good
humor, and support. It was a true privilege and honor to learn from him. I would not have
finished without him and will be forever grateful.
My heartfelt appreciation to my other committee members: Dr. Joan Mazur who also
carefully followed me, ready to lend support. Dr. Kun Huang and Dr. Xin Ma provided kind
guidance and attention, making me and my work better. I will always remember their
contributions.
Special thanks to Dr. Jeffery Bieber for his service as outside examiner of this
dissertation.
I would like to express special gratitude for the unique contribution of Dr. Gary Anglin
who not only introduced me to instructional design as a discipline and profession, but also gave
me an approach to taking what I have learned and use it to lead an intellectual life. It has changed
my life. I am an adherent of Dr. Edgar Schein and of Helping because of Dr. Anglin.
I deeply value the work of my professors in all my doctoral courses who gave me the
opportunity to learn and grow.
Special thanks to Dr. Marty Park for his assistance in administration duties on the DDL
platform.
Perhaps the biggest fringe benefit of the UK ISD program is the amazing colleagues and
classmates I met along the way. So many creative people in this department enriched my
understanding of the field. They helped make my time here a pleasure and the dissertation a
success.

iv
Eastern Kentucky University supported and inspired me. Dr. Steve Dwinnells and Tim
Matthews have given unconditional support to both improve myself and to make learning better
for students and faculty. Dr. Nedim Slijepcevic gave moral support and advice the whole way
through. Kara Renfro Taylor was a special work collaborator and true friend. My other excellent
colleagues made the work and thinking about this process a joy. I would never have begun
advanced studies without key support in EKU’s IT department: Margaret Lane, Melvin Alcorn,
Judy Cahill, Jean Marlow, Steven Fulkerson, James Keith, Mona Isaacs, and Ed Riley. They
were supervisors and friends who believed in me more than I did. I was surrounded by hard
working geniuses every day due to their leadership. I am also fortunate to work with so many
talented EKU faculty who have done nothing but encourage and guide me.
In the UK Department of Curriculum and Instruction, Dr. Kristen Perry and Betty
McCann provided excellent support and assistance throughout my process.
EKU and UK Libraries were incredibly helpful through all phases of my academic
growth. These librarians and staff gave of themselves to help me dozens of times in so many
ways. Things just worked because of their work.
Thanks to Dr. Heather Arrowsmith and Dr. Matt Irvin for advice, insight, and
readthroughs in the early stages of the dissertation.
Finally, I am so grateful for my family and friends who helped me in many ways great
and small. They have taught me about kindness, friendship, and work ethic.

v
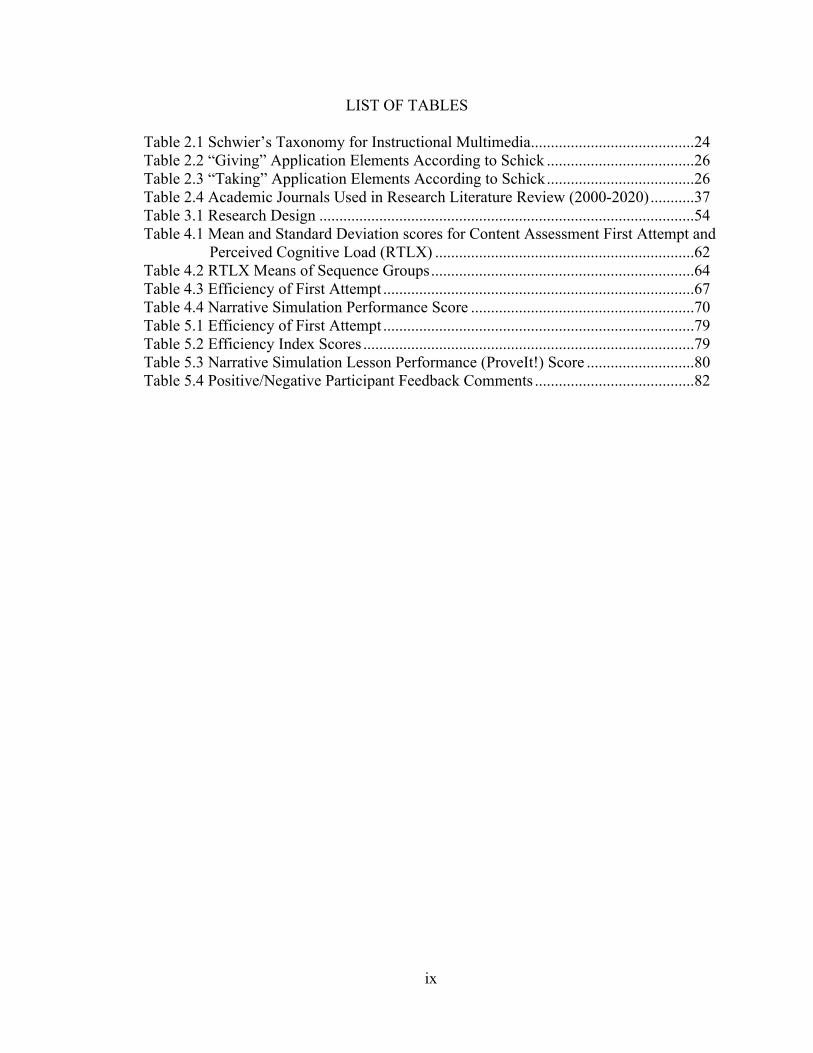
TABLE OF CONTENTS
ACKNOLWEDGEMENTS ............................................................................................... iii LIST OF TABLES ............................................................................................................. ix
LIST OF FIGURES ............................................................................................................ x
CHAPTER ONE: INTRODUCTION ................................................................................. 1
Efficiency ........................................................................................................................ 2
Study Content Area: Dyslexia ........................................................................................ 4
About the Digital Drivers License (DDL) ...................................................................... 7
Purpose of the Study and Research Questions ................................................................ 8
Organization of the Dissertation ..................................................................................... 8
CHAPTER TWO .............................................................................................................. 10
Introduction and Scope ................................................................................................. 10
Online Learning in Education ....................................................................................... 10
Narrative in Learning .................................................................................................... 12
Essential Aspects of Narrative .................................................................................. 13
Narrative as Interactive Simulation .......................................................................... 15
Narrative Simulation ................................................................................................. 15
Interactivity ................................................................................................................... 17
Fundamental Conditions of Interaction .................................................................... 17
Perspectives on Interactive Environments ................................................................ 19
Communications and social perspective. .................................................................. 19
User control toward social application. .................................................................... 20
Technological/Functional perspective. ..................................................................... 21
Perceptual/Behavioral Perspectives .......................................................................... 21
Individual Perception. ............................................................................................... 21
Behavior .................................................................................................................... 22
Interaction Approaches and Taxonomies in Learning .................................................. 23
Taxonomy of Interaction for Instructional Multimedia (Schwier, 1992) ................. 24
The Better “Mouse” Trap Taxonomy ....................................................................... 25
Multi-modal Interactivity .......................................................................................... 27
Interactivity in this Study .............................................................................................. 29
Theoretical Framework for the Study: Efficiency in Learning ..................................... 30
vi
Mental Effort ............................................................................................................. 31
The Media Debate: Economy and Replicability ....................................................... 31
Workload and Mental Effort ..................................................................................... 32
Cognitive Load Theory and Measures of Workload ................................................. 34
Instructional Efficiency ................................................................................................. 34
Primary Review of Narrative Simulation ......................................................................... 35
Summary of Search Results .......................................................................................... 37
Review of Dissertations ................................................................................................ 39
Conclusions for Distance Education, Narrative Simulation, and Instructional Efficiency Research ....................................................................................................................... 39
Summary ....................................................................................................................... 41
CHAPTER THREE .......................................................................................................... 43
Research Questions ....................................................................................................... 43
Hypotheses .................................................................................................................... 44
Participants .................................................................................................................... 44
Instrumentation ............................................................................................................. 45
Prove IT! Assessment ............................................................................................... 45
NASA Task Load Index (TLX) ................................................................................ 45
Instructional Treatments ............................................................................................... 46
Procedure ...................................................................................................................... 49
About the Digital Driver’s License (DDL) System ...................................................... 50
Measures ....................................................................................................................... 51
Cognitive Load Measures ......................................................................................... 51
Experimental Validity ................................................................................................... 53
External Validity ....................................................................................................... 53
Internal Validity ........................................................................................................ 53
Research Design ............................................................................................................ 54
Variables ....................................................................................................................... 55
Instructional Efficiency ................................................................................................. 56
Efficiency Revisited ...................................................................................................... 57
NASA TLX in Educational Research ........................................................................... 58
Summary of Methodology ............................................................................................ 59
CHAPTER FOUR: RESULTS ......................................................................................... 61
Demographics Statistics ................................................................................................ 61
Descriptive Statistics ..................................................................................................... 61

vii
Primary Data Analysis .................................................................................................. 63
Hypothesis Testing........................................................................................................ 63
Summary ....................................................................................................................... 65
Efficiency Procedure ..................................................................................................... 65
First attempt results. .................................................................................................. 67
Total comparison of lessons...................................................................................... 68
Summary ....................................................................................................................... 68
Number of Attempts to Pass ..................................................................................... 70
Summary ....................................................................................................................... 70
Summary of Data Analysis ............................................................................................... 71
CHAPTER FIVE: DISCUSSION AND CONCLUSIONS .............................................. 73
Discussion of Hypotheses ............................................................................................. 75
Comparison of Raw TLX (RTLX) Results ............................................................... 75
Comparison of First Attempts ................................................................................... 76
RTLX Comparison of All Lessons ........................................................................... 76
Computation of Efficiency Measures and Comparison of Mean Efficiency Scores 78
Comparison of Assessment Scores and Number of Attempts to Pass ...................... 80
Participant Feedback ..................................................................................................... 82
Summary ....................................................................................................................... 83
Limitations and Suggestions for Future Research ........................................................ 83
Ex post facto design .................................................................................................. 84
Effect of repetition within a short period .................................................................. 84
Expository One and Two are Segments .................................................................... 85
Participants not bound by the sequence assignment ................................................. 85
Implications for future research .................................................................................... 86
Summary ....................................................................................................................... 87
APPENDIX A ................................................................................................................... 89
APPENDIX B ................................................................................................................... 97
APPENDIX C ................................................................................................................... 98
APPENDIX D ................................................................................................................. 102
APPENDIX E ................................................................................................................. 103
APPENDIX F.................................................................................................................. 111
APPENDIX G ................................................................................................................. 112
APPENDIX H ................................................................................................................. 113

viii
REFERENCES ............................................................................................................... 114
VITA ............................................................................................................................... 130
ix
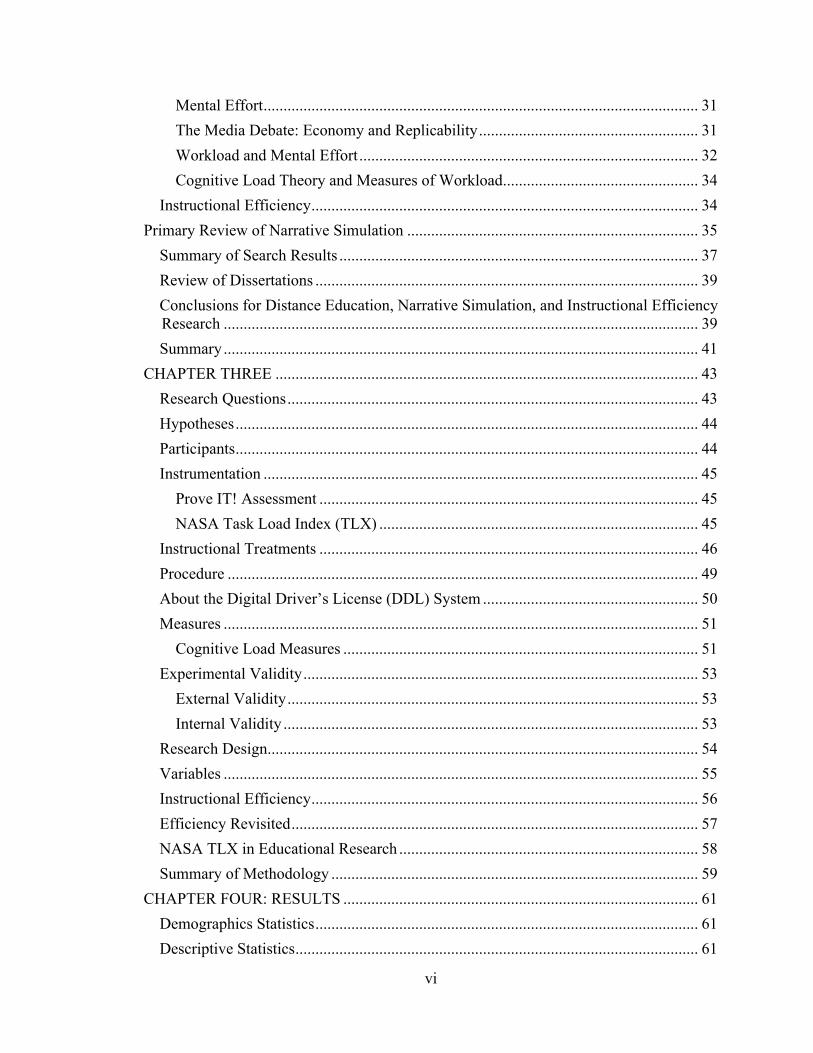
LIST OF TABLES
Table 2.1 Schwier’s Taxonomy for Instructional Multimedia .........................................24 Table 2.2 “Giving” Application Elements According to Schick .....................................26 Table 2.3 “Taking” Application Elements According to Schick .....................................26 Table 2.4 Academic Journals Used in Research Literature Review (2000-2020) ...........37 Table 3.1 Research Design ..............................................................................................54 Table 4.1 Mean and Standard Deviation scores for Content Assessment First Attempt and
Perceived Cognitive Load (RTLX) .................................................................62 Table 4.2 RTLX Means of Sequence Groups ..................................................................64 Table 4.3 Efficiency of First Attempt ..............................................................................67 Table 4.4 Narrative Simulation Performance Score ........................................................70 Table 5.1 Efficiency of First Attempt ..............................................................................79 Table 5.2 Efficiency Index Scores ...................................................................................79 Table 5.3 Narrative Simulation Lesson Performance (ProveIt!) Score ...........................80 Table 5.4 Positive/Negative Participant Feedback Comments ........................................82

x
LIST OF FIGURES
Figure 2.1 Paas Efficiency Equation where R = cognitive load and P = Performance ...35 Figure 3.1 Example of one screen of the expository lesson, consisting of mostly text and
picture ............................................................................................................47 Figure 3.2 Example of narrative simulation screen consisting of one or more questions at
key points in the story ....................................................................................48 Figure 3.3 Total Procedure for all three dyslexia modules .............................................50 Figure 3.4 NASA Raw TLX (RTLX) as used to measure cognitive load in DDL Dyslexia
Lessons ..........................................................................................................52 Figure 4.1 NASA Task Load Index questions with concomitant sliding scale ranging
from 1 (low) to 20 (high). ...............................................................................66 Figure 4.2 Efficiency Index Procedure ...........................................................................67 Figure 5.1 NASA Task Load Index as it appears in the Digital Drivers License ...........75 Figure 5.2 Example of complimentary graphic in Expository One .................................77 Figure 5.3 Dyslexia toolkit landing page. The participant in this example is assigned to
the Expository Sequence Group .....................................................................86

1
CHAPTER ONE: INTRODUCTION
Online distance education can be viewed as a situation or set of circumstances where
time and distance separates learners and instructors (Keegan, 1996). Institutions of higher
education employ mobile computer technology to bridge these gaps, delivering instructional
content and facilitating the learning process in modes other than face-to-face classrooms. The
landscape of online distance education will evolve as innovations emerge and offer new
means of interaction and interactivity (Larreamendy-Joerns & Leinhardt, 2006).
The growth and increased prominence of online education requires that positive
learning outcomes be reliably assured using sound theory and praxis. Educational
stakeholders should encourage instructors to not only evaluate new and emerging
methodologies, but also seek out strategies steeped in classical work and evidence relative to
desired learning outcomes (Johnson & Aragon, 2003). Therefore, content, delivery
mechanisms, ancillary technology, and other strategies are selected and leveraged with the
primary proposition of facilitating learning under this premise.
Technologies facilitate various forms of instructional communication (Gal-Ezer &
Lupo, 2002; Gilbert & Moore, 1998). For example, learner feedback is an essential function
of any instructional system. Automated systems can provide students with potentially fruitful
guidance relative to their learning goals (Gallien & Oomen-Early, 2008; Wiggins, 2012).
Additionally, technology can aid instructors to manage the activities, assessments, and
instructional content to facilitate the learning process in online distance education (Maloney,
2007; Watson & Watson, 2007).
While these methods for bridging gaps of time and distance can potentially benefit
students, practical considerations in offering access to course content and experiences often

2
require considerably increased instructor workload (Davidson-Shivers, 2009; Spector, 2005).
Research informs instructors and instructional designers on how to achieve a balance
between the time they spend creating meaningful learning experiences and the levels of
student performance within the online context as it relates to stated instructional goals and
expected learning outcomes. Not only must instructors perform more work up front to
prepare students to engage in online content, they must also work in different ways compared
to traditional college instruction (McKenzie, Mims, Bennett, & Waugh, 2000; Worley &
Tesdell, 2009). For example, students prefer instructors who are very responsive to email and
electronic forum messages in online courses (Hodges & Forrest Cowan, 2012). Students also
face multiple challenges when engaging in online learning, but especially challenges related
to time management (Song, Singleton, Hill, & Koh, 2004).
In short, instructors must work efficiently to achieve a balance between providing
appropriate learning content and resources, effectively communicating with students
according to their needs and preferences and doing so within time constraints imposed on
online learners and instructors.
Efficiency
Due to limited time and resources, both in terms of technology implementation, and
the time it takes instructors to prepare to teach and develop resources for online learning, the
concept of learning efficiency is relevant to instructors as well as learners. Literature has
described learning efficiency as utilizing the least time-consuming, mentally taxing, or most
straightforward instructional methods or products possible to achieve positive learning
outcomes in any given instructional situation (Ahern & Beatty, 1979).

3
From the perspective of the learner, efficient instructional design can be thought of as
providing the least demanding online instructional content or experiences that will yield the
best possible learning performance outcomes. The following concepts aid in deepening our
understanding of efficiency as it pertains to instruction.
Cognitive Load. Some scholars describe cognitive load as the “mental energy”
required to handle a given amount of information (Cooper, 1990, p. 108). The concept of
cognitive load is useful in considering the concept of demand and reducing demands on one’s
mental capacity toward learning. Cognitive Load Theory (CLT) supposes performance and
learning diminish when the amount of effort or load required exceeds the memory’s capacity
to process (John Sweller, 1988).
Lines of research from the last thirty years have suggested increases in cognitive load
are tantamount to mental effort, and reducing various aspects of cognitive load to the greatest
extent possible will increase productivity and/or learning outcomes (Paas, Tuovinen,
Tabbers, & Van Gerven, 2003; John Sweller, 2010; J. Sweller, Ayres, & Kalyuga, 2011).
Self-rated mental effort is one of the most cited measures of cognitive load (Leppink
& Pérez-Fuster, 2019). Reducing the amount of mental effort learners perceive they expend
on a given unit of instruction is one way to increase the efficiency of learning conditions.
Time and cost. While not a focus of this dissertation, multiple studies suggest both
the time it takes to create a unit of instruction or the time a learner spends engaging
instructional content can serve as important markers for understanding both instruction and
learning. Time on task is an often-cited metric that may predict learning outcomes.
Generally, more time on task is moderately associated with positive learning outcomes
(Admiraal, Wubbels, & Pilot, 1999; Wellman & Marcinkiewicz, 2004).

4
Study Content Area: Dyslexia
The purpose of this section is to provide essential background information on
dyslexia as an impediment to learning and to provide justification of its use as a subject
relative to learning modules included as part of a complement of online learning content in
the college of education at a large public university.
Dyslexia is a neurodevelopmental disorder that affects the areas of the brain that
process language. It primarily pertains to decoding or identifying the sounds contained in
speech, sounds which relate to letters and words. Secondary problems arising from dyslexia
are often deficits in reading comprehension and limited reading experience resulting in
reduced content knowledge (Tunmer & Greaney, 2010). People with dyslexia are generally
of at least average intelligence and can succeed in school with specialized interventions. The
most common of all neurocognitive disorders, an estimated 40 million Americans have
dyslexia (Snowling, 2013; The Mayo Clinic, 2019).
One of the greatest concerns relative to helping children with dyslexia is lack of
proper identification. Most elementary teachers quickly observe students with reading delays
or deficits. However, those same skilled educators may very well be untrained or even
unaware that dyslexia is but one potential cause of reading deficiency. At the same time, they
may hold false assumptions about the disorder (Johnston, 2019). Oftentimes, for various
reasons, those with reading delays will be treated for dyslexia, while those with the actual
disorder may not be offered appropriate interventions (Lindstrom, 2019). Additionally,
students may be subjected to many inappropriate screening tools; some teachers assume
normed achievement tests, perfunctory screening tools, and other non-accepted methods are
sufficient in determining if dyslexia might be the cause for students’ reading troubles. Some

5
states have adopted policies and procedures for identifying and serving the needs of dyslexic
students with the understanding that misdiagnosing students, especially the improper
identification of non-dyslexics as having the disorder, is as harmful as failing to serve the
needs of those with dyslexia.
Recent effort among civic organizations and grassroots groups toward increasing
awareness about serving the needs of students with dyslexia has resulted in state legislation
aimed at raising teacher awareness and increasing compliance identifying those with reading
delays. Specifically, these groups suggest educators provide proper identification and
diagnosis of dyslexia, along with evidence-based intervention for the condition, where
appropriate (Ward-Lonergan & Duthie, 2018). Multiple states in the southeastern United
States have created laws designating the establishment of programs, policies, and procedures
to better serve those with dyslexia and related reading disorders (Johnston, 2019).
The Virginia General Assembly passed legislation mandating specific interventions
and services to those with dyslexia. In 2016, they required those seeking initial teacher
licensure or renewal of their license to complete a form of awareness training regarding
dyslexia indicators as a legally defined term. Additionally, the training emphasized evidence-
based interventions and accommodations for dyslexia (Virginia Department of Education,
2020).
South Carolina similarly required in-service educators, specifically literacy coaches
and K-3 teachers to be trained regarding dyslexia and related reading disorders. These
modules are designed for literacy coaches, interventionists, teachers, and others who work
directly or indirectly with students who may experience reading difficulties, specifically
targeting those grades (National Center for Improving Literacy, 2020).
6
In 2018, Kentucky legislators passed the Ready to Read Act (Kentucky House Bill
187, 2018), a dyslexia intervention bill designed to decrease the barriers students with
dyslexia face receiving sufficient identification and intervention (The Lane Report, 2018).
Two provisions of HB 187 are of interest as it relates to this study. First, the
Kentucky Department of Education (KDE) created a dyslexia toolkit that provides
instructional guidance for students displaying characteristics of dyslexia. Second, HB 187
mandated the KDE to collaborate with Education Professional Standards Board, Council on
Postsecondary Education, postsecondary teacher education programs, and other agencies to
ensure that teachers are prepared to “utilize evidence-based interventions in reading, writing,
mathematics, and behavior” ("Kentucky Ready to Read Act," 2018).
In response to the legislation, the KDE created the Dyslexia Toolkit, a document
detailing the definition and characteristics of dyslexia, instructional approaches, screening,
reading assessments, and evidence-based interventions designed to assist and support
students (Kentucky Department of Education, 2019). Information from this document has
informed the core content provided to participants in this study.
In response to the mandate set forth in HB 187, The college of education at a large
public university will require successful completion of reading disorder and dyslexia
modules for all pre-service educators in elementary, middle, and secondary education
programs in order to graduate.
Drawing from content and critical information contained in the Dyslexia Toolkit, as
well as subject matter expertise from literacy faculty, the online instructional modules were
designed to provide essential information about dyslexia, as well as offer effective strategies
to increase awareness and motivate preservice professionals to better serve students with

7
reading challenges. Students access these online, self-paced modules using the web 2.0 based
Digital Driver’s License (DDL) tools and resources.
About the Digital Drivers License (DDL)
The DDL is organized instructionally through the user’s completion of a series of
licenses, or small units of study. A license in the DDL consists of one or more cases. These
cases present material and content in the form of text, images, videos, and assessments. There
are two main types of assessments learners engage in, each containing various kinds of
content assessment item formats such as true/false, multiple choices, and open response.
Once submitted, the learner receives immediate feedback to their responses and may review
the feedback at any time. Prior to taking a final assessment, a student has two options to
demonstrate mastery. First, they may complete a practice assessment, a purely self-
informative confirmatory feedback loop to the learner, a method which research has linked to
improved learning outcomes (Van der Kleij, Feskens, & Eggen, 2015). The learner may
return to specific content items for review based on the practice assessment results. The
second type of assessment is an opportunity for the learner to prove a level of understanding
regarding the specific content. This type of assessment in the DDL is known as a “Prove-It!”
assessment. Learners can take a “Prove-It!” assessment as many times as they wish by
resetting the attempt. A student must obtain an eighty percent (80%) or higher on all Prove-
It! assessments embedded in a case to demonstrate they have met a basic level of
understanding. Interestingly, in other content licenses offered in the DDL platform,
assessment data show there have been users that pass a Prove-it! the first time and retake it to
advance their already passing score to achieve a perfect score of one hundred percent

8
(100%). Conversely, developers have also seen evidence that some users have systematically
attempted to guess their way through a Prove-It!
Purpose of the Study and Research Questions
This study seeks to determine if there is a significant difference in the efficiency
(measured through perceived cognitive load and the measured outcome of demonstrated
performance) among online education students who first receive a self-paced Narrative
Simulation (NS) module versus students who first utilize a traditional online distance
learning module.
Based on the literature, this study will attempt to answer the following research
questions:
• Does dialoguing interactivity resultant from NS have a significant effect of the
various aspects of perceived cognitive load in learning dyslexia content, including
time demand, mental demand, perceived performance, mental effort, and frustration?
• Do participants engaged in a NS learning module obtain a higher score on their first
content test attempt compared with those learning from an expository online lesson?
• Do participants engaged in a NS learning module require fewer attempts to pass a
content test compared with those who experience an expository learning module?
• Do participants engaged in a NS learning module ultimately receive a higher score
above the minimum required passing score compared to those experiencing an
expository learning module?
Organization of the Dissertation
The subsequent chapters will present the dissertation material according to the
following order and organization: The conceptual framework and relevant literature for the

9
study are developed in Chapter Two, the study methodology is described in Chapter Three,
Chapter Four describes the results of the data collections and analysis, and Chapter Five
discusses the conclusions and implications of the research findings.

10
CHAPTER TWO
LITERATURE REVIEW
Introduction and Scope
This study proposes to elucidate four key components:
1) As time demands on both instructors and students increase, the online
environment is an actual, needful, and a valid means of instruction and learning;
development of learning products using best practices may serve large numbers of
individuals at a time convenient to their own needs and characteristics.
2) Interactive multimedia may be used to convey information and deliver instruction.
3) Meaning-making using narrative is a timeless instructional method. Narrative is
deliverable through interactive multimedia.
4) The literature suggests the concept of learning efficiency may be used to
understand the effects of instruction on cognitive load and performance
concurrently.
In this study, narrative simulation (NS) within online and distance education is
reviewed. Additionally, this chapter examines the concepts of learning efficiency and
interactivity as they pertain to the delivery of a narrative simulation as an instructional
intervention.
Online Learning in Education
This section discusses the growth of online learning and the need to select and utilize
efficient instructional interventions in online education.

11
Online distance education has experienced tremendous growth. An estimated 5.8
million students take online distance courses in the United States (Allen, Seaman, Poulin, &
Straut, 2016). The number of students taking only face-to-face courses continues to fall.
Since 2012, an estimated 824,000 fewer students take only face-to-face courses.
The sustained popularity and market demand for online learning have given rise to
instructional methods and other strategies designed to traverse the gaps created by distance
and time (Ally, 2004, p. 29; Ko & Rossen, 2010, p. 20; Rovai, 2003). Many institutional
affordances have changed how courses are delivered. For example, Park (2017) noted the
ubiquity of tools and processes to facilitate the inherent deficits caused by gaps in time and
distance experienced by online learners and their instructors compared to traditional
instructional environments.
Another type of gap exists within the online instructional context. There has been a
significant increase between the number of instructional tools and methods compared with
the rather static capacity of instructors to discover and learn these tools and to then deftly
deploy them (Berge, 1998; Lloyd, Byrne, & McCoy, 2012). Moreover, many postsecondary
institutions offer online courses in a compressed format, shorter than the traditional sixteen-
week semester. As a result, faculty have shorter development cycles and must spend
additional development time outside of this course delivery window. They must then
constantly respond to students and maintain a much more active presence in a course, giving
faster feedback to submitted assignments, as well as general questions (Krug, Dickson,
Lessiter, & Vassar, 2016).
The expansion of online distance education has given instructors and students alike
more options for delivering instruction and meeting appropriate learning outcomes. At the

12
same time, this expansion has raised questions and challenges centered chiefly on how to
maintain a quality educational experience with reasoned expected results and to do so
efficiently.
Instructors experience increased time demands in delivering online instruction
(Spector, 2005). Instructors and instructional designers may not use many of the preferred
instructional methods that foster critical and creative thinking in online education due to time
constraints. These methods include problem-based learning, case-based learning, and online
collaboration. Research suggests online instructors opt to implement tools with low barriers
to entry rather than utilize more complex tools (Kim & Bonk, 2006).
The prior section suggested the practicalities and realities inherent in online distance
education call for the most efficient instructional and delivery methods possible.
The next section suggests that narrative is an essential instructional method and that
one form of narrative lends itself well to online instructional delivery.
Narrative in Learning
Many instructors leverage the power of stories and storytelling to entertain,
communicate, and provide information with great success. It is an inherent part of our
humanity. In broad strokes, the literature suggests the following aspects and applications of
narrative are an effective and vital means of instruction.
The use of narrative allows complex or difficult concepts to be more accessible, as it
provides a context or framework in which the knowledge or information may be contained
(Szurmak & Thuna, 2013). Placing new information into a narrative structure offers an
immediacy and emotional connection to information or knowledge to which learners more
readily relate, and thus retain. The student may also compare and contrast stories to his or her

13
personal history and experiences, thereby creating meaningful connections to the knowledge
or information (Carter-Black, 2007). Narrative serves to clarify and coalesce abstract
concepts or problems. It provides context to ideas and situations. Therefore, it facilitates the
transfer of information in a context where the mind is often better situated to being open to
receive it. This is often even more significant when the story’s content and the instructional
content are either directly related or complement one another. (Szurmak & Thuna, 2013).
Simple presentation of facts in learning often precludes learners from interpreting or
using imagination. Because narratives can be employed to represent realistic events that
simulate lived experience, they can leverage the power of storytelling in one’s construction
of knowledge (McCrary & Mazur, 1999). Because we utilize stories in so many facets of our
lives, we can use narrative as a tool to understand and relate to the full range of human
behavior (Sarbin, 1986).
Essential Aspects of Narrative
The Culture of Education (Bruner, 1996) clarifies the role and significance of
narrative construction and utilization of narrative in meaning-making within the learning
context. Bruner posits narratives are relevant to the realities they construct and offers
universal precepts inherent to, and essential in, both human culture and the educational
process. Some of these concepts are useful in informing our understanding of narrative as a
teaching tool.
Narratives contain a “structure of committed time” (Bruner, 1996, p. 133), that is, the
unfolding events dictate the pace and play of the story, but not necessarily a conventional
sense of time.

14
Narratives are concerned with “generic particularity” (Bruner, 1996, p. 133).
Although details are essential and often distinguish various types of stories, the similarity
among stories tends to create narrative genres, and these serve to inform the reader, as well as
providing a framework for understanding the narrative.
Bruner posited that “actions have reasons” in narrative (Bruner, 1996, p. 136). People
and characters are motivated by their “beliefs, desires, theories, values, or other ‘intentional
states’” (Bruner, 1996, p. 136). While this intentionality provides a sense of connection to the
events contained in the narrative, there is also generally some element of freedom within the
action that gives novelty and a sense of uniqueness inherent in compelling storytelling.
Comprehension of a narrative is hermeneutic or disposed to interpretation. Bruner
argues there is neither necessarily a rational means of verifying the necessity of an
explanation nor a practical way of doing so. Therefore, we rely on the interpretations or
partial interpretations of others to make meaning of a narrative (Bruner, 1996, p. 137).
Bruner explains narratives contain some “centrality of trouble” (Bruner, 1996, p.
137), involving either some of the conflict, problem, or state of imbalance readers discover
during the rising action of the story. The property of “trouble” inherent to narratives serves to
engage the reader.
Stories engage students because they are relevant to, and resonate with, their life
experiences (Goetz, 2013). These aspects of narrative serve to gain the learner’s attention
through posing conflict or questions, exposing students to new ideas or new ways of thinking
about familiar situations, and by allowing exploration of such concepts in a non-threatening
context (Bruner, 1996; Goetz, 2013).

15
Narrative as Interactive Simulation
The literature suggests narrative, by its very nature, provides learners with the
opportunity to engage in a type of simulation.
Interpreting the actions of another, even within the context of a story, allows us to
employ mental processes. This process mirrors many of the same ways a person engages
physical simulations, attempting to use creative methods to understand the perspectives of
another or understand the behaviors outlined in the story (Hutto, 1997). Gordon (1986, p.
161) describes this as “a kind of practical simulation.”
When narrative cases describe believable behavior by the central characters and
portray interesting and specific situations, they are apt to be more readily believable and
facilitate immersion. Thus, they provide more opportunity to bring interactivity to narratives
(Swartjes, 2007). Narratives are often tied inextricably to simulations, as they allow learners
to understand necessary details in order to employ logical processes to solve complex
problems. (Heldal, Backlund, Johannesson, Lebram, & Lundberg, 2017).
In this study, as one state in the southeast region of the United States seeks to better
support individuals with dyslexia, more educators will be charged with identifying and
assisting dyslexics than ever before. Therefore, narrative simulation is a potentially useful
path for instructional interventions.
Narrative Simulation
In the context of this review and dissertation, the term narrative simulation (NS)
refers to a particular implementation of interactivity within the context of a story designed to
change behavior or inspire reflection upon one’s attitudes to evoke a change of thinking as it
relates to one’s personal beliefs or predictable past behavior.

16
The history of NS is steeped in disciplines or fields related to accident prevention,
health promotion, and education. The primary supposition in implementing narrative
simulation as an instructional intervention is straightforward but multifaceted. One’s culture
and deeply held convictions will often dictate one’s conduct relative to critical situations.
Individuals may act upon these suppositions and folkways in a potentially deleterious
manner. These actions might carry long-term and intractable consequences, affecting the
safety and well-being of oneself or others (Arrowsmith, Cole, & Mazur, 2009; Henry P.
Cole, 1997; Henry P Cole, Kidd, Isaacs, Parshall, & Scharf, 1997; McCrary & Mazur, 1999).
In the NS learning environment, participants receive stories as first-person
participants without full knowledge of all the events, which lies in contrast to the more
frequently utilized case-based instruction where learners generally have complete story
details before initiating any formal interactivity (Al-Dahir, Bryant, Kennedy, & Robinson,
2014; Ali et al., 2018; Lee, Lee, Liu, Bonk, & Magjuka, 2009).
At critical points in the story contained in a NS, the environment prompts participants
to answer one or more questions related to details in the developing plot. These questions are
generally either factual, procedural, or attitudinal and usually either true/false or multiple
choice. After participants select and submit a response, the system provides detailed feedback
based on acceptable practices, conditions which may result from the given selection, or
evidence-based consequences likely to arise because of that choice. One of the hallmarks of
most NS design is that the participant’s decisions generally do not affect the arc or the
outcome of the story (McCrary & Mazur, 1999).
The prior section discussed the concept of narrative both as a standard feature in
learning, as well as having applicability as a form of simulation for use in certain forms of

17
interactive online learning. But what constitutes interactivity? The next section discusses the
concept in broad terms, and then defines interactivity for the purposes of the study.
Interactivity
The concept of interactivity is complex. The Oxford English Dictionary (2009)
presents two significant definitions that may serve as focal points in defining the term for the
purpose of this study. The first use of the term appeared in 1832, in Saturday Evening, (A
precursor to The Saturday Evening Post) Isaac Taylor wrote about theology and invention.
The OED defined this reference to interactivity as a “state of reciprocal activity, where
entities act upon or influence one another.” The second definition comes from a 1967
publication of an Institute of Electrical and Electronics Engineers (IEEE) trade publication
focused on the extent of relationships between humans and electronic machines (Jain et al.,
2000).
These two broad constructs help to frame our understanding of interactivity across
different contexts. This section discusses a few of the more salient aspects of interactivity to
give precision and significance to the study.
Fundamental Conditions of Interaction
Relative to instructional systems, for a tool, technology, or process to be considered
interactive, it should contain one or more of the following essential conditions, which can
transcend most other contexts:
1. Involve multiple actors
2. Allow reciprocity
3. Receive and elicit response
4. Involve direct human communication

18
5. Mediate communication
6. Manage human/computer interaction.
The following section briefly discusses each of these.
Involve multiple actors. Although normally attributed to two or more people,
interaction can occur simply between a human and at least one computer-based process,
procedure, or entity. For example, early text-based games involved interaction between
humans and computers, and became richer over time (Perlin & Goldberg, 1996). Educational
computing eventually leveraged the utility of such systems as they became more popular
(Doty, Popplewell, & Byers, 2001).
Allow reciprocity. A return made in kind for a given response, interactive
environments allow for answers and responses to transact quickly and easily. Reciprocity
also suggests an attempt to value the interactions, and whether the participant has
experienced change as a result of the communication (Hemphill, 2001).
Receive and solicit response. At least basic mechanisms that afford actors the
chance to give and receive responses based on a given topic or criteria, providing a level of
engagement and communication that is a hallmark of effective instruction (Siau, Sheng, &
Nah, 2006).
Direct human communication. An essential characteristic of many useful interactive
situations, especially those involving the transference of information or in learning
(Morreale, Osborn, & Pearson, 2000). Direct, personal interactivity often requires more time
on the part of all actors.

19
Mediate communication. The transference of messages across one or more channels
or platforms with regard to distance or time and considering human factors (Joinson, 2001).
(Ijsselsteijn, van Baren, & van Lanen, 2003)
Manage human/computer interaction. The vast number of human/computer
transactions have necessitated an automatization of the recording, tracking, and recall of
these for the purposes of a better user experience (Parasuraman, Sheridan, & Wickens, 2000).
The prior section defined some of the essential qualities and functions that might
explain or describe interactivity. The following segment is concerned with some of the
possible perspectives related to environments containing interactive elements or situations in
which practitioners might use interactive features.
Perspectives on Interactive Environments
In the following section, this review focuses on aspects of interactive environments
that have emerged with the advent of the personal computer. Three perspectives highlight
different types of specific transactions, defining and describing the interplay between
multiple actors.
Kiousis (2002) asserted that arriving at a coherent construct of interactivity is difficult
because there is no single operationalization of the term interactivity which fits every
scenario. The term is ambiguous across different contexts. Kiousis proposed multiple
theoretical frameworks that define interactivity from communications, technological,
psychological, sociological, and perceptual perspectives.
Communications and social perspective. One viewpoint is that interactivity is a
communication construct. The ability to send and receive messages is paramount to any
20
interactive environment. Scholars emphasize the need for generalizable approaches to
communication to better inform interactivity use both in learning and in other disciplines
(Sundar, Xu, & Bellur, 2010).
A sociological approach to interactivity informs analysis through concepts applied in
both interpersonal and mass communications (Domagk, Schwartz, & Plass, 2010). How we
send messages, whether interpersonally or as a form of broadcast to multiple people, changes
how we think about interactivity and what is vital in trying to assess the efficacy of the
interaction: Vicker (2010) considers an interaction effective when a person is able to express
their own concerns, exchange ideas, and construct a shared understanding of a given topic.
This in turn elevates that person’s self-esteem and sense of purpose. From an interpersonal
perspective, humans communicate to learn and to achieve personal and work-related goals in
teams (Kirkman, Rosen, Gibson, Tesluk, & McPherson, 2002) or to establish myriad types of
relationships (Berger & Calabrese, 1975). An understanding of interactivity has the potential
to improve future interactions with others, positively influencing individual interactions and
as a result, potentially all of society.
User control toward social application. Interactivity is also defined as a set of
system attributes, enabling individuals to control the source, medium, and message of their
communications using a given system (Sundar, 2007, 2008; Sundar et al., 2010). Interaction
must have more social and psychological importance than merely exchanging messages if it
is to be considered meaningful (Bucy, 2004). From this perspective, we might use
interactivity to promote a healthier society by replicating communications and situations
occurring between individuals or groups of individuals to solve various problems.
21
Technological/Functional perspective. Much of the interactivity transpiring in
today’s information age often requires tools or technologies. Much scholarship has attempted
to describe interaction relative to the technological or functional attributes inherent in its
makeup (Delen, Liew, & Willson, 2014). For example, researchers have observed whether
having the user to control the pace of the on-screen appearance of instructional content has
featured prominently in positive learning outcomes (Mayer & Chandler, 2001).
This navigational interactivity is concerned with moving through computer-based
information via controls such as commands, menus, searching, hypertext links, or by search
functions. These methods contain some of the more sophisticated forms of navigational
interactivity. Navigation is a less advanced form of interactivity, as it imposes limits on what
a person may access next within the confines of a web site or other digital product or
experience. However, navigational interactivity is still essential as it is the most fundamental
aspect of interactivity. Moreover, an excellent navigational layout is integral to the success of
a website or learning object (Kimelfeld & Watt, 2001).
From this perspective, the selection of the specific tool, operations signifying the
placement of controls or features, and the overall functionality of the instrument is paramount
in solving problems related to effective instructional design and learning outcomes.
Perceptual/Behavioral Perspectives
Two critical perspectives related to interactivity focus on how the individual
perceives and refers to an interactive environment and the behaviors that may change
because of experiencing an interactive situation within an environment.
Individual Perception. Other perspectives focus on the individual in terms of different
perceptions and needs. Numerous industry actors attempt to assess the essential elements that

22
make the interaction more accessible and more efficient (Garrett, 2010). These actors are as
concerned with ease of use and utility as with other functional or technical operations or
characteristics to convey the content or message the creator hopes to deliver (McMillan &
Hwang, 2002).
There is convergence among, business marketing and e-learning research concerned
with perceptual effects on outcomes as they relate to the end-user. Both of these fields
consider user engagement as they both have active target audiences to which they must
communicate and generate a sufficient level of interest and enthusiasm in order to attain
desired goals and objectives (Mollen & Wilson, 2010).
The literature suggests prior positive experience with interactive technology
positively affects outcomes of future experiences, especially when collaborative experiences
are encouraged (Jung, Choi, Lim, & Leem, 2002). Users react positively when the activity or
environment evokes a stronger flow experience, or when users experience a fully immersive
and enjoyable experience (Ho & Kuo, 2010). Users report positive perceptions when there is
an opportunity for them to control the experience and that opportunity is made known to her
or him (Sims, 2003). Additionally, individuals may carry pre-existing beliefs in terms of their
own aptitudes and capacities concerning technology. These values affect their ability to
navigate interactive environments successfully. (Salajan, Schönwetter, & Cleghorn, 2010).
From this perspective, end-user satisfaction should be a high consideration when utilizing
interaction to solve a problem.
Behavior Another critical area of focus is the effects of interactivity on behavior.
Since the time of Edward Thorndike, whose Law of Effect became an essential perspective
regarding how the mind operates, scientists and others have been interested in ways to
23
measure and shape behavior in individuals. The premise is that a) Responses that trigger a
satisfying result reinforce that response and b) Stimulus-response connections not often
repeated are weakened (Plucker, 2007). Instructors and instructional designers may utilize
technologies that support the cognitive and social processes of learning, as well as other
significant forms of interactivity and their technical underpinnings to promote or encourage
desired behaviors (Deubel, 2003; Siau et al., 2006).
Jerome Bruner notes that the will to learn is intrinsic and that motivational aspects of
learning have not received the attention they deserve:
“The problem exists not so much in learning itself, but in the fact that what the school
imposes often fails to enlist the natural energies that sustain spontaneous learning.” (Bruner,
1966, p. 127). Interaction utilized from such a perspective might be interested in how such an
intervention elicits a behavioral outcome.
The prior section discussed a few of the predominant perspectives of interactive
environments. These perspectives may inform instructional design.
The following section discusses a few fundamental approaches and taxonomies that
have been created to employ interaction within learning.
Interaction Approaches and Taxonomies in Learning
The realms of education and computing have provided classification systems to aid in
understanding interaction and interactivity. These taxonomies arrange and classify some
discrete aspects of what it means to act, react, and influence in ways that might better inform
research and praxis.

24
Taxonomy of Interaction for Instructional Multimedia (Schwier, 1992)
Schwier rejected a simplistic view of human-computer interaction in favor of a
learner-media approach. This view analyzes the level of cognitive engagement influenced by
the learner. Schwier proposes classifying interactive transactions within five general
functions under three levels of interaction (Goolkasian, 1996). Schwier described Reactive
interaction as a response to a presented stimulus. Proactive interaction emphasizes meaning-
making and having the learner become the central character in the environment or
intervention. Mutual interaction, the highest level in this taxonomy, utilizes machine
learning, artificial intelligence, or aspects of virtual reality. In these systems, both the learner
and the learning system can adapt and respond robustly to one another (Schwier, 1992). This
iterative process within the environment is suggestive of a dialogue between learner and
learning system.
Table 2.1 Schwier’s taxonomy for instructional multimedia (1992)
Reactive Proactive Mutual Confirmation Touch Target
Drag Target Barcode Keyboard Voice Virtual Reality
Keyboard Voice Virtual Reality
Keyboard Voice Virtual Reality
Pacing Space Bar/Return Drag Target Barcode Keyboard Voice Virtual Reality
Keyboard Voice Virtual Reality
Keyboard Voice Virtual Reality
Navigation Touch Target Barcode Keyboard Voice Virtual Reality
Keyboard Voice Virtual Reality
Keyboard Voice Virtual Reality

25
Table 2.1 (Continued)
Inquiry Touch Target Barcode Keyboard Voice Virtual Reality
Keyboard Voice Virtual Reality
Keyboard Voice Virtual Reality
Elaboration Keyboard Voice Virtual Reality
Keyboard Voice Virtual Reality
Schwier noted that at the time of his presentation to the Annual Conference of the
Association for Media and Technology, multimedia systems were not capable of such robust
interaction. He also noted direct, sophisticated communication with machines might one day
be possible to advance the cause of learning and instructional intervention (Schwier, 1992).
The Better “Mouse” Trap Taxonomy
Schick (2000) proposed taxonomy and conceptualization of interactivity to stimulate
the development of educational software to promote critical thinking about history. First, he
differentiated software that directly responds to the user’s feedback versus software that
allows for a more profound, reflective experience. Second, he sought to identify if the
application is giving, or provides ready additional information for the learner, or taking,
meaning it asks the user to do something new with the data presented. This taxonomy
consists of twenty-six types of interaction divided among two main categories (Schick,
2000).

26
Table 2.2“Giving” Application Elements According to Schick
Name Description Mechanical Involving actions such as page turning or advancing to the next
slide Right/Wrong Shows the words "Correct" or "Incorrect" as appropriate before
moving on to the next question
Look It Up Displays page numbers in the textbook where the right answer may be found for all incorrect responses
More Anon Corrects misunderstandings and/or amplifies the original statement when the correct answer has been selected in a succinct paragraph or two
Outcome Tallies right and wrong answers, perhaps also analyzes the results insofar as they show patterns
Comparison Compares this student's result with previous users of the tutorial Depth Greatly expands the information available on the topics Context Broadens the discussion by examining each topic's context Satellite View Widens the scope across geopolitical lines Microscope Augments the knowledge by displaying focused readings drawn
from primary and secondary sources
Inclusion Incorporates the instructor's views Historiography Presents the perspectives of historians Crossfire Identifies issues in dispute regarding the statements
Table 2.3 “Taking” Application Elements According to Schick
Name Description Rewind Facilitates unlimited backtracking through the material should
the user wish to refresh a memory or double-check a fact
Notes Allows the student to record observations, questions to ask the teacher or pursue in the textbook, quibbles about answers given in the stimulation, and the like
Kaleidoscope Provides access to a vast collection of primary and secondary sources by means of a search engine (by keyword, phrase, wildcard, proximity) to find relevant information

27
Table 2.3 (Continued)
Analysis Interprets the user's choices
Questions Invites the user's written responses, with the result being saved and printed for analysis by the teacher
Collage Displays a series of images - visual, aural, text - and challenges the user to gather them into coherent narratives on these topics
Chain of Events Asks users to apply their reasoning skills to determine precursors for an event, predict outcomes, or find a common thread, based on the information provided
Doing History Asks students to become historians
What Ifs Offers counterfactual questions to challenge the user's thinking Consultation Magnifies learning through correspondence in listservs,
chatrooms, and other web sites
Response Allows for answers to questions outside the focus of the stimulation in two ways by providing: a list of supplemental questions to which the author has prepared replies and/or a website monitored by the application's author who will answer to questions seeking information, explanation, or historiographical suggestion
Living History Weblinks allow students to "visit" sites that actually reflect or virtually create situations
Simulation Users make choices reflecting those covered by the tutorial to better understand how history happened.
Multi-modal Interactivity
Moreno and Mayer (2007) apply an understanding of interactivity toward the learning
processes where interactivity is concerned with the actions of the learner and advancing or
changing his or her knowledge as it relates to the instructional goal. Moreno and Mayer
delineate delivery mechanisms offering one-way communication (perhaps from instructor to
the learner) versus those affording multi-directional communication, such that a learner may

28
send and receive messages. From one perspective, the goal of interactivity in multimedia
learning where communication is multi-directional, it is centered on knowledge construction
and meaning-making as opposed to simple knowledge transference. Multi-directional
communication supports constructivism to a greater extent than unidirectional interactivity or
environments where learner control is featured, but no real means of response and feedback
is possible (Mayer, 2002).
Moreno and Mayer (2007) offer five types of interactivity in multi-modal, or using
both verbal and non-verbal modes in learning:
1. dialoguing
2. controlling
3. manipulating
4. searching
5. navigating.
The following section defines these types.
Dialoguing. The learners receive questions and answers or similar feedback relative
to their inputs in the instructional environment or intervention.
Controlling. The learner determines the pace and sequence of a presentation or
scenario.
Manipulating. The learners set boundaries, characteristics, or rules for a simulation,
or have the ability to control the relationship to objects on the screen in terms of distance.
Searching. The learners find new topics or content by entering questions or inquiry,
receiving a list of choices, and selecting a preference.
29
Navigating. The learner continues to a different area of content by selecting from
multiple sources of information.
The prior sections explained some of the fundamental, accepted conditions of
interactivity, mainly as they pertain to digital online instructional situations. Additionally,
some interactive taxonomies, as well as perspectives on interactivity, were reviewed. The
literature suggests they may be valuable in creating various instructional interventions.
Interactivity in this Study
This study utilized an interactive invention with the following essential features: First,
the intervention is only concerned with the exchange between a human participant and the
online instructional learning system, in this case the DDL. The student will receive a type of
dialogic feedback based on participant choice at critical points in a narrative.
Second, although not the primary focus of the study, the intervention in this study
emphasizes modifying behavior or increasing awareness as it relates to policies and
procedures that are inclusive of diverse populations. The intervention is less concerned with
individual matters of perception in favor of communicating an expected attitude and,
therefore, a behavioral outcome.
Third, although the interactivity of this study’s intervention incorporated many of the
multi-modal features described above, the primary focus attempts to take a learner-media
proactive approach where the learner has a central role as an observer in the story. It contains
light to moderate amount of interaction, permitting the learner reflective time regarding the
issues presented in the intervention. Also, the initial interaction design involves a form of a
dialogue between the learner and the system that delivers the narrative simulation.

30
The following section discusses learning efficiency as a theoretical underpinning and
the basis for the of the instructional framework.
Theoretical Framework for the Study: Efficiency in Learning
While the introduction of this dissertation presented a need to design, develop, and
deploy learning products and experiences efficiently from an instructor’s perspective of
saving time, the concept of efficiency relative to the inherent processes in learning is also
viable, practicable, and worthy of consideration. Systematic approaches to the educational
process are certainly not novel. Theories and empirical research about how the brain
processes information have emerged over the last 60 years providing empirical data about
how instructional design can improve learning outcomes.
Not coincidentally, scholars and researchers have perhaps always given thought to the
concept of improving learning outcomes in the most convenient ways possible. For example,
William James (1916) in Talks to Teachers presented an understanding of the attributes of
the mind’s ability to hold a limited amount of information at a time and suggested specific
strategies to facilitate the learning process. He admonished teachers to “show concrete
examples” to make unfamiliar objects figures as “part of a story,” claiming “no unvarying
object can hold the mental field for long” (p 111-112).
George A Miller’s (1956) exposition of the retentive cognitive capacity of the human
mind, though at the time untested and still today controversial, was perhaps one of the most
influential early works exploring the nature and limits of human cognitive architecture and its
relationship to one’s ability to temporarily hold and process information (Cowan, 2000).
Multiple studies from the 1970s focused on the amount of effort required to learn a
given topic. One research line described the use of a rating scale for the perceived difficulty

31
of mental tasks, and the perception of mental effort needed to complete them (Borg,
Bratfisch, & Dorni'c, 1971; Bratfisch, 1970, 1972a, 1972b).
Mental Effort
The concept of mental workload, scarcely present before 1970, is concerned with the
multifaceted, aggregated mental demands imposed upon an individual by various tasks
performed within a relatively short time frame. The construct explains the incapacity for
humans to complete the requirements of a task or a given set of functions (Cain, 2007). Even
today, both researchers and practitioners utilize the concept of the mind’s capacity to hold
information on a short-term basis with the presumed goal of retaining information in a more
enduring way to be an essential aspect of learning.
The Media Debate: Economy and Replicability
The work of Richard E. Clark underscores a firmly held view among many
instructional design researchers and theorists: The chosen delivery method of instructional
content has little bearing on learning outcomes. Through analysis of prior studies and his
own research, Clark posits that the chosen instructional medium should be seen merely as a
method of transport, and one might convey instructional strategies in several different ways
(Clark, 2001). Others, such as Robert Kozma (1991), assert an opposing and alternative
viewpoint on the relevance and significance of media in education. Although this study does
not seek to examine the complexities of this debate and Clark’s position therein, he
mentioned two critical aspects of instructional development relevant to the efficiency
concept.
In multiple articles, Clark (1994, 2000, 2001) asserts one form of media may serve as
a replacement for the delivery of instructional content over most others. For example,

32
although true animation is limited to television, film, and computer animation, static visual
representations may be created to symbolize or convey a sense of motion (Anglin, Vaez, &
Cunningham, 2004), Therefore, the placement of images and text on a written page, TV, or
computer screen may also deliver similarly rich content when done strategically.
Although Clark warns against the effect novelty may play in the delivery of an
instructional unit, he suggests the selection of one media type may convey certain advantages
of economy or efficiency (Clark, 1994). Morrison (1994) suggests one should examine the
instructional unit overall, comparing it with an alternative form to determine the
effectiveness of the proposed unit (Anglin et al., 2004).
Workload and Mental Effort
Multiple theorists attempted to define and measure perceived mental effort. Mental
workload is a term representing multidimensional constructs (Reid & Nygren, 1988; Tein,
1989). The dimensions or workload defined by Sheridan and Simpson (1979) claim that
mental workload consists of three conceptually independent dimensions: time load, mental
effort load, and psychological stress load.
Time load refers to the amount of time an actor or participant has to perform a task
(Reid, Eggemeier, & Nygren, 1982; Reid & Nygren, 1988). It estimates the general time
required to complete a task and a pace or speed at which a person must work to keep up to
that pre-determined time. This pacing is determined not only by the complexity of a task but
also an individual’s skill or ability. For some, tasks may require more time either because the
individual cannot keep up with the expected pace, or because it merely takes more time than
the task designer anticipates.

33
Mental effort load is defined in terms of an individual’s capacities and is concerned
with information retrieval, processing, and decision-making. All of these factors compete for
an individual’s available mental capacity (Reid et al., 1982; Reid & Nygren, 1988).
Psychological stress is the third aspect of mental workload. It involves anything that
complicates the activity or task by producing anxiety, confusion, or frustration. Psychological
stress may result due to fear of physical harm, failure, tension, or unfamiliarity with a
situation (Reid et al., 1982; Reid & Nygren, 1988).
Measuring workload is a complex and challenging endeavor given the multi-faceted
aspect of work in various fields and the complexity of such activity. Understanding how
humans view work in relationship to the individual workload is essential to improving
performance-related outcomes:
“If people could accomplish everything they are expected to do quickly,
accurately, and reliably using available resources, the concept would have little
practical importance. Since they often cannot, or the human cost (e.g., fatigue, stress,
illness, and accidents) of maintaining performance is unacceptably high, designers,
manufacturers, managers, and operators, who are ultimately interested in system
performance, need answers about operator workload at all stages of system design
and operation. The many definitions that exist in the psychological literature are a
testament to the complexity of the construct, as are the growing number of causes,
consequences, and symptoms that have been identified. Given the confusion among
the experts, it seems equally likely that people who are asked to provide ratings will
have a similar range of opinions and apply the same label (workload) to very different
aspects of their experiences” (Hart, 2006a, p. 904).

34
As the concept of mental workload developed, it became more salient in learning
theory, considering variation in the rate, accuracy, and reliability of human performance
relative to a given task. In the following section, this review considers developments in
cognitive load theory and learning theory.
Cognitive Load Theory and Measures of Workload
Cognitive load is conceptualized as the level of “mental energy,” necessary to handle
a given amount of information (Cooper, 1990, p. 108). Cognitive Load Theory (CLT)
supposes performance and learning diminish when the amount of effort or load required
exceeds the memory’s capacity to process (John Sweller, 1988).
Prior studies from the last thirty years have suggested increases in cognitive load are
tantamount to mental work, and reductions in the various aspects of cognitive load to the
greatest extent possible will increase productivity and/or learning outcomes (Paas et al.,
2003; John Sweller, 2010; J. Sweller et al., 2011).
Instructional Efficiency
The concepts of efficiency and economy are also not new in educational research.
The scholarship and praxis of instructional efficiency are primarily concerned with achieving
the highest possible learning outcome with the lowest expenditure of resources or effort. This
section discusses the multiple conceptions of these terms and their potential implications.
Paas and Van Merriënboer (1993) developed a measure to both define the concept of
efficiency related to instruction, as well as a practical measurement of it. They state that
issues of overwork relative to mental processing are of great concern, from both an
instructional design perspective, as well as the significant safety issues extant in many
occupations requiring keen focus over a period. They define performance as “the

35
effectiveness in accomplishing a particular task, often measured by speed, accuracy, or in
educational settings, test scores” (Paas & Van Merriënboer, 1993, p. 738).
Figure 2.1 Paas Efficiency Equation where R = cognitive load and P = Performance
𝐸𝐸 =[R − P]√2
Paas represented efficiency as the test score represented as a percentage subtracted by
the perceived efficiency score on a nine-point scale (see figure 2.1). The sample test scores
and efficiency scores are standardized by computing z-scores. The grand means are
computed and compared to arrive at an index score used for the purposes of comparing
various instructional conditions.
The NASA Task Load Index (TLX) is a six-item subjective survey instrument
developed in 1980 by Sandra Hart and Lowell Staveland designed to measure ergonomic
factors in aviation and aeronautics prototypes. In the ensuing years, the TLX has been used in
hundreds of studies across myriad fields (Hart, 2006a).
The next section discusses the specific measures of instructional efficiency used in
this study.
Primary Review of Narrative Simulation
The following section highlights the search methodology used, the data collection
process, search results, and a summary of findings of narrative simulation (NS) instruction.
This study reviewed a variety of sources related to the concept of delivering real or
realistic cases via online instruction, including academic journals, online journals, scholarly
databases, Google Scholar web searches, and reference articles in primary research. These

36
searches covered multiple article types, such as primary research articles, conceptual articles,
theoretical articles, or what some describe as talk-talk articles (articles that relay relevant
ideas and facts but are generally not comprised of primary empirical data). This review
utilized only primary research, retaining other types of literature for reinforcement purposes.
Out of the total number of journal articles found, only one (Bearman, Palermo, Allen, &
Williams, 2015) reviewed known literature on topics similar to the proposition of this review.
However, it was not focused on the subject as broadly and included other types of
simulations about healthcare education.
The specific search process included investigations of the Ebsco Host’s Academic
Search Complete, which contains over 73 major research databases, including but not limited
to the following: Academic Search Premier, ERIC, Education Full Text with Wilson Web,
Education Source, Education, and Administration Abstracts. Additionally, standalone
searches were performed at eric.ed.gov and using Google Scholar. These search results
included terms such as online narrative simulation; learning with narrative simulation;
narrative simulation for learning. Related terms such as simulation exercises with narrative
were also used in searches. Table 2.1 identifies the journals where original research articles
to the literature review were discovered.
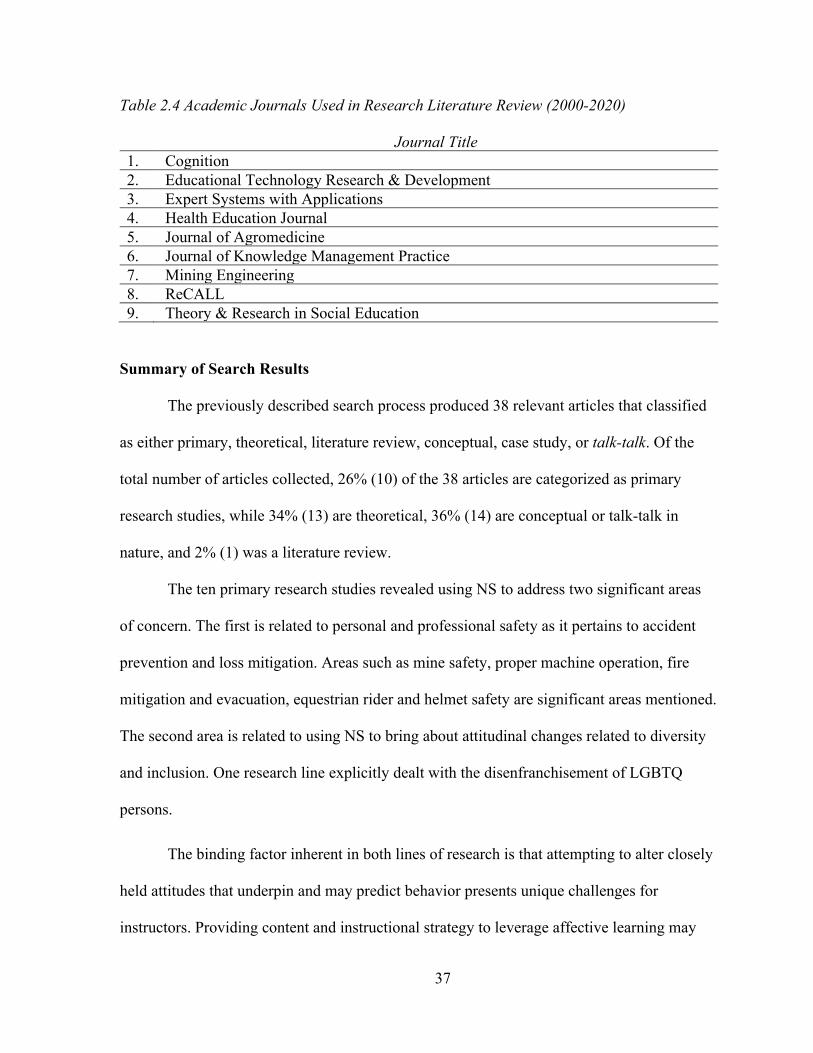
37
Table 2.4 Academic Journals Used in Research Literature Review (2000-2020)
Journal Title 1. Cognition 2. Educational Technology Research & Development 3. Expert Systems with Applications 4. Health Education Journal 5. Journal of Agromedicine 6. Journal of Knowledge Management Practice 7. Mining Engineering 8. ReCALL 9. Theory & Research in Social Education
Summary of Search Results
The previously described search process produced 38 relevant articles that classified
as either primary, theoretical, literature review, conceptual, case study, or talk-talk. Of the
total number of articles collected, 26% (10) of the 38 articles are categorized as primary
research studies, while 34% (13) are theoretical, 36% (14) are conceptual or talk-talk in
nature, and 2% (1) was a literature review.
The ten primary research studies revealed using NS to address two significant areas
of concern. The first is related to personal and professional safety as it pertains to accident
prevention and loss mitigation. Areas such as mine safety, proper machine operation, fire
mitigation and evacuation, equestrian rider and helmet safety are significant areas mentioned.
The second area is related to using NS to bring about attitudinal changes related to diversity
and inclusion. One research line explicitly dealt with the disenfranchisement of LGBTQ
persons.
The binding factor inherent in both lines of research is that attempting to alter closely
held attitudes that underpin and may predict behavior presents unique challenges for
instructors. Providing content and instructional strategy to leverage affective learning may

38
require more than straightforward approaches such as teacher-centric methods like direct
instruction, or even student-centered methods such as independent instruction.
How might we distinguish NS from other instructional interventions? First, NS
depicts realistic situations or circumstances in which learners experience engaging and
practical stories. Realistic and engaging conditions are the hallmark of NS and the most
crucial aspect of its delivery. Surveys or focus groups in most of the research indicated the
level of detail or authenticity allowed them to be concerned with the characters or concepts
contained in the story. Second, NS requires the intervention to provide for some reflective
mechanism so that the learner may evaluate his or her attitudes and values under the auspices
of realistic consequences given multiple courses of action. This reflective affordance allows
the mind to consider various possibilities relative to multiple decision points within the story.
By way of reflection, one may envision herself or himself as a potential participant of the
story. Therefore, a form of mental simulation occurs in which the learner may consider
possible decisions and the consequences that may result from any or all decisions.
The ability to individually evaluate a story, consider possible decisions, and then
reflect upon the choices made by a third person character within a realistic story is what
makes NS an appropriate intervention for affective learning to alter attitudes, thereby
potentially changing behavior. The research has suggested the utility of NS in domains
related to accident prevention and safety, and in promoting tolerance and acceptance of those
who differ from ourselves.

39
Review of Dissertations
The primary literature review yielded three dissertations related to the significance
and use of NS. Two of these cited much of the primary research lines presented in this
review.
Two dissertations dealt with different aspects of accident safety. Goetz (2013) utilized
NS to change behavior and promote awareness about fire prevention in rural populations and
attempted to measure the behavioral intentions of participants as a result of the intervention.
Schneider (2015) utilized theories of digital gaming to deliver an instructional intervention
featuring NS in the awareness of accidents related to misuse and improper safety practices
when riding all-terrain vehicles when compared with a non-game intervention.
The third dissertation (Zou, 2012) utilized NS as one of the frameworks in
understanding the creation and utilization of mental models related to the participation and
operation of teams in business environments.
Conclusions for Distance Education, Narrative Simulation, and Instructional Efficiency
Research
The literature review presented research findings, as well as questions which attempt
to understand NS.
It is apparent learners and instructors alike enjoy and accept NS. Students find benefit
from the engagement, the opportunity to consider realistic situations relative to the subject
matter and to practice thinking about complex scenarios. This process invokes a form of
mental simulation. In general, simulations have been well-studied and been shown to have
demonstrated value as learning interventions across many disciplines and domains.

40
Constructivist learning precepts feature prominently in the theoretical frameworks of
the NS studies discovered in this review. Research offers the viewpoint that meaning is made
more robustly in groups. Students gain more than the transfer of knowledge when learning
and working in groups.
NS as an instructional strategy may take multiple forms. It can certainly be offered in
face to face (F2F) courses but is also well-suited to individual delivery with students learning
by themselves. NS can be delivered via text and picture or other traditional approaches, or by
using more complex web-based, data-driven applications that offer instructors greater
flexibility in both delivering stories, as well as measuring student responses and the pacing
and branching aspect of delivery when applied.
There are many avenues one might explore to examine NS. Only ten studies were
discovered in the primary literature review spanning the years 1990 through 2020. Most of
the articles included a significant satisfaction or acceptability component relative to the
concept of presenting narratives.
There was no research discovered which attempted to assess the impact NS might
place on cognitive load. Moreover, few studies have looked at self-paced NS without some
peer interaction.
The purpose of this study was to determine whether there is a significant difference in
the efficiency (measured through perceived cognitive load and the measured outcome of
demonstrated performance) among distance education participants who engaged in a self-
paced NS module versus students who participated in a traditional online distance learning
lesson.

41
Summary
This review of literature sought to examine the suitability of NS as a viable
interactive instructional treatment in online distance education; some lines of research
explored the concept of interactivity and explicated the interactive features of the NS
intervention in this study. Additionally, existing learning efficiency literature was
summarized. The analysis of the research yields the following considerations.
First, NS can be used to provide information of various kinds in an attempt to change
attitudes, and therefore, alter perceptions or behavior. Moreover, it is an instructional method
and not bound to a particular medium or mediation, and therefore would be suitable in
myriad instructional situations, but especially within online, self-paced instructional units.
Second, NS poses questions at critical points in the arc of an unchanging story.
Responses to the items do not typically change the story’s outcome. Instead, they allow a
learner to consider various factors, receiving information and feedback as it relates to their
choices. These decision points afford a type of interactivity that is not only dialogic but also
allows for a kind of reflection that provides an opportunity of more profound thinking on a
given issue.
Finally, NS, a tested instructional intervention, has not been analyzed relative to the
concept of learning efficiency. As teachers and learners strive to attain the best possible
learning outcomes in the most expedient manner possible, the idea of learning efficiency by
Paas and Van Merriënboer (1993) may serve to inform the research to assess the
effectiveness of using NS as an online instructional intervention as opposed to more
traditional methods of instruction. The development of instructional interventions requires
considerable time and resources. Moreover, asking students to examine a newer instructional

42
approach and expend mental effort in comprehending and possibly applying the concepts
learned are all costs associated with the learning task. Learning efficiency, an application of
cognitive load theory (CLT), provides a framework by which we may consider NS as a
learning intervention. Learning efficiency considers the assessment performance and
compares the difference between that performance score and the perceived mental effort
expended in learning a lesson.
This study seeks to determine if the costs involved with utilizing NS as an
instructional intervention might return a higher learning efficiency, and therefore garner an
acceptable return on the learner’s investment of time and effort.

43
CHAPTER THREE
METHODOLOGY
Although ample literature related to online and distance education and cognitive
theories for multimedia learning exists, this research should further study the effects and
comparisons between the media and methods of interactivity. Moreover, it should make some
inference whether developing different instructional methods for online delivery might result
in an enhanced learning efficiency relative to perceived cognitive load and learning
performance. This study aims to inform instructors and instructional design practitioners if
the effort of developing such interventions will result in a more efficient learning outcome
for students.
This study seeks to provide a perspective on preservice educators participating in an
open online distance education module, and if a narrative simulation (NS) learning
intervention affected their levels of dyslexia awareness, as well as overall success in
recognizing some of the issues related to identifying and intervening on behalf of children
with dyslexia.
Research Questions
Based on the literature, this study seeks to answer the following research questions:
• Does dialoguing interactivity resultant from NS have a significant effect of the
various aspects of perceived cognitive load in learning dyslexia content, including
time demand, mental demand, perceived performance, mental effort, and frustration?
• Do participants engaged in a NS learning module obtain a higher score on their first
content test attempt compared with those learning from an expository online lesson?

44
• Do participants engaged in a NS learning module require fewer attempts to pass a
content test compared with those who experience an expository learning module?
• Do participants engaged in a NS learning module ultimately receive a higher score
above the minimum required passing score compared to those experiencing an
expository learning module?
Hypotheses
Based on the research questions stated above, the following hypotheses will be tested:
• Hypothesis 1: There will be significant difference in the perceived cognitive load on
assessments in an online open distance education course when comparing learners
using NS interactivity compared with a traditional digital expository instructional
intervention.
• Hypothesis 2: There will be a significant difference in instructional efficiency in an
online open distance education course when comparing the NS interactivity sequence
group and expository instruction group.
• Hypothesis 3: Significant differences exists between NS and Expository treatment
groups regarding other argued measures of efficiency which are test score and
number of attempts required to pass the test.
Participants
This research included preservice teacher education professionals at a large research
university. Upon receiving directions from their instructors, participants self-registered and
enrolled in an open distance education lesson on dyslexia located on the Digital Drivers
License (DDL) at https://otis.coe.uky.edu/DDL/.

45
For this study, lessons on dyslexia were provided by university literacy experts to be
utilized in the research. Within the module, 119 students registered and participated.
Instrumentation
This study collected learner performance and interactivity data via the participatory
(Web 2.0) web site Digital Driver License (DDL), comprised of user interface and a backend
database providing content and interactivity in an open online learning management system
originally focused on digital citizenship. Participants interacted with the digital content and
took assessments to measure their understanding. They created an account in the DDL
platform linked with their institution or school district to share their work and progress with
teachers and administrators.
Two types of instruments were used in this study: a Prove It! assessment occurring at
the end of each lesson and the NASA TLX (“NASA TLX: Task Load Index”, n.d.),given
after the conclusion of the Prove It! for the assessment of cognitive load experienced
resulting from learning the dyslexia content.
Prove IT! Assessment
Prove It! assessments consisted of a total of eleven true or false questions related to
general dyslexia knowledge and awareness. These questions were written and vetted by
literacy education experts at a large public research university in the southeastern United
States.
NASA Task Load Index (TLX)
NASA-TLX (TLX) is a multi-dimensional assessment subjective rating tool. It has
been extensively utilized for the analysis mental workload in people utilizing various human-
machine systems (Cao, Chintamani, Pandya, & Ellis, 2009; National Aeronautics and Space

46
Administration, 2019). It has seen extensive, nearly ubiquitous use in fields related to
aeronautics, and has also seen broad adoption in fields related to the United States military,
medicine, automobile operations, and computer operations and usage (Hart, 2006a). NASA-
TLX consists of a multidimensional rating procedure that derives an overall workload score
based on a weighted average of ratings on six subscales (National Aeronautics and Space
Administration, 2019). These scales consist of the following areas: 1. Mental Demand, 2.
Physical Demand, 3. Temporal Demand, or Time Pressure, 4. Self-Performance, 5. Effort,
and 6. Frustration. The original TLX utilizes a paired comparison technique between certain
of the above tasks to determine the extent to which of each of the scales most contributed to
the workload in the evaluated performance.
This study used what Hill et al. (1992) and Hart (2006a) refer to as the Raw TLX
(RTLX), a more simplified version of the TLX. The original TLX requires participants to
perform additional ratings, weighing the various subscales in order to determine which factor
contributed the most to the overall mental workload. The result would not significantly
influence either the implications or the central objective of the study. The RTLX was
performed by adding the scores of six ratings and averaging them. The resulting number is an
estimate of the overall mental workload.
Instructional Treatments
Expository Treatment. The Expository treatment contained text with supporting
images that closely patterns the NS in terms of content. The Expository treatment was also
offered in a web accessible format and available in the same location as the NS. The
Expository treatment should take no longer than twenty minutes to read based on an average
reading speed of 200 words per minute.

47
Figure 3.1 Example of one screen of the expository lesson, consisting of mostly text
and picture
Narrative Simulation Treatment (NS). The NS was a dyslexia lesson comprised of
a story containing text and pictures. At five key decision points in the story, participants are
asked a series of either true/false or multiple-choice questions. Participants answered one to
five questions posed at each key decision point with an average (mode) of two questions per
decision point. As participants provide answers at each point, the treatment offered the
correct answer, along with text-based feedback confirming the correct answer or providing

48
corrective or informational feedback providing rationale supporting the best response. The
treatment was self-paced in that the participant was able to take as much time as needed
before progressing to the next part of the story or return to prior sections if desired.
Completion of the NS should have taken less than twenty minutes depending on how long he
or she spent actively engaging each part of the story to answer the questions at each point
promptly.
Figure 3.2 Example of narrative simulation screen consisting of one or more
questions at key points in the story.
Both treatments were developed in conjunction with the University of Kentucky
professors who have literacy and dyslexia expertise who have both reviewed and approved
49
the general information and specific content of each lesson. Each lesson was designed to
contain similar content related to the summative assessments.
Procedure
This research was conducted using pre-existing data from this endeavor via an online
platform called the Digital Driver’s License (DDL), hosted by the College of Education of a
large public university located in the Southeastern United States. It is the largest university in
the state in terms of student enrollment. It is also the highest-ranked research university in the
state (Council on Post Secondary Education, 2018).
The total platform participant count since the launch of the open online distance
education course in August of the 2019-2020 school year, included 147,024 students, 1,392
administrators, and 9,584 teachers participated in modules hosted on the DDL. Participants
submitted over five million assessment attempts. DDL courses are configured so that
students, instructors, or practicum supervisors can decide when to start and when to stop a
session.
The study adopted a form of ex post facto design. Participants were randomly
assigned to either the expository group or narrative simulation (NS) group. Participants took
each of the three online lessons in stages according to this random assignment; the expository
group took two expository lessons first and the NS group took the NS lesson first, after
which they completed a content assessment and then the NASA-TLX subjective
measurement of cognitive load. After completing the NASA-TLX for the respective lesson
each group took the other modules, content assessment, and respective NASA-TLX.

50
There was no time limit established for the module, each module was estimated to
last approximately 35 minutes, for a total of approximately 105 minutes. Participants
registered to take the modules through the Internet DDL platform located at
https://otis.coe.uky.edu/DDL and completed the activities contained in the study at their
convenience online at their own pace in the following order: 1. dyslexia lesson (10-20
minutes) 2. dyslexia assessment (10 minutes) 3. NASA-TLX (10 minutes). At this point,
participants received the other assessments they were not offered in the first space.
Figure 3.3 Total Procedure for all three dyslexia modules
This research was conducted using pre-collected from the DDL online learning
management system. Participants interacted with materials included from within the system.
About the Digital Driver’s License (DDL) System
The Digital Driver’s License is a learning platform designed as an Online Open
Course experience for custom learning solutions (Swan & Park, 2015). The project began as
a specific curriculum consisting of content designed to impart knowledge of good digital
citizenship (Noonoo, 2014). The “license” consists of a set of scenarios, or cases, designed to
expose students to crucial concepts and build their skills in the nine elements of digital
First assigned Dyslexia
awareness treatment
(20 minutes)
Dyslexia content
assessment (10
muinutes)
NASA-TLX (5 minutes)
Second assigned treatment
(10-20 minutes)
Content assessment
(10 minutes)
NASA-TLX (5 mintues)
Third assigned treatment
(10-20 minutes)
Content assessment
(10 minutes)
NASA-TLX (5 minutes)
51
citizenship according to Ribble (2015). The DDL platform currently hosts cases dealing with
a broad range of topics, such as civics, social studies, and equity in education. It also hosts
the ability to create online digital teacher portfolios.
The lessons comprised in this study are cases as well. DDL Cases contain two general
types of assessments: practice-its and prove-its. Practice-its explain the cases, allows students
to answer questions, and then provides feedback to those responses. For example, one
question might ask if a course of action is appropriate for a student with a reading deficiency.
After students answer the question, they receive an explanation which either affirms their
answer or offers corrective feedback.
Prove-its are essentially traditional quizzes where students do not receive specific
feedback about their answers.
Measures
The study consisted of two instruments: 1. Literacy assessment developed in
conjunction with university subject matter experts on dyslexia and literacy for assessment of
dyslexia knowledge; 2. Variation of the NASA Task Load Index (TLX) (Hart, 2006b; Hart &
Staveland, 1988) for assessment of cognitive load experienced during the two instructional
treatments.
Cognitive Load Measures
The concept of cognitive load is applied in this study to describe the amount of
mental effort required to process a particular learning task. There are two predominant
subjective measures of cognitive load in academic educational literature. This study will use
more simplified raw version of the TLX (RTLX).

52
Although the original quantification of the ratings scale for sub-tasks was from 1-100,
the original study authors note an optimal reference scale be from either 1 to 10 or 1 to 20,
because subjects may not be disposed to providing very minute distinctions. In addition, the
original authors suggested whenever possible, the TLX be used within a graphical scale with
an unmarked continuum marked with extreme bipolar descriptors at both ends of the
continuum. They also suggest that values may be applied retroactively when scoring is
applied (Hart & Staveland, 1988).
The RTLX was given to participants after they answered summative assessment
questions related to dyslexia awareness. They responded to objective questions asking them
to rate the various aspects of task load from Very Low to Very High on a sliding graphical
scale with a division mark equating to a twenty-point scale (Figure 3.4).
Figure 3.4 NASA Raw TLX (RTLX) as used to measure cognitive load in DDL Dyslexia
Lessons

53
Experimental Validity
External Validity
One potential threat to the external validity of this study is the sampling bias and
characteristics of the participants. Having an actual random sample from the entire
population of teachers within a region or the country is not feasible. Although a selected
sample of this population may not be an accurate representation of the broader population or
preservice teachers, it may generalize the experience and outcomes for the preservice
teachers at only one institution.
Internal Validity
The following measures were taken to minimize threats to internal validity in this
study.
Instrumentation threats. The same measures and questions will be used on both the
narrative simulation group as well as the expository lesson group. Participants received the
same intervention and control. Participants received the same version of the RTLX for
reporting cognitive load.
Maturation. Participants generally completed all the learning content and
assessments within a short time frame: instructional intervention, summative assessment, and
RTLX.
Random group assignment. Participants were randomly assigned into either the
Expository sequence group or the Narrative Simulation (NS) group. The Expository group
received Expository Lesson One first and were then presented the Narrative Simulation after
completion of the ProveIt! assessment and RTLX for both Expository Lesson one and
Expository Lesson Two. The NS group received the Narrative Simulation Lesson first, and

54
then the expository lesson (Expository One and Two) after completing the ProveIt!
assessment and related RTLX.
Research Design This study used an ex post facto quantitative data analysis to both describe the
instructional environment as well as accept and reject the research Hypotheses (Table 3.1).
Descriptive statistics consisting of summative test scores, number of attempts, first
attempt, reported subjective cognitive load. This type of design allows for the manipulation
of independent variables, including the participant’s spatial abilities and prior astronomy
knowledge. Dependent variables in this study include the cognitive load and post dyslexia
knowledge.
Table 3.1 Research Design Measurement Variable Instrument Analysis Attempts Dependent Prove It! This variable is a
concatenation of all attempt scores on the Prove It! Assessments for this module.
Cognitive Load Dependent NASA TLX This variable was used to determine which lesson introduced the most cognitive load.
Efficiency Dependent Computation This is an index score derived by comparing z-scores from Attempts and Cognitive load measures.

55
Table 3.1 (Continued)
First Attempt Score Dependent Prove It! This variable was used to compare knowledge gained between the two sequence groups.
Number of Attempts Dependent Prove It! The variable was used to compare the number of times sequence groups repeated the Prove It! Assessments until a passing score of at least 82 was achieved.
Sequence Group Independent Digital Driver’s License (DDL) System
The DDL system assigned participants to either the expository or NS group. Each group received lessons and assessment related to their assigned group first before receiving the other content
Variables
This study included the following instrumentation or research variables: Attempts,
First attempt, Cognitive load measures, Number of attempts, and Sequence Group.
Attempts. The attempts variable is a dependent interval variable that represents the
values of attempts the learner made for each assessment on a quantitative scale.
First Attempt. The first attempt the participant made at their assigned Prove It!
assessment.
56
Measures of cognitive load. Measures of cognitive load are all dependent interval
level variables comprised of the following measures
NASA Task Load Index (TLX). The NASA TLX is a multi-dimensional assessment
subjective rating tool comprised of the following subscales: 1) Perceived Mental Demand, 2.
Perceived Physical Demand, 3. Perceived Temporal Demand 4. Perceived performance, 5.
Perceived effort, 6. Frustration.
Raw TLX (RTLX). A mean score is computed from the above individual subscales
to arrive at a single raw score. Additionally, one or more of the subscales may be omitted if it
does not pertain to the study or situation.
Instructional efficiency scores. Instructional efficiency will be computed via a
procedure outlined by Paas and Van Merriënboer (1993) comparing mean z-scores from both
the first attempt and cognitive load measures to compute an index score for the purposes of
comparing multiple instructional conditions, in this case an expository instructional treatment
versus a NS treatment related to dyslexia awareness.
Number of Attempts. The total number of attempts made by participants.
Sequence Group. The group designation indicating whether the participant received
the expository instructional treatment or the narrative simulation treatment first.
Instructional Efficiency
The concepts of efficiency and economy are not new in educational research. The
scholarship and praxis of instructional efficiency is primarily concerned with achieving the
highest possible learning outcome with the lowest expenditure of resources or effort. This
section discusses the multiple conceptions of these terms and their potential implications.

57
Paas and Van Merriënboer (1993) developed a measure to both define the concept of
efficiency related to instruction, as well as a practicable measurement of it. They state that
issues of overwork relative to mental processing are of great concern, from both an
instructional design perspective, as well as the significant safety issues extant in many
occupations requiring keen focus over a period of time. They define performance as “the
effectiveness in accomplishing a particular task, often measured by speed, accuracy, or in
educational settings, test scores” (Paas & Van Merriënboer, 1993, p. 738).
Learners’ behavior is more efficient if either their performance is higher than
expected relative to the amount of effort expended or if such mental effort is lower than
expected based on the outcome of their performance (Ahern & Beatty, 1979).
Paas and Van Merriënboer presented a calculation to equate this level of performance
relative to the expended mental effort, or efficiency. Utilizing Pass’s SR-9, participants
reported the perceived mental effort expended on a skills assessment. They then subtracted
these values from participants’ raw (performance) score. Z-scores are then computed for both
the score range as well as the perceived mental effort. The performance z-score is then
subtracted from the reported mental effort z-score. The result is then divided by a square root
of two. These procedures were repeated in multiple studies (Paas & Van Merriënboer, 1993;
F. G. Paas, 1992; Van Gog & Paas, 2008).
Efficiency Revisited
Van Gog and Paas (2008) revisited Paas and Merriënboer’s (1993) measure of
relative condition efficiency, potentially utilized by educators and researchers to differentiate
the effects that instructional methods may have on learning. Their measure relied on
58
performance and mental effort on an evaluation or test. The result is an index of the quality
of learning outcomes. Combinations of higher performance to lower mental effort indicate
the acquisition of more efficient cognitive schemata. Inversely, constructing a less efficient
cognitive schema is indicative of lower performance or potentially higher mental effort. They
noted that while this measure has become widely utilized, it has been so in an adapted form
that observes mental effort expended during the learning phase and not the test phase.
Van Gog and Paas demonstrate how these methodological adaptations measure the
potential total cognitive load of the lesson (including all the subtypes such as extraneous,
intrinsic, and germane) and not the actual load of the learning process. Therefore, measures
of efficiency that determine how an intervention improves learning outcomes are effective
when assessing the testing mechanism and not on the instructional situation itself (J. Sweller
et al., 2011). Learners who gain more knowledge via effective instruction experience less
intrinsic cognitive load during the testing phase (Van Gog & Paas, 2008).
NASA TLX in Educational Research
NASA-TLX is a multi-dimensional assessment subjective rating tool. It has been
extensively utilized for the analysis mental workload in people utilizing various human-
machine systems (Cao et al., 2009; National Aeronautics and Space Administration, 2019). It
has seen extensive, nearly ubiquitous use in fields related to aeronautics, and has also seen
broad adoption in fields related to the United States military, medicine, automobile
operations, and computer operations and usage (Hart, 2006a). NASA-TLX consists of a
multidimensional rating procedure that derives an overall workload score based on a
weighted average of ratings on six subscales (National Aeronautics and Space
Administration, 2019). These scales consist of the following areas: 1. Mental Demand, 2.

59
Physical Demand, 3. Temporal Demand, or Time Pressure, 4. Self-Performance, 5. Effort,
and Frustration. The original TLX utilizes a paired comparison technique between certain of
the above tasks to determine the extent to which of each of the scales most contributed to the
workload in the evaluated performance.
Given the current trends and historical perspective regarding the use of NS in
education, the focus of this research extends to the use of NS as instruction presented in
online courses or online instructional environments as a specific function of the quality of the
instruction by Van Gog & Paas’ recent work (2008). This design utilized the concept of
instructional efficiency presented by Paas and Van Merriënboer (1993), but instead of
implementing Paas’s SR-9 measure of cognitive load, it used the NASA-RTLX’s
multidimensional ratings tool in order to determine whether NS is an equal or higher quality
instructional method when compared to commonly seen instructional methods.
Summary of Methodology
Research participants in this study are primarily teacher education students from a
large public university. There were also a smaller number of participants from other four-
year institutions. Initial participants were solicited through their affiliation with various
colleges of education, as well as the DDL system. Instruments used in this study included the
following: a summative assessment and the raw NASA-TLX which will be used to assess
mental workload for each treatment.
Two sequence groups were observed in this study: The Narrative Simulation (NS)
group received the narrative simulation first and then a more traditional expository
instructional unit, while the Expository Group received the expository lesson first (consisting
of two lessons) and then the narrative simulation unit. The narrative simulation treatment was

60
a lesson on literacy and dyslexia awareness containing multimedia, multiple-choice questions
at key points in the treatment, and feedback based on selected answers. The traditional
expository intervention consisted of text and pictures.
The process of data collection lasted an estimated 35 minutes per lesson. Upon
accessing the learning management system, research participants will be assigned to one of
two treatments: expository or NST; Upon the first login, participants received the instruments
in the following order: instructional treatment, summative assessment, and then RTLX. After
completing the assessment, the participants received the other instructional treatments, as
they were a required assignment.

61
CHAPTER FOUR: RESULTS
The findings discovered during the analysis of data can be divided into two
categories: descriptive statistics and primary data analysis. The descriptive statistics section
describes the main features of the data. The primary data analysis reports the indices
generated from the calculation of efficiency within instructional conditions contained in the
sequence groups as well as the result of inferential statistics.
Demographics Statistics
This study followed an ex post facto research design. Limited demographic data was
available due to privacy concerns. Therefore, de-identified data was used as the basis of the
analysis. A total of 119 participants took at least one portion of the dyslexia module.
Upon login to the DDL system, participants were randomly assigned into sequence
groups consisting of expository and narrative simulation (NS). The expository group first
received expository treatments one and two (each consisting of lesson, content assessment,
and then the NASA Task Load Index (TLX) subjective cognitive load measurement) and
then the NS treatment, while the NS group received the NS treatment first and then
expository treatments one and two along with their corresponding content assessment and
TLX.
Descriptive Statistics
Before performing any index or statistical analysis, essential descriptive data were
measured. Means and standard deviations for both the content knowledge assessment, as well
as the NASA Raw TLX (RTLX) associated with each of the three lessons are reported in
Table 4.1.
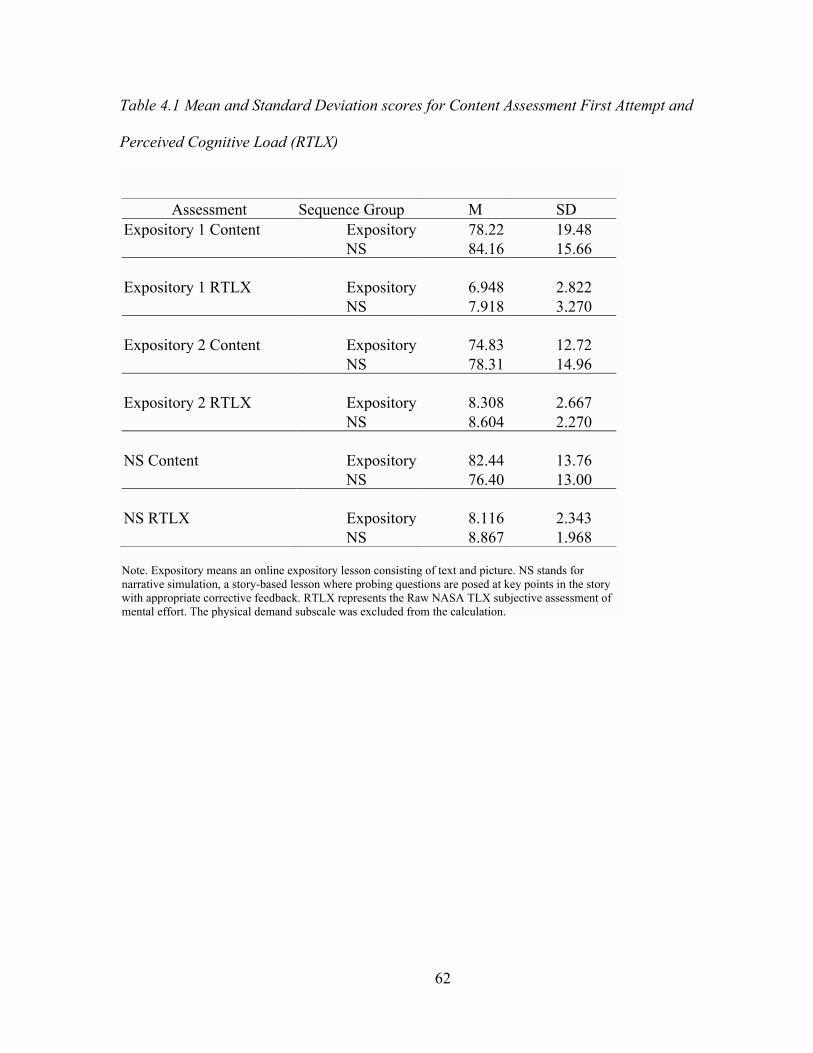
62
Table 4.1 Mean and Standard Deviation scores for Content Assessment First Attempt and
Perceived Cognitive Load (RTLX)
Assessment Sequence Group M SD Expository 1 Content Expository 78.22 19.48
NS 84.16 15.66
Expository 1 RTLX Expository 6.948 2.822 NS 7.918 3.270
Expository 2 Content Expository 74.83 12.72 NS 78.31 14.96
Expository 2 RTLX Expository 8.308 2.667 NS 8.604 2.270
NS Content Expository 82.44 13.76 NS 76.40 13.00
NS RTLX Expository 8.116 2.343 NS 8.867 1.968
Note. Expository means an online expository lesson consisting of text and picture. NS stands for narrative simulation, a story-based lesson where probing questions are posed at key points in the story with appropriate corrective feedback. RTLX represents the Raw NASA TLX subjective assessment of mental effort. The physical demand subscale was excluded from the calculation.

63
Primary Data Analysis
Hypothesis Testing
In this section, the primary hypotheses of the study will be tested using an index
comparison of multiple computed variables related to the concept of efficiency, two sample
independent t-test, and chi-square analysis of nominal and interval-level variables.
Hypothesis #1 states that there will be significant difference in the perceived cognitive
load on assessments in an online open distance education course when comparing learners
using NS interactivity compared with a traditional digital expository instructional
intervention.
This hypothesis was tested by performing a t-test on the following variables by
sequence group: Respective first attempt RTLX, Expository 1 RTLX, Expository 2 RTLX,
NS RTLX. The Raw TLX was derived by computing the mean of five out of six subscale
measurements from the original NASA task load index, but excluding the subscale
measuring perceived physical demand. The RTLX in this instance is based on a scale from
one to twenty from among five subscale questions:
1. How mentally demanding was the task? (Mental Demand)
2. How hurried or rushed was the pace of the task? (Temporal Demand)
3. How successful were you in accomplishing what you were asked to do?
(Performance)
4. How hard did you have to work to accomplish your level of performance? (Effort)
5. How insecure, discouraged, irritated, stressed, and/or annoyed were you?
(Frustration Level)
The resulting t-test scores indicated the following:

64
Respective First Attempt. This is considered the first test taken by each respective
group. The expository sequence group took the test for expository lesson one first, while the
NS group took the test narrative simulation one before taking the others. An independent
samples t-test was also used to analyze the means scores, and a significant statistical
difference was observed in the two sequence groups t(119) = -4.25, p= < 0.01. The RTLX
Based on obtained data, it can be concluded with 95 percent confidence that the
cognitive load for the participants taking expository lesson 1 first was significantly lower
than the cognitive load experienced by students who first began the narrative simulation
lesson (Table 4.2).
Table 4.2: RTLX Means of Sequence Groups
Sequence Group N M SD Expository 63 6.98 2.78 NS 56 8.83 1.94
Expository Lesson One. There was no significant difference between the RTLX
means for the two treatment groups t(117) = -1.71, p= >.05. It can therefore be concluded
with a greater than 95 percent confidence level that there was no significant difference
between the two sequence groups.
Expository Lesson Two. There was no significant difference between the RTLX
means for the two treatment groups t(113) = -0.61, p= >.05. It can therefore be concluded
with a greater than 95 percent confidence level that there was no significant difference
between the two sequence groups.
Narrative Simulation (NS) Lesson. There was no significant difference between the
RTLX means for the two treatment groups t(111) = -1.83, p= >.05. It can therefore be

65
concluded with a greater than 95 percent confidence level that there was no significant
difference between the two sequence groups.
Summary
Measures of cognitive load were computed based on five of the six subscales from the
NASA Task Load Index. A mean was calculated from these variables on a scale of twenty
points and t-test comparisons were performed for each lesson’s content assessment. An
additional t-test was performed which compared each group’s respective first assessment
attempt; the expository sequence group took the expository lesson one first, and the NS
group took the narrative simulation lesson first.
Hypothesis #1 was accepted on the basis of the statistically significant differences in
the first attempt RTLX.
Hypothesis #2 states There will be a significant difference in instructional efficiency
in an online open distance education course when comparing the NS interactivity sequence
group and expository instruction group. This hypothesis was tested in two ways:
1) Comparing efficiency index scores from NS group’s first assessment attempt with
the expository group’s first assessment attempt. Additionally, a t-test was
performed comparing the mean efficiency scores of each group.
2) Performing a one-way ANOVA to test for interactions based on sequence group
or lesson.
Efficiency Procedure
Paas and Van Merriënboer (1993) originally devised the efficiency measure of instructional
conditions. Researchers have since repeated it numerous times (Van Gog & Paas, 2008). It
continues to be cited often today. This study diverges from the Paas and Van Merriënboer

66
procedure by replacing the seven or nine point Likert scale to measure the subjective
cognitive load experienced by the individual with a mean score computed from five of the six
TLX subscales in conjunction with a webbased range slider for each on a scale of 1-20.
Figure 4.1:NASA Task Load Index questions with concomittant sliding scale ranging from
1 (low) to 20 (high).
Z-scores were computed for both assessment percentage scores and the NASA Raw
TLX (RTLX). The RTLX is a well-documented and repeated modification of the original
NASA-TLX. Researchers opted to omit subscales in other studies or have used them
individually to report various aspects of task load (Hart, 2006). To arrive at an efficiency
index score, each participant’s performance z-score (P) was subtracted from the RTLX z-
score (R) and the result divided by the square root of two. Thus, the lower the reported
efficiency index score, the greater the efficiency, as the normed performance value is greater
than the normed reported amount of mental effort expended in learning or recalling the
information in question.

67
Figure 4.2 Efficiency Index Procedure
A mean comparison of the resulting efficiency scores was then performed. For this
study, two such comparisons were conducted:
1. An efficiency score mean comparison of each sequence group’s respective
first attempt
2. A one-way ANOVA to determine the potential statistical difference of the
mean efficiency score among the three dyslexia lessons: expository one,
expository two, and the narrative simulation (NS).
First attempt results.
Comparing the expository group’s efficiency score on the first attempted assessment
with that of the NS group’s yielded the following result:
Table 4.3: Efficiency of First Attempt
Sequence Group M SD Expository -0.48 1.81
NS 0.25 1.30
Obtain Scores for RTLX and
Raw Assessment
Obtain Grand Mean/Standard Deviation• Replace missing
scores with GM
Group Means
Caluclate z scores for
RTLX (R) and Score (P)
Calculate Efficiency = (R-P)/Sqrt(2)
68
The expository sequence group yielded a higher efficiency (M= -0.48) when
compared with the narrative simulation group (M=0.25). A t-test comparing the means from
each respective group revealed a statistically significant difference between each group
t(119) = -2.55, p= 0.012. It can therefore be concluded with a greater than 95 percent
confidence level that there was a significant difference between the two sequence groups’
first attempts.
Total comparison of lessons
A one-way ANOVA was conducted to compare the effect of instructional treatment
sequence on efficiency score between the three instructional treatments (Expository 1,
Expository 2, and Narrative Simulation). The results of the ANOVA were as follows:
Statistically significant differences were found between three lessons F(2, 354) = 5.87, p =
0.003. Post hoc comparisons using the Tukey HSD test indicated that the mean score for the
expository one condition (M = -0.363, SD = 1.676) was significantly different than the
expository two condition (M = 0.235, SD = 1.242) However, the NS condition (M = 0.057,
SD=1.172) did not statistically differ significantly from either the expository 1 or expository
2 conditions.
Summary
An efficiency index score was computed to describe the potential synergy between
cognitive load and performance on content assessments among three lessons. This efficiency
score was used in two ways:
1. A two-sample t-test was conducted to compare the expository group’s first
assessment attempt with that of the NS group.

69
2. A one-way ANOVA was conducted to determine if there was a statistical
difference in mean efficiency scores relative to the assessments themselves.
Expository lesson one was more efficient for the expository group than was the NS
group’s first lesson, the narrative simulation lesson. The one-way ANOVA demonstrated a
difference between each of the three lessons. Post-hoc testing suggested there was only a
statistical difference between expository lesson 1 and expository lesson 2.
Given the above results, Hypothesis #2 was accepted based on the index comparison
between sequence groups’ respective first attempts.
Hypothesis #3 states significant differences exists between NS and Expository
treatment groups regarding other argued measures of efficiency initial test score and number
of attempts required to pass the test.
To test this hypothesis, two individual sample t-tests were conducted with regard to
the first attempted test scores for each of the instructional treatments and chi square tests
were performed comparing the number of attempts on the respective assessments until
participants attained a minimum score of 82 percent. The results are as follows:
Respective first attempt performance score. There was no significant difference
between the performance score means for the two treatment groups t(118) = 0.60 p= >.05. It
can therefore be concluded with a greater than 95 percent confidence level that there was no
significant difference between the two sequence groups’ respective first attempt.
Expository lesson one performance score. There was no significant difference
between the performance score means for the two treatment groups t(119) = -1.84, p= >.05. It
can therefore be concluded with a greater than 95 percent confidence level that there was no
significant difference between the two sequence groups.

70
Expository lesson two performance score. There was no significant difference
between the performance score means for the two treatment groups t(113) = -1.33, p= >.05. It
can therefore be concluded with a greater than 95 percent confidence level that there was no
significant difference between the two sequence groups.
Narrative Simulation performance score. There was a statistically significant
difference between the performance score means for the two treatment groups t(112) = 2.39,
p= 0.019. It can therefore be concluded with a greater than 95 percent confidence level that
there was a significant difference between the two sequence groups.
Table 4.4 Narrative Simulation Performance Score
Sequence Group N Mean SD SE Mean Expository 57 82.4 13.8 1.8 NS 55 76.4 13.0 1.8
Number of Attempts to Pass
Chi square tests of independence were performed on each of the knowledge
assessments to determine if the results of one sequence group was different from another. No
statistically significant differences were found in the expository 1 (χ2 (4)=0.54), expository 2
(χ2 (3)=2.57, p=0.46), or narrative simulation lesson (χ2 (4)=5.34, p=0.25).
Summary
Other measures of efficiency were tested to include t-tests on participants’ first
attempts on the content assessment (ProveIt!) for each lesson, a comparison of ProveIt!
scores for each lesson by sequence group, as well as chi-square analysis on the number of
attempts required to achieve a passing score of 82 or higher. No significant differences were
observed The expository group scored higher on the narrative simulation lesson compared to

71
the NS, which was found to be a statistically significant difference. The chi-square test
yielded no statistically significant difference.
Based on the above results, we may accept hypothesis #3 based on a statistically
significant higher mean score on the narrative simulation assessment score reported from the
expository sequence group compared to the NS group.
Summary of Data Analysis
After comparing the means of Raw TLX (RTLX) scores across the three instructional
treatments, no statistically significant difference was found for perceived cognitive load
between the expository and NS groups. Additionally, the RTLX from each group’s respective
first attempt was compared and for which no statistically significant difference was reported.
Therefore, hypothesis #1 was rejected.
Tests of the second hypothesis were performed to determine whether a statistically
significant difference existed in instructional efficiency between expository and NS sequence
groups by comparing efficiency index scores along with a t-test to compare these mean
scores and also by performing a one-way ANOVA to test for interactions based on sequence
group by lesson.
The expository sequence group yielded a higher efficiency compared with the
narrative simulation group. A t-test comparing the means from each respective group
revealed a statistically significant difference between the two groups. Additionally, ANOVA
among the efficiency scores for each lesson resulted in statistically significant findings. Post-
hoc results suggested there was a difference between the expository 1 and 2 treatments,
specifically, expository 2 was less efficient that expository 1. The narrative simulation
efficiency mean score was found not to differ statistically from the two expository scores.
72
Therefore, Hypothesis #2 was accepted, although the observed result differed from that
which was anticipated.
The third hypothesis tested on whether significant differences exists between NS and
Expository treatment groups regarding other argued measures of efficiency; initial test score
and number of attempts required to pass the test. There was an observed statistically
significant difference between sequence groups on the narrative simulation performance
score where the expository group scored higher on the Narrative Simulation lesson than the
NS sequence group.
Chi Square testing of independence between sequence groups relative to the number
of attempts necessary to pass the content assessments resulted in no observed statistically
significant differences. Therefore Hypothesis #3 was accepted.

73
CHAPTER FIVE: DISCUSSION AND CONCLUSIONS
In myriad instructional contexts, but especially within online learning, instructors
spend so much time developing and deploying instructional materials upon which students so
greatly depend and utilize, it is helpful to understand which instructional methods may yield
the greatest learning outcomes while considering the need to reduce workload. This concept
applies not only to the time it takes to develop such resources, but also to the mental
workload students must expend to achieve positive outcomes.
Many effective instructional methods are timeless and extensible. They transcend
technology and delivery. Students make meaning in various ways as they learn, and
especially so through the use and creation of narrative. Stories are familiar and adaptable. We
use them to provide context and purpose to subject matter.
The theoretical framework for this study was guided by the concepts of Cognitive
Load Theory (CLT) and the efficiency of instructional conditions. CLT considers an
understanding of human cognitive architecture within the context of learning. Instructional
design in adherence to CLT tenets seeks to greatly minimize extraneous cognitive load.
Effective instructional design applies evidence-based practices which attempt to improve
learning outcomes by achieving the following objectives:
1. Mitigate the impact of intrinsic cognitive load, often attributed to the inherent
difficulty of the content to be learned.
2. Support an increased but tolerable germane cognitive load, a phenomenon related
to the creation of knowledge schemata, which equates to learning and greater
cognitive processing.

74
Measuring the efficiency of various instructional conditions allows us to compare
various instructional elements via an index. Instructional Efficiency is a phenomenon where
individual performance exceeds the perceived workload required to achieve that
performance. Additionally, while the concepts and implications of interactivity can be
formidable and complex, the literature suggests proper implementation of interactive features
of online and electronic learning will support the tenets of CLT.
Within an online instructional context, narratives can be readily incorporated with
interactive features. The very nature of story itself can be considered a form of interactive
simulation. The human mind can consider a story’s elements and make hypothetical
decisions, judgment values, or infer a proper course of action based on the material facts
presented in that story. The power of simulation inside of narrative lies with the reflection
and internal mental processes enacted by the learner and how these are applied to the lessons
to be learned.
If learning is defined as the acquisition of knowledge, skills, or changes in attitudes or
behavior, then narrative simulation is a safety zone in which ideas, attitudes, actions, or
decisions can be considered without threat of negative consequence. The process of
reflecting upon what learners know and relating those elements to new information and
concepts is what sets narrative simulation apart as a distinct and purposeful instructional
method.
Therefore, the purpose of this study was to determine whether there was a significant
difference in the efficiency among distance education participants who engaged in a self-
paced narrative simulation module versus those who participated in a traditional online
distance educational lesson.

75
Discussion of Hypotheses
The following discussion is based on the three hypotheses for this study.
Comparison of Raw TLX (RTLX) Results
Hypothesis #1 states that there will be significant difference in the perceived cognitive
load on assessments in an online open distance education course when comparing learners
using NS interactivity compared with a traditional digital expository instructional
intervention. Two sequence groups received the NASA Task Load Index (TLX), a subjective
scaled assessment of the perceived mental workload of a given task or condition (Figure 5.1).
Participants received the TLX after each of the three lessons.
Figure 5.1 NASA Task Load Index as it appears in the Digital Drivers License
A mean was computed from five of the six TLX subscales (omitting the physical
demand subscale) to form the Raw TLX (RTLX). Mean comparisons were performed to
determine whether statistically significant differences existed in any of the lessons between
sequence groups. Additionally, a RTLX mean comparison was performed between each
group’s respective first attempted assessment; the expository group received Expository One

76
first. The Narrative Simulation (NS) group’s first lesson was the Narrative Simulation.
Statistical analysis indicated that while there was no observed statistical significance in
RTLX score between cognitive load scores on individual lessons, there was an observed
statistical difference when comparing each group’s first ProveIt! (test) attempt.
Comparison of First Attempts
The comparison result of each sequence group’s first attempt suggested that
Expository One is less mentally demanding than Narrative Simulation lesson as the first
lesson participants received. This stands to reason, as the simulation lesson is more complex;
there are more elements to consider, and the character Wilhelmina is introduced here along
with the backstory of her struggle to overcome reading difficulties. Moreover, participants
considered nontrivial questions related to addressing Wilhelmina’s challenges and reflect
upon the potential choices before responding. After participants provided a response,
appropriate courses of action are revealed. Additionally, the ProveIt! in the narrative
simulation lesson is longer, comprised of all eleven questions whereas Expository One
contains a subset of five of the eleven questions.
RTLX Comparison of All Lessons
It is encouraging that there were no statistically significant differences in the
perceived cognitive load within the lessons themselves: Expository Lesson One (Defining
Dyslexia) is arguably a more cohesive and straightforward lesson compared to Expository
Lesson Two (Assessing Reading Difficulties). Comprised of ten slides, a significant amount
of time was devoted to the construction of Expository One. Eight of the ten slides contained
carefully crafted organizing graphics referenced in the text of the lesson on the same screen
(figure 5.2). By comparison, Expository Two contained graphics, but they were all decorative

77
in nature. Additionally, the subject matter in Expository Two, covered identification and
treatment of individuals with reading difficulties and was more complex in nature.
Figure 5.2 Example of complimentary graphic in Expository One
The Narrative Simulation lesson (Address the Student, Not the Disability) used
narrative simulation (NS) as an instructional method, and was thus potentially more time
consuming, and certainly required more steps to complete. As it posed meaningful questions
with appropriate corrective feedback at key points in the story, the lesson potentially
introduced additional extraneous and well as intrinsic cognitive load. Moreover, all eleven

78
ProveIt! questions in the NS lesson were presented at the end, whereas these questions were
divided between Expository Lessons One and Two.
Given these differences in presentation and instructional strategy when comparing
mean scores across both groups for each of the three lessons without regard to sequence,
there were no significant differences observed. This suggests that while sequence may have
some bearing upon instructional outcomes within this context, the lessons themselves
introduced similar cognitive load. Additionally, based upon analysis of cognitive load
variables, selecting either a straightforward instructional method, one that introduces more
complexity, or one that requires a higher interactive exchange may be appropriate depending
on instructional goals and objectives and the value placed upon using story as a vital element
in the instruction relative to the needs of the instructor or students.
Computation of Efficiency Measures and Comparison of Mean Efficiency Scores
Hypothesis #2 states There will be a significant difference in instructional efficiency
in an online open distance education course when comparing the NS interactivity sequence
group and the expository group. This hypothesis was tested in three ways: As with
Hypothesis #1, a mean comparison via t-test was performed on each group’s very first test
attempt. A total comparison of mean efficiency index scores was then conducted along with a
one-way ANOVA to test for any statistically significant differences which existed in these
three lessons.
A similar result was noted as with Hypothesis #1. The expository group’s first
attempt was more efficient than the NS group’s first attempt on an arguably more involved
lesson (Table 5.1). Results of this two-sample t-test was statistically significant.

79
Table 5.1 Efficiency of First Attempt
Sequence Group M SD Expository -0.306 1.193
NS 0.305 0.879
When considering the three efficiency index scores across three dyslexia lessons,
there was much less observed variation among mean index scores (Table 5.2). Moreover,
none of these was statistically significant in relationship to one another.
Table 5.2 Efficiency Index Scores
Lesson M SD Expository 1 -0.015 1.106 Expository 2 0.0001 1.0408 Narrative Simulation -0.0001 1.0422
Because efficiency is computed using z-scores of reported cognitive load and test
score, it centered around zero; performance z-score is subtracted from the reported cognitive
load (RTLX) z-score to arrive at an efficiency index score. Therefore, a negative score
indicates more efficiency and a positive score indicates less efficiency.
Again, while no statistically significant differences were observed, in terms of
interpreting the mean efficiency scores as an index, scores suggest Expository One is the
most efficient lesson, followed by the Narrative Simulation, then Expository Two.
However, the observed differences are slight which therefore suggests within this
context, instructors should select an instructional approach to teaching dyslexia awareness
that meets their own goals and objectives, keeping their learner audience in mind.
One possible reason there were no observed significant differences among the lessons
in terms of efficiency is that prior knowledge derived from the first lesson might have

80
informed participants in subsequent lessons. As there were no reported significant differences
in cognitive load among the lessons, as indicated in Hypothesis #1, a counterbalancing effect
may have mitigated any potential deficit in the transmission of knowledge in subsequent
lessons.
Comparison of Assessment Scores and Number of Attempts to Pass
Hypothesis #3 states significant differences exists between NS and Expository
sequence groups regarding other argued measures of efficiency which are initial test scores
on each of the content assessments and number of attempts required to pass the test. This
was tested by comparing each group’s respective attempted score on the first lesson they
received, comparing each group’s ProveIt! scores related to the three different lessons, and
the number of attempts required to achieve a minimum passing score of 82.
Score comparisons. Mean score comparisons for respective first attempts,
Expository Lesson One, and expository lesson two resulted in no statistically significant
differences. However, in the narrative simulation lesson, a statistically significant difference
was observed in that the expository group achieved a higher score than the NS sequence
group (Table 5.3).
Table 5.3 Narrative Simulation Lesson Performance (ProveIt!) Score
Sequence Group N Mean SD SE Mean Expository 57 82.4 13.8 1.8 NS 55 76.4 13.0 1.8
While hypothesis #3 was accepted, aspects of the implementation were likely to have
influenced the outcome of this test result. The expository sequence group received two
lessons consisting of around sixteen slides as well as all eleven content questions before they
received the narrative simulation lesson. One could conclude prior exposure to the dyslexia

81
content followed by the benefit of a realistic, relevant story resulted in a markedly higher
score. It is also possible that several students who took the narrative simulation lesson first
became preoccupied with the prior activities of the story and simply lost focus or were
distracted.
Number of attempts to pass. Chi square tests of independence were performed to
determine if there was a relationship between sequence group and the number of attempts
required to achieve a passing score. There were no observed statistically significant
differences between the two groups. However, a total of eleven participants in the expository
group did not achieve passing scores compared with two in the NS group. Additionally, as an
observation, Expository Lesson One had a larger first try pass rate than Expository Two or
the Narrative Simulation lesson.
One possible explanation for the above factors could be attributed not only to the design, but
also to the nature of the content. Expository One is more straightforward and the graphics
supporting the lesson are both additive and complimentary. The narrative simulation is
comprised of a series of in-story questions that served as multiple thought activities within
the lesson. It also contained an assessment which had the entire eleven question set, whereas
those eleven questions were divided among Expository One and Two.
There was no statistically significant difference in the number of attempts required to pass a
given lesson. Possible explanations include the following:
1. The features of the NS lesson may have mitigated the supposed increased
workload.
2. A pretraining effect from Expository One may have offset the presumed
additional difficulty of Expository Two.

82
3. Participants might have been accustomed to the DDL interface and content
structure such that little imposition on efficiency was observed.
Participant Feedback
At the end of each module concluding with the NASA Task Load Index, participants
responded to following questions:
1. How would you describe your experience in reviewing this module?
2. Do you have any additional comments?
The majority of responses were positive on each of the three modules (Table 5.4).
Table 5.4 Positive/Negative Participant Feedback Comments Comment Type
Negative Positive Neutral No
Comments Total Group Expository 1 33 11 18 63 NS 1 34 2 19 56 All 2 67 13 37 119
A clear preference for one module versus another was not observed. However, there
were a few useful comment trends among a limited number of participants.
Desire for video. A few participants requested the presence of instructional videos in
place of text.
Information density. Participants mentioned that the modules were “dense”
regarding the amount of text. However, this trend need not be considered negative. One
participant wrote, “The module was information-dense and it will be very helpful when I am
able to move from the written presentation into actual field observation and application.”
Professional relevance. A few comments indicated a desire for these modules to
demonstrate a more direct relationship to practical application in the field, while others
83
expressed the information contained in these modules will be of use. One participant wrote,
“Overall - this module gave a good example of what reading delays and student contexts may
occur during teaching - making the content of this module useful to returning or beginning
teachers. While I still feel the module can benefit from more depth in-context and better
written module assessments; the information is useful and relevant to the classroom.”
Facts lost in the narrative. Multiple comments indicated some of the material facts
upon which the ProveIt! was based on were not readily apparent in the narrative simulation
lesson. One participant remarked, “I was a little frustrated when I couldn't find some of the
information in the case study that was asked for in the assessment. But - overall it was a good
experience.” However, other participants stated the story was beneficial and preferred it over
the expository lessons.
Summary
Based on solicited feedback, most participants responded positively to the design
experience and lesson content. Light trends suggested addition of video content, greater
emphasis on material facts directly related to the ProveIt! (assessment) questions, and clearer
linkages to praxis or field experience would be beneficial if refinements in these lessons were
indicated by other circumstances. No obvious majority preference for expository versus
narrative simulation lesson was observed.
Limitations and Suggestions for Future Research
This study suffered from multiple limitations. Literacy experts at a large research
institution provided the content related to the three lessons in the study. This researcher then
assisted with some of the essential elements of the design process and making suggestions
relative to the pacing, sequencing, and grouping of individuals into their respective sequence

84
groups. These suggestions were implemented by the Digital Drivers License (DDL)
administrator. After the lessons were reviewed by subject matter experts, instructors of
record required their students to complete each of the lessons with a passing score.
Ex post facto design
First, this assessment and analysis was a form of ex post facto design, a methodology
generally bound by unique constraints when compared to quasi-experimental or experimental
design (Salkind, 2010). The DDL administrator provided de-identified data for the purposes
of the research. A unique identifier and session ID were provided as a means of tracking
individual performance and response across the three lessons. Due to system and time
constraints, there was no opportunity to make any changes in the lessons, or add independent
variables based on newly discovered information or needs. Additionally, there was no means
of following up with participants to ask them to finish the lesson or to inquire about other
factors, such as why they dropped out of participation. Furthermore, the results of this study
may well be generalizable to the current population of pre-service teachers, but further study
and the ability to obtain more information and seek participation at other institutions would
be useful in generalizing the result to other populations and situations.
Effect of repetition within a short period
This study did not make an explicit attempt to consider the effect of repeating very
similar lessons within a relatively short time frame. While participants could take these
lessons at their own pace, even waiting many days between lessons, it is unlikely this
occurred in most instances, as the length of each was relatively short in duration, and the
entire module could be completed in under an hour.

85
No observable differences were noted in test scores or measures of mental effort
except in one instance. However, requiring participants to perform only one of the lessons in
a given session, waiting a significant period of time, and then completing another lesson may
have revealed appreciable differences in cognitive load or test performance.
Expository One and Two are Segments
While the content between Expository Lessons One and Two is very similar to the
Narrative Simulation, that content is divided between the two expository lessons where it is
completely contained in the Narrative Simulation. This made direct comparison of treatments
challenging, especially given advanced forms of analysis.
Participants not bound by the sequence assignment
Participants were assigned to a sequence group and given the lessons according to that
sequence assigned from top to bottom. They were then instructed to complete them in that
order. However, the DDL system was not configured to enforce that order (Figure 5.3).
While it is assumed that most, if not all, participants followed the established order and the
feedback comments appear to substantiate this, it is possible some participants followed a
different order.

86
Figure 5.3 Dyslexia toolkit landing page. The participant in this example is assigned to the
Expository Sequence Group.
Implications for future research
This study focused on evaluating two instructional methods applied to interactive
online learning from the perspective of efficiency. There were observed differences relative
to the sequence on the first attempted lesson for each respective group; The expository group
scored higher on their first attempted test than the NS group and they reported less cognitive
load on that first test. However, there were no other significant differences observed and the
structure of Expository One compared to Narrative Simulation may explain those observed
differences. The result suggests that within this instructional environment, performance and
efficiency may not be lockstep. The weight of the perceived cognitive load may not duly

87
impact performance, at least as the perceived mental effort was reported and measured for
this first test attempt. Further study is needed to determine whether a longer test on
Expository One may have influenced the perceived cognitive load or if the design of the
Narrative Simulation mitigated the presumed imposition of extra workload compared to the
other lessons.
Second, NSD was observed among the three different lessons. Repetition of this study
in using narrative simulation within different settings would help to better generalize the
results across different contexts, instructional situations, and considering different learner
characteristics.
Furthermore, isolating the two instructional conditions into a true experimental design
and to also incorporate the imposition of time between consumption of the instructional
content and an assessment might reveal the strengths of narrative simulation over a more
traditional expository treatment.
Summary
This study found no significant differences in the efficiency, test score, perceived
cognitive load, or number of attempts to achieve a passing score when comparing Expository
One and Expository Two. However, statistical difference was observed in the Narrative
Simulation lesson when comparing the Expository and Narrative Simulation groups; The
Expository group scored higher than the NS group. Additionally, significant differences from
each group’s respective first attempt were observed regarding cognitive load and efficiency
on these first attempts. These were possibly related to the design of Expository Lesson One
which was more straightforward than the Narrative Simulation and because Expository
Lesson One contained fewer test questions. Moreover, offering a more straightforward

88
presentation along with a break in content may have provided a pre-training effect that was
beneficial to the Expository group, and may explain an increase in performance
Given the differences in the first attempt on each sequence group and the reported
increase in NS score by the Expository group, future studies that (a) explore the impact of
sequencing, (b) separate narrative simulation lessons into smaller units (chunks), and (c)
conduct narrative simulation studies as true or quasi-experiments, should consider the results
suggested in this study.

89
APPENDIX A
EXPOSITORY LESSON ONE

90

91

92
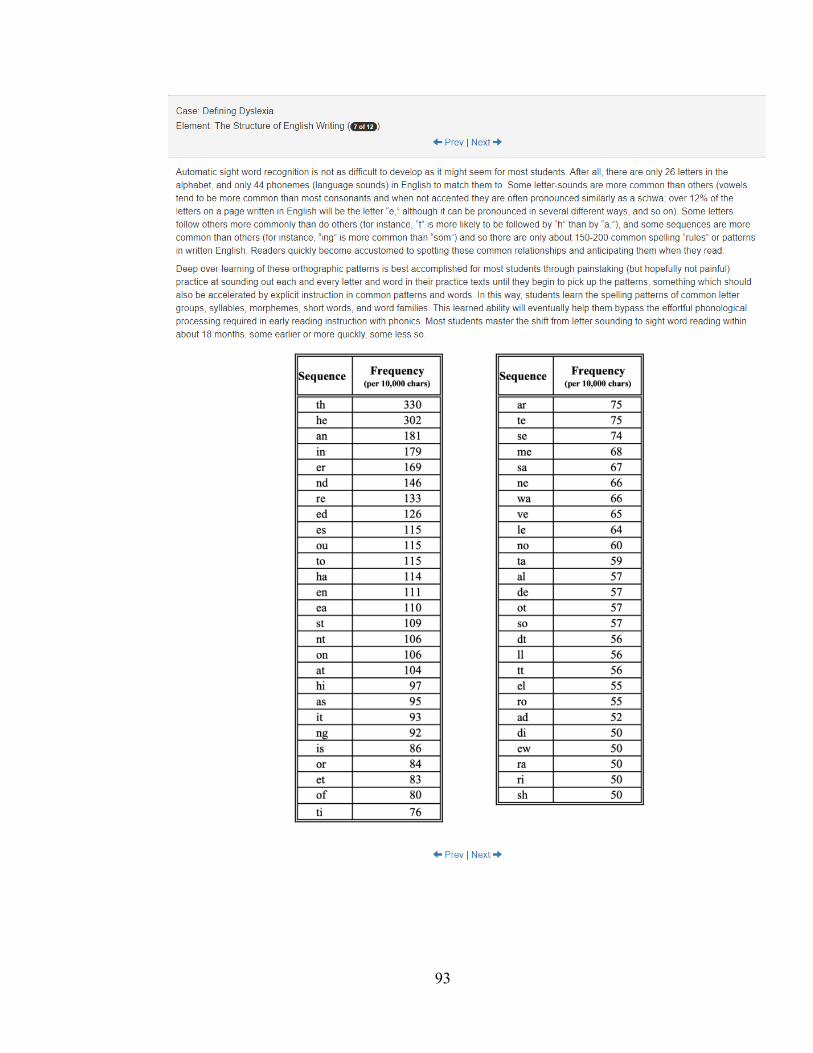
93

94

95

96

97
APPENDIX B
EXPOSITORY ONE CONTENT ASSESSMENT (PROVEIT!)

98
APPENDIX C
EXPOSITORY LESSON TWO

99

100

101

102
APPENDIX D
EXPOSITORY TWO CONTENT ASSESSMENT (PROVEIT!)

103
APPENDIX E
NARRATIVE SIMULATION LESSON

104

105

106

107

108

109

110

111
APPENDIX F
NARRATIVE SIMULATION CONTENT ASSESSMENT

112
APPENDIX G
NASA TASK LOAD INDEX AND EXPERIENCE QUESTIONS AS PRESENTED AFTER
ALL CONTENT ASSESSMENTS

113
APPENDIX H
IRB LETTER OF APPROVAL/EXEMPTION

114
REFERENCES
Admiraal, W., Wubbels, T., & Pilot, A. (1999). College teaching in legal education:
Teaching method, students' time-on-task, and achievement. Research in Higher Education,
40(6), 687-704.
Ahern, S., & Beatty, J. (1979). Pupillary responses during information processing
vary with Scholastic Aptitude Test scores. Science, 205(4412), 1289-1292. Retrieved from
http://science.sciencemag.org/content/205/4412/1289.long
Al-Dahir, S., Bryant, K., Kennedy, K. B., & Robinson, D. S. (2014). Online virtual-
patient cases versus traditional problem-based learning in advanced pharmacy practice
experiences. American Journal of Pharmaceutical Education, 78(4), 1-8.
doi:10.5688/ajpe78476
Ali, M., Han, S. C., Bilal, H. S. M., Lee, S., Kang, M. J. Y., Kang, B. H., . . . Amin,
M. B. (2018). iCBLS: An interactive case-based learning system for medical education.
International Journal of Medical Informatics, 109, 55-69.
doi:10.1016/j.ijmedinf.2017.11.004
Allen, I., Seaman, J., Poulin, R., & Straut, T. (2016). Online report card: Tracking
online education in the United States. Babson Park, MA: Babson Survey Research Group
and Quahog Research Group, LLC.
Ally, M. (2004). Foundations of educational theory for online learning. Theory and
Practice of Online Learning, 2, 15-44.
Anglin, G. J., Vaez, H., & Cunningham, K. L. (2004). Visual representations and
learning: The role of static and animated graphics. In D. H. Jonassen (Ed.), Handbook of

115
Research on Educational Communications and Technology (Vol. 2, pp. 865-916). New
York: Routledge.
Arrowsmith, H. E., Cole, H. P., & Mazur, J. M. (2009). A Spanish language narrative
simulation to prevent horseback riding head injury among rural youth. Health Education
Journal, 68(1), 63-74. doi:10.1177/0017896908100449
Bearman, M., Palermo, C., Allen, L. M., & Williams, B. (2015). Learning empathy
through simulation: A systematic literature review. Simulation in Healthcare, 10(5), 308-319.
doi:10.1097/SIH.0000000000000113
Berge, Z. L. (1998). Barriers to online teaching in post-secondary institutions: Can
policy changes fix it? Online Journal of Distance Learning Administration, 1(2), 2.
Berger, C. R., & Calabrese, R. J. (1975). Some explorations in initial interaction and
beyond: Toward a developmental theory of interpersonal communication. Human
Communication Research, 1(2), 99-112.
Borg, G., Bratfisch, O., & Dorni'c, S. (1971). On the problems of perceived difficulty.
Scandinavian Journal of Psychology, 12(1), 249-260.
Bratfisch, O. (1970). Perceived Difficulty of a Motor-Skill Task as a Function of
Training. Retrieved from https://files.eric.ed.gov/fulltext/ED080554.pdf
Bratfisch, O. (1972a). Experienced Intellectual Activity and Perceived Difficulty of
Intelligence Tests. Retrieved from https://files.eric.ed.gov/fulltext/ED080555.pdf
Bratfisch, O. (1972b). Perceived Item-Difficulty in Three Tests of Intellectual
Performance Capacity. Retrieved from https://files.eric.ed.gov/fulltext/ED080552.pdf
Bruner, J. S. (1966). Toward a theory of instruction (Vol. 59): Harvard University
Press.

116
Bruner, J. S. (1996). The Culture of Education. Cambridge, Massachusetts: Harvard
University Press.
Bucy, E. P. (2004). Interactivity in society: Locating an elusive concept. The
Information Society, 20(5), 373-383. doi:10.1080/01972240490508063
Cain, B. (2007). A review of the mental workload literature. Retrieved from
https://apps.dtic.mil/dtic/tr/fulltext/u2/a474193.pdf
Cao, A., Chintamani, K. K., Pandya, A. K., & Ellis, R. D. (2009). NASA TLX:
Software for assessing subjective mental workload. Behavior Research Methods, 41(1), 113-
117. doi:10.3758/BRM.41.1.113
Carter-Black, J. (2007). Teaching cultural competence: An innovative strategy
grounded in the universality of storytelling as depicted in African and African American
storytelling traditions. Journal of Social Work Education, 43(1), 31-50. doi:Doi
10.5175/Jswe.2007.200400471
Clark, R. E. (1994). Media will never influence learning. Educational Technology
Research and Development, 42(2), 21-29.
Clark, R. E. (2000). Evaluating distance education: Strategies and cautions. Quarterly
Review of Distance Education, 1(1), 3-16.
Clark, R. E. (2001). Media are "mere vehicles". In R. E. Clark (Ed.), Learning from
Media: Arguments, Analysis, and Evidence (Vol. 1). Greenwich Connecticut: IAP.
Cole, H. P. (1997). Stories to Live By. In D. S. Gochman (Ed.), Handbook of Health
Behavior Research IV: Relevance for Professionals and Issues for the Future (pp. 325-349).
Boston, MA: Springer US.
117
Cole, H. P., Kidd, P. S., Isaacs, S. G., Parshall, M., & Scharf, T. (1997). Difficult
decisions: A simulation that illustrates cost effectiveness of farm safety behaviors. Journal of
Agromedicine, 4(1-2), 117-124.
Cooper, G. (1990). Cognitive load theory as an aid for instructional design.
Australasian Journal of Educational Technology, 6(2), 108-113.
Council on Postsecondary Education. (2018). Total Headcount Enrollment by Level
Kentucky Public Institutions. Retrieved from
http://cpe.ky.gov/data/reports/headcountbylevelpublic.pdf
Cowan, N. (2000). The magical number 4 in short-term memory: A reconsideration
of mental storage capacity. Behavioral and Brain Sciences, 24, 87-185.
Davidson-Shivers, G. V. (2009). Frequency and types of instructor interactions in
online instruction. Journal of Interactive Online Learning, 8(1), 23-40.
Delen, E., Liew, J., & Willson, V. (2014). Effects of interactivity and instructional
scaffolding on learning: Self-regulation in online video-based environments. Computers &
Education, 78, 312-320. doi:10.1016/j.compedu.2014.06.018
Deubel, P. (2003). An investigation of behaviorist and cognitive approaches to
instructional multimedia design. Journal of Educational Multimedia and Hypermedia, 12(1),
63-90.
Domagk, S., Schwartz, R. N., & Plass, J. L. (2010). Interactivity in multimedia
learning: An integrated model. Computers in Human Behavior, 26(5), 1024-1033.
doi:10.1016/j.chb.2010.03.003

118
Doty, D. E., Popplewell, S. R., & Byers, G. O. (2001). Interactive CD-ROM
storybooks and young readers’ reading comprehension. Journal of Research on Computing in
Education, 33(4), 374-384.
Gal-Ezer, J., & Lupo, D. (2002). Integrating internet tools into traditional CS distance
education: Students' attitudes. Computers & Education, 38(4), 319-329. doi:Pii S0360-
1315(01)00065-3
Gallien, T., & Oomen-Early, J. (2008). Personalized versus collective instructor
feedback in the online courseroom: Does type of feedback affect student satisfaction,
academic performance and perceived connectedness with the instructor? International
Journal on E-learning, 7(3), 463-476.
Garrett, J. J. (2010). Elements of User Experience: User-Centered Design for the Web
and Beyond. Berkeley, CA: New Riders Education.
Gilbert, L., & Moore, D. R. (1998). Building interactivity into web courses: Tools for
social and instructional interaction. Educational Technology, 38(3), 29-35.
Goetz, W. C. (2013). The use of a narrative simulation in rural residential fire
prevention: A preliminary study of changes in behavioral intention. [Doctoral Dissertation,
University of Kentucky]. Retrieved from https://uknowledge.uky.edu/edc_etds/5/
Goolkasian, P. (1996). Getting started with multimedia. Behavior Research Methods,
28(2), 279-281. doi:Doi 10.3758/Bf03204781D
Gordon, R. M. (1986). Folk psychology as simulation. Mind & Language, 1(2), 158-
171.
Hart, S. G. (2006a). NASA-task load index (NASA-TLX): 20 years later. Paper
presented at the Proceedings of the Human Factors and Ergonomics Society Annual Meeting.

119
Hart, S. G., & Staveland, L. E. (1988). Development of NASA-TLX (Task Load
Index): Results of empirical and theoretical research. Advances in Psychology, 52, 139-183.
Heldal, I., Backlund, P., Johannesson, M., Lebram, M., & Lundberg, L. (2017).
Connecting the links: Narratives, simulations and serious games in prehospital training.
Studies in Health Technology & Informatics, 235, 343-347. doi:10.3233/978-1-61499-753-5-
343
Hemphill, H. (2001). Instructional syntax analysis: Beyond CBT. TechTrends:
Linking Research & Practice to Improve Learning, 45(1), 35-35. doi:10.1007/BF02763376
Hill, S. G., Iavecchia, H. P., Byers, J. C., Bittner Jr, A. C., Zaklade, A. L., & Christ,
R. E. (1992). Comparison of four subjective workload rating scales. Human factors, 34(4),
429-439.
Ho, L.-A., & Kuo, T.-H. (2010). How can one amplify the effect of e-learning? An
examination of high-tech employees’ computer attitude and flow experience. Computers in
Human Behavior, 26(1), 23-31.
Hodges, C. B., & Forrest Cowan, S. (2012). Preservice teachers’ views of instructor
presence in online courses. Journal of Digital Learning in Teacher Education, 28(4), 139-
145.
Hutto, D. D. (1997). The story of the self: The narrative basis of self-development: na.
Ijsselsteijn, W., van Baren, J., & van Lanen, F. (2003). Staying in touch: Social
presence and connectedness through synchronous and asynchronous communication media.
Human-Computer Interaction: Theory and Practice (Part II), 2(924), e928.

120
Jain, R. C., Hicks, T. R., Bailey, A. A., McKinley, R. B., Kuramura, D. Y., &
Katkere, A. L. (2000). Multi-perspective viewer for content-based interactivity. In: Google
Patents.
James, W. (1916). Talks to Teachers on Psychology; and to Students on Some of
Life's Ideals: Holt.
Johnson, S. D., & Aragon, S. R. (2003). An instructional strategy framework for
online learning environments. New Directions for Adult and Continuing Education,
2003(100), 31-43.
Johnston, V. (2019). Dyslexia: What Reading Teachers Need to Know. The Reading
Teacher, 73(3), 339-346.
Joinson, A. N. (2001). Self-disclosure in computer-mediated communication: The
role of self-awareness and visual anonymity. European Journal of Social Psychology, 31(2),
177-192. doi:DOI 10.1002/ejsp.36
Jung, I., Choi, S., Lim, C., & Leem, J. (2002). Effects of different types of interaction
on learning achievement, satisfaction and participation in web-based instruction. Innovations
in Education and Teaching International, 39(2), 153-162. doi:10.1080/13558000210121399
Keegan, D. (1996). Foundations of distance education: Psychology Press.
Kentucky Department of Education. (2019). Dyslexia Toolkit. Retrieved from
https://education.ky.gov/curriculum/standards/teachtools/Pages/dyslexiatoolkit.aspx
Kentucky Ready to Read Act 2018 (April 2, 2018). Retrieved from Kentucky Ready
to Read Act, Kentucky HB 187 (2018)
Kim, K.-J., & Bonk, C. J. (2006). The future of online teaching and learning in higher
education. Educause Quarterly, 29(4), 22-30.

121
Kimelfeld, Y. M., & Watt, J. H. (2001). The pragmatic value of on-line transactional
advertising: A predictor of purchase intention. Journal of Marketing Communications, 7(3),
137-157.
Kiousis, S. (2002). Interactivity: a concept explication. New Media & Society, 4(3),
355-383. doi:Doi 10.1177/146144402320564392
Kirkman, B. L., Rosen, B., Gibson, C. B., Tesluk, P. E., & McPherson, S. O. (2002).
Five challenges to virtual team success: Lessons from Sabre, Inc. The Academy of
Management Executive, 16(3), 67-79. doi:Doi 10.5465/Ame.2002.8540322
Ko, S., & Rossen, S. (2010). Teaching Online: A Practical Guide. New York:
Routledge.
Kozma, R. B. (1991). Learning with media. Review of Educational Research, 61(2),
179-211.
Krug, K. S., Dickson, K. W., Lessiter, J. A., & Vassar, J. S. (2016). Faculty Attitudes
for Changing a University’s Core and Structure. International Journal of Higher Education,
5(2), 63.
Larreamendy-Joerns, J., & Leinhardt, G. (2006). Going the distance with online
education. Review of Educational Research, 76(4), 567-605. doi:Doi
10.3102/00346543076004567
Lee, S., Lee, J., Liu, X., Bonk, C. J., & Magjuka, R. J. (2009). A Review of Case-
based Learning Practices in an Online MBA Program: A Program-level Case Study.
Educational Technology & Society, 12(3), 178-190. Retrieved from
https://www.researchgate.net/publication/220374661_A_Review_of_Case-
based_Learning_Practices_in_an_Online_MBA_Program_A_Program-level_Case_Study

122
Leppink, J., & Pérez-Fuster, P. (2019). Mental effort, workload, time on task, and
certainty: beyond linear models. Educational Psychology Review, 1-18.
Lindstrom, J. H. (2019). Dyslexia in the schools: Assessment and identification.
TEACHING Exceptional Children, 51(3), 189-200.
Lloyd, S. A., Byrne, M. M., & McCoy, T. S. (2012). Faculty-perceived barriers of
online education. Journal of Online Learning and Teaching, 8(1).
Maloney, E. (2007). What Web 2.0 can teach us about learning. Chronicle of Higher
Education, 53(18), B26.
Mayer, R. E. (2002). Multimedia learning. Psychology of Learning and Motivation,
41, 85-139.
Mayer, R. E., & Chandler, P. (2001). When learning is just a click away: Does simple
user interaction foster deeper understanding of multimedia messages? Journal of Educational
Psychology, 93(2), 390.
Mayo Clinic. (2019). Dyslexia. Retrieved from https://www.mayoclinic.org/diseases-
conditions/dyslexia/symptoms-causes/syc-20353552
McCrary, N., & Mazur, J. M. February 10-14, 1999. Evaluating Narrative Simulation
as Instructional Design for Potential to Impact Bias and Discrimination. Research/Report,
Speeches/Meeting Papers. Retrieved from https://files.eric.ed.gov/fulltext/ED436147.pdf
McKenzie, B. K., Mims, N., Bennett, E., & Waugh, M. (2000). Needs, concerns and
practices of online instructors. Online Journal of Distance Learning Administration, 3(3).
McMillan, S. J., & Hwang, J.-S. (2002). Measures of Perceived Interactivity: An
Exploration of the Role of Direction of Communication, User Control, and Time in Shaping

123
Perceptions of Interactivity. Journal of Advertising, 31(3), 29-42.
doi:10.1080/00913367.2002.10673674
Miller, G. A. (1956). The magical number seven, plus or minus two: Some limits on
our capacity for processing information. Psychological Review, 63(2), 81.
Mollen, A., & Wilson, H. (2010). Engagement, telepresence and interactivity in
online consumer experience: Reconciling scholastic and managerial perspectives. Journal of
Business Research, 63(9), 919-925. doi:10.1016/j.jbusres.2009.05.014
Moreno, R., & Mayer, R. (2007). Interactive Multimodal Learning Environments.
Educational Psychology Review, 19(3), 309-326. doi:10.1007/s10648-007-9047-2
Morreale, S. P., Osborn, M. M., & Pearson, J. C. (2000). Why communication is
important: A rationale for the centrality of the study of communication. Journal of the
Association for Communication Administration(1), 1-25.
Morrison, G. R. (1994). The media effects question: “Unresolvable” or asking the
right question. Educational Technology Research and Development, 42(2), 41-44.
National Aeronautics and Space Administration. (2019). NASA TLX Task Load
Index. Retrieved from https://humansystems.arc.nasa.gov/groups/TLX/
National Center for Improving Literacy. (2020). South Carolina State Education
Agency (SEA) Dyslexia Legislation. Retrieved from https://improvingliteracy.org/state-of-
dyslexia/south-carolina
Noonoo, S. (2014). Digital citizenship for the real world: The digital driver's license
is helping students prove that they're ready to navigate the hazards of the Internet. The
Journal (Technological Horizons In Education), 41(4), 17. Retrieved from
https://thejournal.com/articles/2014/05/07/digital-citizenship-in-the-real-world.aspx

124
Oxford, O. E. (2009). Oxford English Dictionary: Oxford: Oxford University Press.
Paas, F., Tuovinen, J. E., Tabbers, H., & Van Gerven, P. W. (2003). Cognitive load
measurement as a means to advance cognitive load theory. Educational Psychologist, 38(1),
63-71. doi:Doi 10.1207/S15326985ep3801_8
Paas, F., & Van Merriënboer, J. (1993). The efficiency of instructional conditions: An
approach to combine mental effort and performance measures. Human Factors: The Journal
of the Human Factors and Ergonomics Society, 35(4), 737-743. Retrieved from
https://www.researchgate.net/publication/258138558_The_Efficiency_of_Instructional_Cond
itions_An_Approach_to_Combine_Mental_Effort_and_Performance_Measures
Parasuraman, R., Sheridan, T. B., & Wickens, C. D. (2000). A model for types and
levels of human interaction with automation. IEEE Transactions on Systems, Man, and
Cybernetics-Part A: Systems and Humans, 30(3), 286-297. Retrieved from
https://www.ncbi.nlm.nih.gov/pubmed/11760769
Park, M. J. (2017). The Effect of Haptic Interaction and Learner Control on Student
Performance in an Online Distance Education Course [Doctoral Dissertation]. University of
Kentucky). Retrieved from
https://uknowledge.uky.edu/cgi/viewcontent.cgi?article=1023&context=edc_etds
Perlin, K., & Goldberg, A. (1996). Improv: A system for scripting interactive actors
in virtual worlds. Paper presented at the Proceedings of the 23rd Annual Conference on
Computer Graphics and Interactive Techniques.
Plucker, J. (2007). Edward L. Thorndike. Retrieved from
http://www.indiana.edu/~intell/ethorndike.shtml
125
Reid, G. B., Eggemeier, F. T., & Nygren, T. E. (1982). An individual differences
approach to SWAT scale development. Paper presented at the Proceedings of the Human
Factors Society Annual Meeting.
Reid, G. B., & Nygren, T. E. (1988). The subjective workload assessment technique:
A scaling procedure for measuring mental workload. Advances in Psychology, 52, 185-218.
Ribble, M. (2015). Digital citizenship in schools: Nine elements all students should
know: International Society for Technology in Education.
Rovai, A. P. (2003). In search of higher persistence rates in distance education online
programs. The Internet and Higher Education, 6(1), 1-16. doi:https://doi.org/10.1016/S1096-
7516(02)00158-6
Salajan, F. D., Schönwetter, D. J., & Cleghorn, B. M. (2010). Student and faculty
inter-generational digital divide: Fact or fiction? Computers & Education, 55(3), 1393-1403.
doi:10.1016/j.compedu.2010.06.017
Salkind, N., Sage Publications, & Sage eReference. (2010). Encyclopedia of research
design. Los Angeles, [Calif.] ; London: SAGE.
Sarbin, T. R. (1986). The narrative as a root metaphor for psychology.
Schick, J. B. (2000). Building a Better "Mouse" Trap: Schick's Taxonomy of
Interactivity. History Computer Review, 16(1), 15-15.
Schneider, M. (2015). The Use of a Digital Game-based Safety Program for All-
terrain Vehicles: Operational Knowledge for Youthful Riders. [Doctoral Dissertation,
University of Kentucky Retrieved from https://uknowledge.uky.edu/edc_etds/11/

126
Schwier, R. A. (1992). A Taxonomy of Interaction for Instructional Multimedia.
Paper presented at the Annual Conference of the Association for Media and Technology,
Vancouver, British Columbia.
Sheridan, T. B., & Simpson, R. (1979). Toward the Definition and Measurement of
the Mental Workload of Transport Pilots. Retrieved from
https://www.researchgate.net/publication/279839014_Toward_the_definition_and_measurem
ent_of_the_mental_workload_of_transport_pilots
Siau, K., Sheng, H., & Nah, F.-H. (2006). Use of a classroom response system to
enhance classroom interactivity. IEEE Transactions on Education, 49(3), 398-403.
doi:10.1109/Te.2006.879802
Sims, R. (2003). Promises of interactivity: Aligning learner perceptions and
expectations with strategies for flexible and online learning. Distance Education, 24(1), 87-
103.
Snowling, M. J. (2013). Early identification and interventions for dyslexia: a
contemporary view. Journal of Research in Special Educational Needs, 13(1), 7-14.
Song, L., Singleton, E. S., Hill, J. R., & Koh, M. H. (2004). Improving online
learning: Student perceptions of useful and challenging characteristics. The Internet and
Higher Education, 7(1), 59-70.
Spector, J. M. (2005). Time demands in online instruction. Distance Education,
26(1), 5-27.
Sundar, S. S. (2012). Social psychology of interactivity in human-website interaction.
In Oxford handbook of internet psychology. Oxford University Press, 2012.

127
Sundar, S. S. (2008). Self as source: Agency and customization in interactive media:
na.
Sundar, S. S., Xu, Q., & Bellur, S. (2010). Designing Interactivity in Media
Interfaces: A Communications Perspective. Paper presented at the Proceedings of the
SIGCHI Conference on Human Factors in Computing Systems.
Swan, G., & Park, M. (2015). Get your students on the road to digital citizenship with
a digital driver’s license. In: ISTE. Retrieved from https://www.iste.
org/explore/articleDetail.
Swartjes, I. (2007). Using narrative cases to author interactive story content. Paper
presented at the International Conference on Entertainment Computing.
Sweller, J. (1988). Cognitive Load During Problem Solving: Effects on Learning.
Cognitive science, 12(2), 257-285. doi:10.1207/s15516709cog1202_4
Sweller, J. (2010). Element interactivity and intrinsic, extraneous, and germane
cognitive load. Educational Psychology Review, 22(2), 123-138. doi:10.1007/s10648-010-
9128-5
Sweller, J., Ayres, P., & Kalyuga, S. (2011). Cognitive Load Theory: Springer New
York.
Szurmak, J., & Thuna, M. (2013). Tell me a story: The use of narrative as a tool for
instruction. Paper presented at the Imagine, innovate, inspire: The proceedings of the ACRL
2013 conference.
Tein, J.-Y. (1989). The Subjective Workload Assessment Technique (SWAT): An
application and evaluation. [Doctoral Dissertation, The Ohio State University]. Columbus,

128
Ohio. Retrieved from
https://etd.ohiolink.edu/!etd.send_file?accession=osu1487670346876945&disposition=inline
The Lane Report. (2018). Dyslexia intervention bills move to House floor. The Lane
Report. Retrieved from https://www.lanereport.com/87401/2018/02/dyslexia-intervention-
bills-move-to-house-floor/
Tunmer, W., & Greaney, K. (2010). Defining dyslexia. Journal of learning
Disabilities, 43(3), 229-243.
Van der Kleij, F. M., Feskens, R. C., & Eggen, T. J. (2015). Effects of feedback in a
computer-based learning environment on students’ learning outcomes: A meta-analysis.
Review of Educational Research, 85(4), 475-511.
Van Gog, T., & Paas, F. (2008). Instructional efficiency: Revisiting the original
construct in educational research. Educational Psychologist, 43(1), 16-26.
Vicker, B. (2010). Communicative functions or purposes of communication.
Virginia Department of Education. (2020). Dyslexia. Retrieved from
http://www.doe.virginia.gov/special_ed/disabilities/learning_disability/dyslexia.shtml
Ward-Lonergan, J. M., & Duthie, J. K. (2018). The state of dyslexia: Recent
legislation and guidelines for serving school-age children and adolescents with dyslexia.
Language, Speech, and Hearing Services in Schools, 49(4), 810-816.
Watson, W., & Watson, S. L. (2007). An argument for clarity: What are learning
management systems, what are they not, and what should they become.
Wellman, G. S., & Marcinkiewicz, H. (2004). Online learning and time-on-task:
Impact of proctored vs. un-proctored testing. Journal of Asynchronous Learning Networks,
8(4), 93-104.

129
Wiggins, G. (2012). Seven keys to effective feedback. Feedback, 70(1).
Worley, W. L., & Tesdell, L. S. (2009). Instructor time and effort in online and face-
to-face teaching: Lessons learned. IEEE Transactions on Professional Communication,
52(2), 138-151.
Zou, X. P. (2012). Mapping team mental models with narrative simulations. (72).
Retrieved from
http://search.ebscohost.com/login.aspx?direct=true&AuthType=ip,sso&db=psyh&AN=2012-
99060-289&site=ehost-live&scope=site&custid=s8356098 Available from EBSCOhost psyh
database.

130
VITA
Christopher S. Daniel
EDUCATION
Eastern Kentucky University. Richmond, Kentucky. August 2008 Master of Public Administration Eastern Kentucky University. Richmond, Kentucky. May 1997 Bachelor of Arts in Spanish.
PROFESSIONAL EXPERIENCE 4/2014-Present: Office of E-Campus Learning. Eastern Kentucky University. Instructional Designer
4/2014-Present Freelance Instructional Designer/Technologist/Trainer Current Clients: Nationally Recognized Legal Education Services Provider Local Private Child Psychology Services Provider Eastern Kentucky University
1/2008-4/2014: Eastern Kentucky University Training and Professional Development Manager, Advanced Blackboard Support 2008-2009: Eastern Kentucky University, Continuing Education Department Computer Applications Instructor 4/2003 – 12/2007: Eastern Kentucky University, Richmond, Kentucky Desktop Support Supervisor
SELECT AWARDS/RECOGNITION 7/29/2020: Blackboard Inc. Catalyst Award with EKU Psychiatric Mental Health Nurse Practitioner Program. Recognizes those who have adopted flexible, distance and online delivery, including using mobile technologies to positively impact the educational experience. 07/25/2019: Blackboard Inc. Austin, TX. Catalyst Award with EKU Family Nurse Practitioner Program. Recognizes those who have adopted flexible, distance and

131
online delivery, including using mobile technologies to positively impact the educational experience. 5/2008: Janet W. Patton Award: Graduate Student of the Year. Eastern Kentucky University. Richmond, Kentucky. Recognizes one graduate student annually for outstanding scholarship in public administration and contributions to the graduate program.
SELECT PUBLICATIONS
Sweet, C., Blythe, H., Philips, B., & Daniel C. (2014) Achieving Excellence in Teaching: A Self-help Guide. New Forums Press. Stillwater, Oklahoma. ISBN: 1-58107-259-9. Violette, J. L., Daniel, C. S., Meiners, E. B., & Fairchild, J. L. (2013). Going Out on a Limb: The Implementation of the L.E.A.F. Model of Teaching and Learning. In R. Carpenter (Ed.), Cases on Higher Education Spaces: Innovation, Collaboration, and Technology (pp. 186-205). Hershey, PA: Information Science Reference. doi:10.4018/978-1-4666-2673-7.ch010.