Assessing land resources status and trends, effects ... · PDF fileAssessing land resources...
25
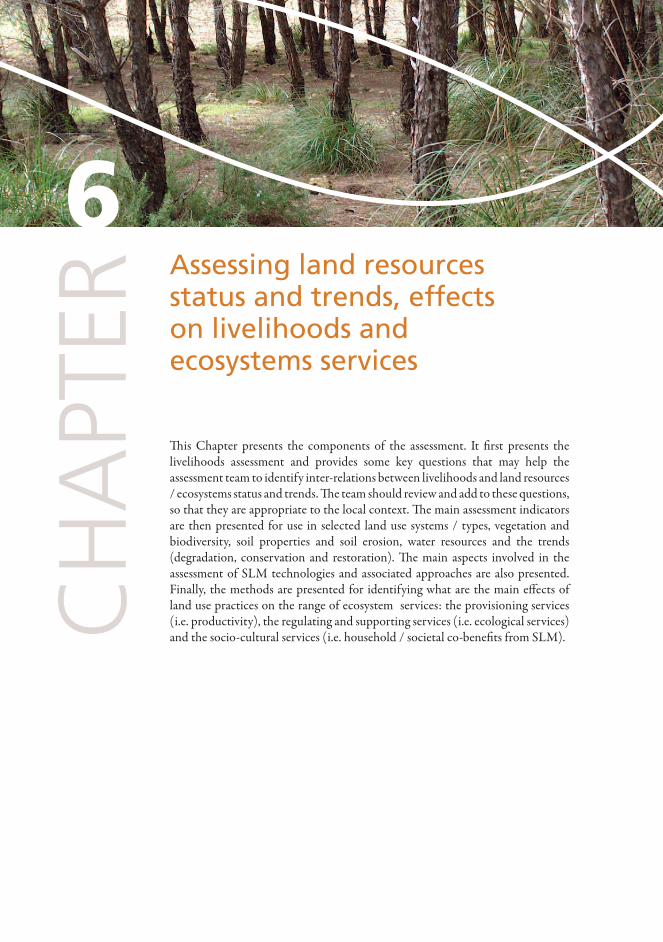
Assessing land resources status and trends, effects on livelihoods and ecosystems services CHAPTER 6 is Chapter presents the components of the assessment. It first presents the livelihoods assessment and provides some key questions that may help the assessment team to identify inter-relations between livelihoods and land resources / ecosystems status and trends. e team should review and add to these questions, so that they are appropriate to the local context. e main assessment indicators are then presented for use in selected land use systems / types, vegetation and biodiversity, soil properties and soil erosion, water resources and the trends (degradation, conservation and restoration). e main aspects involved in the assessment of SLM technologies and associated approaches are also presented. Finally, the methods are presented for identifying what are the main effects of land use practices on the range of ecosystem services: the provisioning services (i.e. productivity), the regulating and supporting services (i.e. ecological services) and the socio-cultural services (i.e. household / societal co-benefits from SLM).
Transcript of Assessing land resources status and trends, effects ... · PDF fileAssessing land resources...
Assessing land resources status and trends, effects on livelihoods and ecosystems services
CH
APT
ER6
This Chapter presents the components of the assessment. It first presents the livelihoods assessment and provides some key questions that may help the assessment team to identify inter-relations between livelihoods and land resources / ecosystems status and trends. The team should review and add to these questions, so that they are appropriate to the local context. The main assessment indicators are then presented for use in selected land use systems / types, vegetation and biodiversity, soil properties and soil erosion, water resources and the trends (degradation, conservation and restoration). The main aspects involved in the assessment of SLM technologies and associated approaches are also presented. Finally, the methods are presented for identifying what are the main effects of land use practices on the range of ecosystem services: the provisioning services (i.e. productivity), the regulating and supporting services (i.e. ecological services) and the socio-cultural services (i.e. household / societal co-benefits from SLM).

MANuAL fOR LOCAL LEvEL ASSESSMENT Of LAND DEGRADATION AND SuSTAINAbLE LAND MANAGEMENTPART 1 – Planning and methodological approach, analysis and reporting
52 LAND DEGRADATION ASSESSMENT IN DRYLANDS (LADA) PROJECT
The above photo shows a study area in Cuba in which very degraded areas (hotspots) are juxtaposed with areas that appear to be under sustainable land management (bright spots).
These are under different land use systems, so they are difficult to usefully compare except by discussing them with land users and understanding the difference in the drivers and pressures that lead to LD or SLM (tenure, population, pressure, governance etc)
6.1 Assessing effects of land degradation / management on livelihoods and socio-cultural services
The land users’ capacity and interest to practice sustainable resources management and minimise degradation of natural resources and ecosystems depends on many considerations including their assets base and rights over resources, education and know-how, relative wealth, access to services, as well as the enabling policy and legal environment. The assets base of different household categories can be shown on a pentagon diagram See Figure 2 and Figures 18 and 19.
Particularly with poor land-users in marginal areas (common in the drylands), it is the factors relating to resource and market access, supporting institutions and the characteristics of poverty itself that influence the perspective land-users (male and female) have on their land resources and their capacities to practice sustainable land management. Some assets that open up opportunities for people are: credit, education and labour, secure land tenure, rights to use natural resources (e.g. harvesting fuel wood) and road access to market. Access to assets is important; but also important is the ability to use the assets productively and sustainably, which depend on the vulnerability and institutional context.
Land-users create many of the pressures on the land resources (that affect the condition or state) and they also suffer the consequences of the impacts on productive, ecological and socio-
PHOTO 13 comparison of hot and ‘bright’ spots (cuba, guantánamo)
PHOTO 14 Land user in esquel, Patagonia, Argentina
53LAND DEGRADATION ASSESSMENT IN DRYLANDS (LADA) PROJECT
ChAPTER 6 Assessing land resources status and trends, effects on livelihoods and ecosystems services
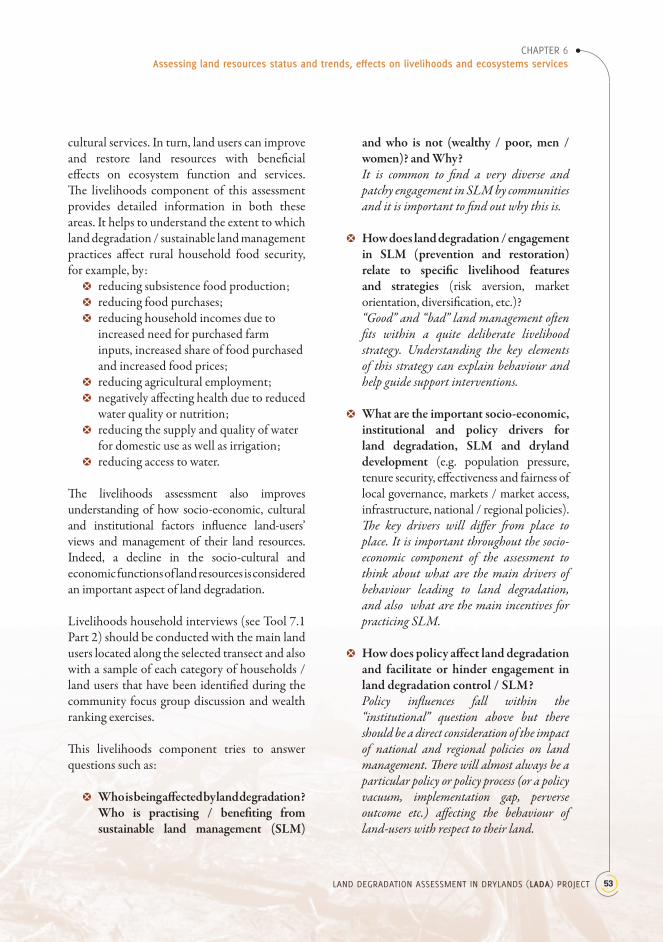
cultural services. In turn, land users can improve and restore land resources with beneficial effects on ecosystem function and services. The livelihoods component of this assessment provides detailed information in both these areas. It helps to understand the extent to which land degradation / sustainable land management practices affect rural household food security, for example, by:
p reducing subsistence food production; p reducing food purchases; p reducing household incomes due to
increased need for purchased farm inputs, increased share of food purchased and increased food prices;
p reducing agricultural employment; p negatively affecting health due to reduced
water quality or nutrition; p reducing the supply and quality of water
for domestic use as well as irrigation; p reducing access to water.
The livelihoods assessment also improves understanding of how socio-economic, cultural and institutional factors influence land-users’ views and management of their land resources. Indeed, a decline in the socio-cultural and economic functions of land resources is considered an important aspect of land degradation.
Livelihoods household interviews (see Tool 7.1 Part 2) should be conducted with the main land users located along the selected transect and also with a sample of each category of households / land users that have been identified during the community focus group discussion and wealth ranking exercises.
This livelihoods component tries to answer questions such as:
p Whoisbeingaffectedbylanddegradation?Who is practising / benefiting fromsustainable land management (SLM)
and who is not (wealthy / poor, men /women)?andWhy?It is common to find a very diverse and patchy engagement in SLM by communities and it is important to find out why this is.
p Howdoeslanddegradation/engagementin SLM (prevention and restoration)relate to specific livelihood featuresand strategies (risk aversion, market orientation, diversification, etc.)? “Good” and “bad” land management often fits within a quite deliberate livelihood strategy. Understanding the key elements of this strategy can explain behaviour and help guide support interventions.
p Whataretheimportantsocio-economic,institutional and policy drivers forland degradation, SLM and drylanddevelopment (e.g. population pressure, tenure security, effectiveness and fairness of local governance, markets / market access, infrastructure, national / regional policies).The key drivers will differ from place to place. It is important throughout the socio-economic component of the assessment to think about what are the main drivers of behaviour leading to land degradation, and also what are the main incentives for practicing SLM.
p Howdoespolicyaffectlanddegradationand facilitate or hinder engagement inlanddegradationcontrol/SLM?Policy influences fall within the “institutional” question above but there should be a direct consideration of the impact of national and regional policies on land management. There will almost always be a particular policy or policy process (or a policy vacuum, implementation gap, perverse outcome etc.) affecting the behaviour of land-users with respect to their land.
MANuAL fOR LOCAL LEvEL ASSESSMENT Of LAND DEGRADATION AND SuSTAINAbLE LAND MANAGEMENTPART 1 – Planning and methodological approach, analysis and reporting
54 LAND DEGRADATION ASSESSMENT IN DRYLANDS (LADA) PROJECT
p Inadditiontothenaturalresourcesassets,what roles do social (i.e. communityorganisation), financial, human (i.e.capacity, know-how) and physical (i.e.infrastructure) forms of capital (assets)play at the local level in influencingperspectivesonlandanditsmanagement?The livelihoods approach helps to adequately address all these aspects and gives great emphasis to the role of asset access and ownership in influencing land management behaviour.
p Whataretheimportanttrade-offsland-usersmakebetweenthedifferentassetsto which they have access and how dotheseaffectlandmanagement?This question highlights again the importance of understanding the strategy of the land-user. Particular trade-offs frequently form part of adopted land use strategy.
In addition to the community focus group discussions (see Part 2, Tool 1.1 ) and the household livelihoods interviews (Tool 7.1), it is important to conduct a small number of key informant interviews (Tools 5.1 and 5.2). These might be with local government officials (at community, district or regional level), NGO staff, experts from concerned technical services (land, water, agriculture, forestry) or managers of protected areas. Such informants will not only provide useful contextual information but also help verify or explain some of the assessment findings. For example, important links between national activities / policies and LD / SLM might be made by community members and could need to be explored in greater depth. There is also considerable scope for discussion of possible responses to land degradation with local government or project representatives.
Peoples’ livelihoods are determined by their assets base and their strategies and these are
influenced by the vulnerability context and institutional processes. Vulnerability is a dynamic and multi-dimensional process and influences individuals’/households’ assets and strategies and it is also influenced by livelihoods outcomes (food, products, income, well being etc.). Vulnerability is a function of exposure to risk, sensitivity of the socio-ecological system and its adaptive capacity.
Land degradation, deforestation, overexploitation of natural resources and loss of biodiversity will in most cases be aggravated by climate change / increasing weather variability and may impact on:
p livelihoods - through affecting• soil moisture and water supply,
increasing risk of crop failure and animal mortality, food insecurity, loss of income, increasing poverty; and
• long term livelihood strategies - affecting viability and reliability of rainfed agriculture, pastoral systems, produce for markets and trade.
p ecosystem services - through increasing risk of erosion, landslides, flooding, drought, pest and disease outbreaks; and
p
All of these will be in turn affected by policies, regulations and market forces.
The adaptive capacity of land users depends on their livelihoods assets (natural, physical, human, social and financial) and livelihood strategies and it determines the way they will cope with environmental, climatic and market related changes. Adaptation capacity is weakened by poverty, ill-health, recurrent drought or floods, energy shortage and so forth. Alternatively it may be strengthened by, for example, strong organisations, knowledge and education, economic opportunities and supportive policies such as incentive measures for SLM.
55LAND DEGRADATION ASSESSMENT IN DRYLANDS (LADA) PROJECT
ChAPTER 6 Assessing land resources status and trends, effects on livelihoods and ecosystems services
An overall analysis of the findings and understanding that is obtained from the household livelihoods assessment and interviews of key informants should help to:
p understand the behaviour of different land users (constraints, opportunities) and the effects of their management practices (degradation, natural resources conservation) in various land use systems;
p assess the effects of current policies, strategies, legislation, institutions, services and projects; and,
p develop recommendations for enhancing the adoption of SLM practices and reducing land degradation (incentive measures, capacity building and support for uptake of SLM technologies and approaches).
6.2 Assessing vegetation and biodiversity status and trends
Vegetation degradation is an important aspect of land degradation although more attention has been paid in the past to soil and water degradation. Vegetation degradation or improvement needs to be assessed (see Part 2) in:
p Grasslandsandrangelands, which cover a large share of drylands and are largely used for livestock production by agro-pastoralists and pastoralists (Tool 3.2);
p Forestsandwoodlands, which may cover a smaller land area but are vital for the protection of watersheds / watercourses and the provision of wood and diverse non-wood forest products (Tool 3.1); and
p Croplands, where the crops themselves can be assessed as well as the trees, shrubs and herbaceous species that are maintained on the farm, along borders of fields and around homesteads, for various purposes (wood, forage, fertilizer, windbreaks, shade) (Tools 3.3 and 3.4).
In this assessment, a specific protocol is used for assessing and scoring grazing quality and vegetation degradation in grasslands and rangelands (Tool 3.2) as this is crucial for livestock production upon which so many land users in drylands rely.
Detailed assessments of forests and woodlands should also be conducted where particularly important for livelihoods in a given assessment site or study area. As with grasslands, a similar protocol for scoring forest quality and degradation could be developed for forest land, in collaboration with the FAO National forest assessment and monitoring programme (FAO, 2009a & b). However, for cropland this might be more difficult to develop a standard protocol as there is such a huge range of cropping systems.
In croplands, rather than associated natural vegetation, it is soil health, adapted crop species / varieties and effective use of rainwater or irrigation that are the main factors affecting crop productivity. However, the importance of associated vegetation should not be underestimated as it is often vital for household energy, for forage for livestock in mixed crop-livestock systems, for organic matter to replenish soil nutrients and soil organic matter, for windbreaks to reduce damage by wind erosion and for shade for crops, livestock and people.
The timing of the assessment in terms of rainy and dry seasons is very important in drylands as the situation on the ground will appear very different. Comparison between degraded and better managed sites is essential to avoid the tendency to overestimate degradation in the dry season and underestimate in the rainy season. If possible, the team should visit the local assessment area during both rainy and dry seasons to validate findings. It is useful to take photos of the same site in the different seasons. See Box 4.

MANuAL fOR LOCAL LEvEL ASSESSMENT Of LAND DEGRADATION AND SuSTAINAbLE LAND MANAGEMENTPART 1 – Planning and methodological approach, analysis and reporting
56 LAND DEGRADATION ASSESSMENT IN DRYLANDS (LADA) PROJECT
The six most important indicators ofvegetation degradation or improvement incrop,grassandforestlandsare:1. Change in vegetation cover;2. Change in vegetation / landscape structure
and plant community composition;3. Change in habitat and species diversity; 4. Change in abundance of indicator species
(as indicators of high or low pasture quality or poor soil quality and invasive species);
5. Change in vegetation health and biomass, with associated change in animal health and productivity;
6. Extent and effects of vegetation management and its use.
1. Vegetation cover directly affects rainfall infiltration and runoff, thus erosion rates, as well as soil organic matter and nutrient levels, hence will affect productivity, the wider hydrological cycle and the ecosystem’s capacity to cope with climate change especially drought (increased rainfall variability and temperatures).
2. Vegetation/landscapestructureandplantcommunity composition influences water availability, soil productivity and erosion risk. For example:
• A multi-storey agroforestry system with trees, cereals and a cover crop will intercept and make better use of rainwater in the deep soil profile and hence protect the ground from erosion more than a field of cereals;
• Compared to grassland, a wooded savannah provides shade and exploits the deep soil profile for water and nutrients, providing a cooler microclimate;
• Bush encroachment may increase total biomass, but it also reduces grazing productivity and access to water by livestock.
3. Habitat and species biodiversity degradation can be assessed at three levels:• Change in habitatdiversity is evident
from a change in the variety of habitat types in the study area, which may be due to fragmentation of farms, fields and grazing lands, reduced farm size and increased pressure on resources (e.g. through burning, deforestation for fuelwood, etc.). Land use intensification reduces land users’ options to maintain natural vegetation on their farm and in the wider landscape. Implications include loss of wild foods and other useful plants
BOx 4 Seasonality and rainfall inter-annual variability
vegetation growth is dynamic and determined by meteorological factors as well as pedological factors and
topography. A good understanding is required of variation in plant growth and characteristics between
seasons, months and years (through secondary information and key informants).
In arid and semiarid rangelands in particular, vegetation degradation is difficult to assess because of
important seasonal and inter-annual variations in rainfall and in some areas temperature (e.g. at high
altitude), landscape diversity and the problems of sampling very large areas, as well as issues of livestock
mobility.
57LAND DEGRADATION ASSESSMENT IN DRYLANDS (LADA) PROJECT
ChAPTER 6 Assessing land resources status and trends, effects on livelihoods and ecosystems services
(medicines, building materials, fibres etc,) and loss of ecological functions such as pollination and beneficial predation;
• Change in speciesdiversity means a change in the number of species in a given area, i.e. loss of certain key animal, plant or microbial species, and /or a reduction or increase in species numbers. It can be measured at a particular site and time of year, in a particular season in pasture / range / cropland or over a year or several years (e.g. a crop or grazing or forest rotations). The implications of biodiversity loss could include reduced adaptive capacity and increased vulnerability to pests, diseases, drought or other aspects of climate change;
• Change in geneticdiversity means fewer plant varieties or livestock breeds being used in a given area, contributing to reduced adaptive capacity and ecosystem resilience, thus reduced future options, especially in facing climate change.
Particularly in marginal areas, maintaining diversity of genetic resources (the gene pool) plays an important part in traditional livelihood strategies of dryland populations by contributing to the stability of yields of crop or livestock enterprises, adaptation to change, and meeting the multiple needs of local communities for a range of plant and animal-derived food and other products. The number of species used and conserved through traditional farming systems and the diversity within them is usually much greater than is the case in commercial and large-scale crop, grazing and forest / woodland systems. Much of the information on trends in species and genetic diversity and in loss of ecological functions due to reduced pollination or natural pest control can be obtained from the land users and community discussion. Change in habitat diversity can be backed up by maps and satellite images.
4. Plantindicatorspecies can indicate various aspects which relate to land resources quality, notably: • Change in extent and effects of invasive
species - these may be “colonising” species that benefit from the reduced competition that follows habitat degradation or they may be more tolerant of grazing, burning or other (poor) management practices;
• Change in share of nutritious and palatable pasture / browse species or noxious / unpalatable species for livestock;
• Change in weed species i.e. those that reflect declining fertility and soil organic matter (e.g. the parasitic witch weed (Striga spp.) that infects the roots of millet, sorghum, maize and sugar cane in semi-arid Africa);
• Change in useful species (e.g. those that provide fuel wood, thatching grass, medicinal plants, wild foods etc.).
5. Vegetation and animal health andproductivity are interrelated. In cropping and forest systems, vegetation health and productivity are largely determined by soil properties, but can also be assessed through crop / tree measurements and identifying symptoms of crop nutrient deficiencies or damage by pests or diseases. In pasture and rangelands, vegetation quality is the most important component of the land for pastoralists and agro-pastoralists, as it is directly linked to livestock productivity which is their main livelihood activity. After assessing vegetation degradation in pasture and rangelands it is important to look at the effects of this degradation on livestock productivity. It is important to identify any relationships between intensity and type of management practices and the condition (health) of the pasture / rangeland or wood / forest land, as well as its sensitivity / resilience to degradation.
MANuAL fOR LOCAL LEvEL ASSESSMENT Of LAND DEGRADATION AND SuSTAINAbLE LAND MANAGEMENTPART 1 – Planning and methodological approach, analysis and reporting
58 LAND DEGRADATION ASSESSMENT IN DRYLANDS (LADA) PROJECT
6. Vegetation management and use: It is important to assess changes in intensity of use of the vegetation, the management practices being used, their effects on resources and the use of the range of products that are obtained from the land. For example:
Managementpractices• thinning, coppicing of trees, clear felling
in forest / wood land, • management of hedges and maintenance
of trees and vegetated contour bunds or strips in cropland,
• pasture species management, removal of invasive species, thinning of bush in grazing land.
Useofproducts• use of wood, wild fruits and nuts and
medicinal plants from forest/ woodland, • use of wood, non wood forest products,
straw for thatching, etc., from grazing land, • use of wood, organic materials for
fertilizer and mulch, and other wild products from cropland.
Through use of the above indicators, a good understanding of the status and trends in vegetation resources and biodiversity and their effects on productivity can be obtained and supplemented by information from the household and other interviews on livelihood implications and effects on ecosystem services.
6.3 Assessing soil health and soil erosion status and trends
Soil degradation directly affects land productivity (i.e. provisioning services). A good understanding of the condition of the soil (state), the change dynamics (trends) and the degradation / soil restoration processes involved is required.
Sheet, rill and gully erosion by water, the scouring and deposition of soil by wind, the movement of sand dunes and the transport of sediment load in waterways, are all visible symptoms of degradation and tend to be the focus of degradation studies. A rapid assessment of soil erosion - the extent and severity of removal of soil particles by water and by wind – should be conducted to arrive at a soil erosion score and, as required, further measurements can be undertaken to obtain more quantitative data for monitoring (see Part 2, Section 4 ).
However, a number of other degradation processes (e.g. nutrient mining) may well be occurring, which are not directly visible but are very widespread and have direct implications on productivity and livelihoods. Adverse changes in the soil biological, chemical, physical and / or hydrological properties can also increase the vulnerability of the soil to further degradation, including:
p Soil biological degradation – decline in soil organic matter content and the diversity of soil organisms5 negatively affects the beneficial functions of soil (e.g. mineralization, nitrification, nitrogen fixation) and are likely to increase the risk of soil pest damage;
p Soil chemical degradation – increase in soil nutrient imbalances and toxicities, soil acidification, alkalinisation, salinization and pollution;
p Soil physical degradation - surface crusting and soil compaction through raindrop impact, trampling and mechanisation, loss of topsoil structure and organic matter through excess or inappropriate tillage;
5 Assessment of biodiversity of soil organisms is difficult as they are mostly microscopic so this cannot be part of a rapid field assessment methodology. Simple soil visual indicators of macro-fauna are used in this assessment as indicators of soil health (earthworm numbers and evidence of worm or termite castes).

59LAND DEGRADATION ASSESSMENT IN DRYLANDS (LADA) PROJECT
ChAPTER 6 Assessing land resources status and trends, effects on livelihoods and ecosystems services
p Degradation of soil hydrological properties - waterlogging and aridification due to the decline in rainfall infiltration and soil moisture retention;
p Soil pollution- due to contamination by, for example, agro-industries or heavy metals from mining or use of contaminated groundwater.
The VS Fast Soil Visual Assessment (McGarry 2006) used in this manual (see Part 2, Section 4 ) uses a number of key indicators of biological, chemical and physical properties that are either observed (qualitative) or measured (quantitative) and then scored and summed to arrive at an overall soil health score:
SoilObservations• soil cover (protection) • soil colour and soil life (SOM content)• soil texture (erodibility)• soil structure (permeability, root
penetrability and stability) • soil depth (plant rooting depth and
nutrient and water availability)
SoilMeasurements• pH (acidity and alkalinity)• slaking and dispersion (stability)• soil labile carbon content (often backed
up by lab. analysis of total organic C)• salinity and sodicity• nutrient content (N, P, K and micro-
nutrients) (optional lab tests)
The combination of soil observations and measurements provides a good overall picture of soil health (condition) and the scoring facilitates comparisons between degraded and well managed sites, as well as providing a baseline for subsequent monitoring.
In assessing soil degradation / management in croplands, including agroforestry systems, it is
recommended that teams compare sites in the cultivated field with the soil at the field border or a nearby uncultivated area, then compare results with fields under different practices (e.g. no till and conventional tillage, with or without organic matter management). However, the effects on soil nutrient availability and soil fertility will require secondary information from livelihoods survey with land users and from the agricultural services on productivity (yields), crop rotations and organic matter management practices. This may need to be backed up by soil nutrient analyses in the soil laboratory to assess specific nutrient deficiencies.
In forest / woodland, sites in planted and in natural forests can be compared to determine the effects of tree species and management practices on soil health (litter, depth, pH, erosion etc.). In grassland and rangelands, sites with different stocking densities/management practices can be compared with protected areas to ascertain effects, for example, of overgrazing on soil health.
6.4 Assessing water resources status and trends
Land - water linkages are significant in relation to land degradation in drylands. It is important to identify land degradation processes and land management practices that cause changes in the hydrological regime (rainfall infiltration, retention, runoff and flow) and thereby in water availability and quality (see Part 2, Section 6). For example, a reduction in vegetation cover will result in increased runoff, reduced ground water recharge and sedimentation of surface water resources which in turn affects water quality.
In semi-arid and arid areas, land degradation / management impacts on water resources are
MANuAL fOR LOCAL LEvEL ASSESSMENT Of LAND DEGRADATION AND SuSTAINAbLE LAND MANAGEMENTPART 1 – Planning and methodological approach, analysis and reporting
60 LAND DEGRADATION ASSESSMENT IN DRYLANDS (LADA) PROJECT
strongly affected by the variability in rainfall, runoff and water flow, as rainfall is concentrated in a short rainy season and is often characterized by extreme events – long drought periods and intense rains that may cause flooding. Climate change has serious implications in potentially increasing the frequency of extreme events in drylands, resulting in increased soil erosion, runoff and flooding in lowland areas, estuaries and deltas and flash floods in highland areas.
As with vegetation, there are some challenges with assessing water resources due to the large inter-annual and seasonal variations in water availability which can make assessments carried-out at a single point in time less reliable. The timing of the water resources assessment is important as the observations / findings will vary significantly between rainy and dry seasons and secondary information will be needed to understand seasonal variations and effects. This is therefore one of many parts of this assessment where it is important to triangulate direct observations and measurements (Tools 6.2 to 6.6) with secondary data (e.g. from rainfall records and water boards) and with more qualitative information derived from land-user accounts (Tool 6.1). This triangulation will help the team to build up a reliable picture of water resource status and trends, which can be further supplemented by drawing on additional secondary information from agriculture and health authorities.
Scale is also a key parameter in detecting impacts of land use on water resources, as there are direct on-site effects and wider off-site / landscape effects of management practices that affect the hydrological regime.
When considering the impacts of land use and management on water resources, it is also important to understand the relative importance of anthropogenic and natural causes in order to
propose / develop appropriate responses. For example, if the amount of erosion generated by farming practices in a dam catchment is insignificant compared to natural erosion events (e.g. rainstorms), changing those practices will not change the sedimentation of the dam. The design and site of the dam may simply be inappropriate in that landscape, unless accompanied by appropriate sediment traps upstream and periodic sediment removal / dredging.
The water resources assessment focuses on obtaining information from multiple different sources:
p Informationobtainedfromsecondarydataandkeyinformants(Tool6.1), backed up by information from land users / households (Tool 1.1), on:• Climatic conditions seasonality and
trends - rainfall, evaporation, drought, flood, water management practices such as rainwater harvesting techniques and water conservation practices;
• Water allocations, access rules and arrangements, incidence and management of water conflicts, water policy, legislation and other institutional issues;
• Changes in the seasonality and quantity of rainfalls (spatially and temporally); diminution of the flux of streams and rivers; changes in the spatial location of streams and rivers and their evolution (constant, light deviation, abrupt deviation); changes in flooding regimes (importance and magnitude of the disaster, and frequency); change in the morphology of the stream and river (constant / light, widening, abrupt change).
p Observationsandmeasurementsofwaterbodies(lakes,riversetc.)andwaterpoints(boreholesandwells)inthefield, backed up by information
61LAND DEGRADATION ASSESSMENT IN DRYLANDS (LADA) PROJECT
ChAPTER 6 Assessing land resources status and trends, effects on livelihoods and ecosystems services
from key informants and land users/households, on: • Water quality of the different water
bodies (e.g. salinity increasing, stable or decreasing);
• Water quantity / availability from different water bodies, for different users and uses; Lowering / increasing of the water table, stagnation; transport of solid matter, water flux regime, depth of soil behind dams; soil and water conservation practices; diminution of water retention in dams and small lakes;
• Pressure on and demand of water: water use / consumption, water withdrawal / abstraction, proportion of illegal water withdrawals, water infrastructure; augmentation of private wells; modes of water harvesting; costs; distance between water points in grazing lands;
• Water use efficiency (e.g. excess losses through runoff and evaporation), type and efficiency of the water infrastructure in irrigated areas.
p Informationonbothon-siteandoff-sitecausesofwaterresourcesdegradationorimprovement obtained during the assessment, where: • On-sitecausesofdegradationof
waterresources include: pressures on the water body, removal of protective vegetation, overgrazing or cultivation around the water body; changes to the water body through drainage, irrigation or other infrastructure; or changes due to natural events such as erosion or floods. Improvements may include watershed management, management of water sources for different uses (piped or pumped water for human consumption, rainwater
harvesting for crops, protection of water supplies from direct access by troughs for livestock etc..
• Off-sitecausesofchangeinwaterresources (quality, quantity and flow) may include changes in land use that affect the upstream / catchment area such as: fertilizer or agro-chemical use on farmland and associated run-off or other pollutants that affect water quality; change in water regime through draining of wetlands / swamps (e.g. increased floods; reduced flows or change from perennial to seasonal flow); damming for water storage, irrigation or recreation.
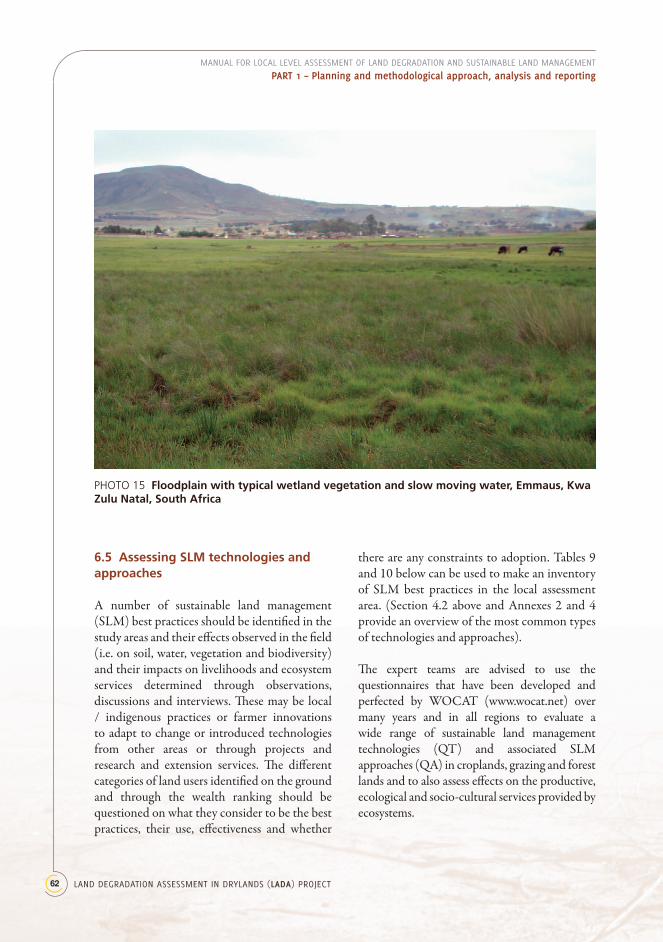
The South Africa Department of Water Affairs and Forestry used its Manual for the Assessment of a Habitat Integrity for Floodplain and Channelled Valley Bottom Wetland Types to conduct a rapid assessment (3 hour field visit of the wetland backed up by remote sensing data) to report on present ecological state of the wetlands in the study area. Photo 16 shows typical wetland vegetation used for cattle grazing.
The Wetland assessment method is designed for non- wetland experts but requires some training in the Excel based model which develops a Wetland Index by assessing vegetation alteration (structure; density) as driven by land use change /intensity (e.g., the removal of riparian vegetation along a river, or agricultural disturbance across the floodplain of a wetland) and catchment as well as “on-site” (within the wetland system) effects on hydrology and geomorphology, and on water quality in terms of nutrient loads and sewage return flows and oxygen loads.
MANuAL fOR LOCAL LEvEL ASSESSMENT Of LAND DEGRADATION AND SuSTAINAbLE LAND MANAGEMENTPART 1 – Planning and methodological approach, analysis and reporting
62 LAND DEGRADATION ASSESSMENT IN DRYLANDS (LADA) PROJECT
6.5 Assessing SLM technologies and approaches
A number of sustainable land management (SLM) best practices should be identified in the study areas and their effects observed in the field (i.e. on soil, water, vegetation and biodiversity) and their impacts on livelihoods and ecosystem services determined through observations, discussions and interviews. These may be local / indigenous practices or farmer innovations to adapt to change or introduced technologies from other areas or through projects and research and extension services. The different categories of land users identified on the ground and through the wealth ranking should be questioned on what they consider to be the best practices, their use, effectiveness and whether
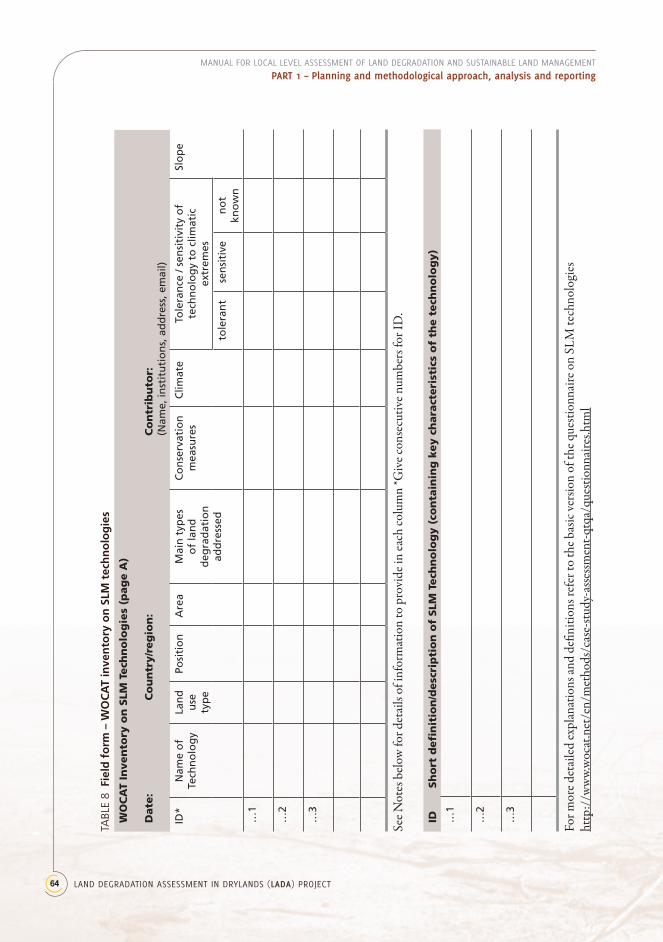
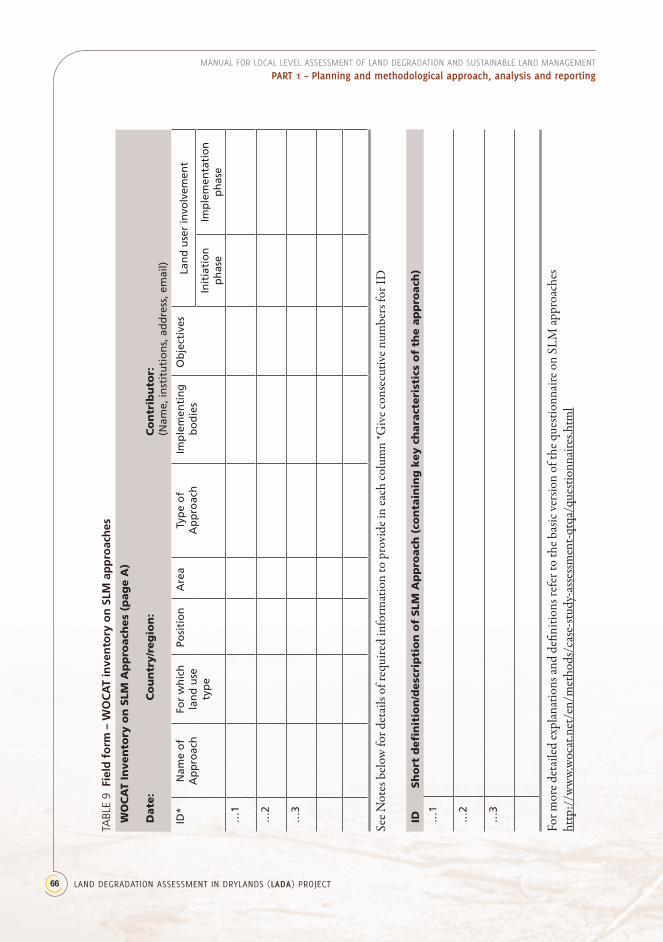
there are any constraints to adoption. Tables 9 and 10 below can be used to make an inventory of SLM best practices in the local assessment area. (Section 4.2 above and Annexes 2 and 4 provide an overview of the most common types of technologies and approaches).
The expert teams are advised to use the questionnaires that have been developed and perfected by WOCAT (www.wocat.net) over many years and in all regions to evaluate a wide range of sustainable land management technologies (QT) and associated SLM approaches (QA) in croplands, grazing and forest lands and to also assess effects on the productive, ecological and socio-cultural services provided by ecosystems.
PHOTO 15 Floodplain with typical wetland vegetation and slow moving water, emmaus, Kwa Zulu Natal, South Africa
63LAND DEGRADATION ASSESSMENT IN DRYLANDS (LADA) PROJECT
ChAPTER 6 Assessing land resources status and trends, effects on livelihoods and ecosystems services
WOCAT Framework for Documentation and Evaluation of SLMTechnologies: http://www.wocat.net/fileadmin/user_upload/documents/QT_and_QA/TechQuestE.pdfThis helps technical experts who are very familiar with a specific technology on the ground (technicians or extension staff ) to collect relevant information with land users / farmers on the specifications of the given Technology, where is it used (natural and human environment), and what impacts it has.
WOCAT Framework for Documentation and Evaluation of SLMApproaches: http://www.wocat.net/fileadmin/user_upload/documents/QT_and_QA/AppQuestE.pdfThis helps those same persons, for the selected SLM technology / practice, to address the questions of how implementation was achieved and who achieved it. It provides complementary data to QT.
Annexes 3 and 5 provide case studies of the illustrated Technologies andApproaches that are obtained from completing the QT and QA questionnaires, and then entering the data into the on line ACCESS databases on the WOCAT website. These are currently being updated to an interactive online version, and already allows direct entry into the WOCAT Approaches and Mapping databases (the SLM Technologies database is still under development). http://www.wocat.net/en/knowledge-base.html
Specific templates are available for entering the data and graphics, also generating very clearly presented 4 page case studies. http://www.wocat.net/en/methods/case-study-assessment-qtqa/output-format.html
The newest version of QT (and QA) includes a question on tolerance and sensitivity of SLM technologies (and approaches) to climate change (question 2.7.5) and further methods are being developed by FAO and WOCAT for more systematic assessment in the future. See also the TerrAfrica program resource guide on using sustainable land management practices to adapt to and mitigate climate change in sub-Saharan Africa (Woodfine, 2009).
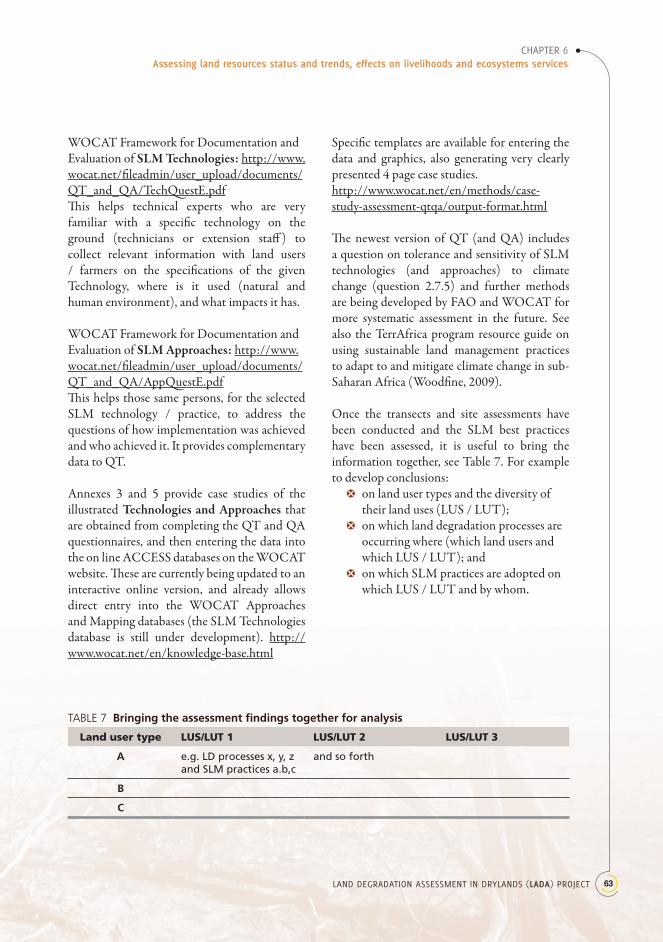
Once the transects and site assessments have been conducted and the SLM best practices have been assessed, it is useful to bring the information together, see Table 7. For example to develop conclusions:
p on land user types and the diversity of their land uses (LUS / LUT);
p on which land degradation processes are occurring where (which land users and which LUS / LUT); and
p on which SLM practices are adopted on which LUS / LUT and by whom.
TABlE 7 Bringing the assessment findings together for analysis
Land user type LUS/LUT 1 LUS/LUT 2 LUS/LUT 3
A e.g. LD processes x, y, zand SLM practices a.b,c
and so forth
B
c
MANuAL fOR LOCAL LEvEL ASSESSMENT Of LAND DEGRADATION AND SuSTAINAbLE LAND MANAGEMENTPART 1 – Planning and methodological approach, analysis and reporting
64 LAND DEGRADATION ASSESSMENT IN DRYLANDS (LADA) PROJECT
TABl
E 8
Fie
ld f
orm
– W
oc
At
inve
nto
ry o
n S
LM t
ech
no
log
ies
WO
CA
T In
ven
tory
on
SLM
Tech
no
log
ies
(pag
e A
)
Date
: C
ou
ntr
y/r
eg
ion
: C
on
trib
uto
r:
(Nam
e, in
stit
uti
on
s, a
dd
ress
, em
ail)
ID*
Nam
e o
f Te
chn
olo
gy
Lan
d
use
ty
pe
Posi
tio
nA
rea
Mai
n t
ypes
o
f la
nd
d
egra
dat
ion
ad
dre
ssed
Co
nse
rvat
ion
m
easu
res
Clim
ate
Tole
ran
ce /
sen
siti
vity
of
tech
no
log
y to
clim
atic
ex
trem
es
Slo
pe
tole
ran
tse
nsi
tive
no
t kn
ow
n
…1
…2
…3
See N
otes
bel
ow fo
r det
ails
of in
form
atio
n to
pro
vide
in ea
ch co
lum
n *G
ive c
onse
cutiv
e num
bers
for I
D.
IDSh
ort
defi
nit
ion
/desc
rip
tio
n o
f SLM
Tech
no
log
y (
con
tain
ing
key c
hara
cteri
stic
s o
f th
e t
ech
no
log
y)
…1
…2
…3
For m
ore d
etai
led
expl
anat
ions
and
defin
ition
s ref
er to
the b
asic
vers
ion
of th
e que
stion
naire
on
SLM
tech
nolo
gies
ht
tp:/
/ww
w.w
ocat
.net
/en/
met
hods
/cas
e-st
udy-
asse
ssmen
t-qtq
a/qu
estio
nnai
res.h
tml
65LAND DEGRADATION ASSESSMENT IN DRYLANDS (LADA) PROJECT
ChAPTER 6 Assessing land resources status and trends, effects on livelihoods and ecosystems services
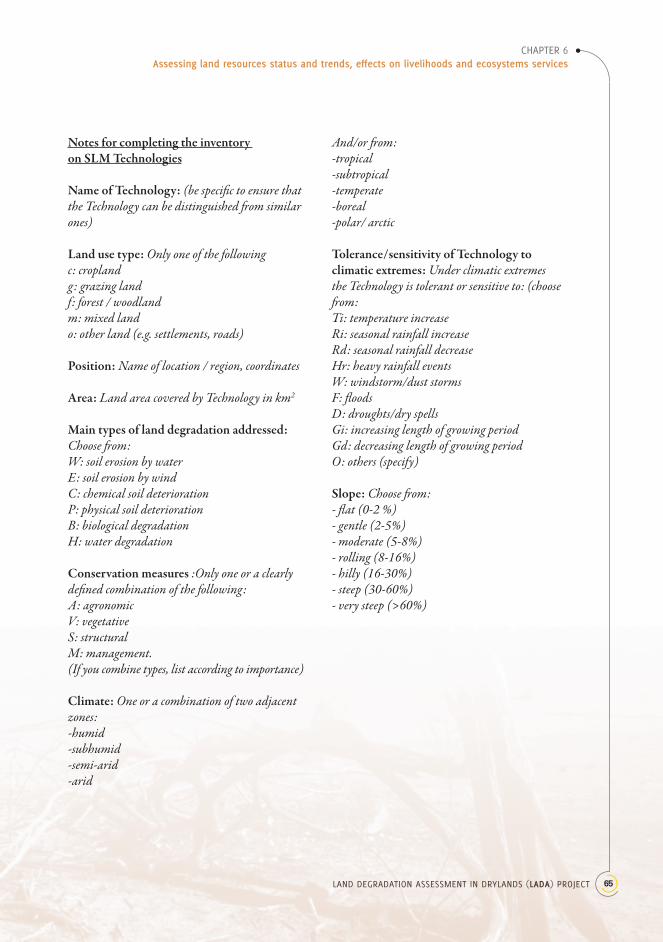
NotesforcompletingtheinventoryonSLMTechnologies
NameofTechnology: (be specific to ensure that the Technology can be distinguished from similar ones)
Landusetype: Only one of the followingc: croplandg: grazing landf: forest / woodlandm: mixed lando: other land (e.g. settlements, roads)
Position: Name of location / region, coordinates
Area: Land area covered by Technology in km2
Maintypesoflanddegradationaddressed: Choose from:W: soil erosion by water E: soil erosion by windC: chemical soil deteriorationP: physical soil deteriorationB: biological degradationH: water degradation
Conservationmeasures :Only one or a clearly defined combination of the following:A: agronomicV: vegetativeS: structuralM: management.(If you combine types, list according to importance)
Climate: One or a combination of two adjacent zones:-humid-subhumid-semi-arid-arid
And/or from:-tropical-subtropical-temperate-boreal-polar/ arctic
Tolerance/sensitivityofTechnologytoclimaticextremes: Under climatic extremes the Technology is tolerant or sensitive to: (choose from:Ti: temperature increaseRi: seasonal rainfall increase Rd: seasonal rainfall decreaseHr: heavy rainfall eventsW: windstorm/dust stormsF: floodsD: droughts/dry spellsGi: increasing length of growing periodGd: decreasing length of growing periodO: others (specify)
Slope: Choose from:- flat (0-2 %)- gentle (2-5%)- moderate (5-8%)- rolling (8-16%)- hilly (16-30%)- steep (30-60%)- very steep (>60%)
MANuAL fOR LOCAL LEvEL ASSESSMENT Of LAND DEGRADATION AND SuSTAINAbLE LAND MANAGEMENTPART 1 – Planning and methodological approach, analysis and reporting
66 LAND DEGRADATION ASSESSMENT IN DRYLANDS (LADA) PROJECT
TABl
E 9
Fie
ld f
orm
– W
oc
At
inve
nto
ry o
n S
LM a
pp
roac
hes
WO
CA
T In
ven
tory
on
SLM
Ap
pro
ach
es
(pag
e A
)
Date
: C
ou
ntr
y/r
eg
ion
: C
on
trib
uto
r:
(Nam
e, in
stit
uti
on
s, a
dd
ress
, em
ail)
ID*
Nam
e o
f A
pp
roac
hFo
r w
hic
h
lan
d u
se
typ
e
Posi
tio
nA
rea
Typ
e o
f A
pp
roac
hIm
ple
men
tin
g
bo
die
sO
bje
ctiv
esLa
nd
use
r in
volv
emen
t
Init
iati
on
p
has
eIm
ple
men
tati
on
p
has
e
…1
…2
…3
See N
otes
bel
ow fo
r det
ails
of re
quire
d in
form
atio
n to
pro
vide
in ea
ch co
lum
n *G
ive c
onse
cutiv
e num
bers
for I
D
IDSh
ort
defi
nit
ion
/desc
rip
tio
n o
f SLM
Ap
pro
ach
(co
nta
inin
g k
ey c
hara
cteri
stic
s o
f th
e a
pp
roach
)
…1
…2
…3
For m
ore d
etai
led
expl
anat
ions
and
defin
ition
s ref
er to
the b
asic
vers
ion
of th
e que
stion
naire
on
SLM
appr
oach
es
http
://w
ww.
woc
at.n
et/e
n/m
etho
ds/c
ase-
stud
y-as
sessm
ent-q
tqa/
ques
tionn
aire
s.htm
l
67LAND DEGRADATION ASSESSMENT IN DRYLANDS (LADA) PROJECT
ChAPTER 6 Assessing land resources status and trends, effects on livelihoods and ecosystems services
TABl
E 9
Fie
ld f
orm
– W
oc
At
inve
nto
ry o
n S
LM a
pp
roac
hes
(co
nti
nu
ed)
WO
CA
T In
ven
tory
on
SLM
Ap
pro
ach
es
(pag
e B
)
Date
: C
ou
ntr
y/r
eg
ion
: C
on
trib
uto
r:
(Nam
e, in
stit
uti
on
s, a
dd
ress
, em
ail)
ID*
Tech
nic
al
sup
po
rtEx
tern
al
mat
eria
l su
pp
ort
Mo
tiva
tio
n o
f la
nd
use
r
to im
ple
men
t SL
MIm
pac
tPh
oto
Ran
kin
g
Wo
rld
Map
Pote
nti
al
…1
…2
…3
See N
otes
bel
ow fo
r det
ails
of re
quire
d in
form
atio
n to
pro
vide
in ea
ch co
lum
n *G
ive c
onse
cutiv
e num
bers
for I
D
IDStr
en
gth
s o
f SLM
Ap
pro
ach
Weakn
ess
es
of
SLM
Ap
pro
ach
…1
…2
…3
For m
ore d
etai
led
expl
anat
ions
and
defin
ition
s ref
er to
the b
asic
vers
ion
of th
e que
stion
naire
on
SLM
appr
oach
es
http
://w
ww.
woc
at.n
et/e
n/m
etho
ds/c
ase-
stud
y-as
sessm
ent-q
tqa/
ques
tionn
aire
s.htm
l
MANuAL fOR LOCAL LEvEL ASSESSMENT Of LAND DEGRADATION AND SuSTAINAbLE LAND MANAGEMENTPART 1 – Planning and methodological approach, analysis and reporting
68 LAND DEGRADATION ASSESSMENT IN DRYLANDS (LADA) PROJECT
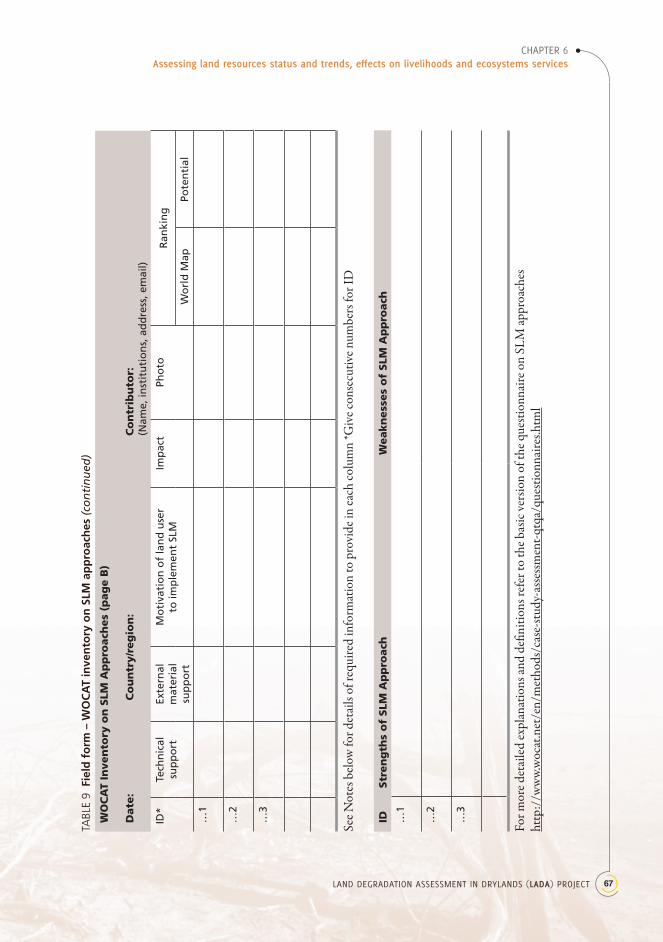
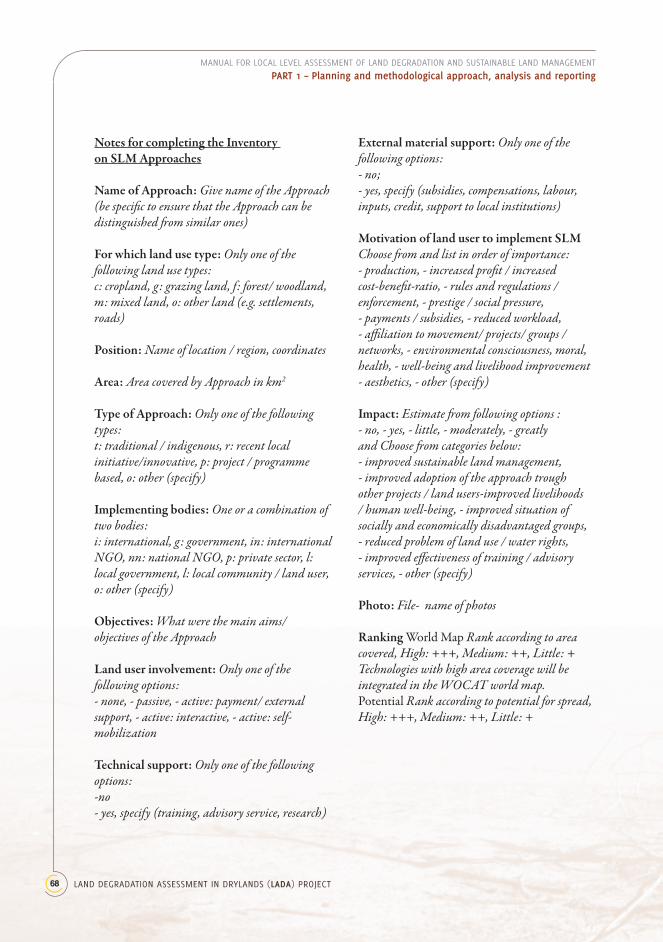
NotesforcompletingtheInventoryonSLMApproaches
NameofApproach: Give name of the Approach (be specific to ensure that the Approach can be distinguished from similar ones)
Forwhichlandusetype: Only one of the following land use types:c: cropland, g: grazing land, f: forest/ woodland, m: mixed land, o: other land (e.g. settlements, roads)
Position: Name of location / region, coordinates
Area: Area covered by Approach in km2
TypeofApproach: Only one of the following types:t: traditional / indigenous, r: recent local initiative/innovative, p: project / programme based, o: other (specify)
Implementingbodies: One or a combination of two bodies:i: international, g: government, in: international NGO, nn: national NGO, p: private sector, l: local government, l: local community / land user, o: other (specify)
Objectives: What were the main aims/ objectives of the Approach
Landuserinvolvement: Only one of the following options:- none, - passive, - active: payment/ external support, - active: interactive, - active: self-mobilization
Technicalsupport: Only one of the following options:-no- yes, specify (training, advisory service, research)
Externalmaterialsupport: Only one of the following options: - no; - yes, specify (subsidies, compensations, labour, inputs, credit, support to local institutions)
MotivationoflandusertoimplementSLM Choose from and list in order of importance:- production, - increased profit / increased cost-benefit-ratio, - rules and regulations / enforcement, - prestige / social pressure, - payments / subsidies, - reduced workload, - affiliation to movement/ projects/ groups / networks, - environmental consciousness, moral, health, - well-being and livelihood improvement- aesthetics, - other (specify)
Impact: Estimate from following options :- no, - yes, - little, - moderately, - greatly and Choose from categories below: - improved sustainable land management, - improved adoption of the approach trough other projects / land users-improved livelihoods / human well-being, - improved situation of socially and economically disadvantaged groups, - reduced problem of land use / water rights, - improved effectiveness of training / advisory services, - other (specify)
Photo: File- name of photos
Ranking World Map Rank according to area covered, High: +++, Medium: ++, Little: +Technologies with high area coverage will be integrated in the WOCAT world map. Potential Rank according to potential for spread, High: +++, Medium: ++, Little: +
69LAND DEGRADATION ASSESSMENT IN DRYLANDS (LADA) PROJECT
ChAPTER 6 Assessing land resources status and trends, effects on livelihoods and ecosystems services
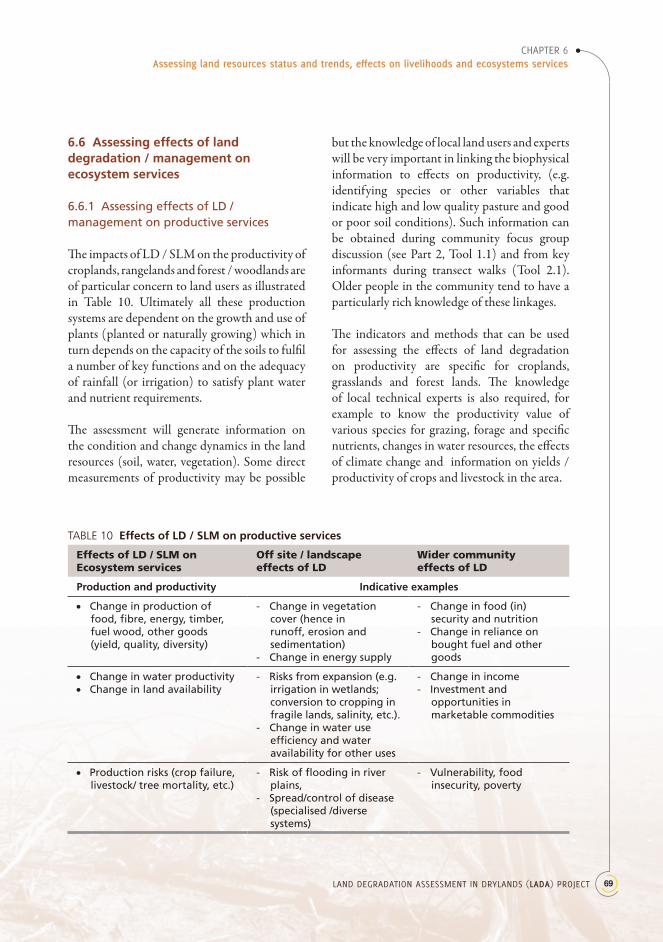
6.6 Assessing effects of land degradation / management on ecosystem services
6.6.1 Assessing effects of LD / management on productive services
The impacts of LD / SLM on the productivity of croplands, rangelands and forest / woodlands are of particular concern to land users as illustrated in Table 10. Ultimately all these production systems are dependent on the growth and use of plants (planted or naturally growing) which in turn depends on the capacity of the soils to fulfil a number of key functions and on the adequacy of rainfall (or irrigation) to satisfy plant water and nutrient requirements.
The assessment will generate information on the condition and change dynamics in the land resources (soil, water, vegetation). Some direct measurements of productivity may be possible
but the knowledge of local land users and experts will be very important in linking the biophysical information to effects on productivity, (e.g. identifying species or other variables that indicate high and low quality pasture and good or poor soil conditions). Such information can be obtained during community focus group discussion (see Part 2, Tool 1.1) and from key informants during transect walks (Tool 2.1). Older people in the community tend to have a particularly rich knowledge of these linkages.
The indicators and methods that can be used for assessing the effects of land degradation on productivity are specific for croplands, grasslands and forest lands. The knowledge of local technical experts is also required, for example to know the productivity value of various species for grazing, forage and specific nutrients, changes in water resources, the effects of climate change and information on yields / productivity of crops and livestock in the area.
TABlE 10 effects of LD / SLM on productive services
Effects of LD / SLM on Ecosystem services
Off site / landscape effects of LD
Wider community effects of LD
Production and productivity Indicative examples
• Change in production of food, fibre, energy, timber, fuel wood, other goods (yield, quality, diversity)
- Change in vegetation cover (hence in runoff, erosion and sedimentation)
- Change in energy supply
- Change in food (in)security and nutrition
- Change in reliance on bought fuel and other goods
• Change in water productivity• Change in land availability
- Risks from expansion (e.g. irrigation in wetlands; conversion to cropping in fragile lands, salinity, etc.).
- Change in water use efficiency and water availability for other uses
- Change in income- Investment and
opportunities in marketable commodities
• Production risks (crop failure, livestock/ tree mortality, etc.)
- Risk of flooding in river plains,
- Spread/control of disease (specialised /diverse systems)
- Vulnerability, food insecurity, poverty

MANuAL fOR LOCAL LEvEL ASSESSMENT Of LAND DEGRADATION AND SuSTAINAbLE LAND MANAGEMENTPART 1 – Planning and methodological approach, analysis and reporting
70 LAND DEGRADATION ASSESSMENT IN DRYLANDS (LADA) PROJECT
An understanding is also needed of the changes that are observed or provided by informants. For example, bush encroachment may increase the plant biomass or cover but it reflects a severe degradation process in drylands, whereby the grass-dominated vegetation is transformed into a woody species-dominated one. This results in an increase and spread of less palatable species for livestock (e.g. Prosopis spp. is a competitive, woody bush that is resistant to drought but spreads at the expense of other species and may hinder livestock access to grazing and water).
For more informed results, assessment of vegetation cover and grazing impact on the ground can be complemented by vegetation
cover index values derived from available time series remotely-sensed data. The aim is to triangulate the various pieces of information for validation purposes.
Cropland degradation / management and productivity
Reduction in the capacity of land used for crop production (rainfed or irrigated) to sustain the yield of annual and / or perennial crops is due largely to soil degradation and partly due to degradation of water resources. The main indicators of degradation / improvement in croplands are summarised in Table 11.
TABlE 11 Assessing LD /SLM processes in croplands
Effects of LD/SLM in croplands
Indicators
Change in soil properties: - biological,- chemical- physical - hydrological
- Change in soil OM content; plant nutrient availability, leading to change in fertility (i.e. yield / ha) and / or change in required inputs (fertiliser / OM / ha
- Change in soil salinity and chemical toxicity (e.g. excess fertilisers, agro-chemicals, inadequate drainage in irrigated lands) leading to change in yields or crop suitability (tolerant species)
- Change in soil physical structure (e.g. compaction, pulverisation of soil due to excess tillage, crusting due to burning) resulting in change in germination rate, root development, infiltration / drainage (e.g. leading to runoff or waterlogging; change in soil moisture retention (aridification).
Soil erosion or reclamation - Change in extent and severity of splash, sheet, rill and gully erosion (by water) and of topsoil removal by wind blow leading to change in productivity (yield/ha) and productive land area (gullies and their reclamation)
- Change in extent and depth of wind blown soil deposits and sand dune movement (wind erosion) leading to change in productivity and productive land area, and damage to property / infrastructure.
Change in water resources - Change in the quantity and quality and flow regime of ground and surface water resources and change in water availability (human consumption, livestock, irrigation etc.
Change in vegetation - Change in conservation and use of wild tree and plant species in farming systems (borders, strips, multiple storey etc) for fertiliser, mulch, shade, forage for livestock, habitat for pollinators and beneficial predators
71LAND DEGRADATION ASSESSMENT IN DRYLANDS (LADA) PROJECT
ChAPTER 6 Assessing land resources status and trends, effects on livelihoods and ecosystems services
These factors that affect cropland quality and extent will all affect productivity and can be assessed through looking at productive land area, yields, growth characteristics and nutrient deficiency symptoms in crops (Tool 3.4). However, often little is known about the relationship between land degradation and productivity as other factors play a more important role (i.e. soil type, rainfall etc.) and as productivity can be compensated for by inputs and management practices.
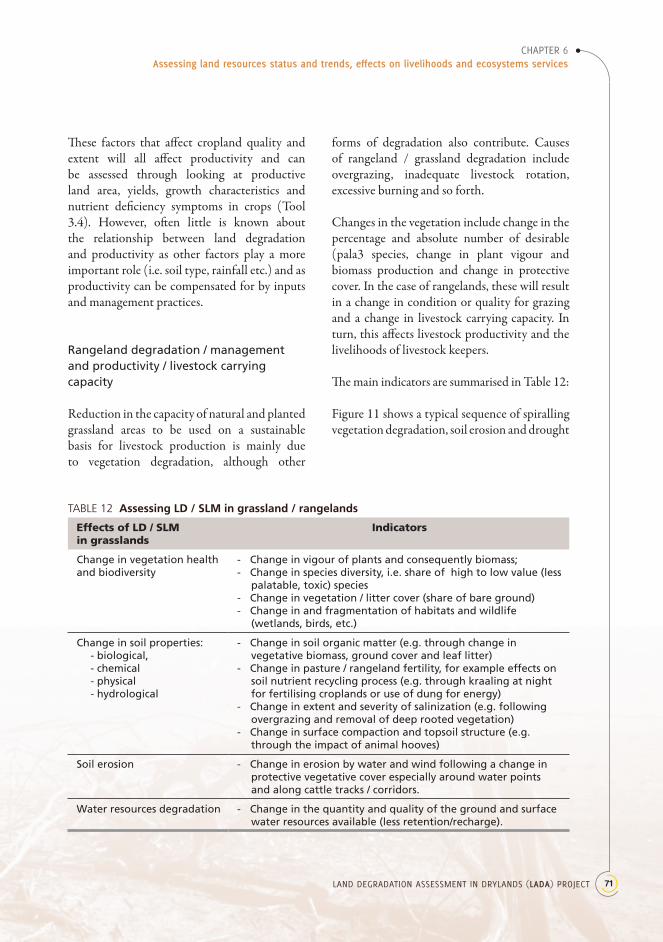
Rangeland degradation / management and productivity / livestock carrying capacity
Reduction in the capacity of natural and planted grassland areas to be used on a sustainable basis for livestock production is mainly due to vegetation degradation, although other
forms of degradation also contribute. Causes of rangeland / grassland degradation include overgrazing, inadequate livestock rotation, excessive burning and so forth.
Changes in the vegetation include change in the percentage and absolute number of desirable (pala3 species, change in plant vigour and biomass production and change in protective cover. In the case of rangelands, these will result in a change in condition or quality for grazing and a change in livestock carrying capacity. In turn, this affects livestock productivity and the livelihoods of livestock keepers.
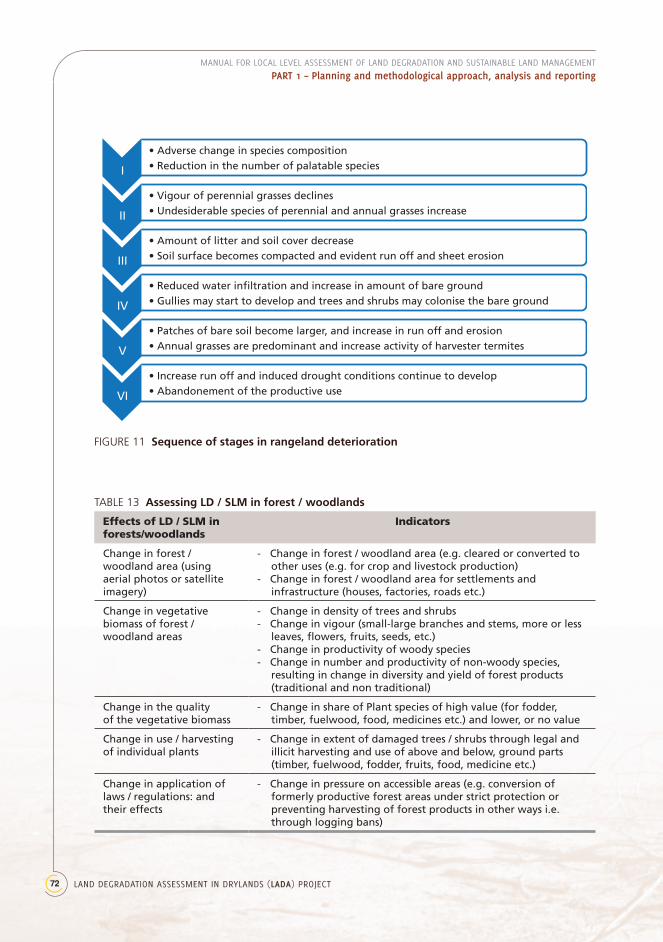
The main indicators are summarised in Table 12:
Figure 11 shows a typical sequence of spiralling vegetation degradation, soil erosion and drought
TABlE 12 Assessing LD / SLM in grassland / rangelands
Effects of LD / SLM in grasslands
Indicators
Change in vegetation health and biodiversity
- Change in vigour of plants and consequently biomass; - Change in species diversity, i.e. share of high to low value (less
palatable, toxic) species - Change in vegetation / litter cover (share of bare ground)- Change in and fragmentation of habitats and wildlife
(wetlands, birds, etc.)
Change in soil properties: - biological,- chemical- physical - hydrological
- Change in soil organic matter (e.g. through change in vegetative biomass, ground cover and leaf litter)
- Change in pasture / rangeland fertility, for example effects on soil nutrient recycling process (e.g. through kraaling at night for fertilising croplands or use of dung for energy)
- Change in extent and severity of salinization (e.g. following overgrazing and removal of deep rooted vegetation)
- Change in surface compaction and topsoil structure (e.g. through the impact of animal hooves)
Soil erosion - Change in erosion by water and wind following a change in protective vegetative cover especially around water points and along cattle tracks / corridors.
Water resources degradation - Change in the quantity and quality of the ground and surface water resources available (less retention/recharge).
MANuAL fOR LOCAL LEvEL ASSESSMENT Of LAND DEGRADATION AND SuSTAINAbLE LAND MANAGEMENTPART 1 – Planning and methodological approach, analysis and reporting
72 LAND DEGRADATION ASSESSMENT IN DRYLANDS (LADA) PROJECT
FIGURE 11 Sequence of stages in rangeland deterioration
• Adverse change in species composition• Reduction in the number of palatable species
• Vigour of perennial grasses declines• Undesiderable species of perennial and annual grasses increase
• Amount of litter and soil cover decrease• Soil surface becomes compacted and evident run off and sheet erosion
• Reduced water infiltration and increase in amount of bare ground• Gullies may start to develop and trees and shrubs may colonise the bare ground
• Patches of bare soil become larger, and increase in run off and erosion• Annual grasses are predominant and increase activity of harvester termites
• Increase run off and induced drought conditions continue to develop• Abandonement of the productive use
I
II
III
IV
V
VI
TABlE 13 Assessing LD / SLM in forest / woodlands
Effects of LD / SLM in forests/woodlands
Indicators
Change in forest / woodland area (using aerial photos or satellite imagery)
- Change in forest / woodland area (e.g. cleared or converted to other uses (e.g. for crop and livestock production)
- Change in forest / woodland area for settlements and infrastructure (houses, factories, roads etc.)
Change in vegetative biomass of forest / woodland areas
- Change in density of trees and shrubs - Change in vigour (small-large branches and stems, more or less
leaves, flowers, fruits, seeds, etc.) - Change in productivity of woody species- Change in number and productivity of non-woody species,
resulting in change in diversity and yield of forest products (traditional and non traditional)
Change in the quality of the vegetative biomass
- Change in share of Plant species of high value (for fodder, timber, fuelwood, food, medicines etc.) and lower, or no value
Change in use / harvesting of individual plants
- Change in extent of damaged trees / shrubs through legal and illicit harvesting and use of above and below, ground parts (timber, fuelwood, fodder, fruits, food, medicine etc.)
Change in application of laws / regulations: and their effects
- Change in pressure on accessible areas (e.g. conversion of formerly productive forest areas under strict protection or preventing harvesting of forest products in other ways i.e. through logging bans)

73LAND DEGRADATION ASSESSMENT IN DRYLANDS (LADA) PROJECT
ChAPTER 6 Assessing land resources status and trends, effects on livelihoods and ecosystems services
Forest / woodland degradation / management and productivity
In some cases, the reduction in the capacity of land to be used for forests and woodland for the production of wood and other forest products will be of major concern. Forest degradation can be caused by over-harvesting, excessive burning, pest / disease damage or climate change.
The main indicators of degradation or improved management are summarised in Table 13.
In assessing degradation / improvement trends, it is important to understand where one is in a historical progression or evolution as illustrated by the Photo series below.
6.6.2 Assessing effects of land degradation / management on regulating and supportive services
While walking along the transect and at each of the detailed assessment sites, the team should consider and discuss with the land users whether there are off- site or wider landscape effects of the degradation processes that have been observed (deforestation, erosion, overgrazing etc) on regulating and supporting (life-support services).
Similarly, the team should consider with the land users the beneficial effects of identified best practices or SLM measures (integrated crop-livestock systems, soil and water conservation, pasture and rangeland management etc.).
PHOTO 16 evolution of forest depletion, Pamir mountains, tajikistan
1. People first collect dead wood in accessible riverine forests.2. With increasing scarcity, wood may then be lopped off trees and bushes.3. The coppice can be collected with less effort than big logs, so trees remain longer than brushwood.4. With increased pressure on fuel supplies, firewood is sold and legally or illegally chopped.5. Remaining stumps are gradually cut, until the area is cleared and used as pastureland [5,6] which is likely to become salinized.
Source and Photos: Droux, R. and Hoeck, T., University of Berne
MANuAL fOR LOCAL LEvEL ASSESSMENT Of LAND DEGRADATION AND SuSTAINAbLE LAND MANAGEMENTPART 1 – Planning and methodological approach, analysis and reporting
74 LAND DEGRADATION ASSESSMENT IN DRYLANDS (LADA) PROJECT
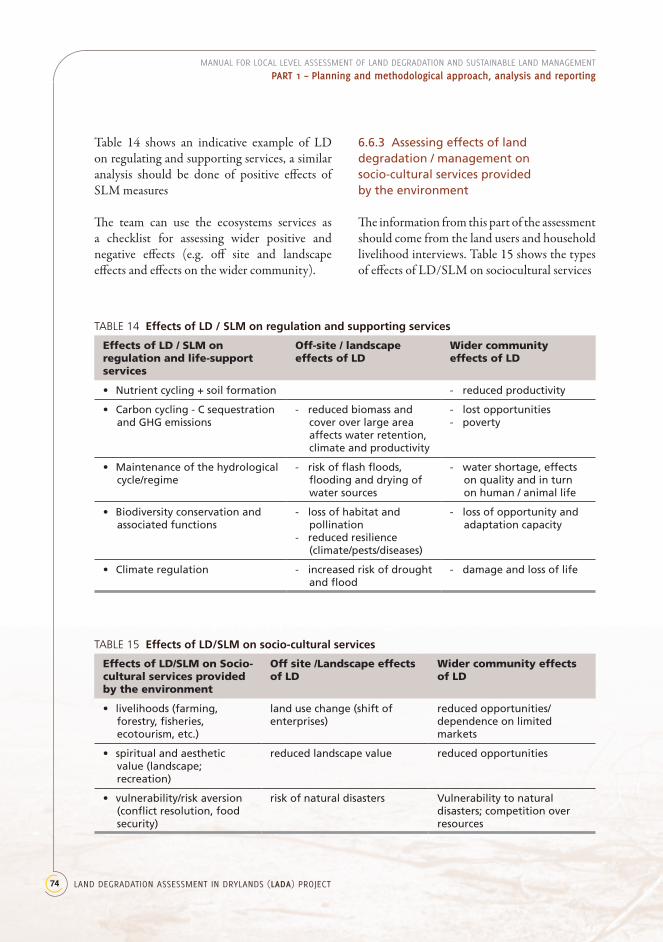
Table 14 shows an indicative example of LD on regulating and supporting services, a similar analysis should be done of positive effects of SLM measures
The team can use the ecosystems services as a checklist for assessing wider positive and negative effects (e.g. off site and landscape effects and effects on the wider community).
6.6.3 Assessing effects of land degradation / management on socio-cultural services provided by the environment
The information from this part of the assessment should come from the land users and household livelihood interviews. Table 15 shows the types of effects of LD/SLM on sociocultural services
TABlE 14 effects of LD / SLM on regulation and supporting services
Effects of LD / SLM on regulation and life-support services
Off-site / landscape effects of LD
Wider community effects of LD
• Nutrient cycling + soil formation - reduced productivity
• Carbon cycling - C sequestration and GHG emissions
- reduced biomass and cover over large area affects water retention, climate and productivity
- lost opportunities - poverty
• Maintenance of the hydrological cycle/regime
- risk of flash floods, flooding and drying of water sources
- water shortage, effects on quality and in turn on human / animal life
• Biodiversity conservation and associated functions
- loss of habitat and pollination
- reduced resilience (climate/pests/diseases)
- loss of opportunity and adaptation capacity
• Climate regulation - increased risk of drought and flood
- damage and loss of life
TABlE 15 effects of LD/SLM on socio-cultural services
Effects of LD/SLM on Socio-cultural services provided by the environment
Off site /Landscape effects of LD
Wider community effects of LD
• livelihoods (farming, forestry, fisheries, ecotourism, etc.)
land use change (shift of enterprises)
reduced opportunities/ dependence on limited markets
• spiritual and aesthetic value (landscape; recreation)
reduced landscape value reduced opportunities
• vulnerability/risk aversion (conflict resolution, food security)
risk of natural disasters Vulnerability to natural disasters; competition over resources

75LAND DEGRADATION ASSESSMENT IN DRYLANDS (LADA) PROJECT
ChAPTER 6 Assessing land resources status and trends, effects on livelihoods and ecosystems services
However, if relevant information has not been forthcoming on the various ecosystem services, a back-up strategy is to pose relevant questions and to mobilise discussion during the meeting at which the assessment findings are presented back to the community for validation and finalisation.