Assessing Growth and Response to Therapy in Murine Tumor ...
16
335 22 Assessing Growth and Response to Therapy in Murine Tumor Models C. Patrick Reynolds, Bee-Chun Sun, Yves A. DeClerck, and Rex A. Moats Summary Rodent models provide an important means of assessing antitumor activity vs toxicity for new cancer therapies. Tumors are often grown subcutaneously on the flank or back of animals, allowing accurate serial determination of tumor volume with calipers by measuring the tumors in three dimensions. The advantages of assessing tumor volume in subcutaneous tumors must be balanced against the potential artifacts induced by growth of tumor cells in subcutaneous tissue. Various orthotopic models have been developed. However,they are more labor-intensive and generally do not allow accurate assessment of tumor growth and/or response unless investigators have access to small animal cross-sectional imaging. Use of small-animal magnetic resonance imaging (MRI) allows one to assess the growth and response of intracavitary tumors, but the cost and labor-intensive nature of MRI limits its use in drug testing. Another approach to intracavi- tary solid tumor models is the intravenous injection of tumor cells, which can produce lung, liver, or bone metastases (depending on the cell line used), whereas direct injection of tumor cells into the femur or tibia of mice can cause local growth in bone. Progression of both lung metastases and bone lesions can be assessed by small-animal analog X-ray techniques that are more easily available and less labor-intensive to use, and are proving useful for selected thera- peutic and biological studies. Key Words Mouse xenograft; tumor volume; bone metastases; chemotherapy; radiograph. 1. Introduction Rodent models provide an important means of assessing antitumor activity vs toxicity for new antineoplastic drugs, and they provide a key component of preclinical developmental therapeutics for cancer. Syngeneic rat and mouse tumors played an important role in early cancer drug development (1–3), but these have largely been surpassed by the use of xenografted human solid From: Methods in Molecular Medicine, vol. 111: Chemosensitivity: Vol. 2: In Vivo Models, Imaging, and Molecular Regulators Edited by: R. D. Blumenthal © Humana Press Inc., Totowa, NJ
Transcript of Assessing Growth and Response to Therapy in Murine Tumor ...
335
22
Assessing Growth and Response to Therapy in Murine Tumor Models
C. Patrick Reynolds, Bee-Chun Sun, Yves A. DeClerck, and Rex A. Moats
SummaryRodent models provide an important means of assessing antitumor activity vs toxicity for
new cancer therapies. Tumors are often grown subcutaneously on the flank or back of animals,allowing accurate serial determination of tumor volume with calipers by measuring the tumorsin three dimensions. The advantages of assessing tumor volume in subcutaneous tumors must bebalanced against the potential artifacts induced by growth of tumor cells in subcutaneous tissue.Various orthotopic models have been developed. However, they are more labor-intensive andgenerally do not allow accurate assessment of tumor growth and/or response unless investigatorshave access to small animal cross-sectional imaging. Use of small-animal magnetic resonanceimaging (MRI) allows one to assess the growth and response of intracavitary tumors, but the costand labor-intensive nature of MRI limits its use in drug testing. Another approach to intracavi-tary solid tumor models is the intravenous injection of tumor cells, which can produce lung,liver, or bone metastases (depending on the cell line used), whereas direct injection of tumorcells into the femur or tibia of mice can cause local growth in bone. Progression of both lungmetastases and bone lesions can be assessed by small-animal analog X-ray techniques that aremore easily available and less labor-intensive to use, and are proving useful for selected thera-peutic and biological studies.
Key WordsMouse xenograft; tumor volume; bone metastases; chemotherapy; radiograph.
1. IntroductionRodent models provide an important means of assessing antitumor activity
vs toxicity for new antineoplastic drugs, and they provide a key component ofpreclinical developmental therapeutics for cancer. Syngeneic rat and mousetumors played an important role in early cancer drug development (1–3), butthese have largely been surpassed by the use of xenografted human solid
From: Methods in Molecular Medicine, vol. 111: Chemosensitivity:Vol. 2: In Vivo Models, Imaging, and Molecular Regulators
Edited by: R. D. Blumenthal © Humana Press Inc., Totowa, NJ
tumors in athymic (nu/nu) mice, in severe combined immunodeficiency (SCID)mice, or in athymic rats (4–8). Human leukemia cells injected intravenouslyinto nod/SCID mice can provide a model of acute lymphoblastic leukemia thatis being used for preclinical therapeutic studies (9–11). Although the limita-tions of rodent models in predicting clinically active agents are well recog-nized, they still provide an important component of preclinical testing, andsignificant responses in multiple xenograft models increase the possibility of anew drug having clinical activity (12).
Solid tumors are often grown subcutaneously on the flank or back of animalsto allow an accurate serial determination of tumor volume with calipers bymeasuring the tumors in three dimensions (13). The advantages of assessingtumor volume in subcutaneous tumors must be balanced against the potentialartifacts induced by growth of tumor cells in subcutaneous tissue. Variousorthotopic models have been developed (14–19), but they are more labor-intensive and generally do not allow the accurate assessment of tumor growthand/or response unless investigators have access to small-animal cross-sectionalimaging (20–22). Small-animal magnetic resonance imaging (MRI) allowsassessing growth and response of intracavitary tumors (20–23), but the costand labor-intensive nature of MRI limits its widespread use in preclinical drugtesting. However, in brain tumors, where alternatives for assessing tumorresponse are limited, small animal MRI may see wider application. Micro-computerized tomography (CT) offers another means of assessing intracavi-tary lesions (24,25), but it is not suitable for intracranial lesions, and the timeinvolved in obtaining and processing images prevents the routine use of micro-CT in drug testing.
Transduction of tumor cells with green fluorescent protein (GFP) is onemethod for assessing tumor growth and response by use of fluorescence imag-ing systems that can detect and quantify tumor masses in animals (26–28).However, the potential for GFP transduction to introduce artifacts is consider-able, and GFP transduction has been shown to induce oxidative stress and tosensitize tumor cells to a variety of chemotherapeutic drugs (29). An alternativeto GFP is to transduce tumor cells with firefly luciferase, which allows thelight generated in tumors when the mice are given luciferin to be imaged inspecial devices (30–33). The potential for luciferase transduction to interferewith tumor growth or sensitize tumor cells to chemotherapy remains unknown.Also, because of the induction of an immune response, either luciferase or GFPmarking is limited to use in immunocompromised mice.
Analysis of progression-free survival provides one alternative to intracavitaryimaging, but the lack of tumor response data and the inability to exclude tumorsthat do not engraft from the analysis diminish the usefulness of such models.However, when employing disseminated disease models (tail vein injection)
336 Reynolds et al.
for solid tumors or for leukemias, progression-free survival remains the pri-mary approach for assessing the response of disseminated disease (9–11,34,35).
For tumors in which intravenous injection of tumor cells causes pulmonaryor bone metastases, relatively inexpensive analog radiological methods can pro-vide a means of documenting tumor engraftment prior to therapeutic studies,and may also be used to assess response. Intravenous injection or direct injec-tion of some tumor cell lines into the femur or tibia of mice produces boneinvasion that can cause lytic lesions evauable with analog radiology (36). Suchbone invasion and/or metastasis models have been developed for breast cancer(37–39), prostate cancer (40), and neuroblastoma (41). These models are usefulfor testing agents that have direct antitumor effects, or agents (such as bispho-sphonates) that retard or prevent skeletal events.
We will review here methods for assessing tumor progression and responsein subcutaneous murine models with direct measurement. We will also reviewradiographic techniques currently under development that can be used to assesstumor progression and response to therapy without the use of potentially arti-fact-inducing transduced cell markers.
2. Materials1. Mice. Mice (female, 4–6-wk-old athymic balb/c (nu/nu) or homozygous SCID
C.B-17/IcrHsd-scid mutant mice can be obtained from a variety of vendors. Miceshould be allowed to acclimate to their new environment for 1 wk after arrival.
2. Animal caging. Cages require a laminar-flow air delivery system (such as thatmade by Lab Products, Seaford, DE) or filter cage bonnets on polycarbonatemicroisolator cages lined with autoclaved bedding to maintain an aseptic envi-ronment. Mice should be maintained according to Institutional Animal Care andUse Committee (IACUC) approved experimental protocols. Autoclaved and acid-ified (pH = 4–6) water and autoclaved standard Purina mouse chow should beprovided ad libitum.
3. Medium for suspending tumor cells. To minimize pH changes during handlingof cells outside of a CO2 incubator and to decrease clumping (especially delete-rious with intravenous injections), cells are optimally suspended in L-15 (non-bicarbonate-based, non-CO2-requiring medium) that is made without calcium ormagnesisum.
4. Calipers. Although vernier and dial calipers can be used for measuring subcuta-neous tumors, digital calipers (such as those made by Fisher Scientific, Tustin,CA) are the most suitable for the task. Systems for direct entry of caliper data intomicrocomputers have also been developed (42). However, employing two indi-viduals for the measurements (one to measure, one to transcribe) allows rapidcollection of data without the use of computerized calipers.
5. Injectable anesthetics. Pentobarbital sodium injection (Abbott Laboratories, NorthChicago, IL), given ip at 40 mg/kg is one means of anesthesia. Another is an ipinjection of 2.5% Avertin, 0.02 mL 2.5% Avertin/g body weight (ip) for mice,
Tumor Assessment in Mice 337
with a 100% stock solution consisting of 1 g of 2,2,2-tribromoethanol in 1 mLtert-amyl alcohol (both made by Sigma-Aldrich, Milwaukee, WI). Mice can alsobe anesthetized by ip injection of a mixture of ketamine (50 mg/kg) and xylo-caine (5 mg/kg).
6. Inhalational anesthesia. Isoflurane anesthetic + oxygen is delivered from aninhalational anesthetic apparatus (Abbott Laboratories, North Chicago, IL).
7. Animal temperature control system. To prevent hypothermia, one must providetemperature control for the mice during anesthesia. A suitable system for doingthis is a water heating pad, the heat therapy system, comprised of a pad (REFTP22GT/PAD) and a pump (T/Pimp TP 500/TP500 C), both made by GaymarIndustries, Orchard Park, NY.
8. Radiographic system. Radiographs are generated using a Faxitron MX-20 small-animal X-ray device (Faxitron X-ray Corp., Wheeling, IL). To provide high-resolution radiographs, mammography computed radiography cassettes withhigh-resolution screens and high-detail single-emulsion mammography film andscreens (Fuji EC-MA cassette, Fuji Photo Film Co., Japan) are used (41). Mam-mography products from other vendors are likely to give similar results.
9. Software. Tumor volume measurements, averages and standard deviations, and dif-ferences between treated and control animals can be calculated using MicrosoftExcel. This program can also be used for creating rudimentary tumor growth-over-time graphs. Macros developed in Excel can also be used to generate Kaplan-Meier (log-rank) assessment of time to progression. Analyzed data can be copiedfrom Excel to SigmaPlot (Jandell Scientific, San Rafael, CA) to create publication-quality graphics.
3. Methods3.1. Maintaining Immunocompromised Mice
Mice are allowed to acclimate to their new environment for 1 wk afterarrival. Mice are handled under strict aseptic conditions, opening the cage in alaminar-flow hood while wearing a sterile gown and gloves.
3.2. Establishing Subcutaneous Xenografts
1. Harvest cells that are 75–80% confluent, highly viable, and in logarithmic growthphase. It is preferred to grow cells in antibiotic-free medium to avoid maskingmicrobial contamination. For neuroblastoma, rhabdomyosarcoma, Ewing’s familytumors, retinoblastoma, and certain other tumor types we find that cells can beremoved from the substrate using Puck’s Solution A plus EDTA (Puck’s EDTA),which contains 140 mM NaCl, 5 mM KCl, 5.5 mM glucose, 4 mM NaHCO3,0.8 mM ethylenediaminetetraacetic acid (EDTA), 13 µM phenol red, and 9 mMHEPES buffer (pH 7.3) (43), thus avoiding the additional cell damage fromtrypsin.
2. Viable cell number is determined by hemocytometer counting using trypan blue,and 5–50 million tumor cells (depending on tumorigencity and growth rate) are
338 Reynolds et al.
injected subcutaneously between the shoulder blades of three to five athyhmic(nu/nu) mice using strict aseptic technique, with a 1-cm3-syringe and a 19-gageneedle.
3. For injection, cells are suspended in L-15 medium (Ca2+/Mg2+-free) culturemedium without fetal bovine serum (FBS) such that a total of 200 µL are injectedto deliver the desired cell dose.
4. Mice are observed biweekly and tumor growth monitored when tumors becomepalpable; the lag phase varies from 2 to 12 weeks, depending on the amount ofcells injected, the tumor type, and the cell line employed.
5. When tumors reach about 1.5 cm3, two to four mice are sacrificed, the skin over thetumor disinfected with betadine, and the tumors removed under aseptic conditions.
6. The tumor cells are forced through a sterile 80–160-µm stainless-steel meshstrainer, and mixed with cell culture medium to form a slurry, such that injectionof 200 µL subcutaneously between the shoulder blades of 20–25 mice delivers atumor cell dose of approx 5–50 million cells, depending on how aggressive thetumor is (see Note 1).
3.3. Assessing the Volume of Subcutaneous Tumors by Caliper Measurements
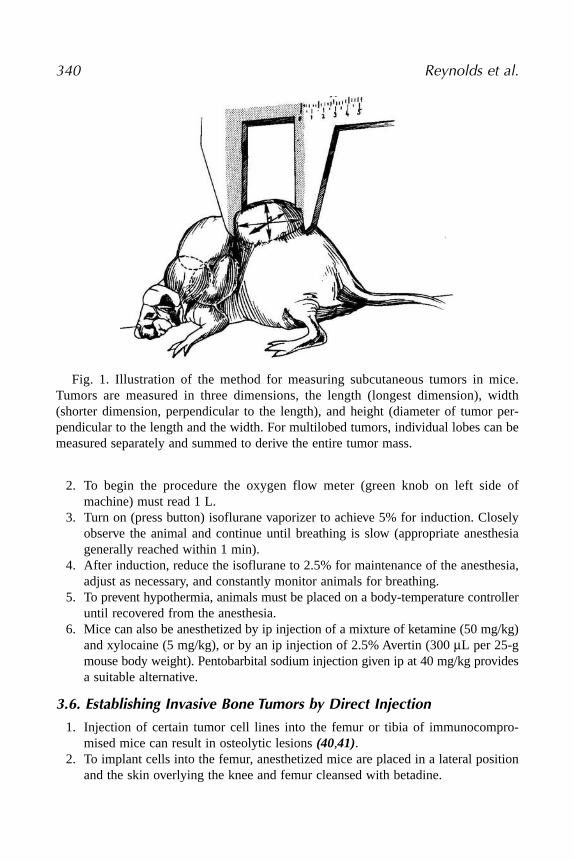
1. Tumors should be measured beginning when they are first palpable: the length(L = longest dimension), the width (W = the distance perpendicular to and in thesame plane as the length), and the height (H = the distance between the exteriortumor edge and the mouse body). The ellipsoid volume of the tumor, calculated from0.5 × L × W × H, provides the most accurate measure of tumor mass (13) (Fig. 1).
2. For multilobed tumors, or those that grow in irregular shapes, the tumor should bedivided visually into two, three, or four lobes of similar dimension that are mea-sured separately (Fig. 1). The calculated volume for each lobe can be summed toobtain the volume of the entire mass (13).
3.4. Establishing Pulmonary and Bone Metastases by Intravenous Injection
1. Cells are harvested from tissue culture flasks, counted, and suspended inserum-free L-15 (calcium- and magnesium-free) medium at a concentration of 20 × 106 cells/mL.
2. The mouse should be gently warmed using a heat lamp to increase tail veincirculation, then placed in a suitable restrainer (10), and the tail prepared withbetadine and 70% alcohol.
3. The cell suspension is placed into a 1-mL syringe and 100 µL of the cell suspen-sion is injected through a 30-gage needle into the lateral tail vein.
3.5. Small Animal Anesthesia (44) (see Note 2)
1. Turn on the oxygen tank. Check the tank meter to ensure that it reads between fulland the top of the refill area (red).
Tumor Assessment in Mice 339
2. To begin the procedure the oxygen flow meter (green knob on left side ofmachine) must read 1 L.
3. Turn on (press button) isoflurane vaporizer to achieve 5% for induction. Closelyobserve the animal and continue until breathing is slow (appropriate anesthesiagenerally reached within 1 min).
4. After induction, reduce the isoflurane to 2.5% for maintenance of the anesthesia,adjust as necessary, and constantly monitor animals for breathing.
5. To prevent hypothermia, animals must be placed on a body-temperature controlleruntil recovered from the anesthesia.
6. Mice can also be anesthetized by ip injection of a mixture of ketamine (50 mg/kg)and xylocaine (5 mg/kg), or by an ip injection of 2.5% Avertin (300 µL per 25-gmouse body weight). Pentobarbital sodium injection given ip at 40 mg/kg providesa suitable alternative.
3.6. Establishing Invasive Bone Tumors by Direct Injection
1. Injection of certain tumor cell lines into the femur or tibia of immunocompro-mised mice can result in osteolytic lesions (40,41).
2. To implant cells into the femur, anesthetized mice are placed in a lateral positionand the skin overlying the knee and femur cleansed with betadine.
340 Reynolds et al.
Fig. 1. Illustration of the method for measuring subcutaneous tumors in mice.Tumors are measured in three dimensions, the length (longest dimension), width(shorter dimension, perpendicular to the length), and height (diameter of tumor per-pendicular to the length and the width. For multilobed tumors, individual lobes can bemeasured separately and summed to derive the entire tumor mass.
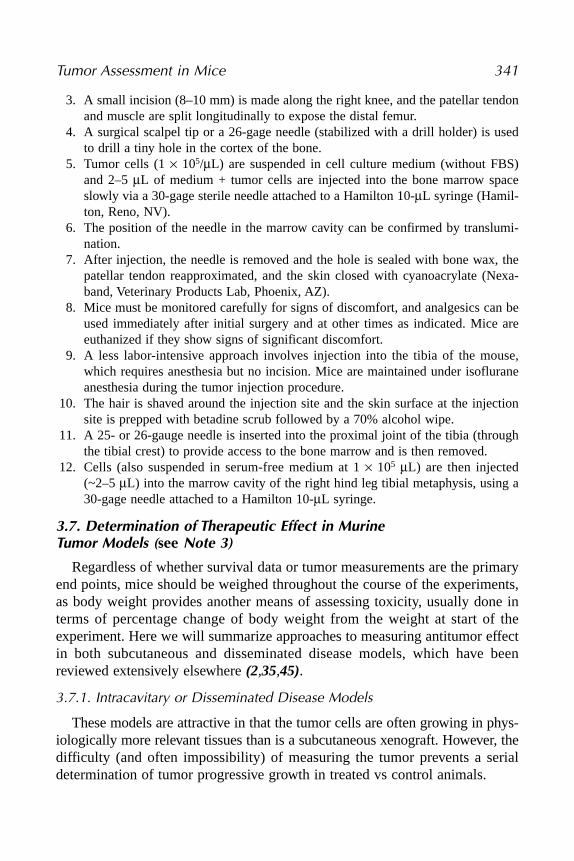
3. A small incision (8–10 mm) is made along the right knee, and the patellar tendonand muscle are split longitudinally to expose the distal femur.
4. A surgical scalpel tip or a 26-gage needle (stabilized with a drill holder) is usedto drill a tiny hole in the cortex of the bone.
5. Tumor cells (1 × 10⁵/µL) are suspended in cell culture medium (without FBS)and 2–5 µL of medium + tumor cells are injected into the bone marrow spaceslowly via a 30-gage sterile needle attached to a Hamilton 10-µL syringe (Hamil-ton, Reno, NV).
6. The position of the needle in the marrow cavity can be confirmed by translumi-nation.
7. After injection, the needle is removed and the hole is sealed with bone wax, thepatellar tendon reapproximated, and the skin closed with cyanoacrylate (Nexa-band, Veterinary Products Lab, Phoenix, AZ).
8. Mice must be monitored carefully for signs of discomfort, and analgesics can beused immediately after initial surgery and at other times as indicated. Mice areeuthanized if they show signs of significant discomfort.
9. A less labor-intensive approach involves injection into the tibia of the mouse,which requires anesthesia but no incision. Mice are maintained under isofluraneanesthesia during the tumor injection procedure.
10. The hair is shaved around the injection site and the skin surface at the injectionsite is prepped with betadine scrub followed by a 70% alcohol wipe.
11. A 25- or 26-gauge needle is inserted into the proximal joint of the tibia (throughthe tibial crest) to provide access to the bone marrow and is then removed.
12. Cells (also suspended in serum-free medium at 1 × 10⁵ µL) are then injected(~2–5 µL) into the marrow cavity of the right hind leg tibial metaphysis, using a30-gage needle attached to a Hamilton 10-µL syringe.
3.7. Determination of Therapeutic Effect in Murine Tumor Models (see Note 3)
Regardless of whether survival data or tumor measurements are the primaryend points, mice should be weighed throughout the course of the experiments,as body weight provides another means of assessing toxicity, usually done interms of percentage change of body weight from the weight at start of theexperiment. Here we will summarize approaches to measuring antitumor effectin both subcutaneous and disseminated disease models, which have beenreviewed extensively elsewhere (2,35,45).
3.7.1. Intracavitary or Disseminated Disease Models
These models are attractive in that the tumor cells are often growing in phys-iologically more relevant tissues than is a subcutaneous xenograft. However, thedifficulty (and often impossibility) of measuring the tumor prevents a serialdetermination of tumor progressive growth in treated vs control animals.
Tumor Assessment in Mice 341
1. Assessing disease burden in leukemia or neuroblastoma can be done using flowcytometry or polymerase chain reaction (PCR) from serial blood samples(10,34,46).
2. Nonetheless, the general end point remains survival from initiation of experimentuntil the animal is distressed or moribund (see Note 4).
3.7.2. Measures of Antitumor Effect in Disseminated Models
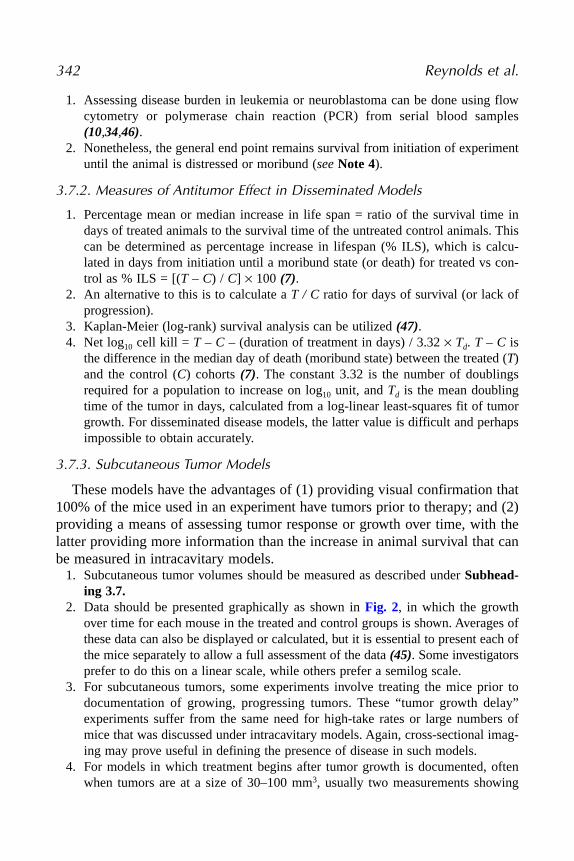
1. Percentage mean or median increase in life span = ratio of the survival time indays of treated animals to the survival time of the untreated control animals. Thiscan be determined as percentage increase in lifespan (% ILS), which is calcu-lated in days from initiation until a moribund state (or death) for treated vs con-trol as % ILS = [(T – C) / C] × 100 (7).
2. An alternative to this is to calculate a T / C ratio for days of survival (or lack ofprogression).
3. Kaplan-Meier (log-rank) survival analysis can be utilized (47).4. Net log10 cell kill = T – C – (duration of treatment in days) / 3.32 × Td. T – C is
the difference in the median day of death (moribund state) between the treated (T)and the control (C) cohorts (7). The constant 3.32 is the number of doublingsrequired for a population to increase on log10 unit, and Td is the mean doublingtime of the tumor in days, calculated from a log-linear least-squares fit of tumorgrowth. For disseminated disease models, the latter value is difficult and perhapsimpossible to obtain accurately.
3.7.3. Subcutaneous Tumor Models
These models have the advantages of (1) providing visual confirmation that100% of the mice used in an experiment have tumors prior to therapy; and (2)providing a means of assessing tumor response or growth over time, with thelatter providing more information than the increase in animal survival that canbe measured in intracavitary models.
1. Subcutaneous tumor volumes should be measured as described under Subhead-ing 3.7.
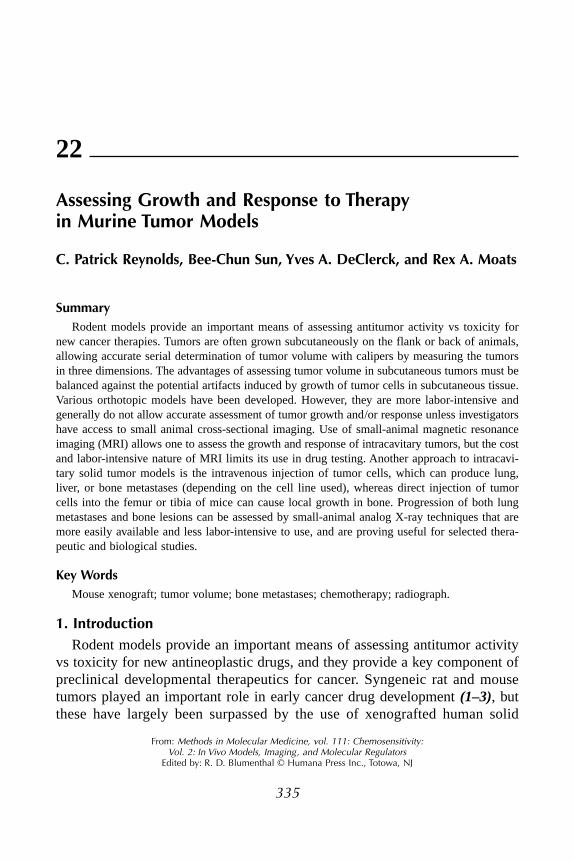
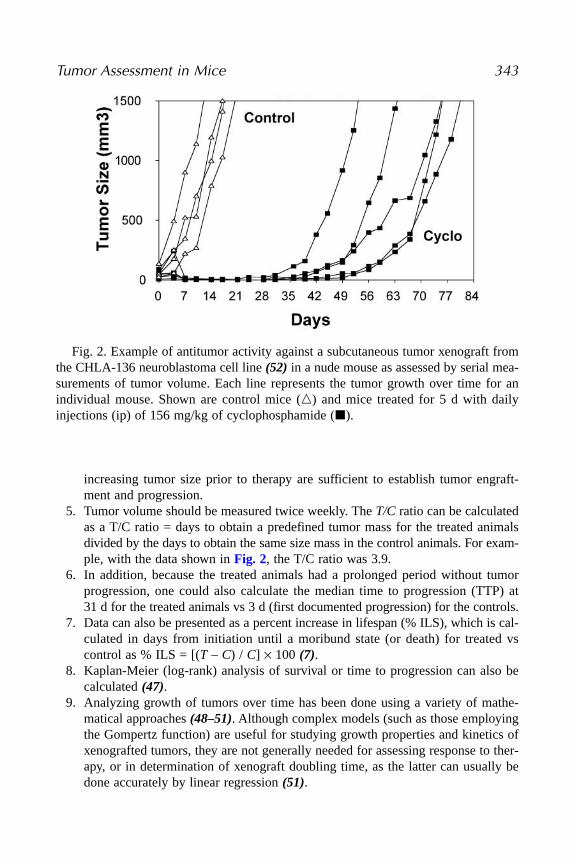
2. Data should be presented graphically as shown in Fig. 2, in which the growthover time for each mouse in the treated and control groups is shown. Averages ofthese data can also be displayed or calculated, but it is essential to present each ofthe mice separately to allow a full assessment of the data (45). Some investigatorsprefer to do this on a linear scale, while others prefer a semilog scale.
3. For subcutaneous tumors, some experiments involve treating the mice prior todocumentation of growing, progressing tumors. These “tumor growth delay”experiments suffer from the same need for high-take rates or large numbers ofmice that was discussed under intracavitary models. Again, cross-sectional imag-ing may prove useful in defining the presence of disease in such models.
4. For models in which treatment begins after tumor growth is documented, oftenwhen tumors are at a size of 30–100 mm3, usually two measurements showing
342 Reynolds et al.
increasing tumor size prior to therapy are sufficient to establish tumor engraft-ment and progression.
5. Tumor volume should be measured twice weekly. The T/C ratio can be calculatedas a T/C ratio = days to obtain a predefined tumor mass for the treated animalsdivided by the days to obtain the same size mass in the control animals. For exam-ple, with the data shown in Fig. 2, the T/C ratio was 3.9.
6. In addition, because the treated animals had a prolonged period without tumorprogression, one could also calculate the median time to progression (TTP) at31 d for the treated animals vs 3 d (first documented progression) for the controls.
7. Data can also be presented as a percent increase in lifespan (% ILS), which is cal-culated in days from initiation until a moribund state (or death) for treated vscontrol as % ILS = [(T – C) / C] × 100 (7).
8. Kaplan-Meier (log-rank) analysis of survival or time to progression can also becalculated (47).
9. Analyzing growth of tumors over time has been done using a variety of mathe-matical approaches (48–51). Although complex models (such as those employingthe Gompertz function) are useful for studying growth properties and kinetics ofxenografted tumors, they are not generally needed for assessing response to ther-apy, or in determination of xenograft doubling time, as the latter can usually bedone accurately by linear regression (51).
Tumor Assessment in Mice 343
Fig. 2. Example of antitumor activity against a subcutaneous tumor xenograft fromthe CHLA-136 neuroblastoma cell line (52) in a nude mouse as assessed by serial mea-surements of tumor volume. Each line represents the tumor growth over time for anindividual mouse. Shown are control mice (�) and mice treated for 5 d with dailyinjections (ip) of 156 mg/kg of cyclophosphamide (�).

10. For subcutaneously growing tumors, a log10 cell kill can also be calculated asfollows:
log10 cell kill = (T – C value in days) / (3.32)(Td)
where T – C (tumor growth delay) = days to reach a defined mass for the treatedanimals – days to reach the same mass for the control animals; 3.32 is the log10
unit constant; Td is the doubling time for the tumor in days (derived from the dou-bling time of the control tumors using a log2 (linear regression) formula (51).
3.8. Radiographic Assessment of Pulmonary Lesions
1. Mice are anesthesized under aseptic conditions and then are placed into Ziplockplastic sandwich bags to provide an aseptic barrier.
2. The Ziplock bags are sealed such that a pocket of the isofluorene/O2 mixture iscontained in the bag, providing sufficient gas for the few minutes needed to com-plete the X-ray.
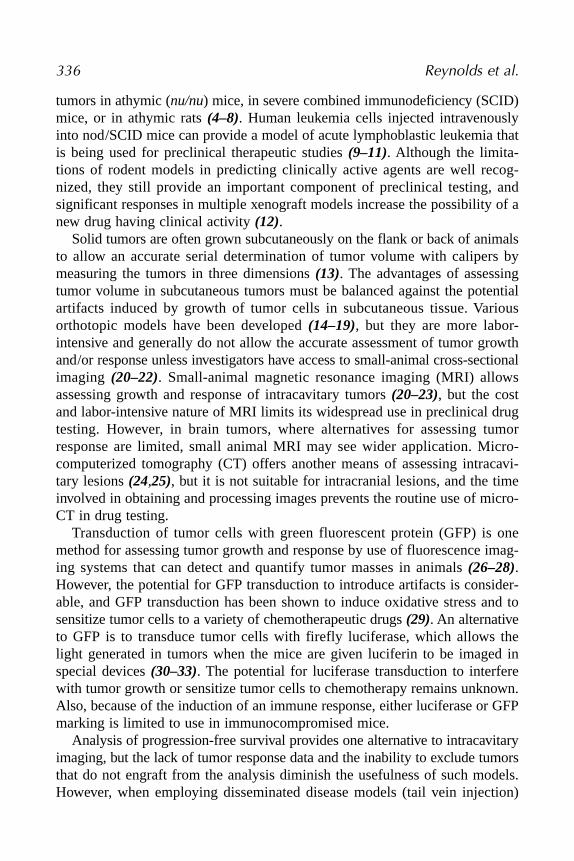
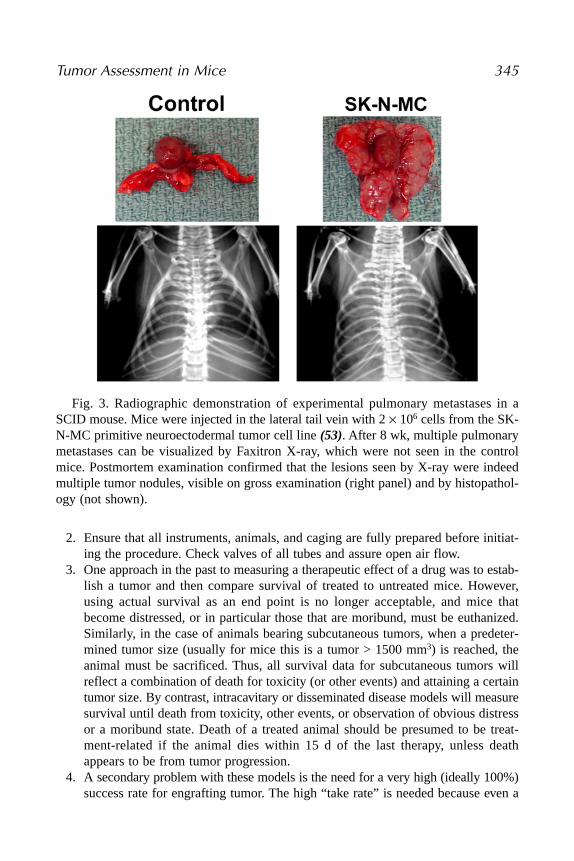
3. To provide a magnification factor for the radiographs, mice are positioned 10.5 cmbelow the radiation source, and the film placed at the bottom of the Faxitron,37.5 cm below the animal. This approach provides a magnification factor of4 times, with the thoracic cavity of the mouse filling about half the area of the18 × 24-cm mammography film. An example of pulmonary metastases from intra-venous injection of a primitive neuroectodermal tumor (PNET) cell line in a SCIDmouse is shown in Fig. 3.
3.9. Radiographic Assessment of Bone Lesions
1. To image bone lesions (direct-injection invasive lesions or metastases), radi-ographic procedures identical to those described for pulmonary lesions areemployed, except that the mouse is positioned to ensure imaging of the lowerportion of the mouse, including both legs.
2. We have developed a grading system for bone lesions in mice given direct tumorinjection into the femur that provides quantitative scoring of the bone lesions (seeNote 5). The grading system defines four grades: Grade 1 represents a normalbone when compared to the contralateral bone. Grade 2 lesions are asymmetric(relative to contralateral bone) and progressive radiolucent lesions limited to thesite of injection. Grade 3 shows asymmetrical and progressive radiolucent areasextending beyond the distal femur. Grade 4 lesions contain a pathological fractureof the bone or a breach in the bone cortex.
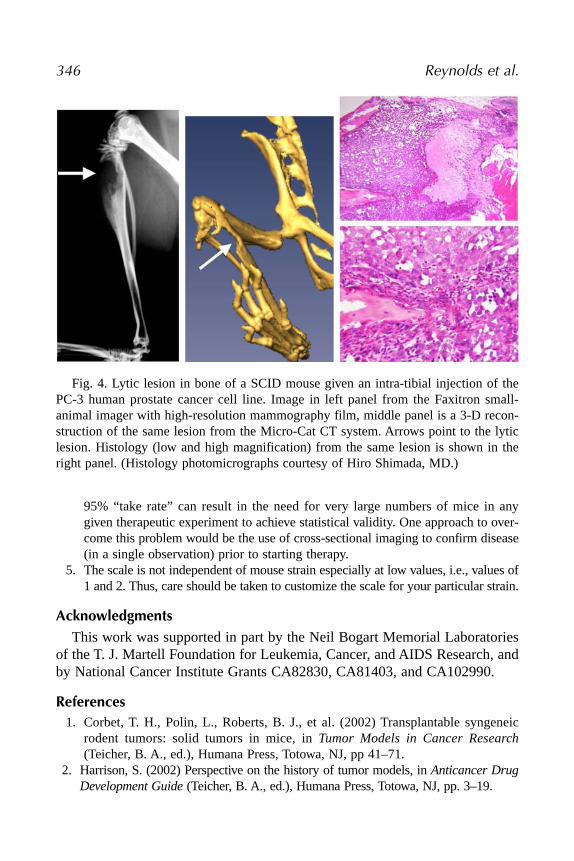
3. The time to develop a Grade 4 lesion can be used as a relative end point to deter-mine tumor progression and/or response to therapy (41). An example of a lyticbone lesion from direct injection of a prostate cancer cell line into an athymicmouse is shown in Fig. 4.
4. Notes1. Transfer of tumors in this fashion can be repeated many times, but to avoid genetic
drift from the original cell line one should limit such transfers to six or less.
344 Reynolds et al.
2. Ensure that all instruments, animals, and caging are fully prepared before initiat-ing the procedure. Check valves of all tubes and assure open air flow.
3. One approach in the past to measuring a therapeutic effect of a drug was to estab-lish a tumor and then compare survival of treated to untreated mice. However,using actual survival as an end point is no longer acceptable, and mice thatbecome distressed, or in particular those that are moribund, must be euthanized.Similarly, in the case of animals bearing subcutaneous tumors, when a predeter-mined tumor size (usually for mice this is a tumor > 1500 mm3) is reached, theanimal must be sacrificed. Thus, all survival data for subcutaneous tumors willreflect a combination of death for toxicity (or other events) and attaining a certaintumor size. By contrast, intracavitary or disseminated disease models will measuresurvival until death from toxicity, other events, or observation of obvious distressor a moribund state. Death of a treated animal should be presumed to be treat-ment-related if the animal dies within 15 d of the last therapy, unless deathappears to be from tumor progression.
4. A secondary problem with these models is the need for a very high (ideally 100%)success rate for engrafting tumor. The high “take rate” is needed because even a
Tumor Assessment in Mice 345
Fig. 3. Radiographic demonstration of experimental pulmonary metastases in aSCID mouse. Mice were injected in the lateral tail vein with 2 × 10⁶ cells from the SK-N-MC primitive neuroectodermal tumor cell line (53). After 8 wk, multiple pulmonarymetastases can be visualized by Faxitron X-ray, which were not seen in the controlmice. Postmortem examination confirmed that the lesions seen by X-ray were indeedmultiple tumor nodules, visible on gross examination (right panel) and by histopathol-ogy (not shown).
95% “take rate” can result in the need for very large numbers of mice in anygiven therapeutic experiment to achieve statistical validity. One approach to over-come this problem would be the use of cross-sectional imaging to confirm disease(in a single observation) prior to starting therapy.
5. The scale is not independent of mouse strain especially at low values, i.e., values of1 and 2. Thus, care should be taken to customize the scale for your particular strain.
AcknowledgmentsThis work was supported in part by the Neil Bogart Memorial Laboratories
of the T. J. Martell Foundation for Leukemia, Cancer, and AIDS Research, andby National Cancer Institute Grants CA82830, CA81403, and CA102990.
References1. Corbet, T. H., Polin, L., Roberts, B. J., et al. (2002) Transplantable syngeneic
rodent tumors: solid tumors in mice, in Tumor Models in Cancer Research(Teicher, B. A., ed.), Humana Press, Totowa, NJ, pp 41–71.
2. Harrison, S. (2002) Perspective on the history of tumor models, in Anticancer DrugDevelopment Guide (Teicher, B. A., ed.), Humana Press, Totowa, NJ, pp. 3–19.
346 Reynolds et al.
Fig. 4. Lytic lesion in bone of a SCID mouse given an intra-tibial injection of thePC-3 human prostate cancer cell line. Image in left panel from the Faxitron small-animal imager with high-resolution mammography film, middle panel is a 3-D recon-struction of the same lesion from the Micro-Cat CT system. Arrows point to the lyticlesion. Histology (low and high magnification) from the same lesion is shown in theright panel. (Histology photomicrographs courtesy of Hiro Shimada, MD.)
3. Waud, W. R. (1997) Murine L1210 and P388 leukemias, in Anticancer DrugDevelopment Guide: Preclinical Screening, Clinical Trials, and Approval (Teicher,B. A., ed.), Humana Press, Totowa, NJ, pp. 59–74.
4. Fiebig, H. H. and Burger, A. M. (2002) Human tumor xenografts and explants, inTumor Models in Cancer Research (Teicher, B. A., ed.), Humana Press, Totowa,NJ, pp. 113–137.
5. Mattern, J., Bak, M., Hahn, E. W., and Volm, M. (1988) Human tumor xenograftsas model for drug testing. Cancer Metastasis Rev. 7, 263–284.
6. Houghton, P. J., Adamson, P. C., Blaney, S., et al. (2002) Testing of new agents inchildhood cancer preclinical models: meeting summary. Clin. Cancer Res. 8,3646–3657.
7. Plowman, J., Dykes, D. J., Hollingshead, M., Simpson-Herren, L., and Alley, M. C.(1997) Human tumor xenograft models in NCI drug development, in AnticancerDrug Development Guide: Preclinical Screening, Clinical Trials, and Approval(Teicher, B. A., ed.), Humana Press, Totowa, NJ, pp. 101–125.
8. Shimosato, Y., Kameya, T., and Hirohashi, S. (1979) Growth, morphology, andfunction of xenotransplanted human tumors. Pathol. Annu. 14(pt 2), 215–257.
9. Lock, R. B., Liem, N., Farnsworth, M. L., et al. (2002) The nonobese diabetic/severe combined immunodeficient (NOD/SCID) mouse model of childhood acutelymphoblastic leukemia reveals intrinsic differences in biologic characteristics atdiagnosis and relapse. Blood 99, 4100–4108.
10. Lock, R. B., Liem, N. L., and Papa, R. A. (2005) Preclinical testing of anti-leukemic drugs using an in vivo model of systemic disease. Chemosensitivity;Volume 2. In Vivo Models, Imaging, and Molecular Regulators (Blumenthal, R. D.,ed.), Humana, Totowa, NJ (in press, this volume).
11. Lehne, G., Sorensen, D. R., Tjonnfjord, G. E., et al. (2002) The cyclosporin PSC833 increases survival and delays engraftment of human multidrug-resistantleukemia cells in xenotransplanted NOD-SCID mice. Leukemia 16, 2388–2394.
12. Johnson, J. I., Decker, S., Zaharevitz, D., et al. (2001) Relationships between drugactivity in NCI preclinical in vitro and in vivo models and early clinical trials. [seecomment]. Br. J. Cancer 84, 1424–1431.
13. Tomayko, M. M. and Reynolds, C. P. (1989) Determination of subcutaneous tumorsize in athymic (nude) mice. Cancer Chemother. Pharmacol. 24, 148–154.
14. Manzotti, C., Audisio, R. A., and Pratesi, G. (1993) Importance of orthotopicimplantation for human tumors as model systems: relevance to metastasis and inva-sion. Clin. Exp. Metastasis 11, 5–14.
15. Kubota,T. (1994) Metastatic models of human cancer xenografted in the nudemouse: the importance of orthotopic transplantation. J. Cell. Biochem. 56, 4–8.
16. Khanna, C., Jaboin, J. J., Drakos, E., Tsokos, M., and Thiele, C. J. (2002) Bio-logically relevant orthotopic neuroblastoma xenograft models: primary adrenaltumor growth and spontaneous distant metastasis. In Vivo 16, 77–85.
17. Khanna, C., Prehn, J., Yeung, C., Caylor, J., Tsokos, M., and Helman, L. (2000) Anorthotopic model of murine osteosarcoma with clonally related variants differing inpulmonary metastatic potential. Clin. Exp. Metastasis 18, 261–271.
Tumor Assessment in Mice 347
18. Shoji, T., Konno, H., Tanaka, T., et al. (2003) Orthotopic implantation of a coloncancer xenograft induces high expression of cyclooxygenase-2. Cancer Lett. 195,235–241.
19. El Galley, R., Keane, T. E., and Sun, C. (2003) Camptothecin analogues and vin-blastine in the treatment of renal cell carcinoma: an in vivo study using a humanorthotopic renal cancer xenograft. Urol. Oncol. 21, 49–57.
20. Kikuchi, E., Xu, S., Ohori, M., et al. (2003) Detection and quantitative analysis ofearly stage orthotopic murine bladder tumor using in vivo magnetic resonanceimaging. J. Urol. 170, 1375–1378.
21. Moats, R., Ma, L. Q., Wajed, R., et al. (2000) Magnetic resonance imaging forthe evaluation of a novel metastatic orthotopic model of human neuroblastoma inimmunodeficient mice. Clin. Exp. Metastasis 18, 455–461.
22. Grimm, J., Potthast, A., Wunder, A., and Moore, A. (2003) Magnetic resonanceimaging of the pancreas and pancreatic tumors in a mouse orthotopic model ofhuman cancer. Int. J. Cancer 106, 806–811.
23. Nelson, A. L., Algon, S. A., Munasinghe, J., et al. (2003) Magnetic resonanceimaging of patched heterozygous and xenografted mouse brain tumors. J. Neuro-Oncol. 62, 259–267.
24. Paulus, M. J., Gleason, S. S., Easterly, M. E., and Foltz, C. J. (2001) A review ofhigh-resolution X-ray computed tomography and other imaging modalities forsmall animal research. [Erratum appears in Lab Anim (NY) 2001 May;30(5):13].Lab Anim 30, 36–45.
25. Paulus, M. J., Gleason, S. S., Kennel, S. J., Hunsicker, P. R., and Johnson, D. K.(2000) High resolution X-ray computed tomography: an emerging tool for smallanimal cancer research. Neoplasia (NY) 2, 62–70.
26. Ito, S., Nakanishi, H., Ikehara, Y., et al. (2001) Real-time observation ofmicrometastasis formation in the living mouse liver using a green fluorescent pro-tein gene-tagged rat tongue carcinoma cell line. [Erratum appears in Int. J. Cancer2002 Feb 20;97(6):878]. Int. J. Cancer 93, 212–217.
27. Hoffman, R. M. (1024) Visualization of GFP-expressing tumors and metastasis invivo. Biotechniques 30, 1016–1022.
28. Yang, M., Baranov, E., Jiang, P., et al. (2000) Whole-body optical imaging of greenfluorescent protein-expressing tumors and metastases. Proc. Natl. Acad. Sci. USA97, 1206–1211.
29. Goto, H., Yang, B., Petersen, D., et al. (2003) Transduction of green fluorescentprotein increased oxidative stress and enhanced sensitivity to cytotoxic drugs inneuroblastoma cell lines. Mol. Cancer Ther. 2, 911–917.
30. Zhang, L., Hellstrom, K. E., and Chen, L. (1994) Luciferase activity as a markerof tumor burden and as an indicator of tumor response to antineoplastic therapy invivo. Clin. Exp. Metastasis 12, 87–92.
31. Rice, B. W., Cable, M. D., and Nelson, M. B. (2001) In vivo imaging of light-emitting probes. J. Biomed. Optics 6, 432–440.
348 Reynolds et al.
32. Edinger, M., Sweeney, T. J., Tucker, A. A., Olomu, A. B., Negrin, R. S., andContag, C. H. (1999) Noninvasive assessment of tumor cell proliferation in animalmodels. Neoplasia (NY) 1, 303–310.
33. El Hilali, N., Rubio, N., Martinez-Villacampa, M., and Blanco, J. (2002) Com-bined noninvasive imaging and luminometric quantification of luciferase-labeledhuman prostate tumors and metastases. Lab. Invest. 82, 1563–1571.
34. Thompson, J., Guichard, S. M., Cheshire, P. J., et al. (2001) Development, char-acterization and therapy of a disseminated model of childhood neuroblastoma inSCID mice. Cancer Chemother. Pharmacol. 47, 211–221.
35. Teicher, B. A. (2002) In vivo tumor response end points, in Tumor Models inCancer Research (Teicher, B. A., ed.), Humana Press, Totowa, NJ, pp. 593–616.
36. Menon, K. and Teicher, B. A. (2002) Metastasis models Lungs, spleen/liver, bone,brain, in Tumor Models in Cancer Research (Teicher, B. A., ed.), Humana Press,Totowa, NJ, pp. 277–291.
37. Iwasaki, T., Mukai, M., Tsujimura, T., et al. (2002) Ipriflavone inhibits osteolyticbone metastasis of human breast cancer cells in a nude mouse model. Int.J. Cancer 100, 381–387.
38. Yi, B., Williams, P. J., Niewolna, M., Wang, Y., and Yoneda, T. (2002) Tumor-derived platelet-derived growth factor-BB plays a critical role in osteoscleroticbone metastasis in an animal model of human breast cancer. Cancer Res. 62,917–923.
39. Peyruchaud, O., Winding, B., Pecheur, I., Serre, C. M., Delmas, P., and Clezardin,P. (2001) Early detection of bone metastases in a murine model using fluorescenthuman breast cancer cells: application to the use of the bisphosphonate zoledronicacid in the treatment of osteolytic lesions. J. Bone Miner. Res. 16, 2027–2034.
40. Corey, E., Quinn, J. E., Bladou, F., et al. (2002) Establishment and characterizationof osseous prostate cancer models: intra-tibial injection of human prostate cancercells. Prostate 52, 20–33.
41. Sohara, Y., Shimada, H, Scadeng, M, et al. (2003) Lytic bone lesions in a humanneuroblastoma xenogaft show osteo-clast recruitment and are inhibited by iban-dronate. Cancer Res. 63, 3026–3031.
42. Worzalla, J. F., Bewley, J. R., and Grindey, G. B. (1990) Automated measurementof transplantable solid tumors using digital electronic calipers interfaced to amicrocomputer. Invest. New Drugs 8, 241–251.
43. Reynolds, C. P., Biedler, J. L., Spengler, B. A., et al. (1986) Characterization ofhuman neuroblastoma cell lines established before and after therapy. J. Natl.Cancer Inst. 76, 375–387.
44. Meyer, R. E., Braun, R. D., and Dewhirst, M. W. (2002) Anesthetic considerationsfor the study of murine tumor models, in Tumor Models in Cancer Research(Teicher, B. A., ed.), Humana Press, Totowa, NJ, pp. 407–431.
45. Begg, A. C. (1980) Analysis of growth delay data: potential pitfalls. Br. J. CancerSuppl. 41, 93–97.
Tumor Assessment in Mice 349
46. Dialynas, D. P., Shao, L., Billman, G. F., and Yu, J. (2001) Engraftment of humanT-cell acute lymphoblastic leukemia in immunodeficient NOD/SCID mice whichhave been preconditioned by injection of human cord blood. Stem Cells 19,443–452.
47. Fleming, T. R. and Lin, D. Y. (2000) Survival analysis in clinical trials: pastdevelopments and future directions. Biometrics 56, 971–983.
48. G. Gordon Steel. (1977) Growth Kinetics of Tumoours Cell Population Kinetics inRelations to the Growth and Treatment of Cancer. Clarendon Press, Oxford.
49. Demicheli, R., Pratesi, G., and Foroni, R. (1991) The exponential-Gompertziantumor growth model: data from six tumor cell lines in vitro and in vivo. Estimateof the transition point from exponential to Gompertzian growth and potential clin-ical implications. Tumori 77, 189–195.
50. Rygaard, K. and Spang-Thomsen, M. (1997) Quantitation and gompertzian analy-sis of tumor growth. Breast Cancer Res. Treatment 46, 303–312.
51. Zwicker, J. I., Proffitt, R. T., and Reynolds, C. P. (1996) A microcomputer programfor calculating cell population doubling time in vitro and in vivo. Cancer Chemother.Pharmacol. 37, 203–210.
52. Keshelava, N., Zuo, J. J., Chen, P., et al. (2001) Loss of p53 function confers high-level multi-drug resistance in neuroblastoma cell lines. Cancer Res. 61,5103–5105.
53. Wang, Y., Einhorn, P., Triche, T. J., Seeger, R. C., and Reynolds, C. P. (2000)Expression of protein gene product 9.5 and tyrosine hydroxylase in childhoodsmall round cell tumors. Clin. Cancer Res. 6, 551–558.
350 Reynolds et al.


![RESEARCH ARTICLE Establishment of a Murine Graft-versus ... · of the curative potential of allografts is attributed to the ‘‘graft-versus-tumor’’ (GvT) effect [4]. In MM,](https://static.fdocuments.in/doc/165x107/5f3590abebab9b13db2308bc/research-article-establishment-of-a-murine-graft-versus-of-the-curative-potential.jpg)