Phosphaturic mesenchymal tumor of the brain without tumor ...
Upload
nguyentramCategory
view
216download
0
PRECLINICAL ANDCLINICAL IMAGING -
Full Papers
Assessing Tumor Cytoarchitecture Using MultiechoDSC-MRI Derived Measures of the TransverseRelaxivity at Tracer Equilibrium (TRATE)
Natenael B. Semmineh,1,2 Junzhong Xu,1,3 Jack T. Skinner,1,3 Jingping Xie,1
Hua Li,1,2 Gregory Ayers,4 and C. Chad Quarles1,2,3,5,6*
Purpose: In brain tumor dynamic susceptibility contrast(DSC)-MRI studies, multiecho acquisition methods are used to
quantify the dynamic changes in T1 and T2* that occur whencontrast agent (CA) extravasates. Such methods also enablethe estimation of the effective tissue CA transverse relaxivity.
The goal of this study was to evaluate the sensitivity of thetransverse relaxivity at tracer equilibrium (TRATE) to tumorcytoarchitecture.
Methods: Computational and in vitro studies were used toevaluate the biophysical basis of TRATE. In 9L, C6, and
human brain tumors, TRATE, the apparent diffusion coeffi-cient (ADC), the CA transfer constant (Ktrans), the extravascu-lar extracellular volume fraction (ve), and histological data
were compared.Results: Simulations and in vitro results indicate that TRATE is
highly sensitive to variations in cellular properties such as cellsize and density. The histologic cell density and TRATE valueswere significantly higher in 9L tumors as compared to C6
tumors. In animal and human tumors, a voxel-wise compari-son of TRATE with ADC, ve, and Ktrans maps showed low spa-
tial correlation.Conclusion: The assessment of TRATE is clinically feasible andits sensitivity to tissue cytoarchitectural features not present in
other imaging methods indicate that it could potentially serveas a unique structural signature or “trait” of cancer. MagnReson Med 74:772–784, 2015. VC 2014 Wiley Periodicals, Inc.
Key words: dynamic susceptibility contrast; transverse relaxa-
tion; vascular structures; cellular structures; contrast agentleakage; contrast agent equilibrium
INTRODUCTION
The assessment of perfusion parameters using dynamicsusceptibility contrast (DSC)-MRI has proven useful forassessing tumor grade (1–7) and treatment response(3,8–12). In normal brain regions, with an intact blood–brain barrier (BBB), the biophysical basis of the acquiredDSC-MRI signal is well characterized, primarily reflect-ing the underlying contrast agent (CA) kinetics and vas-cular geometry (13). When the BBB is disrupted, smallmolecular weight contrast agents (CA), such asgadolinium-diethylenetriaminepentaacetic acid (Gd-DTPA) may extravasate, leading to dynamic changes inthe tissue T1, T2, and T2* relaxation times. In such cases,DSC-MRI signals are more complex and depend onhemodynamics, vascular geometry and permeability, theextravascular microstructure and the applied pulsesequence (14–16). When DSC-MRI signals are acquiredand processed without consideration of CA extravasa-tion, the derived hemodynamic parameters are wellknown to be unreliable (4,5,17). Several techniques havebeen proposed and used to correct for T1 and T2* leak-age effects (14,17–22).
In addition to improving the reliability of DSC-MRIdata acquired in the presence of CA leakage, there is anincreased interest in leveraging the temporal characteris-tics of such signals to estimate additional biologicalinformation. Pharmacokinetic modeling of DSC-MRI sig-nals in brain tumors has been used to extract CA extrava-sation rate constants (e.g., Ktrans) and the extravascularextracellular volume fraction (ve) (18,22–26). The appear-ance of leakage effects on DSC-MRI signals, whether theyare predominantly T1 or T2*-based, has been character-ized by the percent signal recovery (PSR), a parameterpotentially capable of differentiating between gliomas,metastasis and lymphomas (27). Recent studies haveshown that CA leakage-induced T2* effects are depend-ent upon the extravascular geometry (14–16,28,29) andby quantifying these effects, new imaging biomarkersmay be derived (16). Once validated, such parameterscould improve the characterization of brain tumors.
1Institute of Imaging Science, Vanderbilt University, Nashville, Tennessee,USA.2Department of Physics and Astronomy, Vanderbilt University, Nashville,Tennessee, USA.3Department of Radiology and Radiological Sciences, Vanderbilt University,Nashville, Tennessee, USA.4Department of Biostatistics, Vanderbilt University, Nashville, Tennessee,USA.5Department of Biomedical Engineering, Vanderbilt University, Nashville,Tennessee, USA.6Department of Cancer Biology, Vanderbilt University, Nashville, Tennessee,USA.
Grant sponsor: NIH/NCI; Grant numbers: K99/R00 CA127599, R01CA158079, P30 CA068485; Grant sponsor: NCI; Grant numbers: U24CA126588, K25 CA168936.
*Correspondence to: C. Chad Quarles, Ph.D., Vanderbilt University Instituteof Imaging Science, Department of Radiology and Radiological Sciences,Vanderbilt University, 1161 21st Avenue South, AA 1105 Medical CenterNorth, Nashville, TN 37232-2310. E-mail: [email protected]
Additional Supporting Information may be found in the online version ofthis article.
Received 13 January 2014; revised 6 August 2014; accepted 10 August2014
DOI 10.1002/mrm.25435Published online 16 September 2014 in Wiley Online Library(wileyonlinelibrary.com).
Magnetic Resonance in Medicine 74:772–784 (2015)
VC 2014 Wiley Periodicals, Inc. 772
Currently, multiecho DSC-MRI, along with a precon-trast T1 map, is used to characterize T1 and T2* leakageeffects, as this enables their simultaneous separation andquantification (15,16,22,24). The dynamic T1 change ena-bles estimation of the tissue CA concentration. Combin-ing the CA concentration with the dynamic T2* changesenables the assessment of the tissue CA transverse (T2*)relaxivity. Recently, Sourbron et al used this approach incolorectal cancer xenografts to evaluate the vascular andextravascular CA relaxivity, and found that it providedsupplementary information on tumor microstructure thatis distinct from traditional compartmental volume frac-tion measurements (16).
In this study, we aimed to evaluate whether multiechoDSC-MRI derived measures of the transverse relaxivity attracer equilibrium (TRATE) may be used to evaluatebrain tumor cytoarchitecture. To validate the sensitivityof TRATE to tumor cellular features we use three-dimensional (3D) biophysical simulations and compareits characteristics in vitro and in two animal brain tumormodels that are known to have histologically differentcellular properties. We also present initial results ofTRATE data in a cohort of glioma patients. The TRATEmaps are spatially compared with parameters tradition-ally derived from DSC-MRI, dynamic contrast enhanced(DCE)-MRI and diffusion weighted imaging (DWI) to pre-liminarily assess its potential to provide unique sensitiv-ity to microstructural features not assessed with thesetechniques.
METHODS
Theory
When CA extravasation effects are present, the tissuetransverse relaxation rate depends on both dipole–dipolemicroscopic interactions between the CA and water pro-tons and mesoscopic effects due to magnetic field pertur-bation induced by CA compartmentalization withinvascular walls and around cells. Models have been pre-viously proposed (14–16,18), that incorporate bothmicroscopic and mesoscopic contributions to the meas-ured transverse relaxation rate change (DR2*):
DR�2 ¼ r2 veCe þ vpCp
� �þ r�2pvp vejCp � Cej þ viCp
� �þ r�2eveviCe [1]
Here ve, vi, and vp denote volume fractions of theextravascular extracellular space (EES), extravascularintracellular space (EIS), and vascular space, respec-tively. Ce and Cp represent the CA concentration of theEES and the vascular space, r2p
* and r2e* are the effective
T2* relaxivities of CA compartmentalized within the vas-cular space and EES, and r2 is the CA T2 relaxivity.
This model expresses the tissue CA concentration (Ct)as the sum of individual compartment CA concentra-tions weighted by the corresponding volume fractions(Ct¼ veCeþ vpCp), and assumes that the CA does notpenetrate into cells and a fast water exchange process.At time points well past the first pass of CA, when Ce
and Cp are approximately equivalent, Eq. [1] can bewritten as:
DR�2 ¼ r2 þvi
vp þ vevpr�2p þ ver�2e
� �� �Ct [2]
The first bracketed term in Eq. [2] can be consideredthe effective tissue transverse relaxivity at CA equilib-rium (r�2t;eq) and will be termed the transverse relaxivityat tracer equilibrium (TRATE) hereafter. With this defini-tion, Eq. [2] simplifies to:
DR�2 ¼ r�2t;eq � Ct [3]
With multiecho DSC-MRI data and a precontrast T1
map the tissue CA concentration and the DR2* can becomputed using the extracted T1 and T2* changes,respectively, thereby enabling the computation ofTRATE.
Simulations
To investigate the dependence of TRATE on tissue vas-cular and cellular features, simulated 3D tissue struc-tures were created using randomly packed ellipsoidsaround fractal tree based vascular networks (29). Vascu-lar networks that mimic the architecture found in normaland tumor tissue were computed using a fractal treeapproach (30,31). To achieve cell densities and cellularorientation heterogeneity that approximate those foundin vivo, we used randomly packed ellipsoids to modelthe extravascular space (32). Magnetic field perturbationsinduced by susceptibility variations between the simu-lated tissue compartments and the associated gradientecho transverse relaxation rates were computed usingthe finite perturber finite difference method (FPFDM)(29). In addition to a binary 3D matrix that defines thetissue structure, the FPFDM requires, as input, the staticmagnetic field strength, the susceptibility differencebetween simulated tissue compartments, the water diffu-sion coefficient, and pulse sequence parameters.
For CA concentration levels corresponding to tracerequilibrium, the slope of the computed DR2* versus Ct
was used to estimate TRATE. To investigate the relativecontribution of the vascular and extravascular features toTRATE measurements, the signal relaxation was com-puted using tissue models with fixed cellular featuresand variable vascular volume fractions. Furthermore, toevaluate the dependence of DR2* and TRATE on cellularfeatures, such as cell volume fraction and cell size, thevascular volume fraction was kept fixed while these fea-tures were systematically varied.
Unless mentioned otherwise, all simulation studieswere carried out using the following input parameters.All input tissue structures consisted of a (0.25 mm)3 3Dvolume sampled with 2563 simulation grids. Therestricted water diffusion coefficient (D) was set to 1.3 �10�3 mm2/s (33) and clinically relevant TE and B0 valuesof 40 ms and 3T were chosen. The susceptibility differ-ence between compartments was calculated usingDx¼ xm. [CA], where [CA] is compartmental CA concen-tration and xm is the CA molar susceptibility (0.027 �10�6 mM�1) (34). While the susceptibility-induced relax-ation was computed using the FPFDM, the relativelysmall effects of microscopic transverse relaxation were
DSC-MRI Assessment of Tumor Cellularity 773
calculated and included using the product of Ct and theGd-DTPA T2 relaxivity (r2¼ 4.5 mM�1 s�1) (35). All sim-ulations were performed in Matlab (Mathworks, Natick,MA).
Animal Studies
Measures of TRATE were compared in two rodent braintumor models, the C6 glioblastoma and 9L gliosarcoma.Seven male Wistar rats and nine male Fischer rats (Har-lan, Indianapolis, IN) were inoculated with 1 � 105 C6and 1 � 105 9L cells (American Type Culture Collection,Manassas, VA), respectively. Before all surgical andimaging procedures, animals were immobilized in a ste-reotactic head holder. Anesthesia was induced by meansof a 5%/95% isoflurane/oxygen mixture and maintainedby means of a 2%/95% isoflurane/oxygen mixture.
All experiments were carried out 14–16 days aftertumor inoculation and adhered to our institution’s ani-mal care and use committee policies. Scans were con-ducted at 4.7 Tesla (T) (Agilent) with a Doty shieldedLitz coil (38 mm inside diameter). A precontrast T1 (T10)map was obtained using a gradient-echo based multipleflip angle approach with the following parameters: repe-tition time (TR)¼ 200 ms, echo time (TE)¼ 2 ms, field ofview (FOV)¼ (40 mm)2, slice thickness (ST)¼2.0 mm,matrix¼ 642, five flip angles (FA) (ranging from 12� to60�), and 4 excitations. A multiecho fast low angle shotsequence was used to acquire DSC-MRI data with a tem-poral resolution of one image per second for a total dura-tion of 17 min with: TR¼15.625 ms, TE1/TE2¼ 4/8 ms,FOV¼ (40 mm)2, ST¼ 2.0 mm, FA¼9�, and matrix¼ 642.After the acquisition of 60 baseline images, a bolus ofGd-DTPA (0.2 mmol kg�1 per body weight) was intrave-nously delivered using a power injector at an infusionrate of 2.4 mL/min. As described above, the multiechoDSC-MRI sequence was used to quantify T1 and T2* timeseries. The precontrast T1 maps were combined with theT1-weighted time series to derive DR1 (36). The last 2min of the DR1 and DR2* time series data were then usedto compute TRATE using:
Ct ¼ DR1�
r1; and r�2t;eq ¼ DR�2
�Ct
[4]
where r1 is the Gd-DTPA T1 relaxivity (3.9 mM�1 s�1)(35).
The reference region pharmacokinetic model wasapplied to the DR1 time series to compute the DCE-MRIparameters, ve and Ktrans (24,37). Furthermore, DWI wasperformed to estimate ADC maps using a fast spin echosequence with diffusion gradients applied along threedirections. All diffusion data were obtained usingTR¼ 2000 ms, TE¼ 30 ms, FOV¼ (40 mm)2, ST¼ 1.0 mm,matrix¼ 642, separation of diffusion gradients D¼ 15 ms,effective diffusion pulse duration d¼ 3 ms, diffusion time(D - d/3)¼ 14 ms, and five diffusion gradient amplitudesvaried from 0 to 33 G/cm (b¼0 to 1000 s/mm2).
For region of interest (ROI) analysis the tumor ROIswere manually defined on the dynamic contrast enhancedimages. All voxels exhibiting contrast enhancement onthe last image of the dynamic time series were includedin the ROI. Same-sized normal tissue ROIs were selected
in contralateral brain in the same slices as that used forthe tumor ROIs.
To evaluate tumor cellularity, all animals were killedafter the MRI exams, the tumor tissue dissected and fixedin 10% formalin, cut into 5-mm sections and stained withhematoxylin and eosin (H&E). The H&E slides were digi-tally scanned and analyzed to quantify cell nuclei countusing an Ariol SL-50 automated scanning microscope. Amanual threshold approach is used to discern betweenthe intra- and extracellular spaces to estimate cell volumefraction. The cell nuclei count along with an assumed cir-cular cell shape was used to obtain estimates of the meancell size for each tumor cell line.
In addition to the animals studies described above invitro cell studies were also used to investigate the bio-physical basis of TRATE as described in Supporting Fig-ure S2 (which is available online).
Clinical Studies
Five patients (4 male 1 female), age (51–66 years old)with a recurrent high-grade glioma was scanned at 3T(Philips Healthcare, Cleveland, OH) using a 32-channelhead coil. Multiple FA data was acquired (TR¼ 7.6 ms,TE¼ 3.7 ms, FA¼ 2�–20� in 2� increments, FOV¼ 240 �240 mm2, ST¼5 mm, matrix¼ 962) to produce a T10
map. Next, a multiecho single-shot echo planar imagingacquisition (TR¼ 1.5 s, TE1/TE2¼ 7/31 ms, FOV¼ 240 �240 mm2, ST¼ 5 mm, matrix¼ 962) was performedbefore, during, and after administration of 0.1 mmol/kgGd-DTPA at an infusion rate of 4 mL/s (followed by asaline flush). The scan duration was 7.5 min and fol-lowed all guidelines set by the Vanderbilt UniversityInstitutional Review Board. Measures of DR2* and DR1
were calculated from the multiecho data for the entiretime-course (36). DSC-MRI perfusion maps were calcu-lated from the DR2* measurements and an automatedmeasure of the arterial input function, using circularSVD-based deconvolution (38). Maps of Ktrans, ve, andADC (DW SE-ssEPI, TR¼ 6 s, TE¼ 44 ms, number ofexcitations¼2, b¼100 and 1000 s/mm2) were also com-puted. Voxel wise estimates of Ct and TRATE were cal-culated using Eq. [4].
Statistical Analysis
Single variable and multivariable associations betweencell density and TRATE in animals were estimated usingstandard regression analysis. Statistical relationshipsbetween TRATE and Ktrans, ADC, and ve were performedusing both ROI and voxel-wise analysis. For ROI analy-sis, standard linear regression relationships betweenmean parameters for each animal or patient were used.Voxel-wise prediction of TRATE by cell line, and Ktrans,ADC, and ve were conducted using analysis of covari-ance in a generalized linear model assuming a normaldistribution, the identity link with an exchangeablecovariance working model. Generalized estimating equa-tions were used to account for intravoxel correlationwithin animals or humans. Standard goodness-of-fitand residual analyses were conducted and foundunremarkable.
774 Semmineh et al.
RESULTS
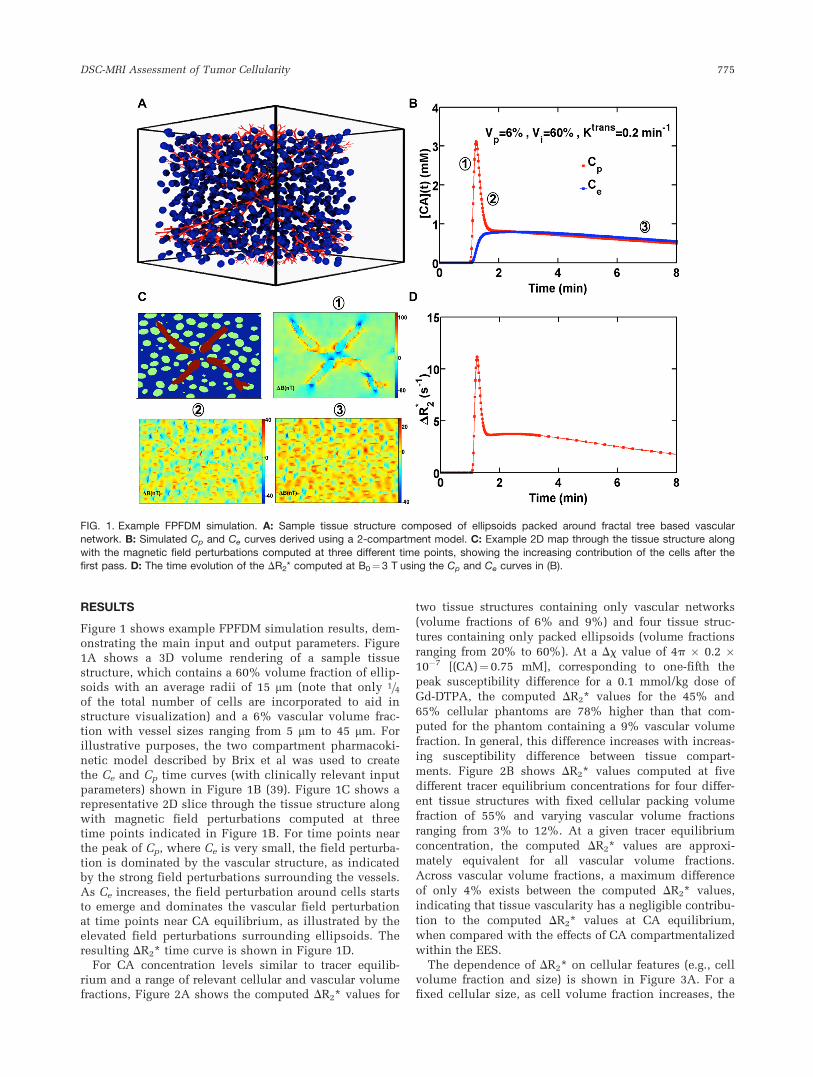
Figure 1 shows example FPFDM simulation results, dem-onstrating the main input and output parameters. Figure1A shows a 3D volume rendering of a sample tissuestructure, which contains a 60% volume fraction of ellip-soids with an average radii of 15 mm (note that only 1=4of the total number of cells are incorporated to aid instructure visualization) and a 6% vascular volume frac-tion with vessel sizes ranging from 5 mm to 45 mm. Forillustrative purposes, the two compartment pharmacoki-netic model described by Brix et al was used to createthe Ce and Cp time curves (with clinically relevant inputparameters) shown in Figure 1B (39). Figure 1C shows arepresentative 2D slice through the tissue structure alongwith magnetic field perturbations computed at threetime points indicated in Figure 1B. For time points nearthe peak of Cp, where Ce is very small, the field perturba-tion is dominated by the vascular structure, as indicatedby the strong field perturbations surrounding the vessels.As Ce increases, the field perturbation around cells startsto emerge and dominates the vascular field perturbationat time points near CA equilibrium, as illustrated by theelevated field perturbations surrounding ellipsoids. Theresulting DR2* time curve is shown in Figure 1D.
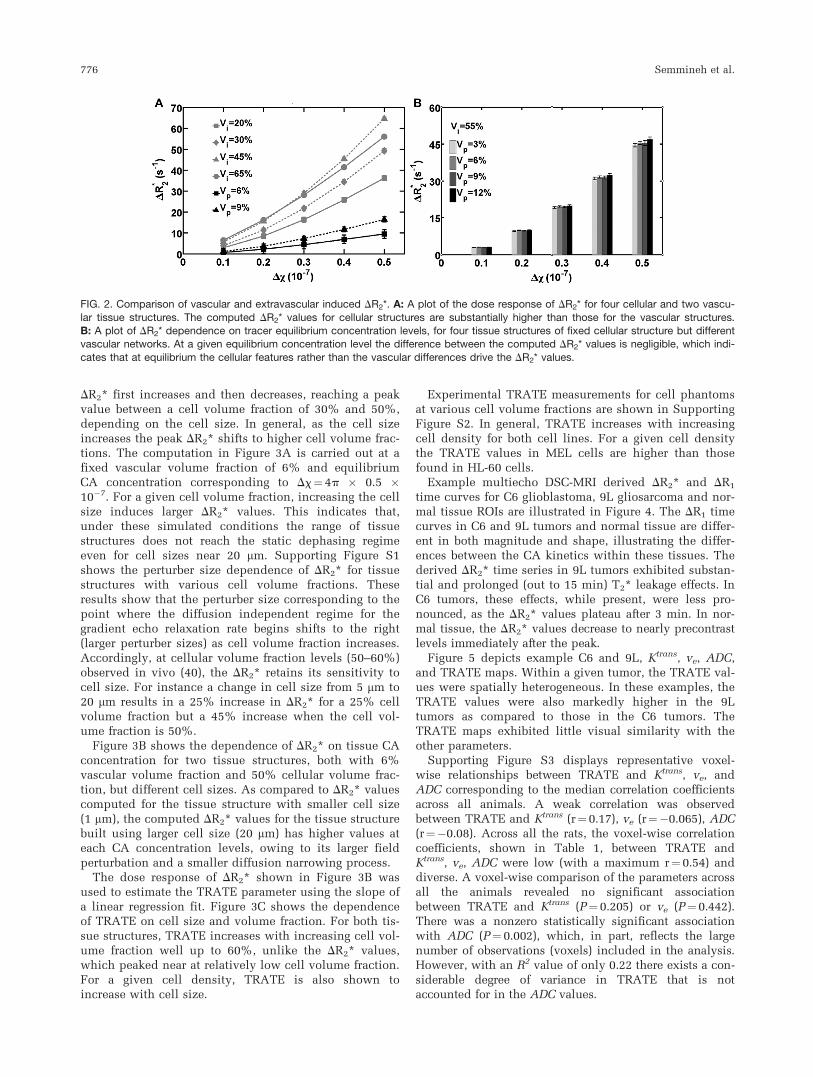
For CA concentration levels similar to tracer equilib-rium and a range of relevant cellular and vascular volumefractions, Figure 2A shows the computed DR2* values for
two tissue structures containing only vascular networks
(volume fractions of 6% and 9%) and four tissue struc-
tures containing only packed ellipsoids (volume fractions
ranging from 20% to 60%). At a Dx value of 4p � 0.2 �10�7 [(CA)¼0.75 mM], corresponding to one-fifth the
peak susceptibility difference for a 0.1 mmol/kg dose of
Gd-DTPA, the computed DR2* values for the 45% and
65% cellular phantoms are 78% higher than that com-
puted for the phantom containing a 9% vascular volume
fraction. In general, this difference increases with increas-
ing susceptibility difference between tissue compart-
ments. Figure 2B shows DR2* values computed at five
different tracer equilibrium concentrations for four differ-
ent tissue structures with fixed cellular packing volume
fraction of 55% and varying vascular volume fractions
ranging from 3% to 12%. At a given tracer equilibrium
concentration, the computed DR2* values are approxi-
mately equivalent for all vascular volume fractions.
Across vascular volume fractions, a maximum difference
of only 4% exists between the computed DR2* values,
indicating that tissue vascularity has a negligible contribu-
tion to the computed DR2* values at CA equilibrium,
when compared with the effects of CA compartmentalized
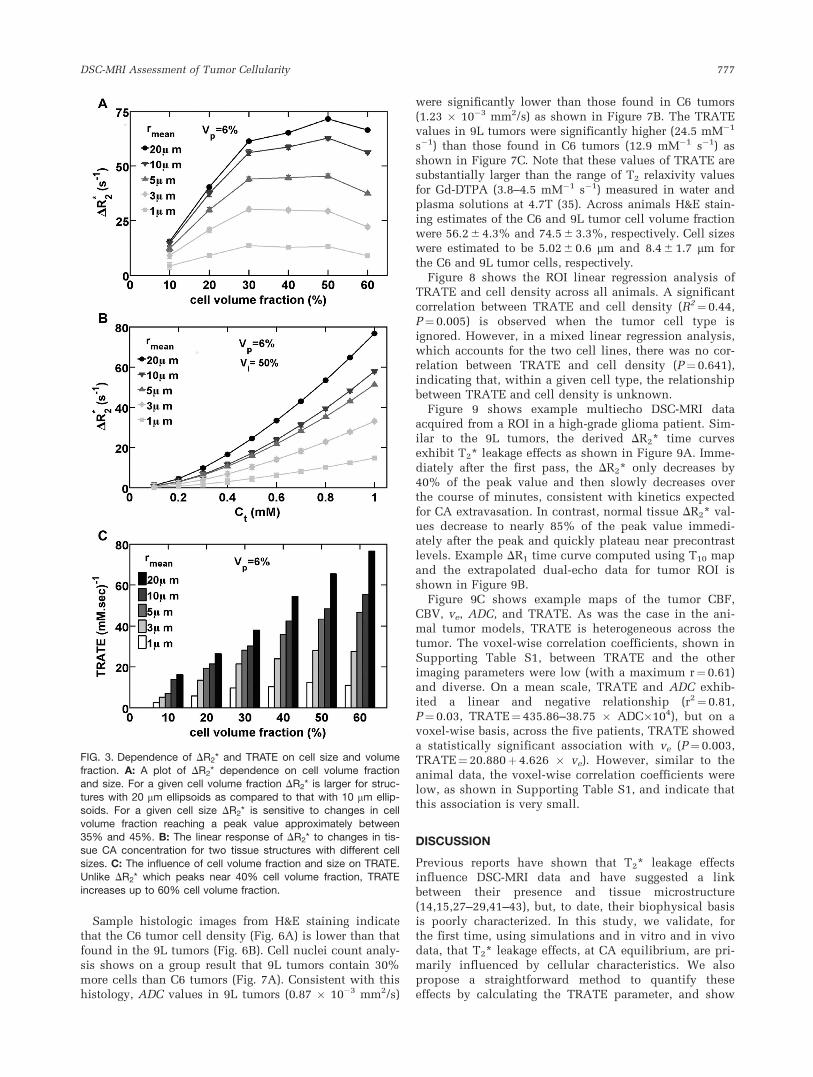
within the EES.The dependence of DR2* on cellular features (e.g., cell
volume fraction and size) is shown in Figure 3A. For afixed cellular size, as cell volume fraction increases, the
FIG. 1. Example FPFDM simulation. A: Sample tissue structure composed of ellipsoids packed around fractal tree based vascularnetwork. B: Simulated Cp and Ce curves derived using a 2-compartment model. C: Example 2D map through the tissue structure along
with the magnetic field perturbations computed at three different time points, showing the increasing contribution of the cells after thefirst pass. D: The time evolution of the DR2* computed at B0¼3 T using the Cp and Ce curves in (B).
DSC-MRI Assessment of Tumor Cellularity 775
DR2* first increases and then decreases, reaching a peakvalue between a cell volume fraction of 30% and 50%,depending on the cell size. In general, as the cell sizeincreases the peak DR2* shifts to higher cell volume frac-tions. The computation in Figure 3A is carried out at afixed vascular volume fraction of 6% and equilibriumCA concentration corresponding to Dx¼ 4p � 0.5 �10�7. For a given cell volume fraction, increasing the cellsize induces larger DR2* values. This indicates that,under these simulated conditions the range of tissuestructures does not reach the static dephasing regimeeven for cell sizes near 20 mm. Supporting Figure S1shows the perturber size dependence of DR2* for tissuestructures with various cell volume fractions. Theseresults show that the perturber size corresponding to thepoint where the diffusion independent regime for thegradient echo relaxation rate begins shifts to the right(larger perturber sizes) as cell volume fraction increases.Accordingly, at cellular volume fraction levels (50–60%)observed in vivo (40), the DR2* retains its sensitivity tocell size. For instance a change in cell size from 5 mm to20 mm results in a 25% increase in DR2* for a 25% cellvolume fraction but a 45% increase when the cell vol-ume fraction is 50%.
Figure 3B shows the dependence of DR2* on tissue CAconcentration for two tissue structures, both with 6%vascular volume fraction and 50% cellular volume frac-tion, but different cell sizes. As compared to DR2* valuescomputed for the tissue structure with smaller cell size(1 mm), the computed DR2* values for the tissue structurebuilt using larger cell size (20 mm) has higher values ateach CA concentration levels, owing to its larger fieldperturbation and a smaller diffusion narrowing process.
The dose response of DR2* shown in Figure 3B wasused to estimate the TRATE parameter using the slope ofa linear regression fit. Figure 3C shows the dependenceof TRATE on cell size and volume fraction. For both tis-sue structures, TRATE increases with increasing cell vol-ume fraction well up to 60%, unlike the DR2* values,which peaked near at relatively low cell volume fraction.For a given cell density, TRATE is also shown toincrease with cell size.
Experimental TRATE measurements for cell phantomsat various cell volume fractions are shown in SupportingFigure S2. In general, TRATE increases with increasingcell density for both cell lines. For a given cell densitythe TRATE values in MEL cells are higher than thosefound in HL-60 cells.
Example multiecho DSC-MRI derived DR2* and DR1
time curves for C6 glioblastoma, 9L gliosarcoma and nor-mal tissue ROIs are illustrated in Figure 4. The DR1 timecurves in C6 and 9L tumors and normal tissue are differ-ent in both magnitude and shape, illustrating the differ-ences between the CA kinetics within these tissues. Thederived DR2* time series in 9L tumors exhibited substan-tial and prolonged (out to 15 min) T2* leakage effects. InC6 tumors, these effects, while present, were less pro-nounced, as the DR2* values plateau after 3 min. In nor-mal tissue, the DR2* values decrease to nearly precontrastlevels immediately after the peak.
Figure 5 depicts example C6 and 9L, Ktrans, ve, ADC,and TRATE maps. Within a given tumor, the TRATE val-ues were spatially heterogeneous. In these examples, theTRATE values were also markedly higher in the 9Ltumors as compared to those in the C6 tumors. TheTRATE maps exhibited little visual similarity with theother parameters.
Supporting Figure S3 displays representative voxel-wise relationships between TRATE and Ktrans, ve, andADC corresponding to the median correlation coefficientsacross all animals. A weak correlation was observedbetween TRATE and Ktrans (r¼ 0.17), ve (r¼�0.065), ADC(r¼�0.08). Across all the rats, the voxel-wise correlationcoefficients, shown in Table 1, between TRATE andKtrans, ve, ADC were low (with a maximum r¼ 0.54) anddiverse. A voxel-wise comparison of the parameters acrossall the animals revealed no significant associationbetween TRATE and Ktrans (P¼0.205) or ve (P¼0.442).There was a nonzero statistically significant associationwith ADC (P¼ 0.002), which, in part, reflects the largenumber of observations (voxels) included in the analysis.However, with an R2 value of only 0.22 there exists a con-siderable degree of variance in TRATE that is notaccounted for in the ADC values.
FIG. 2. Comparison of vascular and extravascular induced DR2*. A: A plot of the dose response of DR2* for four cellular and two vascu-
lar tissue structures. The computed DR2* values for cellular structures are substantially higher than those for the vascular structures.B: A plot of DR2* dependence on tracer equilibrium concentration levels, for four tissue structures of fixed cellular structure but differentvascular networks. At a given equilibrium concentration level the difference between the computed DR2* values is negligible, which indi-
cates that at equilibrium the cellular features rather than the vascular differences drive the DR2* values.
776 Semmineh et al.
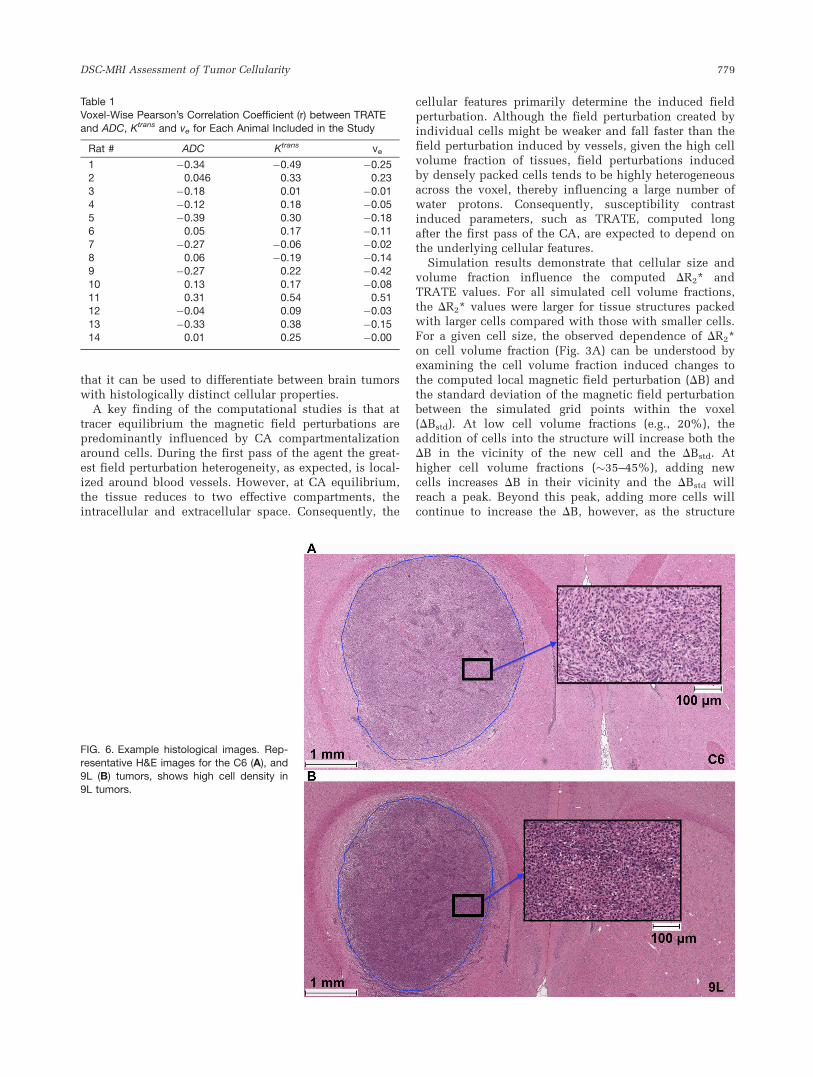
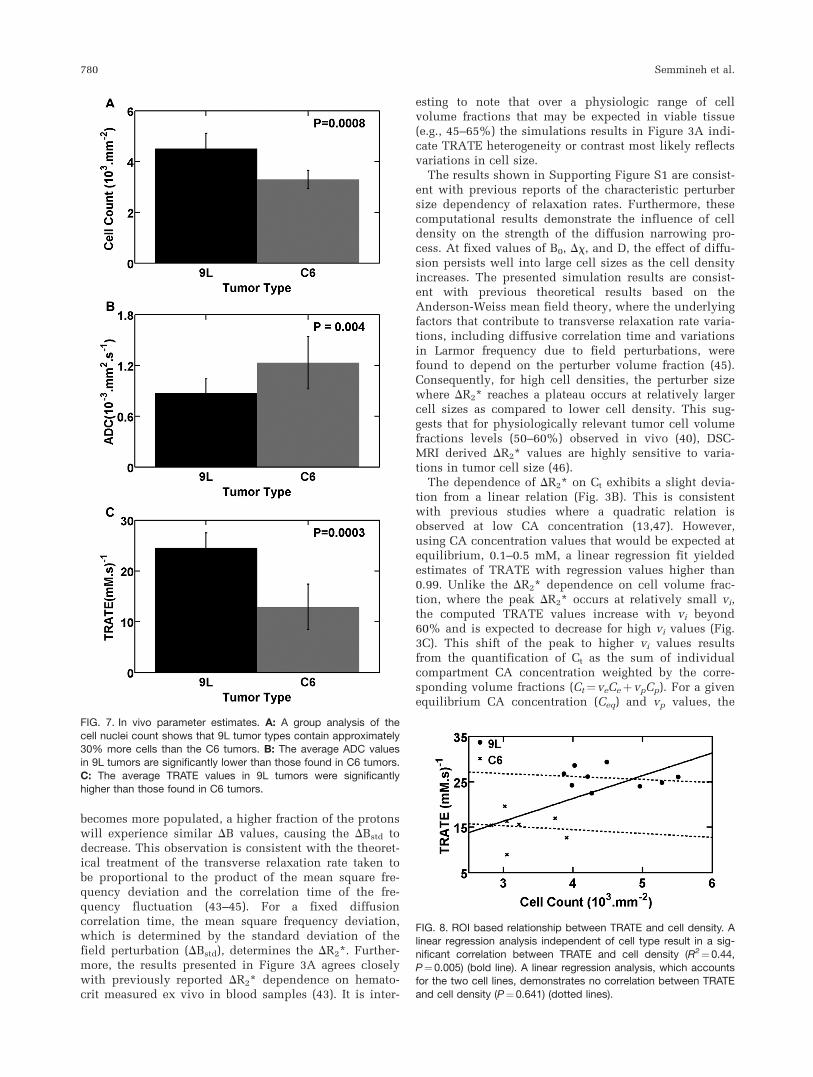
Sample histologic images from H&E staining indicatethat the C6 tumor cell density (Fig. 6A) is lower than thatfound in the 9L tumors (Fig. 6B). Cell nuclei count analy-sis shows on a group result that 9L tumors contain 30%more cells than C6 tumors (Fig. 7A). Consistent with thishistology, ADC values in 9L tumors (0.87 � 10�3 mm2/s)
were significantly lower than those found in C6 tumors(1.23 � 10�3 mm2/s) as shown in Figure 7B. The TRATEvalues in 9L tumors were significantly higher (24.5 mM�1
s�1) than those found in C6 tumors (12.9 mM�1 s�1) asshown in Figure 7C. Note that these values of TRATE aresubstantially larger than the range of T2 relaxivity valuesfor Gd-DTPA (3.8–4.5 mM�1 s�1) measured in water andplasma solutions at 4.7T (35). Across animals H&E stain-ing estimates of the C6 and 9L tumor cell volume fractionwere 56.2 6 4.3% and 74.5 6 3.3%, respectively. Cell sizeswere estimated to be 5.02 6 0.6 mm and 8.4 6 1.7 mm forthe C6 and 9L tumor cells, respectively.
Figure 8 shows the ROI linear regression analysis ofTRATE and cell density across all animals. A significantcorrelation between TRATE and cell density (R2¼0.44,P¼ 0.005) is observed when the tumor cell type isignored. However, in a mixed linear regression analysis,which accounts for the two cell lines, there was no cor-relation between TRATE and cell density (P¼ 0.641),indicating that, within a given cell type, the relationshipbetween TRATE and cell density is unknown.
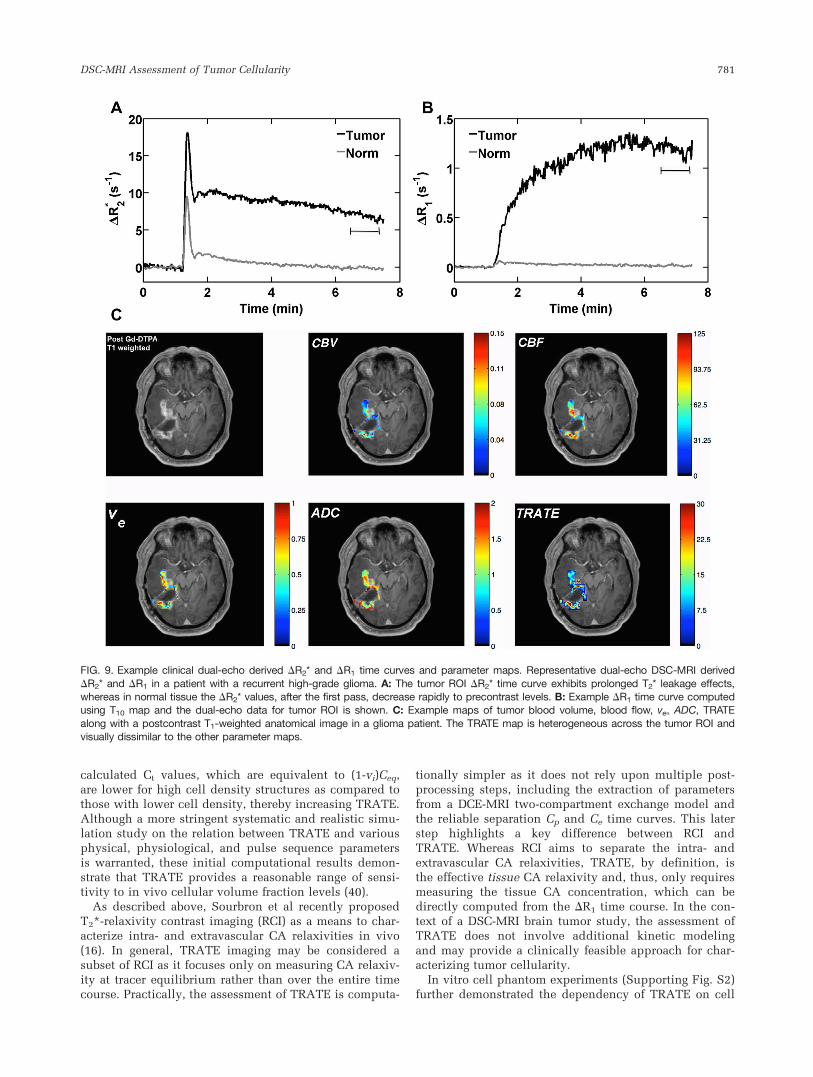
Figure 9 shows example multiecho DSC-MRI dataacquired from a ROI in a high-grade glioma patient. Sim-ilar to the 9L tumors, the derived DR2* time curvesexhibit T2* leakage effects as shown in Figure 9A. Imme-diately after the first pass, the DR2* only decreases by40% of the peak value and then slowly decreases overthe course of minutes, consistent with kinetics expectedfor CA extravasation. In contrast, normal tissue DR2* val-ues decrease to nearly 85% of the peak value immedi-ately after the peak and quickly plateau near precontrastlevels. Example DR1 time curve computed using T10 mapand the extrapolated dual-echo data for tumor ROI isshown in Figure 9B.
Figure 9C shows example maps of the tumor CBF,CBV, ve, ADC, and TRATE. As was the case in the ani-mal tumor models, TRATE is heterogeneous across thetumor. The voxel-wise correlation coefficients, shown inSupporting Table S1, between TRATE and the otherimaging parameters were low (with a maximum r¼0.61)and diverse. On a mean scale, TRATE and ADC exhib-ited a linear and negative relationship (r2¼ 0.81,P¼ 0.03, TRATE¼ 435.86–38.75 � ADC�104), but on avoxel-wise basis, across the five patients, TRATE showeda statistically significant association with ve (P¼ 0.003,TRATE¼ 20.880þ 4.626 � ve). However, similar to theanimal data, the voxel-wise correlation coefficients werelow, as shown in Supporting Table S1, and indicate thatthis association is very small.
DISCUSSION
Previous reports have shown that T2* leakage effectsinfluence DSC-MRI data and have suggested a linkbetween their presence and tissue microstructure(14,15,27–29,41–43), but, to date, their biophysical basisis poorly characterized. In this study, we validate, forthe first time, using simulations and in vitro and in vivodata, that T2* leakage effects, at CA equilibrium, are pri-marily influenced by cellular characteristics. We alsopropose a straightforward method to quantify theseeffects by calculating the TRATE parameter, and show
FIG. 3. Dependence of DR2* and TRATE on cell size and volumefraction. A: A plot of DR2* dependence on cell volume fractionand size. For a given cell volume fraction DR2* is larger for struc-
tures with 20 mm ellipsoids as compared to that with 10 mm ellip-soids. For a given cell size DR2* is sensitive to changes in cell
volume fraction reaching a peak value approximately between35% and 45%. B: The linear response of DR2* to changes in tis-sue CA concentration for two tissue structures with different cell
sizes. C: The influence of cell volume fraction and size on TRATE.Unlike DR2* which peaks near 40% cell volume fraction, TRATE
increases up to 60% cell volume fraction.
DSC-MRI Assessment of Tumor Cellularity 777
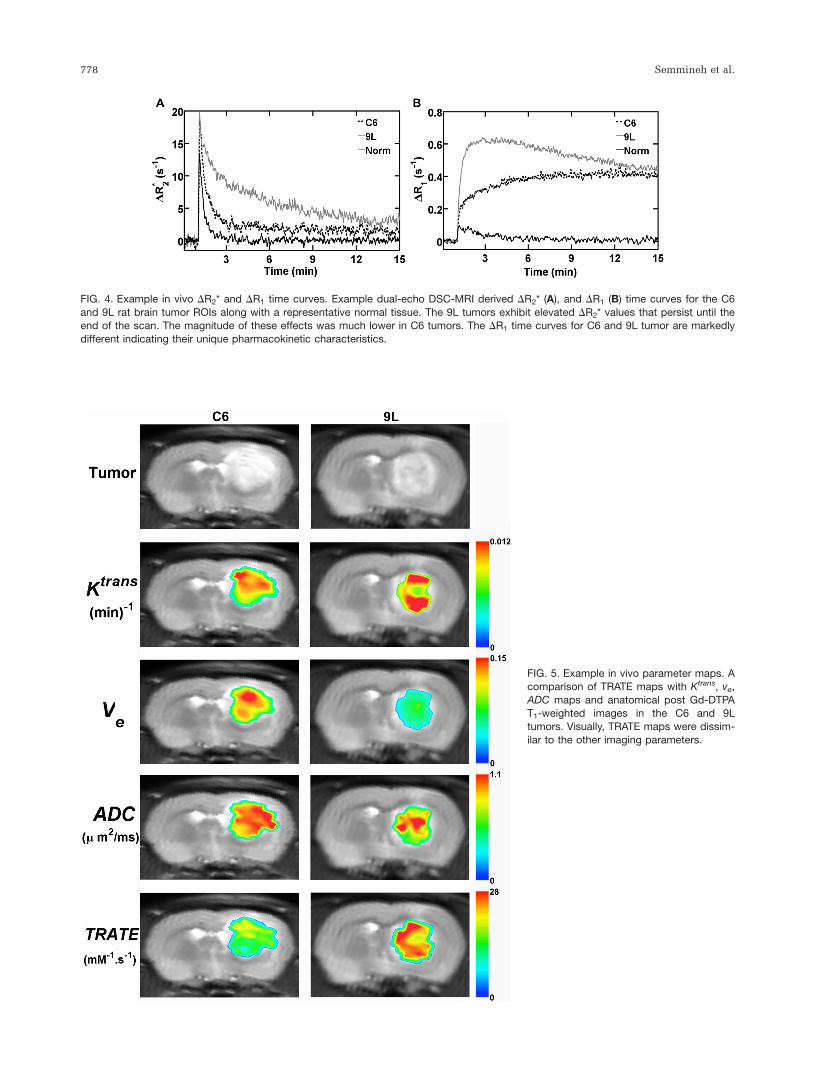
FIG. 4. Example in vivo DR2* and DR1 time curves. Example dual-echo DSC-MRI derived DR2* (A), and DR1 (B) time curves for the C6
and 9L rat brain tumor ROIs along with a representative normal tissue. The 9L tumors exhibit elevated DR2* values that persist until theend of the scan. The magnitude of these effects was much lower in C6 tumors. The DR1 time curves for C6 and 9L tumor are markedly
different indicating their unique pharmacokinetic characteristics.
FIG. 5. Example in vivo parameter maps. Acomparison of TRATE maps with Ktrans, ve,
ADC maps and anatomical post Gd-DTPAT1-weighted images in the C6 and 9Ltumors. Visually, TRATE maps were dissim-
ilar to the other imaging parameters.
778 Semmineh et al.
that it can be used to differentiate between brain tumorswith histologically distinct cellular properties.
A key finding of the computational studies is that attracer equilibrium the magnetic field perturbations arepredominantly influenced by CA compartmentalizationaround cells. During the first pass of the agent the great-est field perturbation heterogeneity, as expected, is local-ized around blood vessels. However, at CA equilibrium,the tissue reduces to two effective compartments, theintracellular and extracellular space. Consequently, the
cellular features primarily determine the induced fieldperturbation. Although the field perturbation created byindividual cells might be weaker and fall faster than thefield perturbation induced by vessels, given the high cellvolume fraction of tissues, field perturbations inducedby densely packed cells tends to be highly heterogeneousacross the voxel, thereby influencing a large number ofwater protons. Consequently, susceptibility contrastinduced parameters, such as TRATE, computed longafter the first pass of the CA, are expected to depend onthe underlying cellular features.
Simulation results demonstrate that cellular size andvolume fraction influence the computed DR2* andTRATE values. For all simulated cell volume fractions,the DR2* values were larger for tissue structures packedwith larger cells compared with those with smaller cells.For a given cell size, the observed dependence of DR2*on cell volume fraction (Fig. 3A) can be understood byexamining the cell volume fraction induced changes tothe computed local magnetic field perturbation (DB) andthe standard deviation of the magnetic field perturbationbetween the simulated grid points within the voxel(DBstd). At low cell volume fractions (e.g., 20%), theaddition of cells into the structure will increase both theDB in the vicinity of the new cell and the DBstd. Athigher cell volume fractions (�35–45%), adding newcells increases DB in their vicinity and the DBstd willreach a peak. Beyond this peak, adding more cells willcontinue to increase the DB, however, as the structure
Table 1Voxel-Wise Pearson’s Correlation Coefficient (r) between TRATE
and ADC, Ktrans and ve for Each Animal Included in the Study
Rat # ADC Ktrans ve
1 �0.34 �0.49 �0.252 0.046 0.33 0.23
3 �0.18 0.01 �0.014 �0.12 0.18 �0.05
5 �0.39 0.30 �0.186 0.05 0.17 �0.117 �0.27 �0.06 �0.02
8 0.06 �0.19 �0.149 �0.27 0.22 �0.42
10 0.13 0.17 �0.0811 0.31 0.54 0.5112 �0.04 0.09 �0.03
13 �0.33 0.38 �0.1514 0.01 0.25 �0.00
FIG. 6. Example histological images. Rep-
resentative H&E images for the C6 (A), and9L (B) tumors, shows high cell density in9L tumors.
DSC-MRI Assessment of Tumor Cellularity 779
becomes more populated, a higher fraction of the protonswill experience similar DB values, causing the DBstd todecrease. This observation is consistent with the theoret-ical treatment of the transverse relaxation rate taken tobe proportional to the product of the mean square fre-quency deviation and the correlation time of the fre-quency fluctuation (43–45). For a fixed diffusioncorrelation time, the mean square frequency deviation,which is determined by the standard deviation of thefield perturbation (DBstd), determines the DR2*. Further-more, the results presented in Figure 3A agrees closelywith previously reported DR2* dependence on hemato-crit measured ex vivo in blood samples (43). It is inter-
esting to note that over a physiologic range of cellvolume fractions that may be expected in viable tissue(e.g., 45–65%) the simulations results in Figure 3A indi-cate TRATE heterogeneity or contrast most likely reflectsvariations in cell size.
The results shown in Supporting Figure S1 are consist-ent with previous reports of the characteristic perturbersize dependency of relaxation rates. Furthermore, thesecomputational results demonstrate the influence of celldensity on the strength of the diffusion narrowing pro-cess. At fixed values of B0, Dx, and D, the effect of diffu-sion persists well into large cell sizes as the cell densityincreases. The presented simulation results are consist-ent with previous theoretical results based on theAnderson-Weiss mean field theory, where the underlyingfactors that contribute to transverse relaxation rate varia-tions, including diffusive correlation time and variationsin Larmor frequency due to field perturbations, werefound to depend on the perturber volume fraction (45).Consequently, for high cell densities, the perturber sizewhere DR2* reaches a plateau occurs at relatively largercell sizes as compared to lower cell density. This sug-gests that for physiologically relevant tumor cell volumefractions levels (50–60%) observed in vivo (40), DSC-MRI derived DR2* values are highly sensitive to varia-tions in tumor cell size (46).
The dependence of DR2* on Ct exhibits a slight devia-tion from a linear relation (Fig. 3B). This is consistentwith previous studies where a quadratic relation isobserved at low CA concentration (13,47). However,using CA concentration values that would be expected atequilibrium, 0.1–0.5 mM, a linear regression fit yieldedestimates of TRATE with regression values higher than0.99. Unlike the DR2* dependence on cell volume frac-tion, where the peak DR2* occurs at relatively small vi,the computed TRATE values increase with vi beyond60% and is expected to decrease for high vi values (Fig.3C). This shift of the peak to higher vi values resultsfrom the quantification of Ct as the sum of individualcompartment CA concentration weighted by the corre-sponding volume fractions (Ct¼ veCeþ vpCp). For a givenequilibrium CA concentration (Ceq) and vp values, the
FIG. 7. In vivo parameter estimates. A: A group analysis of the
cell nuclei count shows that 9L tumor types contain approximately30% more cells than the C6 tumors. B: The average ADC valuesin 9L tumors are significantly lower than those found in C6 tumors.
C: The average TRATE values in 9L tumors were significantlyhigher than those found in C6 tumors.
FIG. 8. ROI based relationship between TRATE and cell density. Alinear regression analysis independent of cell type result in a sig-nificant correlation between TRATE and cell density (R2¼0.44,
P¼0.005) (bold line). A linear regression analysis, which accountsfor the two cell lines, demonstrates no correlation between TRATE
and cell density (P¼0.641) (dotted lines).
780 Semmineh et al.
calculated Ct values, which are equivalent to (1-vi)Ceq,are lower for high cell density structures as compared tothose with lower cell density, thereby increasing TRATE.Although a more stringent systematic and realistic simu-lation study on the relation between TRATE and variousphysical, physiological, and pulse sequence parametersis warranted, these initial computational results demon-strate that TRATE provides a reasonable range of sensi-tivity to in vivo cellular volume fraction levels (40).
As described above, Sourbron et al recently proposedT2*-relaxivity contrast imaging (RCI) as a means to char-acterize intra- and extravascular CA relaxivities in vivo(16). In general, TRATE imaging may be considered asubset of RCI as it focuses only on measuring CA relaxiv-ity at tracer equilibrium rather than over the entire timecourse. Practically, the assessment of TRATE is computa-
tionally simpler as it does not rely upon multiple post-processing steps, including the extraction of parametersfrom a DCE-MRI two-compartment exchange model andthe reliable separation Cp and Ce time curves. This laterstep highlights a key difference between RCI andTRATE. Whereas RCI aims to separate the intra- andextravascular CA relaxivities, TRATE, by definition, isthe effective tissue CA relaxivity and, thus, only requiresmeasuring the tissue CA concentration, which can bedirectly computed from the DR1 time course. In the con-text of a DSC-MRI brain tumor study, the assessment ofTRATE does not involve additional kinetic modelingand may provide a clinically feasible approach for char-acterizing tumor cellularity.
In vitro cell phantom experiments (Supporting Fig. S2)further demonstrated the dependency of TRATE on cell
FIG. 9. Example clinical dual-echo derived DR2* and DR1 time curves and parameter maps. Representative dual-echo DSC-MRI derived
DR2* and DR1 in a patient with a recurrent high-grade glioma. A: The tumor ROI DR2* time curve exhibits prolonged T2* leakage effects,whereas in normal tissue the DR2* values, after the first pass, decrease rapidly to precontrast levels. B: Example DR1 time curve computedusing T10 map and the dual-echo data for tumor ROI is shown. C: Example maps of tumor blood volume, blood flow, ve, ADC, TRATE
along with a postcontrast T1-weighted anatomical image in a glioma patient. The TRATE map is heterogeneous across the tumor ROI andvisually dissimilar to the other parameter maps.
DSC-MRI Assessment of Tumor Cellularity 781
size and density. While the dependence of TRATE oncell density is apparent from Supporting Figure S2, for agiven cell density the difference in TRATE valuesbetween the MEL and HL-60 cell lines is likely a resultof changes in cellular size and shape.
Both preclinical and clinical multiecho DSC-MRI data-sets exhibited substantial T2* leakage effects well afterthe first pass of the CA. Although traditional DSC-MRIexams in brain tumors are typically no more than 3 min,this study confirm the presence of considerable T2*effects even out to 10 min following CA injection. Withsingle-echo acquisition methods, the detection of theseT2* effects is confounded by simultaneous and compet-ing changes in T1, which is likely why they are onlynow being considered as a source of new tissue contrastwith MRI. It is also important to note that the TRATEvalues in the brain tumors studied here were muchgreater than the microscopic T2 relaxivity of Gd-DTPA,verifying that mesoscopic susceptibility changes across avoxel are the source of the T2* leakage effects.
Histology and ADC measurements indicate that 9Ltumors have a higher cell density than that found in C6tumors. Histological analysis also revealed that the 9Lcells were large than C6 cells. Consistent with the com-putational results showing that TRATE increases withincreasing cell volume fraction and cell size, the TRATEvalues in 9L tumors were significantly higher than thosein C6 tumors. A significant correlation between TRATEand cell density was observed when the tumor cell typewas ignored (Fig. 8). However, the lack of correlationbetween TRATE and cell density within each cell lineindicates that other cellular features, in addition to celldensity variations (e.g., size, shape, spatial distribution)are driving the differences in TRATE. Moreover this lackof correlation may reflect that the respective cell den-sities for the C6 and 9L tumor cells are near the peak ofthe DR2* versus cell volume fraction relationship (Fig.3A) and thereby less sensitive to variations in celldensity.
In addition to the dissimilar TRATE values between theC6 and 9L tumor types, there was little to no spatial cor-relation (Supporting Fig. S3), between TRATE and ADC,Ktrans, or ve, indicating that the variance in the TRATEmaps is not accounted for by these parameters and thatTRATE is potentially reporting on unique microstructuralproperties of the tumor tissue. Similar results were foundin the human parameter comparisons. The only exceptionwas the ROI mean TRATE versus ADC comparison,which yielded a significant correlation between theparameters. Consistent with the computational and invitro findings, tumors with low ADC values, potentiallyreflecting those with high cellularity, also exhibited highTRATE values. Additional studies with more patients isneeded to explore this potential relationship, however,because no such correlation was found for the voxel-wisecomparison. The dependence of ADC on cellular proper-ties is well established (48). As shown here, TRATE issensitive to cell density but also upon other physical orphysiological parameters that could alter the susceptibil-ity induced transverse relaxation rates, such as, diffusion,cell membrane permeability, cell size, shape and overallorganization (13,29,42,49–52). While TRATE and ADC
depend on similar microstructural features their sensitiv-ities to each will likely differ due to the differences intheir underlying contrast mechanisms, which may explainthe low voxel-wise correlation coefficients betweenTRATE and ADC. Further studies are warranted to inves-tigate the specific differences between the sensitivity ofTRATE and ADC measurements to tissue cytoarchitecture.
From Figure 4 it is clear that 9L and C6 tumors exhibitmarked differences in their DR1 time courses, which isindicative of differences in vascular hemodynamics, tissuecompartment sizes and permeability. Thus, the sensitivityof DR2* measurements alone to tumor microstructure,even at CA equilibrium, is likely confounded by heteroge-neous and dynamic changes in the tissue CA concentra-tion. Because estimates of TRATE incorporate measures ofthe tissue CA concentration, the effect of these differencesis minimized. TRATE, therefore, is instead influenced bylocal CA distribution within the EES. This sensitivity is incontrast to other perfusion-based imaging metrics such asPSR, which represents a complex combination of tissuemicrostructure and hemodynamic effects including bloodflow, blood volume, vascular permeability, cell volumefraction, and cellular geometry. Fortunately, the use ofmultiple-echo DSC-MRI, permits the separation of many ofthese factors through estimates of DR1 and DR2*, enablingthe isolation of tissue geometrical factors (e.g., cell densityand distribution). In addition, the acquisition of multipleechoes and calculation of absolute tissue relaxation rateslikely makes the method for estimating TRATE less sensi-tive to pulse sequence parameters when compared withmetrics such as PSR (53). Validation of this point, how-ever, is the subject of future analysis.
Although pulse sequence parameters, such as echotime, may have nominal influence on the estimate ofTRATE, the time, after CA injection, during which themeasurement is made could be significant. Estimation ofTRATE relies on the assumption that the distribution ofCA is in a state of equilibrium between the vascular andextravascular extracellular space. With the use of a two-compartment pharmacokinetic modeling (39) it can beshown that, for a range of physiological parameters rele-vant to brain cancer, CA equilibrium occurs approxi-mately 5 to 7 min after CA injection. For this reason,estimation of TRATE requires a moderately longer DSC-MRI acquisition time. Additionally, physiological phe-nomena such as tissue necrosis could also influenceTRATE measurements. In the case of tumor necrosis,which often occurs in both animal and human braintumors, diffusion of CA into the necrotic region canoccur, resulting in continuously increasing DR1 (54). Theestimate of TRATE in these regions may be confoundedif CA equilibrium is never reached.
As previously indicated, there do exist limitations onthe method for calculating TRATE. These limitations,however, are mainly focused on the tissue being ana-lyzed and more specifically its vascular permeability. Toreiterate, estimations of TRATE require CA extravasationout of the vasculature. Although computing a thresholdfor the amount of CA extravasation required is beyondthe scope of the work presented here, the change in R1
after contrast injection should be many times greaterthan the standard deviation of the baseline R1 to avoid
782 Semmineh et al.
contributions from noise. Future studies will seek toestablish voxel-wise criteria on when TRATE can be reli-ably measured and its reproducibility.
In addition to studies aiming to further characterizethe biophysical basis of TRATE, there are numerousopportunities to explore the clinical role of TRATEmeasurements. Given the previously shown potential ofPSR to differentiate between lymphomas, gliomas andbrain metastasis based on the presence or absence of T2*leakage effects (27), it is likely that TRATE would showsimilar differences while at the same time providing aquantitative and pulse sequence independent measure.The sensitivity of TRATE to cytoarchitecture suggests itspotential role to assess treatment-induced cytotoxicity,similar to the current use of functional diffusion map-ping (55). Finally, although TRATE was assessed hereusing a DSC-MRI acquisition, it could just as easily beestimated as part of a multiecho DCE-MRI study or evena multiecho, post-CA injection steady-state exam. Theuse of these methods would enable the estimation ofTRATE, and, therefore, cytoarchitectural features, athigher resolution and in any tissue in or outside thebrain using clinically available pulse sequences.
CONCLUSIONS
DSC-MRI is commonly used to assess the vascular andhemodynamic status of brain tumors. When acquiredwith multiecho pulse sequences and precontrast T1
maps the studies described herein show that, by leverag-ing T2* leakage effects, tumor cellular features can alsobe interrogated through the parameter TRATE. The sensi-tivity of TRATE to tissue cytoarchitecture indicate that itcould potentially serve as a unique structural signatureor “trait” of different types of cancers and may be usefulas a biomarker of cancer aggressiveness and early treat-ment response. Results in preclinical and clinical braintumors indicate that TRATE provides unique informa-tion not present in DCE-MRI kinetic parameters or DWIbased ADC maps. Further computational and in vivostudies are needed to systematically characterize thedependency of TRATE on microstructure (e.g., cellularorientation heterogeneity, shape, spatial distribution),establishing its reproducibility and sensitivity to celldensity variations in other tumor types and during thecourse of treatment.
ACKNOWLEDGMENT
We thank Dr. Gary Delaney for his help with the ellip-soid cell packing.
REFERENCES
1. Aronen HJ, Gazit IE, Louis DN, et al. Cerebral blood volume maps of
gliomas: comparison with tumor grade and histologic findings. Radi-
ology 1994;191:41–51.
2. Aronen HJ, Pardo FS, Kennedy DN, Belliveau JW, Packard SD, Hsu
DW, Hochberg FH, Fischman AJ, Rosen BR. High microvascular
blood volume is associated with high glucose uptake and tumor
angiogenesis in human gliomas. Clin Cancer Res 2000;6:2189–2200.
3. Batchelor TT, Sorensen AG, di Tomaso E, et al. AZD2171, a pan-
VEGF receptor tyrosine kinase inhibitor, normalizes tumor vascula-
ture and alleviates edema in glioblastoma patients. Cancer Cell 2007;
11:83–95.
4. Bruening R, Kwong KK, Vevea MJ, Hochberg FH, Cher L, Harsh GRt,
Niemi PT, Weisskoff RM, Rosen BR. Echo-planar MR determination
of relative cerebral blood volume in human brain tumors: T1 versus
T2 weighting. AJNR Am J Neuroradiol 1996;17:831–840.
5. Donahue KM, Krouwer HG, Rand SD, Pathak AP, Marszalkowski CS,
Censky SC, Prost RW. Utility of simultaneously acquired gradient-
echo and spin-echo cerebral blood volume and morphology maps in
brain tumor patients. Magn Reson Med 2000;43:845–853.
6. Maeda M, Itoh S, Kimura H, Iwasaki T, Hayashi N, Yamamoto K,
Ishii Y, Kubota T. Tumor vascularity in the brain: evaluation with
dynamic susceptibility-contrast MR imaging. Radiology 1993;189:
233–238.
7. Sugahara T, Korogi Y, Kochi M, Ushio Y, Takahashi M. Perfusion-
sensitive MR imaging of gliomas: comparison between gradient-echo
and spin-echo echo-planar imaging techniques. AJNR Am J Neurora-
diol 2001;22:1306–1315.
8. Lemasson B, Serduc R, Maisin C, Bouchet A, Coquery N, Robert P, Le
Duc G, Tropres I, Remy C, Barbier EL. Monitoring blood-brain barrier
status in a rat model of glioma receiving therapy: dual injection of
low-molecular-weight and macromolecular MR contrast media. Radi-
ology 2010;257:342–352.
9. Siegal T, Rubinstein R, Tzuk-Shina T, Gomori JM. Utility of relative
cerebral blood volume mapping derived from perfusion magnetic res-
onance imaging in the routine follow up of brain tumors. J Neurosurg
1997;86:22–27.
10. Sugahara T, Korogi Y, Tomiguchi S, Shigematsu Y, Ikushima I, Kira
T, Liang L, Ushio Y, Takahashi M. Posttherapeutic intraaxial brain
tumor: the value of perfusion-sensitive contrast-enhanced MR imag-
ing for differentiating tumor recurrence from nonneoplastic contrast-
enhancing tissue. AJNR Am J Neuroradiol 2000;21:901–909.
11. Kamoun WS, Ley CD, Farrar CT, et al. Edema control by cediranib, a
vascular endothelial growth factor receptor-targeted kinase inhibitor,
prolongs survival despite persistent brain tumor growth in mice.
J Clin Oncol 2009;27:2542–2552.
12. Sorensen AG, Emblem KE, Polaskova P, et al. Increased survival of
glioblastoma patients who respond to antiangiogenic therapy with
elevated blood perfusion. Cancer Res 2012;72:402–407.
13. Boxerman JL, Hamberg LM, Rosen BR, Weisskoff RM. MR contrast
due to intravascular magnetic susceptibility perturbations. Magn
Reson Med 1995;34:555–566.
14. Quarles CC, Gochberg DF, Gore JC, Yankeelov TE. A theoretical
framework to model DSC-MRI data acquired in the presence of con-
trast agent extravasation. Phys Med Biol 2009;54:5749–5766.
15. Sourbron S, Heilmann M, Biffar A, Walczak C, Vautier J, Volk A,
Peller M. Bolus-tracking MRI with a simultaneous T1- and T2*-mea-
surement. Magn Reson Med 2009;62:672–681.
16. Sourbron S, Heilmann M, Walczak C, Vautier J, Schad LR, Volk A.
T2*-relaxivity contrast imaging: first results. Magn Reson Med 2013;
69:1430–1437.
17. Quarles CC, Ward BD, Schmainda KM. Improving the reliability of
obtaining tumor hemodynamic parameters in the presence of contrast
agent extravasation. Magn Reson Med 2005;53:1307–1316.
18. Bjornerud A, Sorensen AG, Mouridsen K, Emblem KE. T1- and T2*-
dominant extravasation correction in DSC-MRI: part I–theoretical
considerations and implications for assessment of tumor hemody-
namic properties. J Cereb Blood Flow Metab 2011;31:2041–2053.
19. Boxerman JL, Schmainda KM, Weisskoff RM. Relative cerebral blood
volume maps corrected for contrast agent extravasation significantly
correlate with glioma tumor grade, whereas uncorrected maps do not.
AJNR Am J Neuroradiol 2006;27:859–867.
20. Emblem KE, Bjornerud A, Mouridsen K, Borra RJ, Batchelor TT, Jain
RK, Sorensen AG. T(1)- and T(2)(*)-dominant extravasation correc-
tion in DSC-MRI: part II-predicting patient outcome after a single
dose of cediranib in recurrent glioblastoma patients. J Cereb Blood
Flow Metab 2011;31:2054–2064.
21. Paulson ES, Schmainda KM. Comparison of dynamic susceptibility-
weighted contrast-enhanced MR methods: recommendations for
measuring relative cerebral blood volume in brain tumors. Radiology
2008;249:601–613.
22. Schmiedeskamp H, Andre JB, Straka M, Christen T, Nagpal S, Recht
L, Thomas RP, Zaharchuk G, Bammer R. Simultaneous perfusion and
permeability measurements using combined spin- and gradient-echo
MRI. J Cereb Blood Flow Metab 2013;33:732–743.
23. Kim EJ, Kim DH, Lee SH, Huh YM, Song HT, Suh JS. Simultaneous
acquisition of perfusion and permeability from corrected relaxation
DSC-MRI Assessment of Tumor Cellularity 783
rates with dynamic susceptibility contrast dual gradient echo. Magn
Reson Imaging 2004;22:307–314.
24. Quarles CC, Gore JC, Xu L, Yankeelov TE. Comparison of dual-echo
DSC-MRI- and DCE-MRI-derived contrast agent kinetic parameters.
Magnetic Reson Imaging 2012;30:944–953.
25. Sourbron S, Ingrisch M, Siefert A, Reiser M, Herrmann K. Quantifica-
tion of cerebral blood flow, cerebral blood volume, and blood-brain-
barrier leakage with DCE-MRI. Magn Reson Med 2009;62:205–217.
26. Vonken EP, van Osch MJ, Bakker CJ, Viergever MA. Simultaneous
quantitative cerebral perfusion and Gd-DTPA extravasation measure-
ment with dual-echo dynamic susceptibility contrast MRI. Magn
Reson Med 2000;43:820–827.
27. Mangla R, Kolar B, Zhu T, Zhong J, Almast J, Ekholm S. Percentage
signal recovery derived from MR dynamic susceptibility contrast
imaging is useful to differentiate common enhancing malignant
lesions of the brain. AJNR Am J Neuroradiol 2011;32:1004–1010.
28. Pannetier NA, Debacker CS, Mauconduit F, Christen T, Barbier EL. A
simulation tool for dynamic contrast enhanced MRI. PloS One 2013;
8:e57636.
29. Semmineh NB, Xu J, Boxerman JL, Delaney GW, Cleary PW, Gore JC,
Quarles CC. An efficient computational approach to characterize
DSC-MRI signals arising from three-dimensional heterogeneous tissue
structures. PloS One 2014;9:e84764.
30. Rybaczuk M, Kedzia A, Paradowski L. Fractal characteristics of brain
vessel microangioarchitecture during the fetal period. Med Sci Monit
2002;8:MT145–152.
31. Schreiner W, Neumann F, Neumann M, End A, Muller MR. Struc-
tural quantification and bifurcation symmetry in arterial tree models
generated by constrained constructive optimization. J Theor Biol
1996;180:161–174.
32. Delaney GW, Cleary PW. The packing properties of superellipsoids.
Europhys Lett 2010;89:34002.
33. Le Bihan D. [Diffusion, perfusion and functional magnetic resonance
imaging]. J Mal Vasc 1995;20:203–214.
34. Weisskoff RM, Kiihne S. MRI susceptometry: image-based measure-
ment of absolute susceptibility of MR contrast agents and human
blood. Magn Reson Med 1992;24:375–383.
35. Rohrer M, Bauer H, Mintorovitch J, Requardt M, Weinmann HJ. Com-
parison of magnetic properties of MRI contrast media solutions at dif-
ferent magnetic field strengths. Invest Radiol 2005;40:715–724.
36. Barbier EL, den Boer JA, Peters AR, Rozeboom AR, Sau J, Bonmartin
A. A model of the dual effect of gadopentetate dimeglumine on
dynamic brain MR images. J Magn Reson Imaging 1999;10:242–253.
37. Yankeelov TE, Luci JJ, Lepage M, Li R, Debusk L, Lin PC, Price RR,
Gore JC. Quantitative pharmacokinetic analysis of DCE-MRI data
without an arterial input function: a reference region model. Magn
Reson Imaging 2005;23:519–529.
38. Wu O, Ostergaard L, Weisskoff RM, Benner T, Rosen BR, Sorensen
AG. Tracer arrival timing-insensitive technique for estimating flow in
MR perfusion-weighted imaging using singular value decomposition
with a block-circulant deconvolution matrix. Magn Reson Med 2003;
50:164–174.
39. Brix G, Bahner ML, Hoffmann U, Horvath A, Schreiber W. Regional
blood flow, capillary permeability, and compartmental volumes: mea-
surement with dynamic CT–initial experience. Radiology 1999;210:
269–276.
40. Jain RK. Transport of molecules in the tumor interstitium: a review.
Cancer Res 1987;47:3039–3051.
41. Gillis P, Peto S, Moiny F, Mispelter J, Cuenod CA. Proton transverse
nuclear magnetic relaxation in oxidized blood: a numerical approach.
Magn Reson Med 1995;33:93–100.
42. Kiselev VG, Novikov DS. Transverse NMR relaxation as a probe of
mesoscopic structure. Phys Rev Lett 2002;89:278101.
43. Thulborn KR, Waterton JC, Matthews PM, Radda GK. Oxygenation
dependence of the transverse relaxation time of water protons in
whole blood at high field. Biochim Biophys Acta 1982;714:265–270.
44. Hazlewood CF, Chang DC, Nichols BL, Woessner DE. Nuclear mag-
netic resonance transverse relaxation times of water protons in skele-
tal muscle. Biophys J 1974;14:583–606.
45. Stables LA, Kennan RP, Gore JC. Asymmetric spin-echo imaging of
magnetically inhomogeneous systems: theory, experiment, and
numerical studies. Magn Reson Med 1998;40:432–442.
46. Hosokawa M, Kenmotsu H, Koh Y, et al. Size-based isolation of circu-
lating tumor cells in lung cancer patients using a microcavity array
system. PloS One 2013;8:e67466.
47. van Osch MJ, Vonken EJ, Viergever MA, van der Grond J, Bakker CJ.
Measuring the arterial input function with gradient echo sequences.
Magn Reson Med 2003;49:1067–1076.
48. Anderson AW, Xie J, Pizzonia J, Bronen RA, Spencer DD, Gore JC.
Effects of cell volume fraction changes on apparent diffusion in
human cells. Magn Reson Imaging 2000;18:689–695.
49. Kennan RP, Zhong J, Gore JC. Intravascular susceptibility contrast
mechanisms in tissues. Magn Reson Med 1994;31:9–21.
50. Pathak AP, Rand SD, Schmainda KM. The effect of brain tumor
angiogenesis on the in vivo relationship between the gradient-echo
relaxation rate change (DeltaR2*) and contrast agent (MION) dose.
J Magn Reson Imaging 2003;18:397–403.
51. Weisskoff RM, Zuo CS, Boxerman JL, Rosen BR. Microscopic suscep-
tibility variation and transverse relaxation: theory and experiment.
Magn Reson Med 1994;31:601–610.
52. Yablonskiy DA, Haacke EM. Theory of NMR signal behavior in mag-
netically inhomogeneous tissues: the static dephasing regime. Magn
Reson Med 1994;32:749–763.
53. Boxerman JL, Paulson ES, Prah MA, Schmainda KM. The effect of
pulse sequence parameters and contrast agent dose on percentage sig-
nal recovery in DSC-MRI: implications for clinical applications.
AJNR Am J Neuroradiol 2013;34:1364–1369.
54. Skinner JT, Yankeelov TE, Peterson TE, Does MD. Comparison of
dynamic contrast-enhanced MRI and quantitative SPECT in a rat gli-
oma model. Contrast Media Mol Imaging 2012;7:494–500.
55. Moffat BA, Chenevert TL, Lawrence TS, et al. Functional diffusion
map: a noninvasive MRI biomarker for early stratification of clinical
brain tumor response. Proc Natl Acad Sci U S A 2005;102:
5524–5529.
784 Semmineh et al.


![CD8+ Tumor-Infiltrating T Cells Are Trapped in the Tumor … · 2016. 12. 19. · tumor cells induces immunogenic cross-presentation of dying tumor cells [4,5] or sensitizing tumor](https://static.fdocuments.in/doc/165x107/5fbd8f04c0953e25272e83ca/cd8-tumor-infiltrating-t-cells-are-trapped-in-the-tumor-2016-12-19-tumor-cells.jpg)