Assessing from Pilot Survey among in Sao Paulo - ilo.org · 8 “Crédito consignada já soma 45%...
52
EMPLOYMENT SECTOR ─ SOCIAL FINANCE PROGRAM ─ Assessing Indebtedness: Results from Pilot Survey among Steelworkers in Sao Paulo Bonnie Brusky Reginaldo Sales Magalhães Working Paper N° 46 International Labour Office Geneva
Transcript of Assessing from Pilot Survey among in Sao Paulo - ilo.org · 8 “Crédito consignada já soma 45%...
EMPLOYMENT SECTOR
─ SOCIAL FINANCE PROGRAM ─
Assessing Indebtedness: Results
from Pilot Survey among Steelworkers in Sao Paulo
Bonnie Brusky Reginaldo Sales Magalhães
Working Paper N° 46
International Labour Office
Geneva

Social Finance Programme
Working paper No. 46
Assessing Indebtedness: Results from Pilot Survey among Steelworkers in Sao Paulo
Bonnie Brusky
Reginaldo Sales Magalhães
Employment Sector International Labour Organisation, Geneva

Copyright © International Labour Organization 2006 First published 2007 Publications of the International Labour Office enjoy copyright under Protocol 2 of the Universal Copyright Convention. Nevertheless, short excerpts from them may be reproduced without authorization, on condition that the source is indicated. For rights of reproduction or translation, application should be made to the ILO Publications (Rights and Permissions), International Labour Office, CH-1211 Geneva 22, Switzerland, or by email: [email protected]. The International Labour Office welcomes such applications.
Libraries, institutions and other users registered in the United Kingdom with the Copyright Licensing Agency, 90 Tottenham Court Road, London W1T 4LP [Fax: (+44) (0)20 7631 5500; email: [email protected]], in the United States with the Copyright Clearance Center, 222 Rosewood Drive, Danvers, MA 01923 [Fax: (+1) (978) 750 4470; email: [email protected]] or in other countries with associated Reproduction Rights Organizations, may make photocopies in accordance with the licences issued to them for this purpose.
ISBN. 978-92-2-120063-5 (print) ISBN. 978-92-2-120064-2 (web pdf) First published 2007 ILO Cataloguing in Publication Data The designations employed in ILO publications, which are in conformity with United Nations practice, and the presentation of material therein do not imply the expression of any opinion whatsoever on the part of the International Labour Office concerning the legal status of any country, area or territory or of its authorities, or concerning the delimitation of its frontiers.
The responsibility for opinions expressed in signed articles, studies and other contributions rests solely with their authors, and publication does not constitute an endorsement by the International Labour Office of the opinions expressed in them.
Reference to names of firms and commercial products and processes does not imply their endorsement by the International Labour Office, and any failure to mention a particular firm, commercial product or process is not a sign of disapproval.
ILO publications can be obtained through major booksellers or ILO local offices in many countries, or direct from ILO Publications, International Labour Office, CH-1211 Geneva 22, Switzerland. Catalogues or lists of new publications are available free of charge from the above address, or by email: [email protected]
Visit our website: www.ilo.org/publns
Printed by the International Labour Office, Geneva, Switzerland
Table of Contents
Foreword ............................................................................................................ iii
Acknowledgements .............................................................................................v
I. Background .................................................................................................... 2
II. Conceptual Framework ................................................................................. 6
Over-indebtedness and implications ..................................................... 6
Worker over-indebtedness and trade unions ........................................ 7
III. Methodology............................................................................................... 10
Questionnaire...................................................................................... 10
Sample................................................................................................ 11
Processing .......................................................................................... 13
Debt/Income Ratio....................................................................... 13
Outstanding Balance of Late Payments ...................................... 15
Indebtedness indicator ................................................................ 15
IV. Findings ..................................................................................................... 18
Socio-economic characteristics of overall population.......................... 18
Use of financial services ..................................................................... 19
Perceptions......................................................................................... 22
Characterizing Debts .......................................................................... 24
Financial planning ............................................................................... 27
Who is over-indebted? ........................................................................ 28
Indebtedness indicator..................................................................... 28
Bad Credit Record ........................................................................... 30
Characterizing the extremes – answer tree results .......................... 32
V. Discussion of findings and Recommendations............................................ 34
References and Sources.................................................................................. 40
List of Tables
Table 1. Revenues and Expenses of Low and Medium-Income Households in
São Paulo .......................................................................................... 5
Table 2. Comparison of Sample to Unionized Steelworkers Population.......... 12
Table 3. Indebtedness Indicator ...................................................................... 17
Table 4. Most commonly used debt forms and usage ..................................... 25
Table 5. Which debts are liquidated? .............................................................. 26
Table 6. Household financial management ..................................................... 27
Table 7. Financial planning.............................................................................. 28
List of Boxes Box 1. Research Questions.............................................................................. 11
Box 2. Forms of Credit Debt Used to Elaborate Debt/Income Ratio................. 14
Box 3. List of Payments.................................................................................... 15
List of Graphs Graph 1. Average Household Monthly Income in Reais.................................. 19
Graph 2. Use of Financial Services ................................................................. 20
Graph 3. Type of Credit Cards ......................................................................... 21
Graph 4. Most common form of payment ........................................................ 21
Graph 5. Making ends meet is…..................................................................... 22
Graph 6. Expenditures .................................................................................... 23
Graph 7. Number of debts............................................................................... 24
Graph 8. Indebtedness indicator ..................................................................... 29
iii
Foreword
In response to the demand expressed by worker delegates at the Governing
Body’s Employment and Social Policy Committee in November 2002, financial
education by and through trade unions is considered an example where the expertise of
Social Finance can enhance the service provision and advocacy functions of worker
organizations.
The present paper is the follow-up to a needs and demand analysis for financial
education, among worker organizations in São Paulo (Central Única dos Trabalhadores,
Confederação Geral dos Trabalhadores, Social Democracia Sindical, Força Sindical,
Central Autônoma de Trabalhadores) in October 2004. The survey found that there was
a certain lack of knowledge levels of worker indebtedness. Although all interviewees
expressed interest in learning more about the possible need for financial education, the
CUT-affiliated Steelworkers Union of the ABC region of São Paulo showed strong
interest in a study of the level of indebtedness of its members.
This present report summarizes the results of this study on indebtedness,
conducted in April-May 2006 by Bonnie Brusky and Reginaldo Sales Magalhães.
It is part of an initiative by the Social Finance Program to determine the
involvement of worker organizations in preventing or mitigating overindebtedness of
workers. Similar surveys of the situation in France and Germany have already been
published in the working paper series of Social Finance Program.
The first section provides a background on indebtedness in the Brazilian
context. Section two lays out the conceptual framework that served as a basis for this
study. Section three presents the methodology and section four gives the key findings.
iv
The overall conclusions and recommendations for a financial orientation program for the
Steelworker’s Union are discussed in section five.
Amongst the findings are some surprising observations:
1. Trade unions are actively involved in negotiating with Banks.
2. Strikes may be rendered less effective by a high level of indebtedness of
unionized workers.
3. Unionization implies a certain job security still in turn could stimulate
consumption and taking on bank loans.
Bernd Balkenhol Chief Social Finance Program

v
Acknowledgements
The authors would like first like to thank the following people for their tireless
patience, enthusiasm and support. Without them, the field work for this study would not
have been possible: Bernd Balkenhol and Nalina Ganapathi of the ILO Social Finance
Unit, Tarcísio Secoli and his team from the Steelworkers Union; Marcelo Cunha and
Silva Carui and their team of interviewers from Projectiva Pesquisa; Elza Pastor and her
team, who patiently performed the processing. We would also like to thank Vera Rita de
Mello Ferreira, Professor of Economic Psychology and Cassia d’Aquina, consultant in
financial education for their excellent contributions to this work. Last and certainly not
least, we thank all the anonymous interviewees who generously gave their time and
opened up their financial lives for the purposes of this study.
2
I. Background
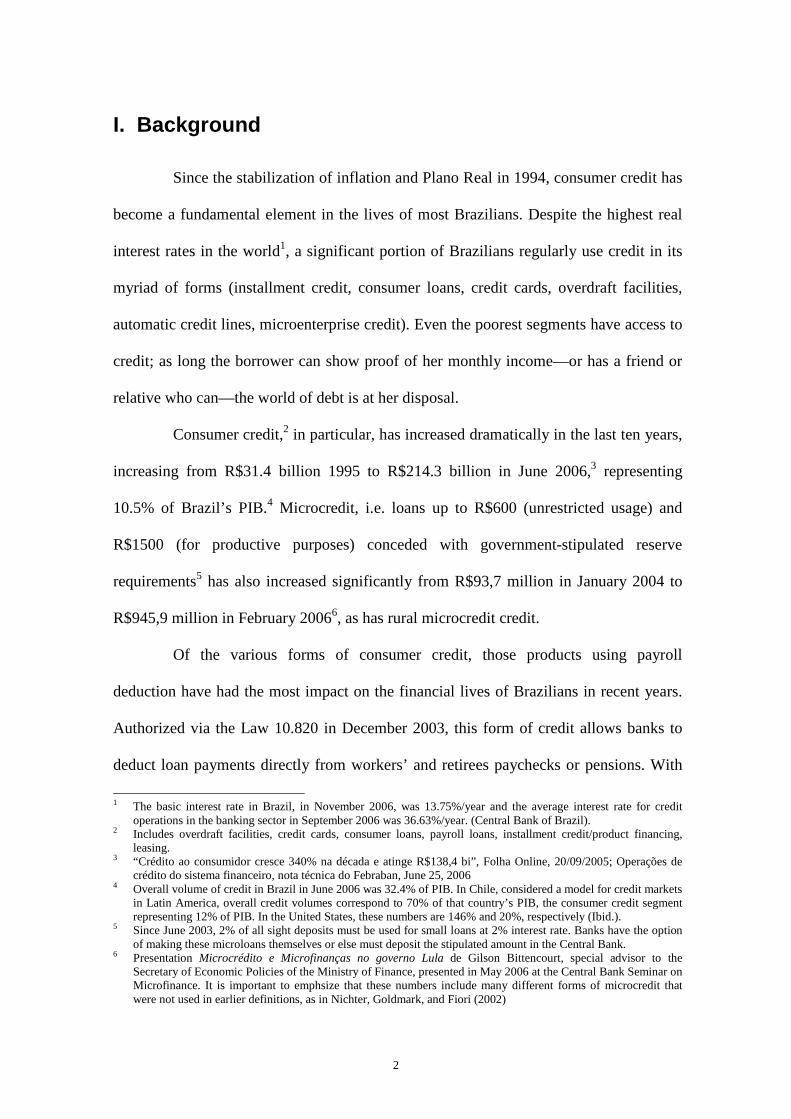
Since the stabilization of inflation and Plano Real in 1994, consumer credit has
become a fundamental element in the lives of most Brazilians. Despite the highest real
interest rates in the world1, a significant portion of Brazilians regularly use credit in its
myriad of forms (installment credit, consumer loans, credit cards, overdraft facilities,
automatic credit lines, microenterprise credit). Even the poorest segments have access to
credit; as long the borrower can show proof of her monthly income—or has a friend or
relative who can—the world of debt is at her disposal.
Consumer credit,2 in particular, has increased dramatically in the last ten years,
increasing from R$31.4 billion 1995 to R$214.3 billion in June 2006,3 representing
10.5% of Brazil’s PIB.4 Microcredit, i.e. loans up to R$600 (unrestricted usage) and
R$1500 (for productive purposes) conceded with government-stipulated reserve
requirements5 has also increased significantly from R$93,7 million in January 2004 to
R$945,9 million in February 20066, as has rural microcredit credit.
Of the various forms of consumer credit, those products using payroll
deduction have had the most impact on the financial lives of Brazilians in recent years.
Authorized via the Law 10.820 in December 2003, this form of credit allows banks to
deduct loan payments directly from workers’ and retirees paychecks or pensions. With
1 The basic interest rate in Brazil, in November 2006, was 13.75%/year and the average interest rate for credit
operations in the banking sector in September 2006 was 36.63%/year. (Central Bank of Brazil). 2 Includes overdraft facilities, credit cards, consumer loans, payroll loans, installment credit/product financing,
leasing. 3 “Crédito ao consumidor cresce 340% na década e atinge R$138,4 bi”, Folha Online, 20/09/2005; Operações de
crédito do sistema financeiro, nota técnica do Febraban, June 25, 2006 4 Overall volume of credit in Brazil in June 2006 was 32.4% of PIB. In Chile, considered a model for credit markets
in Latin America, overall credit volumes correspond to 70% of that country’s PIB, the consumer credit segment representing 12% of PIB. In the United States, these numbers are 146% and 20%, respectively (Ibid.).
5 Since June 2003, 2% of all sight deposits must be used for small loans at 2% interest rate. Banks have the option of making these microloans themselves or else must deposit the stipulated amount in the Central Bank.
6 Presentation Microcrédito e Microfinanças no governo Lula de Gilson Bittencourt, special advisor to the Secretary of Economic Policies of the Ministry of Finance, presented in May 2006 at the Central Bank Seminar on Microfinance. It is important to emphsize that these numbers include many different forms of microcredit that were not used in earlier definitions, as in Nichter, Goldmark, and Fiori (2002)

3
the lowest interest rates on the market (1.5-4%/month7), this modality accounts for 45%
of all personal loans made by banks at the end of 20058. It is the second most common
form of consumer credit, after vehicle financing, accounting for 18.9% of all consumer
credit in June 20069. The majority of borrowers are low-income earners: 46% earn only
one minimum salary per month (roughly US$130 in 2005) and another 16% earn up to
two minimum salaries10. Civil servants have borrowed more heavily than private sector
workers, accounting for some 87% of the total volume of payroll credit in June 200611.
The number of microcredit contracts used for consumption purposes grew from
166,000 in January 2004 to 788,000 in August 2006.The average amount of these
contracts also grew during the same period, from R$2200 to R$3000. The average
interest rate for payroll credit dropped from 34.55% in January 2004 to 24.29% in
August 200612.
The access of low-income population to bank services also increased
dramatically during this period. According to data from the Central Bank, the number of
“simplified accounts”13 grew from 1.9 million in January 2004 to 6.7 million in August
2006. With the impressive growth of banking correspondent points, all the
municipalities in Brazil now have at least one banking service point.
On the one hand, this evolution is positive in that it represents greater options
for low-income populations to manage their finances. Indeed, most payroll borrowers
7 Still considered high by some economists, given the little risk involved in such loans. 8 “Crédito consignada já soma 45% do crédito pessoal”, Folha Online, 05/12/2005. 9 Ibid, Febraban. 10 “Crédito consignado em folha de pagamento”, internal document, PSDB, taken from the Internet 08/12/2005 at
www.psdb.org.br/assessoria_tecnica/documentos/RJDF293-050718-CreditoConsignado.PDF 11 “Empréstimo pessoal é o crédito mais utilizado pelos brasileiros”, Diário de São Paulo (cited on website of
Febraban, 06/2006) 12 Central Bank of Brazil (http://www.bcb.gov.br/?MICROFIN). 13 Special accounts created to meet the needs of low-income populations. The requirements are “simplified” (ID and
address) and the maximum account balance is R$1000. No banking fees are charged.
4
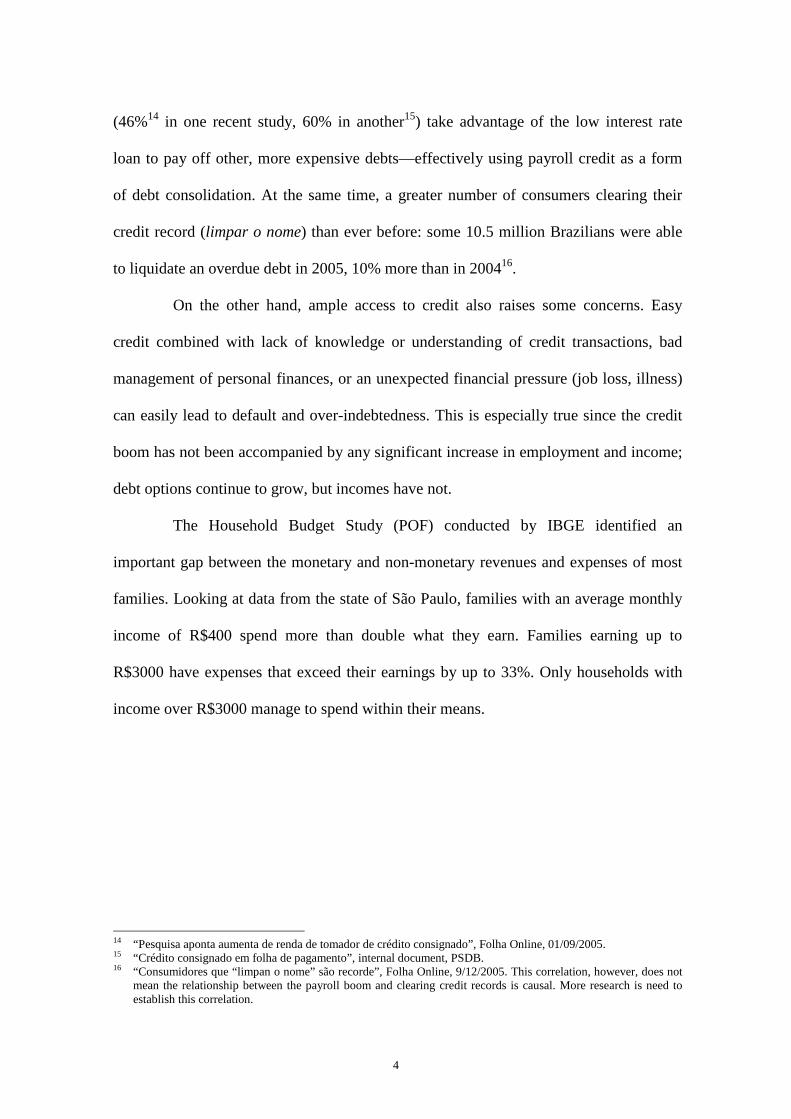
(46%14 in one recent study, 60% in another15) take advantage of the low interest rate
loan to pay off other, more expensive debts—effectively using payroll credit as a form
of debt consolidation. At the same time, a greater number of consumers clearing their
credit record (limpar o nome) than ever before: some 10.5 million Brazilians were able
to liquidate an overdue debt in 2005, 10% more than in 200416.
On the other hand, ample access to credit also raises some concerns. Easy
credit combined with lack of knowledge or understanding of credit transactions, bad
management of personal finances, or an unexpected financial pressure (job loss, illness)
can easily lead to default and over-indebtedness. This is especially true since the credit
boom has not been accompanied by any significant increase in employment and income;
debt options continue to grow, but incomes have not.
The Household Budget Study (POF) conducted by IBGE identified an
important gap between the monetary and non-monetary revenues and expenses of most
families. Looking at data from the state of São Paulo, families with an average monthly
income of R$400 spend more than double what they earn. Families earning up to
R$3000 have expenses that exceed their earnings by up to 33%. Only households with
income over R$3000 manage to spend within their means.
14 “Pesquisa aponta aumenta de renda de tomador de crédito consignado”, Folha Online, 01/09/2005. 15 “Crédito consignado em folha de pagamento”, internal document, PSDB. 16 “Consumidores que “limpan o nome” são recorde”, Folha Online, 9/12/2005. This correlation, however, does not
mean the relationship between the payroll boom and clearing credit records is causal. More research is need to establish this correlation.

5
Table 1. Revenues and Expenses of Low and Medium-I ncome Households in São Paulo
Income (R$) Average Total Expenses
Average Total Income
Expenses in % of income
Up to 400 587,33 278,70 211%
> 400 to 600 660,90 496,45 133%
> 600 to 1 000 996,85 776,16 128%
> 1.000 to 1.200 1 200,96 1 088,19 110%
> 1.200 to 1.600 1 442,76 1 367,52 106%
> 1.600 to 2.000 2 036,87 1 770,36 115%
> 2.000 to 3.000 2 472,64 2 419,72 102%
> 3.000 to 4.000 3 167,92 3 440,67 92%
> 4.000 to 6.000 4 332,70 4 779,40 91%
> 6.000 8 718,02 10 158,18 86%
Source: Pesquisa de Orçamento Familiar - São Paulo – 2003
At the same time default rates 2006 for bank loans, checks and credit cards are
up 14% compared to last year, according to credit bureau SERASA.17
While these two pieces of data are not entirely comparable (the POF looks at
households and examines overall income and expenses; the default data refers to specific
credit modalities and looks at individuals), they suggest nevertheless that indebtedness is
an important financial management strategy yet not easily controlled by worker
households. A significant number of people in São Paulo are unable to meet their
financial obligations, but to what extent this is a problem? After all, being in debt is not
synonymous with over-indebtedness. Credit is a powerful, even necessary survival
strategy for low income households to make ends meet and to smoothen consumption.
17 Insolvência ameaça expansão do crédito”, Folha de São Paulo, 06/10/2006.

6
Defaulting on one debt does not necessarily constitute over-indebtedness. Defaulting
may be due to a temporary situation (loss of job, illness, late payment of salary) or that
of someone else, in cases where the borrower “lends” her name.18 What is the difference
between simply being in debt and being over-indebted?
II. Conceptual Framework
Over-indebtedness and implications
Unlike “financial insolvency” or “bankruptcy”, there is no legal definition of
the term “over-indebtedness.” The Commission for Consumer Rights of the European
Union defines over-indebtedness as a situation in which a person is unable to pay his or
her debts with the income s/he disposes of. For the purposes of this study, the term refers
to a situation in which total monthly debt installments account for more than 75% of
monthly income or total monthly debt installments account for more than 50% of
monthly income and basic utility bills are more than 30 days late.19
The Observatory on Consumer Indebtedness of the University of Coimbra,
Portugal, defines two types of over-indebtedness: active and passive. The former refers
to a situation in which the individual actively contributes to creating a situation of over-
indebtedness, due to lack of control or bad will. The latter involves unforeseen
circumstances that drastically affect the individual’s capacity to repay. Some studies
suggest that passive indebtedness is more common than active. In this case, it would
seem prevention has more to do with effective financial and social safety nets than
changing behaviors. With active indebtedness, however, we are dealing with a social
18 The practice of lending one’s name for a third person to access credit is exceedingly common in Brazil 19 The methodology section will address this definition in detail.
7
process (Reifner, et al, 2002), something that happens over time, resulting in
accumulating debts, contracted for economic, social, cultural and other reasons.
Just like debt at a macro-economic level, some household debt can be
beneficial, improving standards of living by enabling asset acquisition and smoothing
consumption. However, excessive debt leads to the deterioration of a household’s
economic situation and increased vulnerability. One unforeseen event like illness,
divorce or job loss and the household goes from being indebted to over-indebted.
Over-indebtedness is a drastic reduction of financial liberty even leading to a
situation of semi-marginality.20 This is especially true in Brazil, where buying on credit
is the most common form of acquiring just about any consumer good. Pauperization is
inevitable, especially when interest rates are high, making further asset acquisition
impossible. The debtor, unable to use formal financial options, has no choice but to call
on high priced informal lenders or friends and family for assistance. If social ties are
weak, the risk of complete destitution and marginalization is great.
Worker over-indebtedness and trade unions
The risk of over-indebtedness is considerable for salaried workers. While this
segment may be characterized by financial stability, it is also the segment that is most
targeted by creditors since their monthly paycheck offers security and suggests an ability
to repay. Workers testify to receiving unsolicited credit cards in the mail, phone calls
from consumer loan companies and report that a pay stub, especially from a large,
established enterprise—regardless of the salary—guarantees installment credit in most
stores.
20 Brusky and Fortuna, 2002.

8
If credit has always been easy to come by, it has just become more easily
available with the recent expansion of payroll loans. Initially conceived as a tool to
stimulate consumption, the payroll loan has been a boon to the heavily indebted, as it
enables them to pay off their most expensive debts. According to the law, payroll loans
do not exceed four years21 and installments may not exceed 30% of the monthly wage.
Since the law was adopted in 2003, all the major trade unions have brokered deals with
banks to extend the payroll loan product to unionized workers.
Loan approval is subject to a credit history check, but such verification does not
give a faithful picture of a potential debtor’s financial situation. First of all, many debts
contracted formally are not processed in the information systems of the main credit
bureaus. It is possible, for example, to have installment plans (to purchase electro-
domestic goods on a deferred payment plan) and not appear as having a credit history,
provided the debtor is paying on time. Secondly, there are many informal ways to
contract debt, which are off the standard credit check radar. For someone who manages
his finances with a minimum of discipline, this ease of access does not necessarily pose
a problem. For the uncontrolled spender, however, there is a risk of accumulating debt
and going beyond re-payment capacity.
Qualitative research conducted by the authors suggests that this is not an
uncommon scenario. In a recent strike at the Volkswagen factory in São Paulo, workers
revealed that concerns about accumulating debts was one of the reasons they decided to
negotiate and return to work22. Also in Volkswagen, there have been cases of workers
opting for “voluntary demission (PDV),” in order to collect a lump-sum unemployment
compensation (equivalent to 40% of income earned per year since working in the
21 Initially the term was 4 years, then reduced to three, only to return to 4 in the most recent modifications to the law. 22 Personal communication, 8/12/2005.

9
factory) to clean up their financial situation23. In other words, some people have gone as
far as quitting their job in order to reduce immediate financial stress, and this in an
economy with an unemployment rate of nearly 10%.
Trade unions are not directly responsible for the personal finances of their
members. But because over indebtedness undermines their efforts of wage protection
and income security, questions of worker indebtedness have a place on their agenda.
Indeed, unions championed payroll loan deals between banks and companies, as a way
“to help workers free themselves from their overdraft debt...and not stimulate workers’
overindebtedness...”24 The question is: do payroll-deduction based consumer loans
contribute to the very condition they were supposed to avoid? Is there a need to look
beyond financial responses to workers’ budget problems to broader, education-based
alternatives?
Financial education, combined with consumer protection legislation, is
considered an important measure for reducing overindebtedness, as demonstrated by the
increasing number of policy developments in European Union Member States25.
Designing an effective education program requires an understanding of the risk factors
and behaviors associated with overindebtedness and, conversely, the conditions and
behaviors associated with a healthy financial situation. This makes it possible to address
the behavior that needs to change, and offer a set of new behaviors to strive for.
Against this background the study seeks to (1) assess levels of
overindebtedness in the sample population and (2) determine if there are any socio-
economic characteristics or financial use behaviors associated with people who are over-
indebted. The sample was drawn from unionized workers from the CUT-affiliated
23 Idem. 24 www.cut.org.br/documentos/emprestimos.htm taken from internet 10/2004 25 see Reifner, et. al. (2002).Consumer Overindebtedness and Consumer Law in the European Union
10
Steelworkers Union from the ABC region26, located southeast of the São Paulo
metropolitan area.
The CUT Steelworkers Union is one of the most organized and well-known in
the country. It is the organization where President Lula first got his start. The
Steelworkers have battled for years to achieve their present-day working conditions.
III. Methodology
A quantitative methodology was chosen in order to measure and compare debt
levels. A research firm experienced in conducting quantitative debt research was hired to
train interviewers and apply the questionnaire at the interviewees’ workplace. The
Steelworker’s Union brokered contacts with companies and mills with unionized
employees. The research firm managed these contacts and set up interviews based on
company and worker availability.
Questionnaire
A 45-question questionnaire was applied to 300 workers over the month of
May 2006. The following key questions guided the elaboration of the questionnaire.
26 Refering to the three cities Santo Andre, São Bernardo, and São Caetano.
11
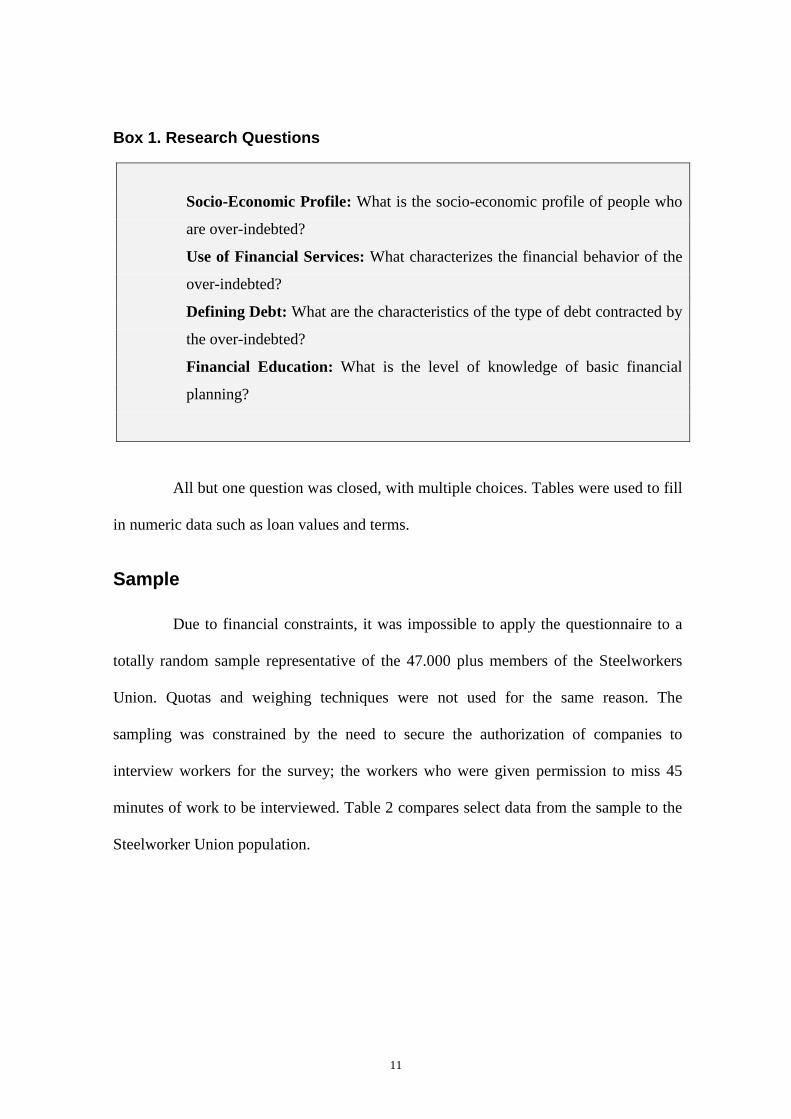
Box 1. Research Questions
Socio-Economic Profile: What is the socio-economic profile of people who
are over-indebted?
Use of Financial Services: What characterizes the financial behavior of the
over-indebted?
Defining Debt: What are the characteristics of the type of debt contracted by
the over-indebted?
Financial Education: What is the level of knowledge of basic financial
planning?
All but one question was closed, with multiple choices. Tables were used to fill
in numeric data such as loan values and terms.
Sample
Due to financial constraints, it was impossible to apply the questionnaire to a
totally random sample representative of the 47.000 plus members of the Steelworkers
Union. Quotas and weighing techniques were not used for the same reason. The
sampling was constrained by the need to secure the authorization of companies to
interview workers for the survey; the workers who were given permission to miss 45
minutes of work to be interviewed. Table 2 compares select data from the sample to the
Steelworker Union population.

12
Table 2. Comparison of Sample to Unionized Steelwo rkers Population
Union* Sample
47313 300 Sex
Male 91.6% 93.0%
Female 8.4% 7.0%
Age group
18-29 17.3% 39.7%
30-39 31.2% 28.7%
40-49 30.5% 26.3%
50+ 21.0% 5.3%
Size of Firm
< 150 ** 5.3%
> 150 - < 500 29.7%
> 500 65% * Source: Steelworkers Union DIEESE sub-sector office, 12/2005
** We did not have precise data on this at the time of writing but the secretary-general of the Union estimates that the overwhelming majority of firms are small (<150) and only 10% in the medium/large categories.
The sample studied a younger population than what is representative of the
union. It also is skewed in terms of firm size. The union does not have precise data on
the breakdown of firms according to size, but estimates that the overwhelming majority
of firms are small (<150) and only 10% in the medium/large categories. The sample
drew on workers from mainly large and medium firms (nearly 95% of all interviewees).
This is due to the reason outlined above. Despite efforts to include workers from small
firms, the researchers were unable to secure permission to apply the questionnaire. In
firms of 10-20 workers, the absence of even one employee is felt.

13
From a statistical standpoint, the results of this survey are not representative of
the Steelworker’s Union. The sample size—not even one percent of the total
population—is simply too small to make predications or generalizations. The sample
does not reflect the overall universe in terms of firm size or age, either, due to the
abovementioned sampling constraints. However, we can talk about trends and
tendencies. Much as qualitative methods draw descriptive, if not statistical, conclusions,
the results of this survey offer descriptive clues to understanding characteristics of over-
indebtedness.
Processing
Data processing was conducted by a firm specialized in quantitative processing
and statistics. Data from each questionnaire was analyzed against four main indicators:
debt/income ratio, outstanding balance of late payments, terms and outstanding credit
balance. These four indicators were combined to make a fifth, the indebtedness
indicator. Classification and regression trees were then constructed to establish which
variables were statistically associated with situations of over-indebtedness. The objective
of this analysis (presented in a format known as the Answer Tree), was to determine
“rules” that could be used to identify individuals who are likely to become overindebted.
Debt/Income Ratio
Debt is defined here as the sum of outstanding all credit installments for the
month of interview excluding home loan payments. Housing credit was not included
since loan amounts are generally much larger and have longer terms than other forms of

14
credit, which would make them look more indebted than the non homeowners. Income
refers to household income as reported in the questionnaire27.
Because revolving debt (like credit cards or overdraft facilities) and credit from
informal sources usually do not have a specific term — it’s possible to have an overdraft
or credit card balance for years — interviewees were asked to estimate what they
planned to pay on that debt that month.
Box 2. Forms of Credit Debt Used to Elaborate Debt/ Income Ratio
Each interviewee was analyzed according to this ratio, and classified in one of
five categories:
1. No debt
2. 0-25% of income compromised by debt
3. 25-50% of income compromised by debt
4. 50-75% of income compromised by debt
5. > 75% of income compromised by debt
27 Household income was used rather than individual income as the authors’ previous research has found that
pooling resources is the most common form of financial management.
Source
1. Fixed installment on a loan Bank, consumer credit agency
2. Fixed installment to be made on a payment plan
Stores
3. Estimated amount debtor plans to pay that month on loan
Informal sources (friends, moneylenders)
4. Estimated amount debtor plans to pay that month on credit card bill (may be the required minimum or more)
Credit cards, all issuers (banks, financeiras, stores, supermarkets)
5. Estimated amount debtor plans to pay that month to reduce overdraft
Overdraft

15
Outstanding Balance of Late Payments
The debt/income ratio does not take into account late payments on
commitments like utility bills, tax payments and rent because they are not sources of
credit. Nonetheless, they can turn into debt in the event of non-payment. To account for
this form of debt, interviewees were asked to list bill payments that were more than 30
days late (see Box 3).
Box 3. List of Payments
Indebtedness indicator
The debt/income ratio and outstanding balance of late payments were used to
create the indebtedness indicator. Our intention was to classify an individual’s debt
1. Rent
2. Condo fees
3. Electric bill
4. Water bill
5. Telephone bill
6. Mobile bill
7. Gas bill
8. Education fees
9. Health insurance fees
10. Informal store credit
11. Taxes
12. IRPF
13. Property tax
14. Vehicle-related taxes and/or Fines
15. Monthly consortia
16. Others
16
situation based on monthly debt installments and overall debt balance, using monthly
household income as a reference, while taking into account the debt terms (short,
medium, long-term).
We established four categories: no debt, slightly indebted, at risk and over-
indebted. The results of the debt/income ratio and late payment data determine under
which category the interviewee falls. A worker is categorized as slightly indebted, for
example, if his debt/income ratio shows no debt, but he is behind on some payments.
Another interviewee may be classified as slightly indebted if up to 25% of his income is
compromised by debt, regardless of whether or not he is behind on late payments28. A
third interviewee may be in the same category if she has a debt/income ratio of between
25-50%, but she is not late on any bills. If the same person was also late on bill
payments, she would fall under the at-risk category.
28 The average amount of late payments for the 0-25% debt/income category is R$132; the average for the 25-50%
category is R$292, while the average for the 50-75% category is R$775.

17
Table 3. Indebtedness Indicator
Conditions
Category Debt/income ratio Late on Any Payments?
No debt No debt No
No debt Yes
> 0 e <= 25% Yes or No
Slightly indebted
> 25% and < 50% No
> 25% and < 50% Yes At Risk
> 50% and < 75% No
> 50% Yes Over-indebted
> 75% Yes or No**
This indicator is different from most other measures of indebtedness used in
the media which generally talk about debt in terms of credit default rates. Aggregated
default data is usually reported by credit industry associations. Banks release default
statistics via the National Federation, while credit card companies and consumer lenders
rely on the National Association of Credit, Finance and Investment Institutions. Most all
gather their data from the Central Bank’s central de risco. Default rates are also
reported in terms of SERASA bounced checks. Some business federations like
FECOMERCIO in São Paulo conduct regular indebtedness surveys which ask
respondents to report what percent of their income is compromised by debt, but there is
no analysis of the composition of debt. Moreover, recent research shows that even the
main credit bureaus (SERASA, SPC) are unable to unite all the information necessary to
effectively evaluate levels of indebtedness (Bittencourt, Magalhães and Abramovay,
2005).

18
The indicator constructed for this survey looks at all debt sources, formal and
informal, and includes late payments.
IV. Findings
Socio-economic characteristics of overall populatio n
The majority of interviewees, some 60%, have an average household monthly
income of less than R$1600 (see graph 1). About 28% earn between R$400-1000, which
in São Paulo is considered low-income. The 32% earning between R$1000-1600 could
be classified as “upper-lower income” workers. The 34% with monthly income of
R$1600-3000 could be considered lower middle class. Most interviewees (66,3%) have
completed secondary education. Sixty-four percent are married with children and 77,3%
own their home. Two-thirds of respondents live in a household with between three and
five family members, while nearly half of all respondents have only one wage-earner.
One-third of all respondents have two wage-earners in the home. Practically none of
these socio-economic characteristics proved statistically correlated to situations of over-
indebtedness, with the exception of home-ownership, discussed below. This seems
surprising, given the POF results which show that on average families earning up to
R$3000 spend more than they earn. Indeed, the lack of correlation could be a
consequence of the sampling method which, as noted above, did not use quotas or
weighing techniques. However, it could also suggest that overindebtedness among wage
earners (the POF sample includes microentrepreneurs, unemployed, students, as well as
salaried workers) has more to do with choices and behaviors found among rich and poor
alike, rather than paycheck size.

19
Graph 1. Average Household Monthly Income in Reais
020406080
100120
400-1000
1000-1600
1600-2000
2000-3000
3000-4000
4000-6000
morethan6000
Use of financial services
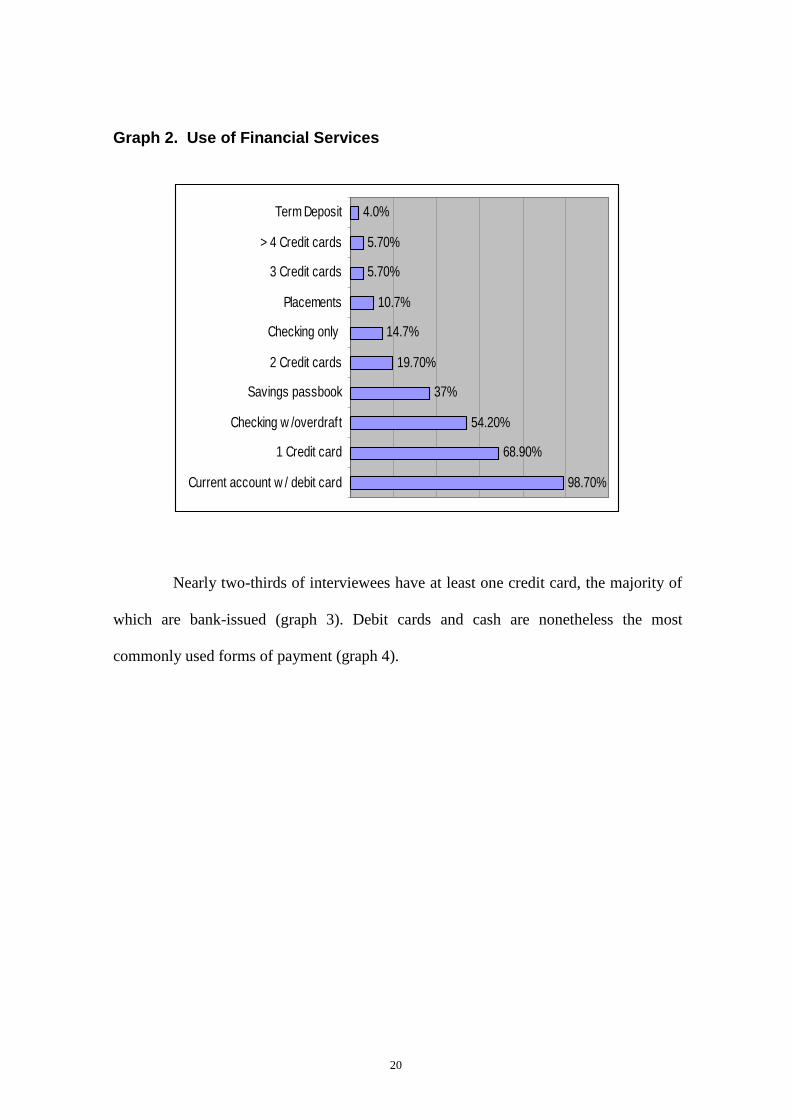
All but one respondent have a bank account and slightly more than one-third
have a saving passbook, as well. A small percentage (14.7%) of respondents use other
savings products like term deposits and savings certificates. Roughly two-thirds of
respondents use checks. Slightly more than half of these have overdraft privileges. Of
those who do not use checks, about 75% did not want checking services or were not
offered them. Some twenty percent had their checking services cancelled or were not
permitted to have a checkbook (graph 2).
20
Graph 2. Use of Financial Services
98.70%
68.90%
54.20%
37%
19.70%
14.7%
10.7%
5.70%
5.70%
4.0%
Current account w / debit card
1 Credit card
Checking w /overdraft
Savings passbook
2 Credit cards
Checking only
Placements
3 Credit cards
> 4 Credit cards
Term Deposit
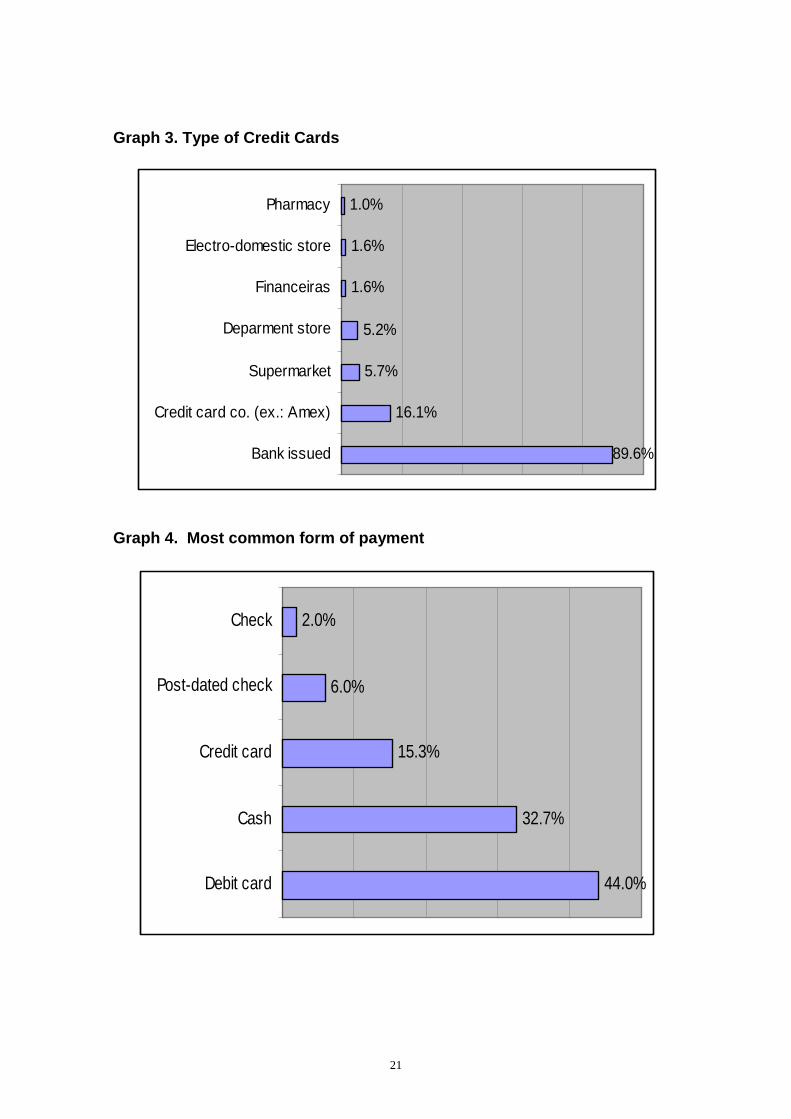
Nearly two-thirds of interviewees have at least one credit card, the majority of
which are bank-issued (graph 3). Debit cards and cash are nonetheless the most
commonly used forms of payment (graph 4).
21
Graph 3. Type of Credit Cards
89.6%
16.1%
5.7%
5.2%
1.6%
1.6%
1.0%
Bank issued
Credit card co. (ex.: Amex)
Supermarket
Deparment store
Financeiras
Electro-domestic store
Pharmacy
Graph 4. Most common form of payment
44.0%
32.7%
15.3%
6.0%
2.0%
Debit card
Cash
Credit card
Post-dated check
Check

22
Somew hat diff icult43%
Somew hat easy29%
Very diff icult26%
Very easy2%
Perceptions
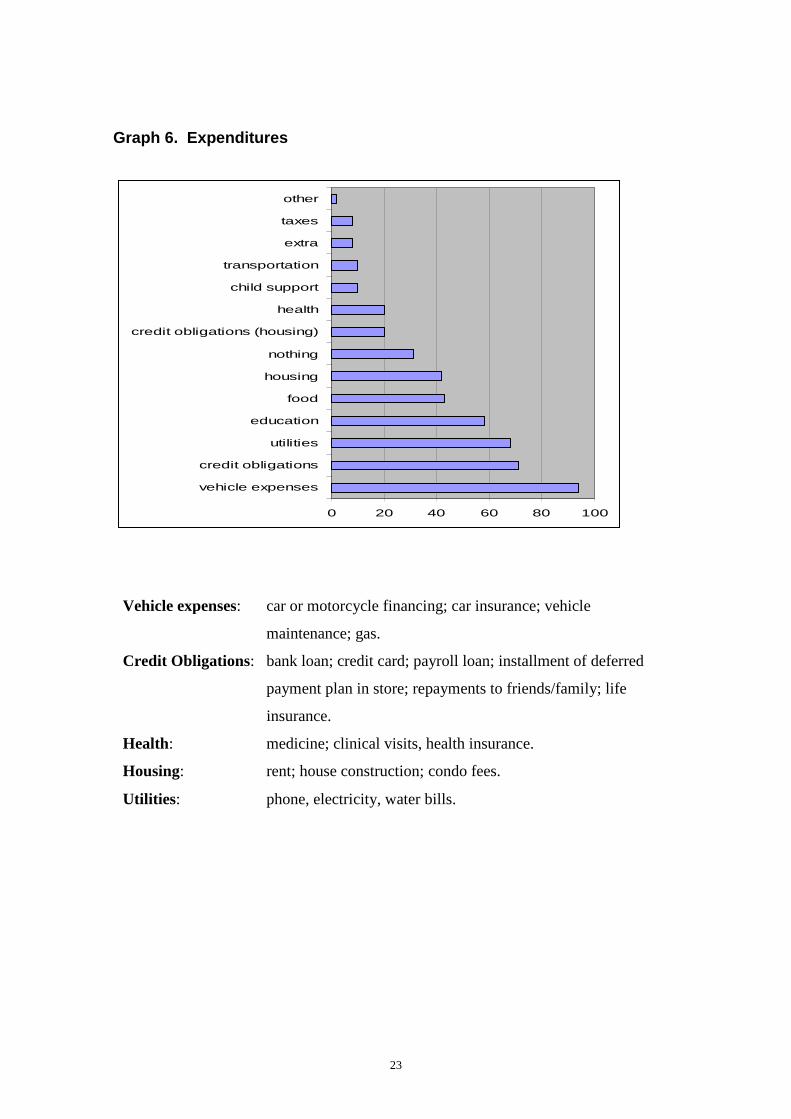
Most interviewees find it somewhat or very difficult to make ends meet (graph
5). When asked to list the regular monthly expenditures (i.e. not unforeseen events) that
most disrupt their monthly budget, vehicle expenses topped the list, with credit
obligations and utility bills coming in second and third (graph 6).
Graph 5. Making ends meet is…
23
Graph 6. Expenditures
0 20 40 60 80 100
vehicle expenses
credit obligations
utilities
education
food
housing
nothing
credit obligations (housing)
health
child support
transportation
extra
taxes
other
Vehicle expenses: car or motorcycle financing; car insurance; vehicle
maintenance; gas.
Credit Obligations: bank loan; credit card; payroll loan; installment of deferred
payment plan in store; repayments to friends/family; life
insurance.
Health: medicine; clinical visits, health insurance.
Housing: rent; house construction; condo fees.
Utilities : phone, electricity, water bills.

24
Characterizing Debts
Roughly two-thirds of the total sample — 207 respondents — use some form of
credit or lives with someone with some form of credit. The majority — 47% — have
only on outstanding credit, while a little more than 20% have two or more forms of
credit debt.
Graph 7. Number of debts
Respondents with up to two debts fall into the no or low risk overindebtedness
category, while most of those with three debts or more are in the at-risk or over-indebted
categories.
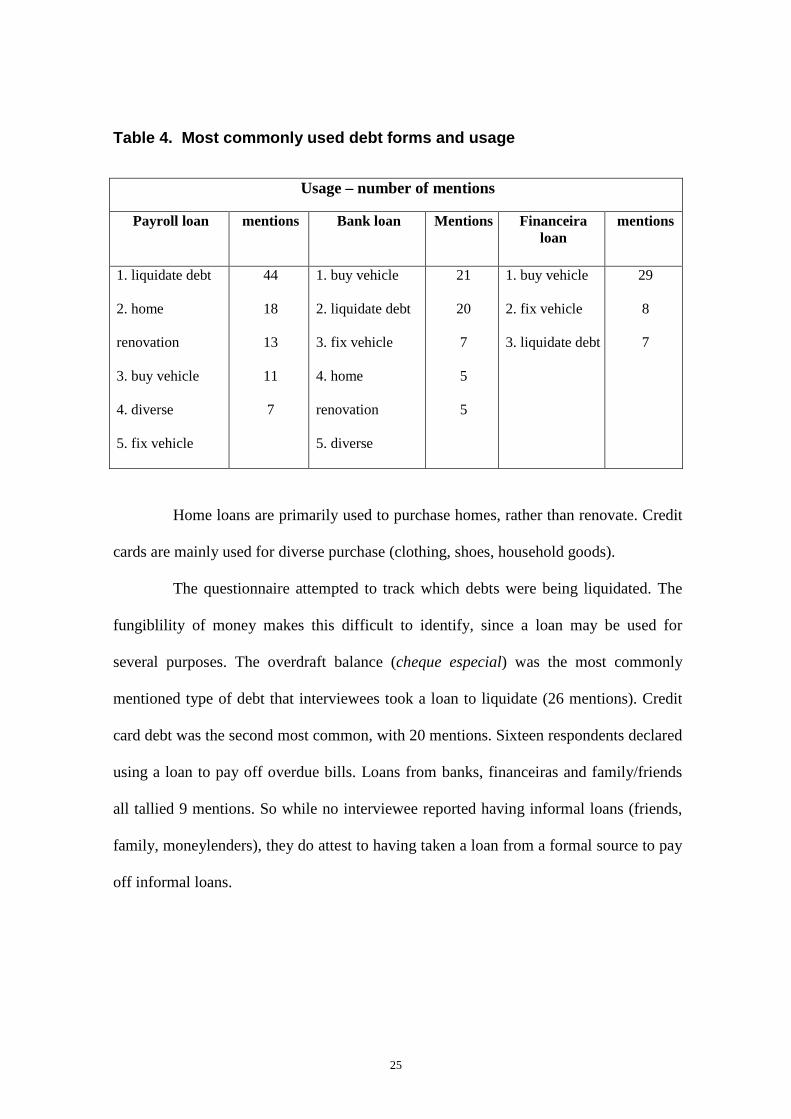
The most commonly used forms are payroll credit (110 mentions), bank loans
(68), loans from financeiras (44), home loans (28), credit cards (22). Interestingly, the
primary use29 of payroll, bank and financeira loans are all similar. Consistent with the
finding that vehicle-related expenditures and credit obligations weigh most heavily on
the monthly household budget, we see that credit is most often used to liquidate debts
and buy or repair a vehicle.
29 We refer to primary use, since it is rare that a loan will be used for one distinct purpose.
No debt 31%
1 debt 47%
2 debts 17%
4 debts
0,7% 5 debts
0,3% 3 debts
4%
25
Table 4. Most commonly used debt forms and usage
Usage – number of mentions
Payroll loan mentions Bank loan Mentions Financeira loan
mentions
1. liquidate debt
2. home
renovation
3. buy vehicle
4. diverse
5. fix vehicle
44
18
13
11
7
1. buy vehicle
2. liquidate debt
3. fix vehicle
4. home
renovation
5. diverse
21
20
7
5
5
1. buy vehicle
2. fix vehicle
3. liquidate debt
29
8
7
Home loans are primarily used to purchase homes, rather than renovate. Credit
cards are mainly used for diverse purchase (clothing, shoes, household goods).
The questionnaire attempted to track which debts were being liquidated. The
fungiblility of money makes this difficult to identify, since a loan may be used for
several purposes. The overdraft balance (cheque especial) was the most commonly
mentioned type of debt that interviewees took a loan to liquidate (26 mentions). Credit
card debt was the second most common, with 20 mentions. Sixteen respondents declared
using a loan to pay off overdue bills. Loans from banks, financeiras and family/friends
all tallied 9 mentions. So while no interviewee reported having informal loans (friends,
family, moneylenders), they do attest to having taken a loan from a formal source to pay
off informal loans.

26
Table 5. Which debts are liquidated?
The majority of respondents reported being up-to-date with installments. Only
31 cases (21%) reported being late (mainly due to uncontrolled spending or
insufficient/drop in income) and of these, 20 have been blacklisted with nome sujo due
this late repayment situation.
Seventeen percent of the sample reported being late on some bill. The
telephone bill received the most mentions (19), followed by electricity bill (13) and
vehicle-related taxes/fines (12). Again this finding is consistent with interviewee’s
perceptions that vehicle-related expenditures and utility bills are among the three items
(along with credit obligations) that weigh most heavily on the monthly budget.
Of the 17% respondents who are behind on payments, 10.7% are in the
slightly-indebted category, 5.7% are at risk of over-indebtedness and 1% are over-
indebted. This makes sense if we look at the average value of late payments, which is
relatively low: R$506 for the entire sample. Most late telephone bills are less than
R$500, while most late electricity bills are less than R$100. Vehicle-related late
Used loan to pay off…
Overdraft 26
Credit card debt 20
Other Bills 16
Bank loan 9
Financeira loan 9
Loan from friends/family 9

27
payments average about R$600. Only 15% of those behind on payments report having
tried to negotiate late payments. The majority have not tried because they do feel they
would not be able to pay anyway.
Financial planning
When asked who manages finances in the household, 44.7% replied the man
does. Only 19.3% of respondents reported the woman was in charge of finances, while
36% attested to managing money as a couple.
Table 6. Household financial management
Man 134 44.7%
Woman 58 19.3%
Together 108 36.0%
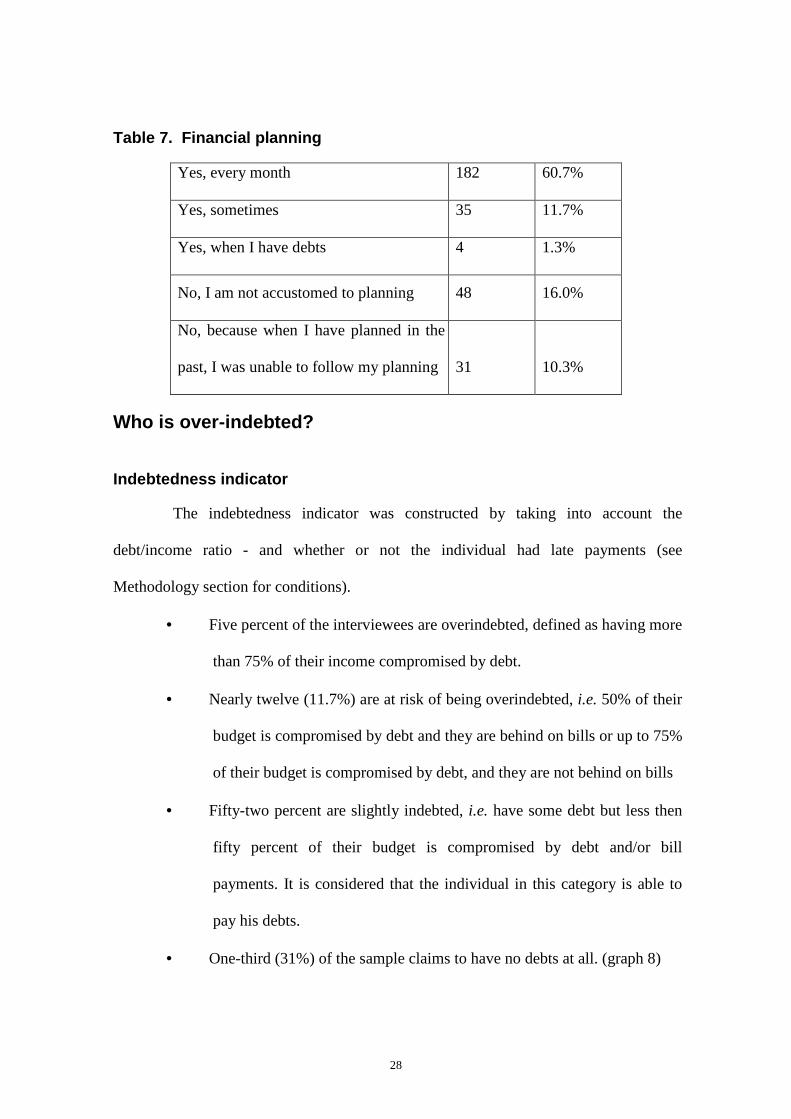
Seventy three percent of respondents report doing some sort of financial
planning. Sixty percent of these plan do it every month. Only one-quarter of
interviewees do not do budget planning, either because they are not accustomed to
(16%) or they don’t manage to stick to it when they do (10%).
28
Table 7. Financial planning
Yes, every month 182 60.7%
Yes, sometimes 35 11.7%
Yes, when I have debts 4 1.3%
No, I am not accustomed to planning 48 16.0%
No, because when I have planned in the
past, I was unable to follow my planning 31 10.3%
Who is over-indebted?
Indebtedness indicator
The indebtedness indicator was constructed by taking into account the
debt/income ratio - and whether or not the individual had late payments (see
Methodology section for conditions).
• Five percent of the interviewees are overindebted, defined as having more
than 75% of their income compromised by debt.
• Nearly twelve (11.7%) are at risk of being overindebted, i.e. 50% of their
budget is compromised by debt and they are behind on bills or up to 75%
of their budget is compromised by debt, and they are not behind on bills
• Fifty-two percent are slightly indebted, i.e. have some debt but less then
fifty percent of their budget is compromised by debt and/or bill
payments. It is considered that the individual in this category is able to
pay his debts.
• One-third (31%) of the sample claims to have no debts at all. (graph 8)

29
Graph 8. Indebtedness indicator
Without debt31%
Slightly indebted52%
At Risk12%
Over-indebted5%
It should be noted that the definition of indebtedness used in this study is
particularly rigorous. Most banks consider debt should not surpass 30% of individual
income. Having more than 75% of household income compromise by debt reflects a
situation of extreme financial stress with no perspectives of resolution. The at-risk
category also represents a dramatic situation, although the at-risk interviewee has a bit
more room to maneuver. Even the slightly indebted category, which uses a 50% cut-off
rather than 30%, reflects a situation that is currently controlled, but is vulnerable to
shocks.
The overwhelming majority of being at-risk of over-indebtedness point to
uncontrolled spending, insufficient income or a drop in income as the main causes. No
interviewee mentioned job loss or having experienced an unexpected shock that
suddenly put them in a dramatic situation. Rather, it seems that financial pressure builds
gradually.

30
While about 17% of respondents could use financial orientation urgently,
overall these finding indicate that the indebtedness scenario is relatively positive, and
quite different from the POF. This is probably due to the fact that the workers
interviewed have stable jobs, “protected,” in a sense, by the Union’s strength. This
stability permits them to financially plan with more assurance than families who rely on
itinerant jobs or entrepreneurial activities.
Bad Credit Record
The findings show that having a bad credit record is not necessarily associated
with being at-risk or over-indebted. While some 15% (44) of all respondents currently
have a bad credit record (nome sujo), the majority (61%) fall under the slightly indebted
category and 15% (6) of these fall under the no-debt category! Further investigation into
these cases found that at least 3 of these cases resulted from “lending their name”, either
by making a purchase for a third party in their name or lending a check; in these cases,
the interviewee esteems that “name-borrower” is the true defaulter, and thus claims to
have no debts outstanding.30
Bad credit record currently?
Yes 44 14.7%
No 256 85.3%
Of the other thirty-eight other respondents currently with nome sujo, 20 are due
to credit debt (7 from bank or financeira loans; 9 from credit cards; 2 from store or
supermarket cards; 2 from going over the limit of their overdraft facility). While the
30 This information was not registered in the questionnaire but verified with the interviewees by telephone after the
survey was completed. Because not all interviewees were not reached by telephone, it is impossible to determine whether there are more cases like this.
31
survey does not permit confirmation, it is likely that the remaining 18 cases are due to
overdue bill payments.
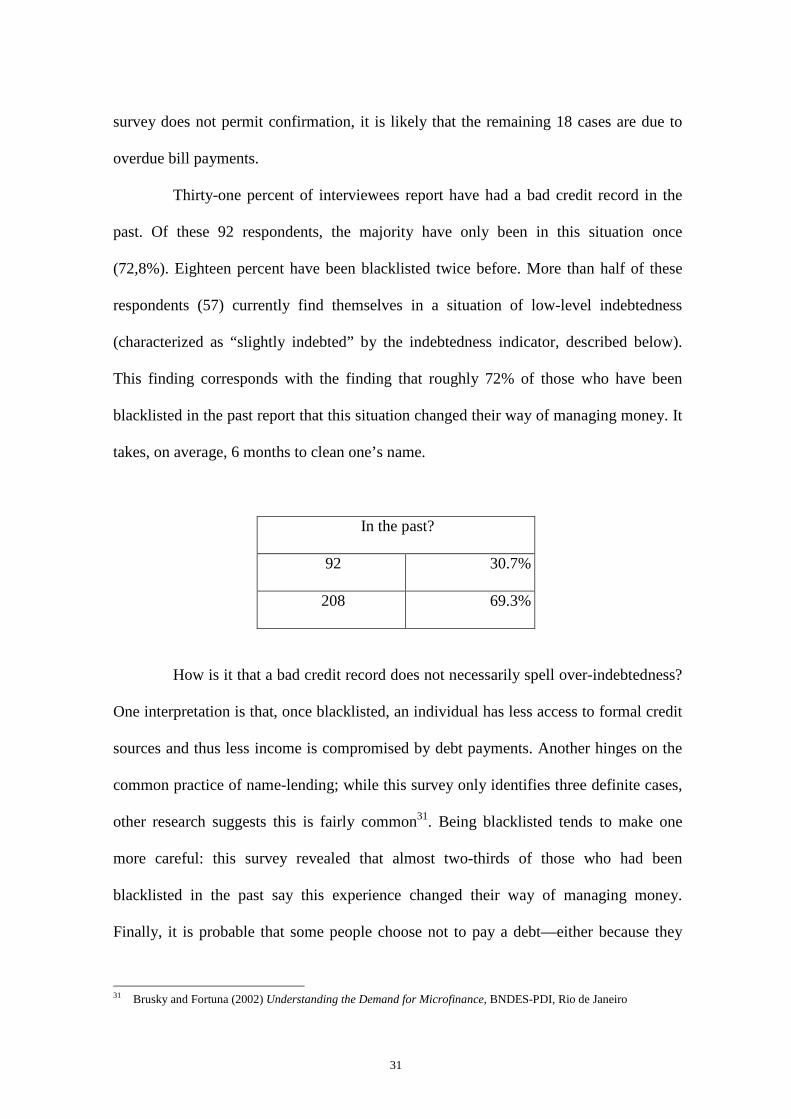
Thirty-one percent of interviewees report have had a bad credit record in the
past. Of these 92 respondents, the majority have only been in this situation once
(72,8%). Eighteen percent have been blacklisted twice before. More than half of these
respondents (57) currently find themselves in a situation of low-level indebtedness
(characterized as “slightly indebted” by the indebtedness indicator, described below).
This finding corresponds with the finding that roughly 72% of those who have been
blacklisted in the past report that this situation changed their way of managing money. It
takes, on average, 6 months to clean one’s name.
In the past?
92 30.7%
208 69.3%
How is it that a bad credit record does not necessarily spell over-indebtedness?
One interpretation is that, once blacklisted, an individual has less access to formal credit
sources and thus less income is compromised by debt payments. Another hinges on the
common practice of name-lending; while this survey only identifies three definite cases,
other research suggests this is fairly common31. Being blacklisted tends to make one
more careful: this survey revealed that almost two-thirds of those who had been
blacklisted in the past say this experience changed their way of managing money.
Finally, it is probable that some people choose not to pay a debt—either because they
31 Brusky and Fortuna (2002) Understanding the Demand for Microfinance, BNDES-PDI, Rio de Janeiro

32
intend to contest the payment (i.e. a mobile phone bill that is deemed incorrect) or they
consider it simply unfair (i.e. credit card debt that snowballs due to high interest rates)32.
This is considered “active indebtedness”, since the individual puts him or herself in the
situation willingly. Passive indebtedness refers to a situation in which the individual has
no control, due to unforeseen circumstances33.
In any event, this finding is noteworthy for financial lenders, since it suggests
that having bad credit does not necessarily equate bad risk. It does not suggest that being
blacklisted in credit bureaus like SPC or SERASA should be disregarded when assessing
credit risk, but that an explanation is worthwhile.
Characterizing the extremes – answer tree results
In order to determine whether there exists a statistically-relevant profile of (i)
the individuals categorized as having no debt and (ii) those with excessive debt, a
classification and regression analysis was conducted. Because the number of instances of
over-indebted was small, the at-risk and over-indebted categories were lumped together
for the regression analysis.
The only variables that were statistically correlated with excessive debt were
(1) the regular use of credit;
(2) the constant use of overdraft.
(3) home ownership
The population as a whole, we find 31% with no debt, 52,3% slightly indebted
and 16,7% at risk or overindebted. However, in looking at the distribution of answers to
the question “are you in the habit of taking loans?”, we find only 6% of the without debt
32 Both of these examples were revealed to the authors in previous qualitative research on the financial lives of low-
income people. 33 Observatório do Endividamento dos Consumidores (2002), Endividamento e Sobre-endividamento das famílias:
conceitos e estatísticas para sua avaliação, University of Coimbra, Portugual.

33
category responded “all the time”, “frequently”, or “sometimes”, while this figure is
63% for the slightly indebted and 30% for the at-risk and overindebted. That is, at-risk
and overindebted respondents are twice as likely to take loans as their less-indebted
counterparts.
With regards to use of overdraft facility, the correlation is even stronger. While
0% of those without debt and 48% of the slightly-indebted always use overdraft, 52% of
the at-risk and overindebted respondents affirm they are constantly using their overdraft
limit. These categories are nearly three times as likely to use overdraft as their less-
indebted counterparts.
At the same time, occasional use of overdraft is not necessarily associated with
indebtedness. Some 71% of the slightly indebted report using overdraft “sometimes”.
The risk, it would appear, lies in frequency of usage.
With regard to home ownership, we find a significant correlation between
being a homeowner and indebtedness, albeit slight. This rather counter-intuitive finding
can be explained by the relative level of economic comfort many homeowners feel they
have, as they do not have to pay rent. Because home loan installments are generally
equivalent to rent, it does not seem plausible that home owner have more financial stress
due to loan repayments than their renter counterparts. Rather, perhaps once the
homeowner has reached his objective of ownership, s/he feel free to spend money.

34
In the population as a whole
31% no debt
52.3% slightly indebted
16.7% at risk and overindebted
Frequent use of loans
6% no debt
63.2% slightly indebted
30.7% at risk and overindebted
Use of overdraft
0% no debt
48.1% slightly indebted
51.9% at risk and overindebted
Home owners:
34.3% no debt
51.4% slightly indebted
14.3% at risk and overindebted
V. Discussion of findings and Recommendations
This study sought to (1) assess levels of overindebtedness in the sample
population and (2) determine if there are any characteristics associated with people who
are over-indebted. This section will address these two research questions and discuss
some of the other findings that have important implications for a financial orientation
program.
1. Indebtedness is an immediate problem for 15% of the sample (classified
as at-risk of overindebtedness or over-indebted). Fifty-two of the sample appear to be in
a situation of controlled indebtedness. However, given that 43% of respondents find it
somewhat difficult to make ends meet at the end of the month and that 26% find it very
difficult, it seems safe to conclude that a relatively large portion of interviewees are
potential candidates for financial orientation efforts. Moreover, the target public for
35
education increases even more if we consider the 10% of respondents that fell under the
not at all or slightly indebted categories, but are blacklisted due to a bad credit record.
This finding implies that while a small portion of steelworkers could benefit
from debt consolidation and an overhaul of their financial management practices, a
much larger group could benefit from preventive orientation.
2. There is no correlation between socio-economic profiles and level of
indebtedness. This finding should be viewed cautiously, as a limited budget restricted
sample size and sampling methods. Furthermore, the workers interviewed came
disproportionately from large firms which may have implications in terms of personnel
management, training benefits, and in-house social programs—all which may give
workers comparative advantage over their small firm counterparts. Nonetheless, it
suggests that a financial orientation initiative could have a broad target group, and need
not be dependent on participants’ socio-economic profile.
While a larger survey would need to be conducted to determine whether or not
there socio-economic characteristics can be associated with indebtedness, it is possible
that this finding reflects reality. Given the complexity of spending behaviors, perhaps
indebtedness is more easily associated with a psychological profile.
3. Certain forms of financial use are correlated with high levels of
indebtedness. At-risk and over-indebted categories are much more likely to frequently
use loans and overdraft facilities than no-debt and slightly indebted groups. This implies
that a financial orientation initiative could serve to determine who are likely to be at
more risk of indebtedness. It also indicates that orientation efforts should specifically
address non-loan and non-overdraft alternatives to resolving financial stress.

36
4. Payroll credit is used to liquidate more expensive debts. One of the
questions underlying this research was, does increasingly popular payroll credit—
designed to offer a low-cost alternative to debt consolidation--contribute to the very
condition it is supposed to avoid? Although we can affirm that payroll credit is the most
commonly used form among the interviewees and it is most frequently used to liquidate
other debts, the data is not sufficient to tell us whether or not payroll credit is improving
or worsening the user’s debt situation. Most users in the survey are only one year into a
three year loan term. While they may have managed to reduce their financial stress by
paying off expensive debts, living with a salary reduced by 30% will, in the long run (i.e.
at the end of the term) may change the situation. Ideally, a longitudinal impact study
should be conducted to truly assess the effectiveness of payroll loans.34
The findings on payroll credit imply that payroll users are in potentially
precarious situations. They are currently living on 70% of their salary. Although debt-
servicing prior to taking the payroll loan may have been greater than 30% of monthly
income, the borrower probably had the option to not pay part of the debt (even if it did
mean accumulating more interest). With the payroll loan, the money is skimmed off at
the source, and the worker cannot negotiate a rescheduling of the debt repayment. While
initially this might feel manageable, living with 30% less wages over a three year period
may be too hard to swallow, leading to desire to contract more debt.
The assumption that payroll credit users would benefit from financial
orientation is probable. After all, they had enough debt to start with to drive them to
borrow more money to pay it off.
34 It would be important to investigate the impact of payroll credit on psychological stress as well as financial stress.
Considering that the liquidation of debts with “family and friends”, which we can safely assume to mean moneylenders (as it is unlikely that one would go into further debt to pay off a friend), it is possible that the ability to get rid of such a debt probably has a psychological impact.

37
5. Vehicles are a source of financial stress. One of the most common uses of
loans is to pay off vehicle-related costs. One of the most commonly cited sources of
budget imbalance is also vehicle related expenses. This interesting finding must be
couched in the study’s context. The survey population are steelworkers, many of whom
work in automobile manufacturing. They are, for the most part, “upper lower class” or
“lower middle class”, i.e. they can practically afford a car. These two factors might lead
to a greater proportion of car ownership (although not measured by the survey), than the
“average” non-steelworker, or than the solidly lower income earners who cannot even
consider buying a car. There is probably a greater likelihood, then, for the average
worker interviewed for this survey to stretch his budget to take a car loan, and without
considering the costs that come with ownership (tickets, taxes, gas, repairs, etc.).
A financial orientation initiative could focus on the pros and cons of purchasing
and owning vehicles, thus helping workers make a decision based on a realistic
calculation.
6. A bad credit record does not imply indebtedness. Respondents with
nome sujo are not necessarily over-indebted. Discussed in some detail above, this
finding has importance implications for lenders since it suggests that having bad credit
does not necessarily equate bad risk. It does not suggest that being blacklisted in credit
bureaus like SPC or SERASA should be disregarded when assessing credit risk, but that
an explanation is worthwhile.
To address what is an immediate problem for at least 17% of the union’s
workers and a looming threat for at least another 50%, it is recommended to develop a
group-based financial education program, using the human resources from the Union’s
training center.

38
Characteristics
The main characteristics of this program would be:
• Group-based. The intention is to promote an almost support-group type
atmosphere (rather than classroom atmosphere), in which participants
gain awareness that difficulties with money management and debt are
commonplace (to remove any stigma that may be associated with
indebtedness), while at the same time showing that it is possible to make
changes. The group meetings will focus on macro-level issues, so as not
to pressure participants into revealing too much personal information,
while at-home activities will encourage participant to relate knowledge to
their own situation.
• Historically-grounded. A generation of Brazilians were marked by the
scar of inflation, which many experts suggest has implications on their
money management skills. In addition, Brazil changed currencies eight
times in 25 years of which five occurred in an eight year period, prior to
the Plano Real in 1994. This has also impacted the population’s
relationship to money. Using a historical approach is important to pass the
message that debt problems are not necessarily the result of a deep
personal flaw; social constructed circumstances have helped shaped many
people’s financial management strategies.
• Family-oriented. Financial education experts attest that is common for
heads of household to refuse to engage in discussions that call into
question their financial management, even in the face of outright

39
indebtedness. The recommendation is to work though the family,
especially children, if any. Participants will be given activities to do at
home, with the objective of empowering the person leading the activity,
while at the same time engaging him or her in material that is also
relevant for his/her own financial behaviors. The objective is to avoid a
confrontational or moralistic approach so that the learner does not feel
belittled or attacked.
• Objective-oriented. Successful financial management hinges on
establishing and meeting objectives. This will be a fundamental theme
throughout the program.
Trainers
Financial education experts will be contracted to develop the program and
support materials. Rather than design a Training of Trainers companion program,
however, it is recommended to identify adult educators interested in the topic to be the
first participants (in a first round facilitated by the financial education experts). The
educators will effectively be trained through on personal experience. This first group
will be invited to provide extensive feedback to the program developers, in order to
refine the program before launching it among the workers. The first program rounds
taught by the adult educators will be closely monitored by the financial education
experts, in order to ensure quality control.
The Union currently has a well-organized training center where adult educators
offer technical courses and political training on union issues. This center could not only
serve as the infrastructure for the program, but also provide a pool of experienced adult
educators.

40
References and Sources
Bittencourt, G. Magalhães, R. and Abramovay, R. (2005) Informação de crédito: um um meio para ampliar o acesso dos mais pobres ao sistema financeiro. Revista Pesquisa e Debate, v. 16, p. 203-248.
Bittencourt, G. Microcrédito e Microfinanças no governo Lula. (2006). Presentation b special advisor to the Secretary of Economic Policies to the Ministry of Finance, May 2006 at the Central Bank Seminar on Microfinance, Recife.
Brusky and Fortuna (2002) Understanding the Demand for Microfinance, BNDES-PDI, Rio de Janeiro
Federação Brasileiro de Bancos (Febraban). (June 2005). “Operações de crédito do sistema financeiro.” Tehcnical note, taken from www.febraban.org.br 08/10/2006.
Nichter, Goldmark, and Fiori (2002). Understanding Microfinance in the Brazilian context,. BNDES-PDI, Rio de Janeiro.
Observatório do Endividamento dos Consumidores (2002), Endividamento e Sobre-endividamento das famílias: conceitos e estatísticas para sua avaliação, University of Coimbra, Portugual.
Reifner, et. al. (2002).Consumer Overindebtedness and Consumer Law in the European Union
Central Bank of Brazil (http://www.bcb.gov.br).
“Crédito consignada já soma 45% do crédito pessoal”, Folha Online, 05/12/2005.
“Crédito consignado em folha de pagamento”, internal document, PSDB, taken from the Internet 08/12/2005 at www.psdb.org.br/assessoria_tecnica/documentos/RJDF293-050718-CreditoConsignado.PDF
“Empréstimo pessoal é o crédito mais utilizado pelos brasileiros”, Diário de São Paulo (cited on website of Febraban, 06/2006)
“Pesquisa aponta aumenta de renda de tomador de crédito consignado”, Folha Online, 01/09/2005.
“Consumidores que “limpan o nome” são recorde”, Folha Online, 9/12/2005.
“Crédito ao consumidor cresce 340% na década eatinge R$138,4 bi”, Folha Online, 20/09/2005
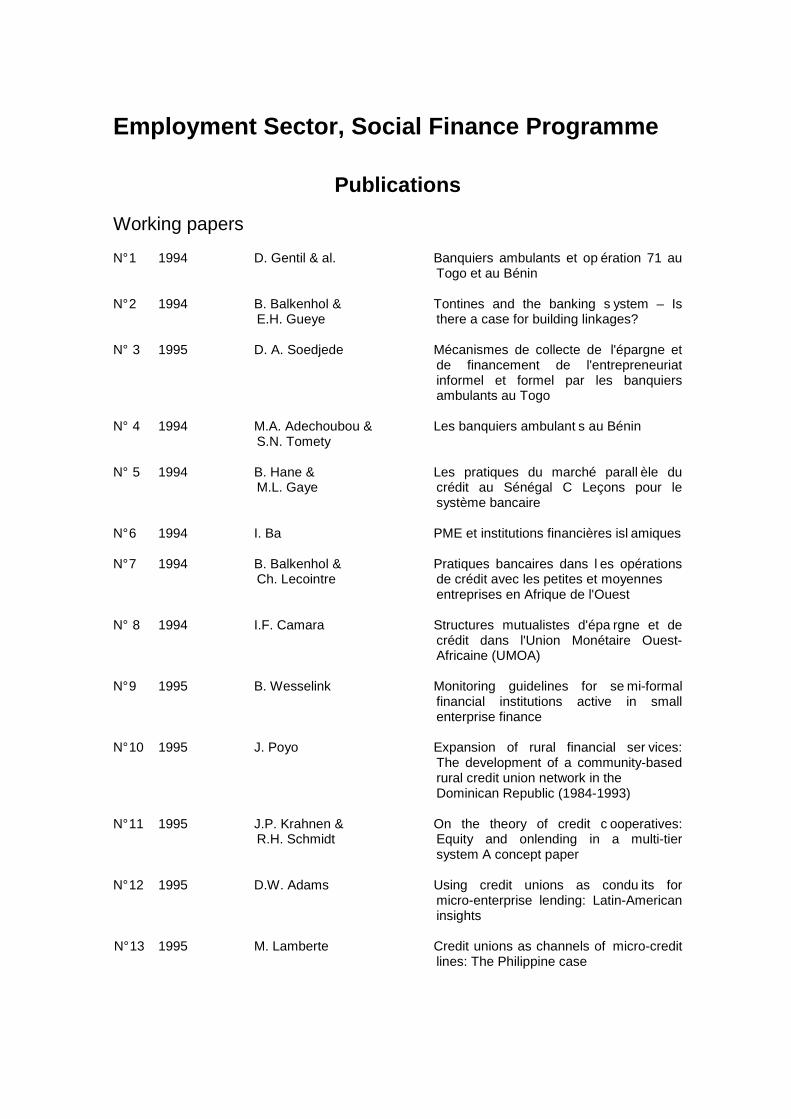
Employment Sector, Social Finance Programme
Publications
Working papers
N° 1 1994 D. Gentil & al. Banquiers ambulants et op ération 71 au Togo et au Bénin
N° 2 1994 B. Balkenhol & Tontines and the banking s ystem – Is E.H. Gueye there a case for building linkages? N° 3 1995 D. A. Soedjede Mécanismes de collecte de l'épargne et de financement de l'entrepreneuriat informel et formel par les banquiers ambulants au Togo N° 4 1994 M.A. Adechoubou & Les banquiers ambulant s au Bénin S.N. Tomety N° 5 1994 B. Hane & Les pratiques du marché parall èle du M.L. Gaye crédit au Sénégal C Leçons pour le système bancaire N° 6 1994 I. Ba PME et institutions financières isl amiques N° 7 1994 B. Balkenhol & Pratiques bancaires dans l es opérations Ch. Lecointre de crédit avec les petites et moyennes entreprises en Afrique de l'Ouest N° 8 1994 I.F. Camara Structures mutualistes d'épa rgne et de crédit dans l'Union Monétaire Ouest- Africaine (UMOA) N° 9 1995 B. Wesselink Monitoring guidelines for se mi-formal financial institutions active in small enterprise finance N° 10 1995 J. Poyo Expansion of rural financial ser vices: The development of a community-based rural credit union network in the Dominican Republic (1984-1993) N° 11 1995 J.P. Krahnen & On the theory of credit c ooperatives: R.H. Schmidt Equity and onlending in a multi-tier system A concept paper N° 12 1995 D.W. Adams Using credit unions as condu its for
micro-enterprise lending: Latin-American insights
N° 13 1995 M. Lamberte Credit unions as channels of micro-credit lines: The Philippine case
N° 14 1995 K.J. Morris The effects of using credit unions as onlending agents for external lines of credit: The experience of the International Credit Union Movement N° 15 1996 R. T. Chua & Assessing the efficiency an d outreach of G. M. Llanto micro-finance schemes N° 16 1996 T. Sparreboom & Migrant worker remittan ces in Lesotho: P. Sparreboom-Burger A review of the Deferred Pay Scheme N° 17 1996 P. Sparreboom-Burger The performance of the Lesotho credit union movement: internal financing and external capital inflow N° 18 1997 M. Bastiaenen & Guarantee funds and NGOs : Promise P. van Rooij and pitfalls: A review of the key issues N° 19 1998 P. Mosley The use of control groups in i mpact assessments for microfinance N° 20 1998 International Labour Standards and Micro-finance: A Review N° 21 1999 S. Puri & Migrant Worker Remittances, Mi cro- T. Ritzema finance and the Informal Economy: Prospects and Issues N° 22 2000 J. Roth Informal Micro-finance Schemes: the case of funeral Insurance in South Africa N° 23 2000 L. Mayoux Micro-finance and the empowerm ent of
women -A review of key issues N° 24 2000 Institutional Assessment for NGOs and self-help Organisations Managing Guarantee schemes N° 25 2000 A. McDonagh Microfinance Strategies for HIV/AIDS
Mitigation And Prevention In Sub-saharan Africa
N° 26 2001 B. Balkenhol & Collateral, collateral la w and collateral H. Schütte substitutes
N° 27 2002 D. M. Gross Financial Intermediation: A contributing factor to Economic growth and employment N° 28 2002 L. Deelen & Equipment finance for small contractors K.O. Bonsu in public work programmes N° 29 2002 M. Aliber Microinsurance in Burkina Faso A. Ido N° 30 2002 E.S. Soriano A field study of microinsur ance in the E.A Barbin & Philippines C. Lomboy
N° 31 2002 L. Manje & The Demand for Risk-managing C. Churchill Financial services in low income Communities: Evidence from Zambia N° 32 2002 I. Guerin Microfinance et Autonomie fém inine N° 33 2003 M. Aliber South African Microinsurance Case- Study N° 34 2003 Ebony Consulting Int. Private Equity an d Capitalisation of SMEs in South Africa: Quo Vadis? N° 35 2003 Bankers’ Institute Property Rights and Collateral- How of Rural Development Gender makes a Difference N° 36 2003 F.L. Galassi How trustable are West Afr ican Mutual D.M. Gross Savings and Loan Institutions? An application of PASMEC Databank N° 37 2003 M.S. de Gobbi The Role of a Professiona l Association in Mutual Microfinance: The Case of Madagascar. N° 38 2003 T. Siddiqui Migrant Worker Remittances & Micro- C.R. Abrar finance in Bangladesh. N° 39 2003 S. Thieme Savings and Credit Associatio ns and Remittances: The Case of Far West Nepalese Labour Migrants in Delhi, India. N° 40 2003 C. Sander Etude sur le transfert d’arge nt des I. Barro émigres au Sénégal et les services de transfert en micro finance. N° 41 2006 C. Kreuz Microlending in Germany N° 42 2006 D. Cassimon Linking Debt Relief to Micr ofinance J. Vaessen - An Issues Paper N° 43 2006 G. Gloukoviezoff Surendettement des par ticuliers en France: Quels rôles pour les syndicats? N° 44 2006 Oliver J. Haas Overindebtedness in Germ any
N° 45 2007 Alberto Didoni The impact of liberalisa tion policies on
access to microfinance – the case of Peru
IFLIP Research Papers
00-1 Dec. 2000 D.M. Gross Research Management Guidelines 02-1 Sept.2002 J. Creedy Starting Research and Writing a Research Paper 01-2 Oct. 2001 K.B. Korsah Impact of Financial Sector Liberalisation E.K. Nyarko on Competition and Efficiency in the N.A. Tagoe Ghanaian Banking Industry

01-3 Nov. 2001 K.A. Ofei Retooling Credit Unions: the Case of Credit Union Association of Ghana 01-4 Nov. 2001 E.K. Ekumah Gender Access to Credit under Ghana's
T.T. Essel Financial Sector Reform: A case Study of two Rural Banks in the Central Region of Ghana
01-5 Nov. 2001 V.K. Bhasin Impact of Micro-Finance Enterprises on W. Akpalu the Efficiency of Micro-Enterprises in Cape Coast 02-6 Mar. 2002 F.A. Gockel Financial Intermediation for the Poor: S.K. Akoena Credit Demand by Micro, Small and Medium Scale Enterprises in Ghana B a Further Assignment for Financial Sector Policy 03-7 Mar. 2003 G. Chigumira Did Financial Sector Reform Result in N. Masiyandima Increased Savings and Lending for the SMEs and the Poor. 03-8 Apr. 2003 T. Ngwenya Linking SMEs to Sources of Credit: The N. Ndlovu Performance of Micro Finance Institutions in Zimbabwe 03-9 May 2003 L. Masuko The Determinants of Transactions Cost and D. Marufu Access to Credit by Small and Medium
Enterprises (SME) and the Poor in Zimbabwe.
03-10 Aug 2003 E. Amonoo The Impact of Interest Rates on Demand P.K.Acquah for Credit and Loan Repayment by the E.E Asmah poor and SMEs in Ghana. 03-11 Nov 2003 C. Diop Understanding Savings Mobilization by
C. Dorsner Mutual Savings and Loan Institutions in D.M. Gross WAEMU Countries
03-12 Dec. 2003 E.K. Ekumah Information is Power. The Problem with T.T. Essel Credit Accessibility in Rural Banks in Ghana. Cahiers de Recherche ELIFID
00-1 Dec. 2000 D.M. Gross Manuel de Gestion de la Recherche. 02-1 Dec. 2002 J. Creedy Entreprendre un travail de recherche et rédiger un papier de recherche.

00-2 Sep. 2001 A.N. Honlonkou Problématique de remboursement des D.H. Acclassato crédits dans les systèmes financiers
C.V.C. Quenum décentralisés et garantie de prêts aux petits opérateurs économiques au Bénin.
02-3 Sep. 2002 L. Hoton L’impact de la libéralisation et de la A. Soule me du secteur financier sur les pauvres et les petits opérateurs économiques au Bénin 03-4 Feb. 2003 R.E. Gbinlo Libéralisation financière et accès au Y.Y. Soglo crédit l'épargne des systèmes financiers décentralisés: le cas des femmes au Bénin 03-5 Nov. 2003 M. K. Z. Kodjo Le financement de l'agriculture béninoise
E.H. Abiassi dans un contexte de libéralisation: M.C. Allagbe Contribution de la Micro Finance.
03-6 Dec. 2003 G.A. Sossou La demande d’assurance vie dans un I.Y. Gbere environnement de libéralisation financière: Cas du Bénin. 04-7 Jan. 2004 A. Diaw Effets des différentes réformes du
I. Keita secteur financier sur les relations entre institutions bancaires et institutions non bancaires: Concurrence ou complémentarité ?
04-8 Jan. 2004 C. V.C. Quenum Libéralisation et financement du secteur C. B. Igue primaire par les banques et établissements financiers au Bénin